kevin vought select samples of water resource capability
TRANSCRIPT

Presented By:
Kevin Vought, P.E.
M.S. Civil (Environmental) Engineering
M.S. Nuclear Engineering
15 years experience with a variety of numerical modeling
applications, data processing, 2-D and 3-D visualization, and
programming.

Groundwater / Surface Water Groundwater / Surface Water
AssessmentAssessment
� Numerous sites investigated
� From Northern Canada to Peru; Death Valley to the
wetlands of Florida
o Investigations for water availability, environmental
restoration, mine dewatering and process supply

Groundwater / Surface Water Groundwater / Surface Water
AssessmentAssessment
� Types of investigations
� Contaminant transport and reactions
� Identification and quantification of complex geology
� Movement of saltwater / water quality changes
� Interaction between surface water and groundwater
� Flow through springs and rivers

33--Dimensional AnalysisDimensional Analysis
� 3-Dimensional Visualization
� Pre and Post Processing Tool
� Borehole Log Evaluation
� Interaction Between Units and Chemicals
� Volume Calculations
� Convey Information
� Used by Numerous Organizations and Companies
Worldwide

33--Dimensional AnalysisDimensional Analysis
• 3-Dimensional Visualization Screen Shots

33--Dimensional AnalysisDimensional Analysis
• 3-Dimensional Visualization Screen Shots

33--Dimensional AnalysisDimensional Analysis
• 3-Dimensional Visualization Screen Shots

33--Dimensional AnalysisDimensional Analysis
• 3-Dimensional Visualization Screen Shots

Groundwater ModelingGroundwater Modeling
• MODFLOW Modeling
– Developed MODFLOW Models for Numerous
Sites Throughout North America
o Locations Include Ontario, Canada; Florida;
New England; Michigan; Ohio; Pennsylvania
oAssisted in development of integrated surface
water / groundwater models in Central,
Southwest, and Southeastern Florida

Groundwater ModelingGroundwater Modeling
� MODPATH, MT3DMS, and SEAWAT
� MODPATH Simulations to Help Predict
3-D Flow of Water From Source Zones
o Particle Track Output Analyzed in 3D
Viewers
� MT3DMS to account for chemical
reactions and retardation
� SEAWAT for variable density

Integrated Surface Water / Integrated Surface Water /
Groundwater ModelingGroundwater Modeling
• Integrated Hydrologic Model (IHM)
– Dynamically links HSPF (watershed model)
with MODFLOW
– Attended training sessions for use of the model
– Received personal guidance and training from
one of the developers

Integrated Surface Water / Integrated Surface Water /
Groundwater ModelingGroundwater Modeling
• Integrated Hydrologic Model (IHM) cont.
– Reviewed detailed calibration report for the
Integrated Northern Tampa Bay (INTB) Model
o Run with the IHM
– Developed predictive scenarios in the INTB
o Analyzed Minimum Flows and Levels (MFLs)

Integrated Surface Water / Integrated Surface Water /
Groundwater ModelingGroundwater Modeling
• MIKE SHE
– Dynamically integrated surface water /
groundwater modeling system
– Oversight of calibration and predictive
scenarios for multiple projects

Broward County IWRMMPBroward County IWRMMP� Representative Integrated / Groundwater Project
� Project Manager on this Integrated Water Resources
Management Master Plan
� $1 million project
� Two Primary Tasks
� Integrated simulation of canals and Biscayne Aquifer
with MIKE SHE
� Simulation of Floridan Aquifer with SEAWAT

IWRMMP IWRMMP –– Surficial / IntegratedSurficial / Integrated• Over 200 miles of
canals and waterways
– Dozens of control structures
• MIKE SHE
dynamically linked
these bodies, wetlands,
and the Biscayne
Aquifer
– Enabled evaluation of
impacts from pumping,
canal level settings, etc. as
part of this investigation

IWRMMP IWRMMP -- FloridanFloridan
• I modified existing
SEAWAT model
• Extent based on maximum
projected drawdown
• Grid refined in urban area
of Broward County
• Additional layer added to
UFARefined Model Extent

IWRMMP IWRMMP -- FloridanFloridan
• 14 layers from ground
surface to the Boulder
Zone
– Aquifers simulated are
UFA, APPZ, and LFA
– Biscayne Aquifer and
Boulder Zone represented
with Constant Heads
Simulated Upper Floridan Water Elevation

IWRMMP IWRMMP -- FloridanFloridan
• I recalibrated the model to better
calibration statistics than the original
• I developed and ran several predictive
scenarios
− Simulated through 2035
− Evaluated potentiometric surface and TDS
− Injection wells evaluated

IWRMMP IWRMMP -- FloridanFloridan
• Well locations
− Various
combinations used
in scenarios
− Regional and/or
injection wells not
used in every
scenario

IWRMMP IWRMMP -- FloridanFloridan
• Broward County production rates
− 80 MGD in 2025
− 103 MGD in 2035
• Broward County injection rates
− 52.75 MGD from 2025 through 2035

• Representative predictive simulations:
pumping at individual utility wellfields
− With and without injection
− Pumping at individual wellfields until 2025
• Additional pumping in regional wellfields after
2025
IWRMMPIWRMMP -- FloridanFloridan

• Simulated 2035 Drawdown Without Injection
IWRMMP IWRMMP -- FloridanFloridan

• Simulated 2035 Drawdown With Injection
IWRMMP IWRMMP -- FloridanFloridan

• Key benefits of injection:
− 2035 drawdown decreases relative to no
injection:
• 14 feet at BCWWS N
• 30 feet at Hollywood
• 20 feet at Davie
IWRMMP IWRMMP -- FloridanFloridan

• Simulated 2035 Concentration Change Without Injection
IWRMMP IWRMMP -- FloridanFloridan

• Simulated 2035 Concentration Change With Injection
IWRMMP IWRMMP -- FloridanFloridan

• Key benefits of injection:
− 2035 concentration decreases relative to no
injection:
• 2,200 mg/L at BCWWS N
• 530 mg/L at Hollywood
• 270 mg/L at Davie
IWRMMP IWRMMP -- FloridanFloridan

Coastal ModelingCoastal Modeling
� Background and Setting
� Bay Joe Wise Headland
� Approximately 50 miles southeast of New Orleans
� Project area extends from Pass Chaland to Grand Bayou Pass
� 3 miles of gulf front shoreline
� Berm elevations generally +3 to +4 feet NAVD
� Loss rate of over 73 acres per year since 1988
� Existing breaches along shoreline

Coastal ModelingCoastal Modeling
� Modeling I Conducted for this Investigation
� Circulation
� Borrow Area Wave Refraction
� Inlet Stability (Escoffier Curves)
� Cross Shore Sediment Transport

Coastal Engineering Consultants, Inc.
Current and Water Elevation Measurements

Circulation ModelingCirculation Modeling
� Model Description
� ADCIRC
� 2-Dimensional
� Finite Volume
� Parameters & Calibration
� Mesh design
� Node spacing
� Boundary conditions
� Bottom friction
� Bathymetric surface / Channel cross section

ADCIRC Mesh for Model Domain
Coastal Engineering Consultants, Inc.

ADCIRC Model Mesh Near Pass Chaland
Gulf of Mexico
Bay J
oe W
ise
Pass Chaland
Bayo
u C
hala
nd
Bay Joe Wise West Inlet
*
*
*
Land Outline
* Current Meter
* Tide Gauge

ADCIRC Model Mesh Near Grand Bayou Pass
Land Outline
Bay Joe Wise
Gulf of Mexico
Basti
an
Bay
Bay Joe Wise East Inlet
Grand Bayou Pass
*
** Current Meter
*
* Tide Gauge

Water Elevation CalibrationCoastal Engineering Consultants, Inc.
0.000
0.500
1.000
1.500
2.000
2.500
3.000
0.000 0.500 1.000 1.500 2.000 2.500 3.000
Modeled Water Elevation (ft NAVD)
Measu
red
Wate
r E
levati
on
(ft
NA
VD
)
Gulf Data
Bay Data
Ideal Match
Gulf Data Trendline
Bay Data Trendline

Water Velocity CalibrationCoastal Engineering Consultants, Inc.
-3
-2
-1
0
1
2
3
-3 -2 -1 0 1 2 3
Modeled Water Velocity (ft/s)
Measu
red
Wate
r V
elo
cit
y (
ft/s
)
Grand Bayou Pass Data
Pass Chaland Data
Bay Joe Wise East Data
Bay Joe Wise West Data
Ideal Match
Grand Bayou Pass Trendline
Pass Chaland Trendline
BJWE Trendline
BJWW Trendline

Modeled Water Elevation(feet NAVD)
2.75
2.00
0.50
0.75
1.00
1.25
1.50
1.75
2.25
2.50
3.6
0.0
1.0
2.0
3.0
Modeled Water Velocity(feet per second)
Direction of Flow
45 Hours

Modeled Water Elevation(feet NAVD)
2.75
2.00
0.50
0.75
1.00
1.25
1.50
1.75
2.25
2.50
3.6
0.0
1.0
2.0
3.0
Modeled Water Velocity(feet per second)
Direction of Flow
53 Hours

Modeled Water Elevation(feet NAVD)
2.75
2.00
0.50
0.75
1.00
1.25
1.50
1.75
2.25
2.50
3.6
0.0
1.0
2.0
3.0
Modeled Water Velocity(feet per second)
Direction of Flow
58 Hours

Bathymetric Surface
(ft NAVD)
Existing Bathymetry
10
.0
6.0
2.0
-2.0
-6.0
-10
.0-1
4.0
-18
.0-2
2.0
-26
.0
-30
.0
Coastal Engineering Consultants, Inc.

Bathymetric Surface
(ft NAVD)
10
.06
.0 2.0
-2.0
-6.0
-10
.0-1
4.0
-18
.0
-22
.0-2
6.0
-30
.0
Proposed Bathymetry: Alternatives
2 through 4Coastal Engineering Consultants, Inc.

Bathymetric Surface
(ft NAVD)
10
.06
.0 2.0
-2.0
-6.0
-10
.0-1
4.0
-18
.0
-22
.0-2
6.0
-30
.0
Proposed Bathymetry: Alternative 5 Coastal Engineering Consultants, Inc.

Influence of Alternatives 2 through 4 on Water Velocities
Velocity Vectors
4.53 ft/s0.0 ft/s
Pass Chaland Flow Patterns
-0.2
-0.3
-0.4
-0.5
0.5
0.3
0.2
0.1
0.0
-0.1
0.4
Original Land
Outline
Modified Land OutlineNote 1: The modified modeled water velocity through the original Bay Joe Wise West Inlet was compared to the
modeled velocity in the new inlet in the velocity comparison for Alternative 5.
Water Velocity Change (ft/s)
Influence of Alternative 5 on Water Velocities 1
Approximate Toe of Fill
Coastal Engineering Consultants, Inc.

Influence of Alternatives 2 through 4 on Water Velocities
Velocity Vectors
4.53 ft/s0.0 ft/s
Grand Bayou Pass Flow Patterns
0.2
0.3
0.4
0.5
0.6
-0.3
-0.2
-0.1
0.0
0.1
-0.4
Original Land
Outline
Modified Land Outline
Water Velocity Change (ft/s)
Influence of Alternative 5 on Water Velocities
Approximate Toe of Fill
Coastal Engineering Consultants, Inc.

� Calibration
� Velocities within 10ths of feet per second at peaks
� Water elevations within 10ths of feet at peaks
� Flow patterns match observations
� Alternatives Analysis
� All alternatives maintain present flow patterns
� Slight differences in magnitude of impacts on circulation from proposed alternative marsh designs
Circulation Results And Circulation Results And
ConclusionsConclusions

� Series of 3 evaporation ponds
� Designed to evaporate 50% of the scrubber effluent entering the ponds
� Prevent excessive precipitation formation
� Primary inputs
� Effluent flow rate
� Effluent concentrations
� Air temperature
� Precipitation rate
� Evaporation rate
Miami Smelter Expansion FSMiami Smelter Expansion FS
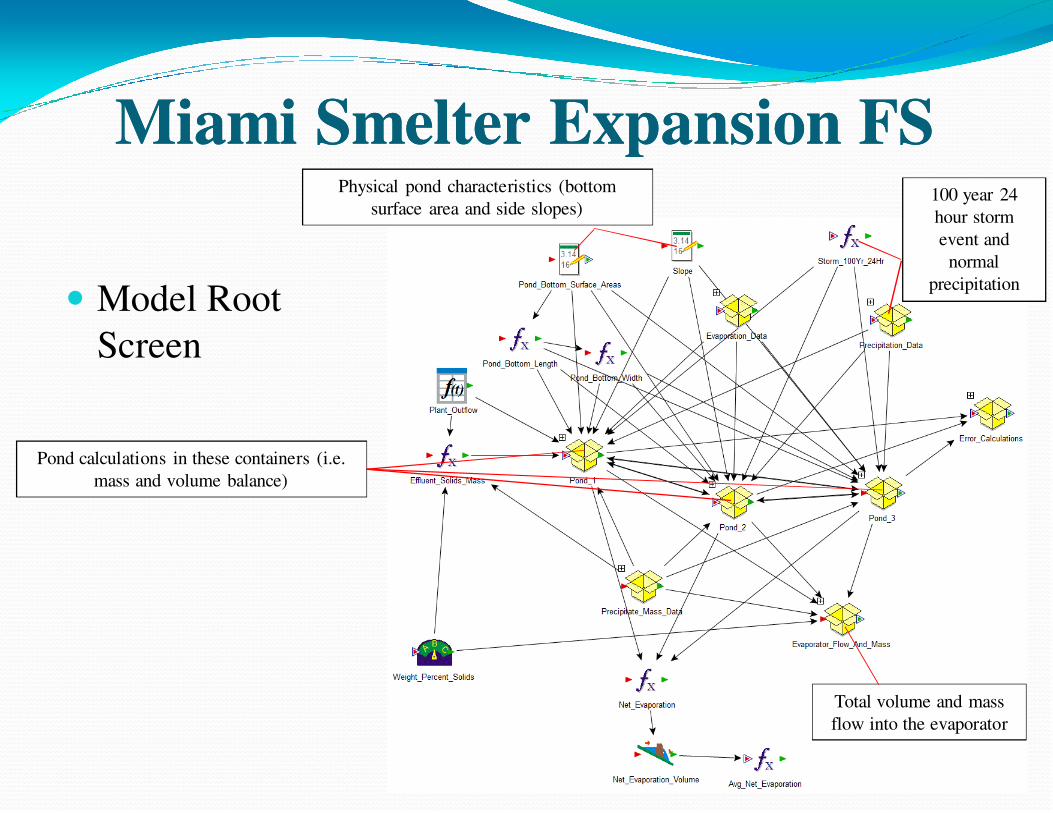
� Model Root
Screen
Pond calculations in these containers (i.e.
mass and volume balance)
Physical pond characteristics (bottom
surface area and side slopes)100 year 24
hour storm
event and
normal
precipitation
Total volume and mass
flow into the evaporator
Miami Smelter Expansion FSMiami Smelter Expansion FS

Miami Smelter Miami Smelter ExpansionExpansion FSFS
� Precipitation
Container
Stochastic Precipitation
Inputs

Miami Smelter Expansion FSMiami Smelter Expansion FSFunctions Inside “Pond 1” Container

Miami Smelter Expansion FSMiami Smelter Expansion FS
Modeled Concentration
Distribution on Next Slide
Dashboard Interaction that Allows Easy Model Set-
Up for the End User

Miami Smelter Expansion FSMiami Smelter Expansion FS
Date
Wei
ght
Per
cent
Total Dissolved Solids Concentration – Pond 3
Output Probability of Outcomes

Stormwater Modeling and Site Stormwater Modeling and Site
DesignDesign
• Site Redevelopment and New Site Design
– Properly Sized Retention Ponds
– Designed Drainage Ditch Routing and Sizes, Drop Structures, Piping Networks, Weirs, and Other Structures
– Utilized the Interconnected Channel and Pond Routing Model (ICPR)

Stormwater Modeling and Site Stormwater Modeling and Site
DesignDesign
Interconnected Channel and Pond Routing Model (ICPR) ©2002 Streamline Technologies, Inc.
25 Year Storm: Element Distribution For AdICPR Model - V103 November 2008
Nodes
A Stage/Area
V Stage/VolumeT Time/Stage
M Manhole
BasinsO Overland Flow
U SCS Unit CN
S SBUH CN
Y SCS Unit GAZ SBUH GA
Links
P PipeW Weir
C Channel
D Drop StructureB Bridge
R Rating Curve
H Breach
E PercolationF Filter
X Exfil Trench
A: 5010N
U: 5010
A:4592N
A:4591N
A:4590N
U:4590
M:4580N
U:4580
A: 4575N
U: 4575
A:4570N
U:4570
A:4570A_N
M:4565N
U:4565
M:4560N
U:4560
A:4550N
U:4550
A: 4546N
A:4545N
U:4545
A:4541N A: 4540N
U: 4540
A:4535N
U:4535
A:4530N
U:4530
A: 4521N
A: 4520N
U: 4520
M: 4516N
M: 4516A_N
A:4512N
U:4512
A:4512B_N
A:4511N
U:4511
A:4511A_N
A:4510N
U:4510
A:4000N
U:4000
T:40.5N
T:33.301N
A:3050N
U:3050
M:3040N
U:3040
A:3030N
U:3030
A:3020N
U:3020
A: 3010N
U: 3010
A: 3000N
U: 3000
A:5041N
U:5041
A:5041B_N
A:5041A_N
M: 5041_M
A: 5040N
U: 5040
A:5040C_N
M:5040B_M
M:5040A_M
A: 5036N
A: 5035N
U: 5035
A:5030N
U:5030
A: 5020N
U: 5020
P:4550P
P:4545P
C: 4545C
P: 4540P
C:4540C
P: 4535P
P: 4530P
P: 4521P
C: 4520C
P: 4516P
P:5040A_P
C:4512C
P:4512P
C: 4511_C
D:4511A_D
C:4510C
D:4000D
W:3050W
P:3040P
P: 3030PP:3020P
C:3010CD:3000D
C:5041C
P:5041P
D: 5041D
P:5041A_P
C: 5040A_C
C: 5040B_C
D:5040B_D
P: 5040PP: 5040B_P
P: 5035P
C:5035C
D: 5030D
P: 5020P
P: 5020P_OF
D: 5010D
P: 4590P
C:4591C
C:4590C
P:4580P
P:4575P
C:4570_C
P:4570P
P:4565P
P:4560P

Stormwater Modeling and Site Stormwater Modeling and Site
DesignDesign

ProgrammingProgramming
• Many Years Programming with a Variety of Tools
– FORTRAN
– AWK (Native UNIX Programming Language)
– Microsoft Macros (Excel and PowerPoint)
– Surfer Script Files
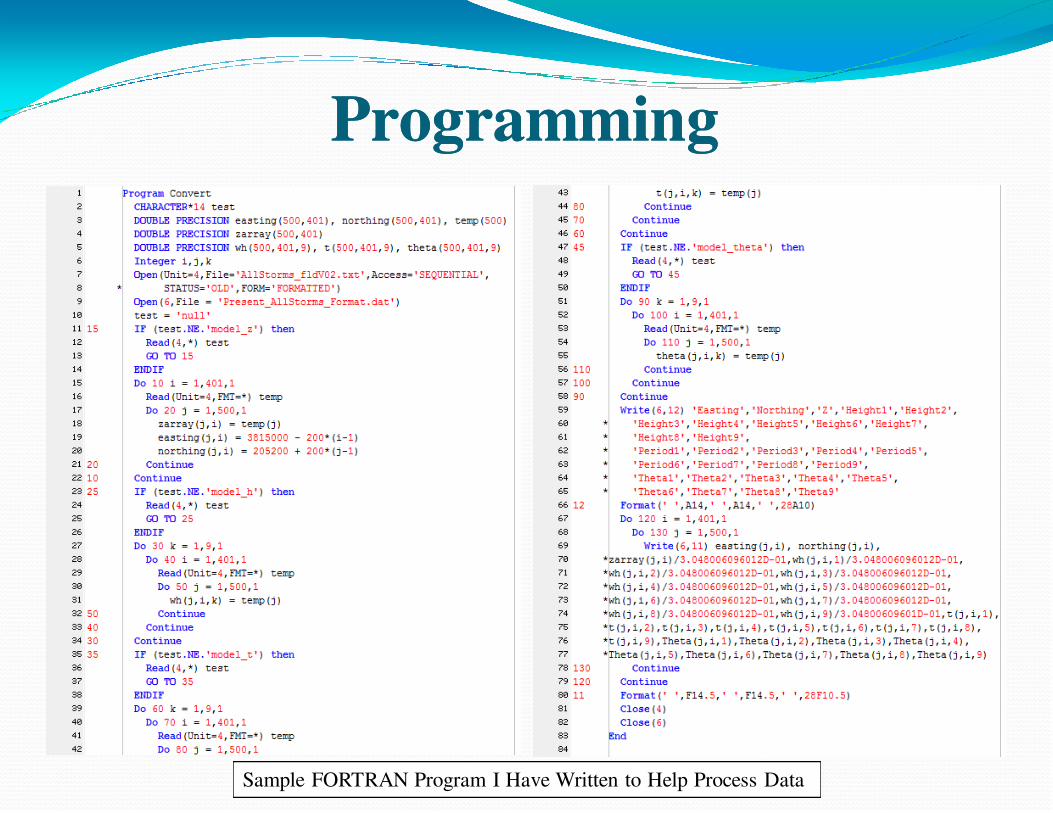
ProgrammingProgramming
Sample FORTRAN Program I Have Written to Help Process Data

Communication SkillsCommunication Skills
• Fixed Extremely Frayed Relationship with Lee County Management at DHI
• Repaired Strained Relationship with Broward County Management
• Maintained Good Relationships with Other Clients

SummarySummary
• Groundwater / Surface Water Modeling Capabilities
– Dewatering / Rerouting of Water
– Contaminant Transport
– Saltwater Intrusion
– Water Supply Availability / Optimization
– Surface Water / Wetland Impacts
• 3-Dimensional Visualization
– Representation of How Natural and Engineered Site Features Interact

SummarySummary
• GoldSim Modeling
– Stochastic Evaluations
• Hydrodynamic Modeling
– Coastal Tidally Driven Currents and Water Elevation Changes
• Stormwater Modeling
– ICPR
• Programming
– Several Applications
