kenya extractive industries development …bcckenya.org/assets/documents/keidp_lc launch...supply...
TRANSCRIPT

Kenya Extractive Industries Development Programme (KEIDP)
Local Content Gap Analysis
Dissemination Workshop September
2015
1

Table of Contents
Project Overview
Methodology
Market Update
Supply Chain Insights
Proposed Actions
4
6
9
3
27

Project Overview
Abundance of largely untapped natural resource wealth in Kenya
Attracted considerable investor attention:
Recent oil discoveries announced by Tullow Oil and Africa Oil
Significant investments in mining by Base Titanium
Potential robust mining sector following additional discoveries of mineral sands, rare earth deposits, coal, and other mineral deposits
DFID commissioned this early local content gap analysis for extractives sector in Kenya
Initial view of sectors where opportunities will probably lie, and provides a foundation for further analysis
Study aimed at understanding:
Potential demand for local goods, services and labor
Potential for supply from the Kenyan private sector
Gaps (constraints and challenges) that need to be addressed to optimize Local Content in country

METHODOLOGY
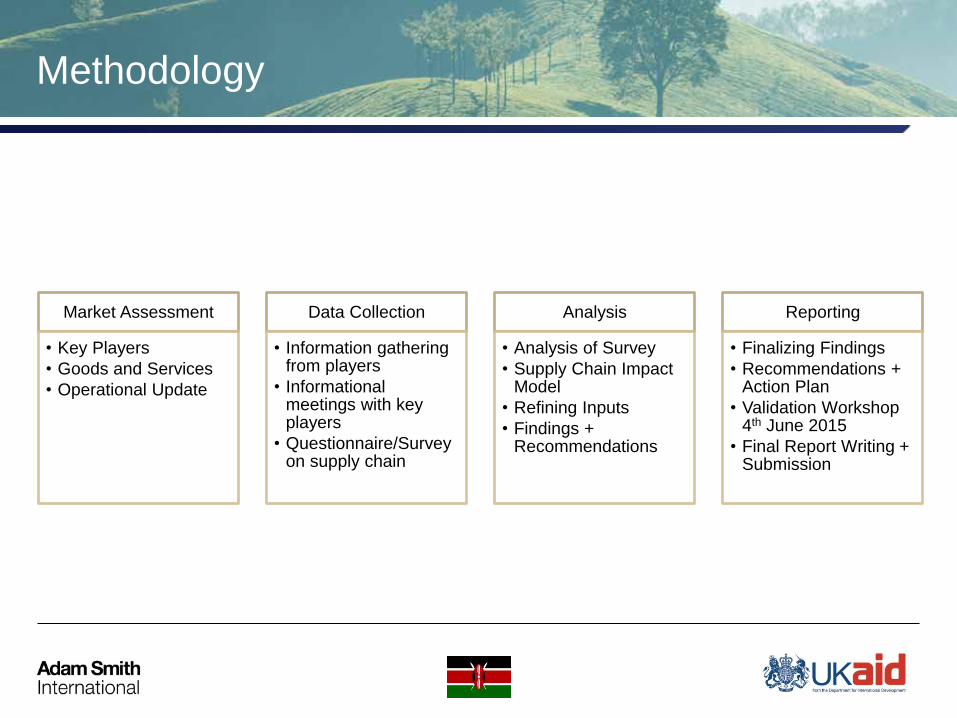
Methodology
Market Assessment
• Key Players
• Goods and Services
• Operational Update
Data Collection
• Information gathering from players
• Informational meetings with key players
• Questionnaire/Survey on supply chain
Analysis
• Analysis of Survey
• Supply Chain Impact Model
• Refining Inputs
• Findings + Recommendations
Reporting
• Finalizing Findings
• Recommendations + Action Plan
• Validation Workshop 4th June 2015
• Final Report Writing + Submission

MARKET UPDATE

Market Update – Mining Sector

Market Update – Oil and Gas Sector

SUPPLY CHAIN INSIGHTS

Mining Sector
Supply Chain – Goods and Services
Oil and Gas Sector

Indirect and Direct Services have the most appeal for local supplier development
Supply Chain – Survey Views

Goods and supplies most suitable for supplier development
Supply Chain – Survey Views

Supply Chain – Survey Views
Core technical services better for longer term supplier development

Perception of challenges to local sourcing of goods and services in country
Supply Chain – Survey Views

Supply Chain – Commercial Opportunities
Assumptions based on scenarios
Most operations are in early exploration
No scoping studies
No project plans or conceptual designs
No technical feasibility studies
Scenarios based on data from view of extractives sector development
Company projections
Analysts’ views
Interviews and survey data
Local content capture based on preliminary view of market performance as well as experience in other countries
Interviews and survey data
Oil and Gas Mining
Low High Low High
Exploration Estimated Budget USD 300M USD 700M USD 30M USD 100M
Estimated Local Content Capture ~ 20% ~ 20% ~ 25% ~ 25%
Construction Estimated Budget USD 400M USD 1B USD 200M USD 600M
Estimated Local Content Capture ~ 30% ~ 30% ~ 30% ~ 30%

Supply Chain – Commercial Opportunities
$ 5,700,000
$ 23,340,000 $ 30,960,000
Core Technical Direct Services Indirect Services 600,000
600,000
600,000
600,000
840,000
900,000
900,000
1,200,000
1,200,000
1,200,000
1,200,000
1,800,000
3,000,000
3,000,000
5,400,000
6,120,000
7,200,000
9,000,000
12,000,000
Drilling Equipment & Supplies
Civil Engineering and design services
Lifting services
Lubricants/Chemicals
Environmental services
Specialised Engineering Services
Hazarduous Waste Management
Seismic & interpretation
Goods (wholesale distribution, manufacture)
Construction raw material (cement, gravels, etc)
Site support consumables (food, water, office supplies stationery etc)
IT/communication services
Drilling & Well Services
Security Services
General and Site support services (catering,…
Vehicle fleet management and people transportation
Energy (fuel, electricity)
Supply Chain services (freight forwarding, transport etc)
Construction services (building, earthworks, civil works etc)
OIL AND GAS EXPLORATION PHASE
LOW CASE SCENARIO: USD 300M

Supply Chain – Commercial Opportunities
- 200 400 600 800 1,000 1,200 1,400
Skilled
Semi-Skilled
Unskilled
Oil and Gas Workforce Estimated No. of Jobs Created
OIL AND GAS EXPLORATION PHASE
LOW CASE SCENARIO: USD 300M
- 2,000 4,000 6,000 8,000 10,000 12,000 14,000 16,000
Direct
Indirect
Induced

Supply Chain – Commercial Opportunities
$ 30,600,000
$ 28,800,000
$ 120,600,000
Core Technical Direct Services Indirect Services 900,000 900,000 1,800,000 1,800,000 1,800,000 1,800,000 1,800,000 1,800,000 1,800,000 1,800,000 1,800,000 1,800,000 1,800,000 1,800,000
3,600,000 3,600,000 3,600,000 3,600,000 3,600,000 3,600,000 3,600,000 3,600,000
5,400,000 5,400,000 5,400,000 5,400,000
7,200,000 7,200,000 7,200,000
9,000,000 9,000,000
10,800,000 14,400,000
41,400,000
Health Services
Personnel services: Manpower
Laboratory Activities
Recovery Activities
Drilling (contracted services, spares, consumables,maintenance, tyre tracks)
Blasting (explosive, transports & services, site preparation)
Crushing & Grinding (consumables, repair & maintenance)
Demolition & Site Preparation
Goods (wholesale distribution, manufacture)
Professional services: Legal
Banking & Financial Services
Personnel services: training
Telecom and data systems
Site improvements, Gardening and landscaping
Earthworks, tunnelling, Piles & Caissons
Environmental Services
Light Vehicle Maintenance
Insurance services
Computer maintenance & System Servicing
Waste Management
Supply Chain Services (customs, warehousing, transports)
Security
Building & Facilities maintenance
Civil works construction and maintenance
Fleet Management (Car Truck Rental and other Vehicles)
Administrative Support
Load & Haul (contracted services, spares, consumables,maintenance)
Hospitality Services (including Camp Catering, food supplies, laundry ect..)
Electrical Equip (Installation, Repair, and Maintenance)
Equipment maintenance (generators, pumps, crushers etc…)
Heavy Vehicle Maintenance
Transport/Logistics in country
Management & Technical Maintenance Services (Engineering, planning, survey)
Energy services (Fuel, electricity)
MINING CONSTRUCTION PHASE
HIGH CASE SCENARIO: USD 600M

Supply Chain – Commercial Opportunities
- 1,000 2,000 3,000 4,000 5,000
Skilled
Semi-Skilled
Unskilled
- 10,000 20,000 30,000 40,000 50,000 60,000
Direct
Indirect
Induced
Mining Workforce Estimated No. of Jobs Created
MINING CONSTRUCTION PHASE
HIGH CASE SCENARIO: USD 600M

Supply Chain – Sector Priorities
Local content can be improved if we
focus on the procurement process
The supply chain model was developed
to capture demand side alongside
supply side behavior with reference to
procurement of services
Demand Side – Feasibility
Supply Side - Suitability
Prioritization matrix ranks the best areas
for local content development
Constrained Simple
Complex Constrained
Low
Low
High
High
FE
AS
IBIL
ITY
SUITABILITY
Supplier Development Matrix


Supply Chain – Sector Priorities
Simple -
Strengthen and Expand
Markets

Supply Chain – Sector Priorities
Constrained -
Form Partnerships
among Suppliers

Supply Chain – Sector Priorities
Constrained -
Maximize Commercial Advantage

Supply Chain – Sector Priorities
Complex -
Ensure Supply
Continuity

PROPOSED ACTIONS

Proposed Actions
Local Supplier
Development
Insight Studies

Insight Sector Studies
Focus
Detailed supplier mapping and data
Understanding sector dynamics
Shape dialogue on sector development
for EI
Rationalize
Services and Components
Required Inputs (information, funding, etc.)
Key Players and Roles
Outputs
Supplier Development
Strategy + Detailed Action Plan
Workforce Gap Analysis
Resource Evaluation (budget,
personnel, time frame, etc.)

Mozambique SME Linkage Development Program (Mozlink)
SME Development Centre Sharing Best
Practice Benchmarking
HOW
SMEELP
• BHP Mozal Construction Phase)
• 15 SMEs
• $ 5,000,000 contracts
PROGRAMS
2001 2003 2004 2006 2007
Program Goals:
Develop SME Competitiveness
Transfer knowledge and business
to Mozambique involving other
large companies
Mozlink Phase 1
• BHP Mozal Operations Phase
• 25 SMEs
• $15,000,000
Mozlink phase 2
• Inclusion of other Corporates
• 75 SMEs, $27,000,000 plus
• 2,041 Jobs Created
Knowledge Sharing Project Mozambique
Business Network Mozlink website
Supply Analysis New products and
services to be supplied locally

Mozambique SME Linkage Development Program (Mozlink)
Steering Committee: Corporates, CPI, IFC, other
donors
Program Management Unit
CPI (Investment Promotion Center)
Technical Mentors
(Corporate Partners and/or External consultants)
Business and Financial Course
Developers/Trainers
(External Consultants)
Business Mentors
(Corporate Partners and/or External Consultants)
Technical Advisors
(IFC, UNCTAD)

Supplier Development Program
Program Management
• Provided by entity through some selection process (tender, proposal development, etc.)
• Endorsed by government and industry chambers, associations, etc.
Products and Services
• Business development services
• Training and capacity building
• Access to finance and financial services
• Business matchmaking – for JVs, Consortium Bidding
• Access to tenders and bids
• Information sessions and reports
Funding
• Membership fees
• Contributions from extractives companies
• Funding from development partners
• Funding from government programs

Supplier Development Program
Delivery of services
Reporting to the Program Manager
Program execution/implementation
Reporting to Steering Committee
Monitor project execution
Provide approvals for noted activities as per governance guidelines
Steering Committee
Program Management Office
Consultants Other Third Parties
Technical
Advisory
Team

Supplier Development Program
Extractives Companies & Lead Contractors
• Local content strategy
• Lead supplier development management
• Co-financing/funding
• Local content training elements
Finance Institutions / Donors
• Co-financing/funding
• Finance instruments
• Local content training elements (through Technical Advisory Team)
• Technical qualification
Local Suppliers / Companies
• Co-financing/funding
• Performance contracts
• Uptake of supplier development services
Host Country/Government Institutions
• Co-financing/funding
• SME development
• Income generation & economic opportunities
Enterprise Development Center
Participation

Supplier Development Program
Supply side services
• Online supplier database
• Business matchmaking
• Supplier opportunity sharing
• Business development services
• Workforce development and recruitment
• Training and capacity building
Demand side services:
• Online supplier database
• Publishing of opportunities
• Contracting support
• Contracting strategies support
• Business matchmaking
• Training and capacity building

Discussions

THANK YOU