kent planning and zoning commissionessential to provide a framework for town planning. the state of...
TRANSCRIPT

KENT CONNECTICUT 2011 PLAN OF CONSERVATION AND DEVELOPMENT
STATE OF OUR TOWN
CONDITIONS AND TRENDS
June 2010
KENT PLANNING AND ZONING COMMISSION
Staff Wood Planning Associates, LLC
Jennifer Calhoun, Land Use Administrator

KentStateofTownFinal June 2010 P a g e | 2
TABLE OF CONTENTS Introduction and Overview ......................................................................................................................................................................... 3
Introduction ................................................................................................................................................................................................. 3
Overview ........................................................................................................................................................................................................ 4
Why We Plan ................................................................................................................................................................................................ 5
Demographics ................................................................................................................................................................................................... 6
Population Growth .................................................................................................................................................................................... 6
Population Projections ............................................................................................................................................................................ 7
Population Density .................................................................................................................................................................................... 9
School Enrollment .................................................................................................................................................................................. 10
Institutional and Seasonal Populations ......................................................................................................................................... 12
Housing ............................................................................................................................................................................................................. 13
Housing Data and Trends .................................................................................................................................................................... 13
Housing Diversity and Affordability ............................................................................................................................................... 15
Fiscal and Economic Conditions ............................................................................................................................................................ 19
Municipal Finances ................................................................................................................................................................................. 19
Employment .............................................................................................................................................................................................. 21
Economic Development ....................................................................................................................................................................... 23
Land Use and Resource Inventory ........................................................................................................................................................ 24
Overview ..................................................................................................................................................................................................... 24
Zoning........................................................................................................................................................................................................... 25
Municipal Facilities ...................................................................................................................................................................................... 33
Overview ..................................................................................................................................................................................................... 33
Sewer System ............................................................................................................................................................................................ 33
Streets and Traffic................................................................................................................................................................................... 33
Public Water System .............................................................................................................................................................................. 33
Next Steps ........................................................................................................................................................................................................ 35

KentStateofTownFinal June 2010 P a g e | 3
STATE OF OUR TOWN
INTRODUCTION AND OVERVIEW
INTRODUCTION
Connecticut General Statutes Section 8-23 requires that Connecticut municipalities “prepare or amend and … adopt” a Plan of Conservation and Development at least once every ten years. Kent last adopted a comprehensive Plan in 2001 and readopted it in 2004.
The Statutes provide a series of guidelines and requirements for the Plan of Conservation and Development, as summarized in Tables 1 and 2. Recent Statutory amendments provide for potential fiscal penalties, in the form of disqualification for discretionary State grant funding, to Towns without a current Plan.
The Kent Planning and Zoning Commission has undertaken the preparation of a new Plan of Conservation and Development not only to comply with statutory guidelines, but also to continue the Town’s forward thinking to manage growth and sustain the small town values that define Kent.
This State of Our Town Report represents the first step in the planning process, providing an update on demographic, housing, economic and fiscal, environmental, and other conditions and trends.
Table 1: Statutory Issues for Municipal Plans • Affordable Housing; Surface and Ground
Drinking Water Supplies; Development Patterns; Physical, Social, Economic and Governmental Conditions and Trends; Energy-efficiency; Agriculture.
• Physical and Economic Development; Public Accessways; Compact, Transit Accessible, Pedestrian-oriented Mixed Use Development Patterns; Proposed Land Uses; Desirable Density of Population; Housing Choice
• Ridgelines; Airports, Parks, Playgrounds and Other Public Grounds; Schools and Other Public Buildings; Public Utilities and Terminals; Public Housing Projects
• Implementation of the Plan: Schedule; Capital Budget; Enactment and Enforcement of Controls, Codes, and Safety Regulations; Implementation of Affordable Housing; Open Space and Greenways Protection and Development; Plans for Corridor Management Areas; Proposed Priority Funding Areas; and Any Other Recommendations

KENT: THE STATE OF OUR TOWN
KentStateofTownFinal June 2010 P a g e | 4
OVERVIEW
As detailed in this State of Our Town Report, Kent has undergone several changes over the past ten years. Like many Connecticut Towns, Kent faces continued pressure from residential development that can threaten the scenic, natural, historic and environmental resources that are highly valued by the community. At the same time, Kent supports a vibrant and economically important commercial village that provides the community with shopping, social, and cultural opportunities that are highly valued by residents and visitors.
Additionally, recent changes to the Statutes concerning municipal Plans will require consideration of “growth management principles” as summarized in Table 2. Several of these principles address issues of limited relevance to small communities such as Kent; however, the 2011 Plan will consider these principles and apply them where appropriate.
Finally, in the nearly ten years since the current Plan was adopted, the State and the Country have encountered new or renewed challenges that have implications for even small towns like Kent.
These and other developments clearly warrant a renewed look at the goals and objectives that will guide Kent’s future, as well as revisions and updates to the strategies and actions necessary to achieve those goals.
Kent has been diligent in preparing and updating plans for the Community dating to 1975 with revisions in 1989 and 2001. These Plans provide additional guidance for preparing the 2011 Plan.
Table 2: Statutory Growth Management Principles
• Redevelopment and Revitalization of Commercial Centers and Areas of Mixed Land Uses with Existing or Planned Physical Infrastructure
• Expansion of Housing Opportunities and Design Choices to Accommodate a Variety of Household Types and Needs
• Concentration of Development Around Transportation Nodes and Along Major Transportation Corridors to Support the Viability of Transportation Options and Land Reuse
• Conservation and Restoration of the Natural Environment, Cultural and Historical Resources and Existing Farmlands
• Protection of Environmental Assets Critical to Public Health and Safety
• Integration of Planning Across All Levels of Government to Address Issues on a Local, Regional and State-wide Basis
Pictures Source: Kent Visual Inventory

KENT: THE STATE OF OUR TOWN
KentStateofTownFinal June 2010 P a g e | 5
WHY WE PLAN
A Plan of Conservation and Development is an advisory document, intended to guide the Town’s responses to statutory mandates, land use controls, municipal investments, and other Town functions. At the same time, a Plan provides a community with an understanding of the assets and resources that establish its character and the quality of life that its residents embrace.
A current Plan is necessary for the evaluation of public improvements and the municipal purchase or disposal of property. The Planning and Zoning Commission must evaluate such proposals in the context of the Plan of Conservation and Development and issue a report endorsing or rejecting such action.
Similarly, proposed new or revised zoning regulations or districts must be reviewed by the Planning and Zoning Commission for consistency with a current Town Plan. Additionally, some grant programs also require proposals to conform to the local Plan.
A recent statutory change increases the importance of having a current Plan. Beginning in 2012, towns without a current Plan may not be eligible for discretionary State funding, such as Small Town Economic Assistance Program grants and Open Space Acquisition grants. This creates a powerful incentive for Towns to maintain a current Plan.
And finally, preparation of a Plan of Conservation and Development provides an opportunity for a community to reassess its overall goals, engage and inform the current residents, and reaffirm the community’s commitment to preserving and sustaining the Town’s defining qualities.

KENT: THE STATE OF OUR TOWN
KentStateofTownFinal June 2010 P a g e | 6
STATE OF OUR TOWN
DEMOGRAPHICS
Demographic conditions and trends, concerning numbers, age, distribution and other population characteristics, provide important guidance for issues that must be addressed by planning.
POPULATION GROWTH
Kent’s population has grown steadily since the 1950’s, following the post-war pattern experienced by many suburban areas of the country (see Table 3 and Charts 1 and 2, below). In 2000, Kent’s population was 2,858 residents in 1,143 households, for an average household size of 2.43 (US Census 2000).
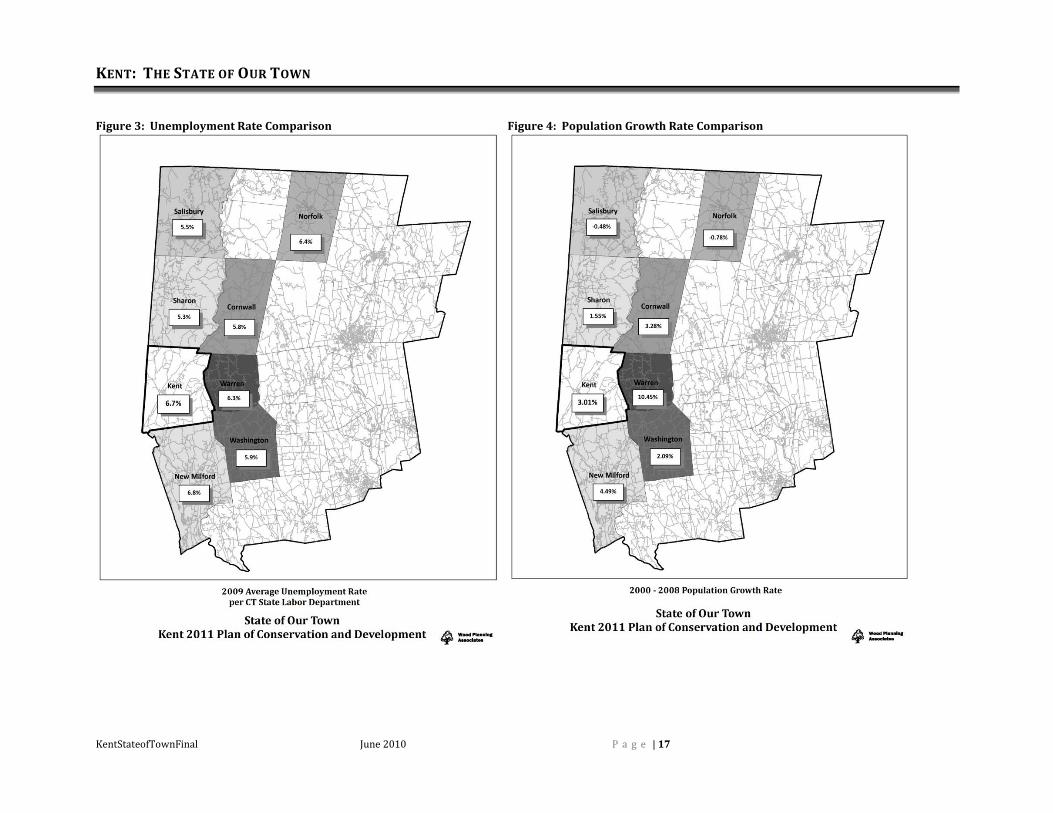
There are a variety of reasons for the continuation of this trend into the 1990’s and the 21st century in towns like Kent, not the least of which is the basic desire of homeowners to live in an attractive, conveniently located, and comfortable community. Other quality-of-life factors, such as schools, public safety, and cultural and recreational amenities also contribute to the popularity of small towns. Kent’s growth rate between 2000 and 2008 is compared to several area towns in Figure 4 (page 17).
Although Kent’s population has increased by nearly 20% (457 residents) since the 1980 census, the average annual growth rate has actually declined since the 1980s, as shown on Chart 2.
Table 3: Kent’s Growth Year Population Change by
Decade 1900 1220 1910 1122 - 8.03% 1920 1086 - 3.21% 1930 1054 - 2.95% 1940 1245 18.12% 1950 1392 11.81% 1960 1686 21.12% 1970 1990 18.03% 1980 2487 24.97% 1990 2918 17.33% 2000 2858 - 2.05% 2008 2944 3.01% Source: US Census; Connecticut DPH
Chart 1: Population Chart 2: Population Growth Rate
Source: US Census; Connecticut DPH Source: US Census; Connecticut DPH
1220 1122 1086 10541245
13921686
1990
2487
2918 2858 2944
0
500
1000
1500
2000
2500
3000
3500
1900 1920 1940 1960 1980 2000
Kent Population
-0.5%
0.0%
0.5%
1.0%
1.5%
2.0%
2.5%
3.0%
'70-'80 '80-'90 '90-'00 '00-08Decade
Kent - Population Growth RateAverage Annual Increase
Trendline
KENT: THE STATE OF OUR TOWN
KentStateofTownFinal June 2010 P a g e | 7
POPULATION PROJECTIONS
Population growth projections, while often somewhat speculative, are nonetheless essential to provide a framework for town planning. The State of Connecticut State Data Center at the University of Connecticut has recently published growth rate projections for Connecticut towns. Tables 4 and 5 and Charts 3 and 4 show Kent’s projected population and growth rates for 5-year increments through 2030. Kent’s population is projected to increase slightly over the next 25 years, although at a declining rate.
However, the projections from the Connecticut State Data Center appear to understate near term population growth for Kent: the projected 2010 population of 2,857 is well below the actual estimated 2007 population of 2,952 (Connecticut Department of Public Health – DPH). Therefore, these projections will be updated as available during the course of the Plan preparation.
As projected for most Connecticut communities, and the State as a whole, Kent is expected to see an increase in the number of residents 65 and older over the next 20 years. Also like many Connecticut towns, Kent may expect to lose 20 – 34 year olds over the next 25 years. Table 6 and Chart 5 illustrate these trends.
Table 7 and Chart 6 show the residency history of people living in Kent. Interestingly, over 50% of residents in 2000 moved into or within Kent over the previous 10 years.
Chart 7 compares Kent’s projected population growth rate with that of the State as a whole.
The population projection data presented here are taken from the Connecticut State Data Center (CSDC) 2010-2030 Population Projections, published in 2007. The CSDC description of the projections is provided below. Historic and current population data is from the US Census and the Connecticut Department of Public Health (CTDPH).
Population projection data source: Rodriguez, Orlando, 2007. Kent, CT Population Projection from 2010 to 2030 by Age, Ethnicity and Sex Distributions, Connecticut State Data Center, University of Connecticut, Storrs, Connecticut Historic and Actual population data source: US Census, Connecticut Department of Public Health From the introduction to CT Population Projection from 2010 to 2030 by Age, Ethnicity and Sex Distributions: “The calculations and assumptions that form the basis for these population projections are drawn from historical patterns of population change. Thus, these projections reveal how populations may evolve over the next twenty-five years - if these historical patterns continue to hold true. However, there is no guarantee that the projected trends will occur. A host of external influences, such as public policy initiatives at the state and federal levels or significant shifts in economic structure, may lead to new patterns of change in the population.”

KENT: THE STATE OF OUR TOWN
KentStateofTownFinal June 2010 P a g e | 8
Table 4: Kent Population Projections Year Population 2007* 2,952 2010 3,045 2015 3,213 2020 3,377 2025 3,484 2030 3,525
Table 5: Kent Growth Rate Projections Five Year Year Growth Rate 2000 - 2005 3.68% 2005 - 2010 5.72% 2010 - 2015 5.52% 2015 - 2020 5.11% 2020 - 2025 3.18% 2025 - 2030 1.18%
*Actual CTDPH Estimate
Table 6: Kent Historic and
Projected Age Distribution Age Group 1990 2000 2030 0-19 757 521 795 20-34 539 720 455 35-64 1185 842 1092 65+ 437 503 983
Table 7: Year of Residency Establishment Year Percent Number 1990 - 2000 53% 603 1980 - 1989 22% 246 1970 - 1979 10% 118 1969 or earlier 15% 176 Total 1143
Source: US Census 2000
Chart 3: Projected Population Chart 4: Project Population Growth Rate
Chart 5: Projected Age Composition Chart 6: Year Householder Moved
Sources: CSDC; US Census; CTDPH
2,778
3,525
0
500
1,000
1,500
2,000
2,500
3,000
3,500
4,000
2000 2005 2010 2015 2020 2025 2030
Kent - Projected Population
0.0%
1.0%
2.0%
3.0%
4.0%
5.0%
6.0%
7.0%
'00-'05 '05-'10 '10-'15 '15-'20 '20-'25 '25-30
Kent - Projected Population Growth Rate
Trendline
0-19
20-34
35-64
65+
0
500
1000
1500
2000
2500
3000
3500
1990 2000 2010 2020 2030
Tota
l Pop
ulat
ion
Year
Kent - Projected Age Composition
Projection 53%
22%
10%
15%
0%
10%
20%
30%
40%
50%
60%
1990 - 2000 1980 - 1989 1970 - 1979 1969 or earlier
Perc
ent o
f Tot
al H
ouse
hold
s
Year
Kent - Year Householder Moved Into Unit

KENT: THE STATE OF OUR TOWN
KentStateofTownFinal June 2010 P a g e | 9
Chart 7: Population Growth Rate and Projections
Source: Connecticut State Data Center
POPULATION DENSITY
As a rural community, Kent exhibits one of the lowest population densities in the State, ranking 162nd out of 169 Connecticut towns. Table 8 compares Kent’s population density to several other area towns.
Table 8: 2008 Population Density
Town Persons/ Sq.Mi.
2000-2008 Population Growth
New Milford 460 4.49% Norfolk 154 -0.78% Washington 96 1.70% Salisbury 69 -0.48%
Kent 61 3.01%
Warren 53 10.45% Sharon 51 1.55% Cornwall 32 3.28% Source: OPM Municipal Fiscal Indicators; Population Division, US Census
0.50%
0.22% 0.22%0.27% 0.26%
0.18%
0.76%
1.04% 1.05%
0.95%
0.60%
0.26%
0.0%
0.2%
0.4%
0.6%
0.8%
1.0%
1.2%
2000 to 2005 2005 to 2010 2010 to 2015 2015 to 2020 2020 to 2025 2025 to 2030
Chan
ge R
ate
Kent - Population Growth Rate and Projections2000 to 2030
Connecticut
Town

KENT: THE STATE OF OUR TOWN
KentStateofTownFinal June 2010 P a g e | 10
SCHOOL ENROLLMENT
Anticipating the need for education facilities and resources is an important component of long range municipal planning. Kent is part of the six-town Region 1 school district. K – 8 grade education is provided at the Kent Center School and grades 9 – 12 attend the Region 1 Housatonic Valley High School.
In addition to planning for school facility needs, municipal facility and fiscal planning considerations benefit from an understanding of anticipated student populations.
Recent trends and projections throughout Connecticut appear to indicate declining student-age populations in many towns. The current enrollment at the Kent Center School is 268 pupils (March 2010).
Enrollment projections for the Region 1 school system have been prepared for the administration by the New England School Development Council. Table 9 summarizes the historic and projected enrollments for the Kent Center School and the Housatonic Valley Regional High School. These data are illustrated on Chart 8. The full report of NESDEC should be consulted for additional details.
A typical concern about new housing development is the potential educational costs associated with new students. According to a recent study by the Rutgers University Center for Urban Policy Research (Residential Demographic Multipliers, Rutgers University, Center for Urban Policy Research 2006), in Connecticut the average number of school age children in a four bedroom detached single family dwelling is 1.07 and in a three bedroom unit it is 0.66.
Table 9: Region 1 School Population School Year Enrollment
Kent Center School
Housatonic Regional
School 1999-2000 332 558 2000-2001 318 559 2001-2002 322 565 2002-2003 310 586 2003-2004 297 596 2004-2005 291 610 2005-2006 264 626 2006-2007 255 561 2007-2008 246 556 2008-2009 270 557 2009-2010 268 509 2010-2011 263 511 2011-2012 264 477 2012-2013 260 444 2013-2014 261 453 2014-2015 260 442 2015-2016 254 451 2016-2017 251 451 2017-2018 238 441 2018-2019 231 459 2019-2020 233 453 Source: NESDEC Projections 2010

KENT: THE STATE OF OUR TOWN
KentStateofTownFinal June 2010 P a g e | 11
Chart 8: Region 1 Kent Center School Population
Source: NESDEC, Region 1 Schools 2010
Chart 9: Region 1 Housatonic Valley School Population
Source: NESDEC, Region 1 Schools 2010
220
240
260
280
300
320
340
1999-2000
2000-2001
2001-2002
2002-2003
2003-2004
2004-2005
2005-2006
2006-2007
2007-2008
2008-2009
2009-2010
2010-2011
2011-2012
2012-2013
2013-2014
2014-2015
2015-2016
2016-2017
2017-2018
2018-2019
2019-2020
Region 1 Kent Center School Enrollment
Historic Projected
400
450
500
550
600
650
1999-2000
2000-2001
2001-2002
2002-2003
2003-2004
2004-2005
2005-2006
2006-2007
2007-2008
2008-2009
2009-2010
2010-2011
2011-2012
2012-2013
2013-2014
2014-2015
2015-2016
2016-2017
2017-2018
2018-2019
2019-2020
Region 1 Housatonic Valley Regional School Enrollment
Historic Projected

KENT: THE STATE OF OUR TOWN
KentStateofTownFinal June 2010 P a g e | 12
INSTITUTIONAL AND SEASONAL POPULATIONS
The several private schools and private camps and institutions in Kent contribute a significant increase to the Town’s population not reflected in Census figures. Data summarizing these populations, including staff, are provided in Table 10.
Table 10 shows that institutions, including private schools, add up to 1,300 people to the Town’s population over the school year, approximately 750 people for seasonal facilities, and 6,000 to 7,000 attendees at 2 – 3 day events during summer months. Although these populations are typically less mobile or are of very short duration, they do create demands on municipal facilities and services and should be considered in the Town Plan.
Table 10: Institutional and Seasonal Populations
Institution Population Kent School 631 South Kent School 196 Marvelwood 213 High Watch 80 Specialty Care 200 Club Getaway 750 Jazz Festival (3 days) +/- 4,500 Film Festival (3 days) +/- 1,500 Litchfield Antiques Show (2 days) +/- 500 Source: Websites; Interviews

KENT: THE STATE OF OUR TOWN
KentStateofTownFinal June 2010 P a g e | 13
STATE OF OUR TOWN
HOUSING For small towns like Kent, housing is a major issue. New housing developments, while infrequent, can have impacts on neighborhoods, infrastructure needs, and municipal services. From a different perspective, high housing cost precludes many from living in Kent, threatening the long term social and economic vitality of the community. It is important, therefore, to closely monitor housing conditions and seek strategies to address these and other related issues.
HOUSING DATA AND TRENDS
Like most Connecticut towns, Kent has experienced a slowdown in residential development as the housing market has consolidated. As Table 11 shows, annual permits for new houses have dropped from a high of 30 in 1995 to seven in 2009, averaging 13 over the past 19 years.
Table 12 and Charts 10 - 13 summarize housing characteristics from the 2000 Census and local data. For historic perspective, Chart 9 shows the history of residential development in Kent, clearly reflecting the post-World War II suburban boom and the economic cycles experienced since then.
Table 12: Housing Characteristics
2000 Occupied Housing Units 1,143 Owner Occupied 836 Renter Occupied 307 Average Household Size 2.43 % Single Occupant 28.3% 1990 Occupied Housing Units 1,153 Owner Occupied 751 Renter Occupied 402 Average Household Size 2.42 % Single Occupant 26.4%
Source: US Census 2000
Table 11: New Home Building Permits Year Number
1990 16 1991 17 1992 7 1993 15 1994 14 1995 30 1996 13 1997 12 1998 12 1999 13 2000 12 2001 9 2002 13 2003 13 2004 16 2005 18 2006 13 2007 8 2008 5 2009 7
Average 13 Source: DECD Annual Housing Permit Data by Town

KENT: THE STATE OF OUR TOWN
KentStateofTownFinal June 2010 P a g e | 14
Chart 10: Housing Permits Chart 11: Housing Age
Source: DECD Annual Housing Permit Data by Town Source: US Census 2000
Chart 12: Housing Status Chart 13: Housing Status
Source: US Census 1990, 2000 Source: US Census 1990, 2000
Photos Source: Kent Visual Inventory
0
5
10
15
20
25
30
35
1990 1992 1994 1996 1998 2000 2002 2004 2006 2008
Kent New Housing Permits (Annual)
524 (36%)
188 (13%)
109 (7%)
203 (14%)
252 (17%)
75 (5%)94 (6%)
18 (1%)
1939 or Earlier
1940 -1959
1960 -1969
1970 -1979
1980 -1989
1990 -1994
1995 -1998
1999 -2000
Kent - Housing Age (Year Built)
Owner Occupied
Renter Occupied
PartTime Vacant
2000 57% 21% 18% 4%
1990 53% 28% 13% 5%
0%
10%
20%
30%
40%
50%
60%
70%
Kent - Housing Status 1990 and 2000
2000
1990
Owner Occupied
Renter Occupied
PartTime Vacant
2000 836 307 265 55
1990 751 402 187 74
0100200300400500600700800900
Kent - Housing Status 1990 and 2000 CensusNumber
2000
1990

KENT: THE STATE OF OUR TOWN
KentStateofTownFinal June 2010 P a g e | 15
HOUSING DIVERSITY AND AFFORDABILITY
Kent, along with the State of Connecticut as a whole, faces a challenge that has wide-ranging social and economic implications. As noted in the section on Demographics, above, Connecticut and many of its communities are losing the ability to retain and attract young residents. At the same time, many older residents who may wish to remain in the area, but who no longer care to support and maintain a large property, are unable to find alternative housing more suitable to their needs. A major cause of this trend is the cost of housing.
Chart 14 and Figure 1 illustrate the status of affordable housing availability in several area towns, as defined by the Affordable Housing Appeals Act (CGS §8-30g). These data demonstrate the continuing exposure of communities like Kent to the appeals provisions that can override local land use regulations where less than 10% of a town’s housing units are considered affordable.
Recognizing the need for affordable housing throughout Connecticut, the State Legislature recently authorized the adoption of special Incentive Housing Zones, where higher density housing with an affordable component can be developed subject only to design standards and exempt from spot zoning prohibitions.
Information about housing sale price and price change is provided in Tables 13 and 14, Chart 15, and Figure 2. This information, however, is only useful for comparison purposes, since the data is based on small samples (number of sales). Additionally, this data will be updated prior to the Plan completion to reflect the significant decline in housing prices over the past two years.
Table 13: 2007 Median House Price
Norfolk $303,500 Kent $340,000 New Milford $355,000 Sharon $367,000 Warren $375,000 Salisbury $558,750 Cornwall $586,725 Washington $600,000 Litchfield County $265,000 Source: CERC Municipal Profiles 2010
Table 14: Kent Housing Sales
Year # of Sales
Median Price
1990 20 $170,000 2000 57 $230,000 2005 36 $388,750 2007 25 $340,000 2008 30 $382,500 Average 24 $302,250 Source: The Warren Group 2008 (NWCCOG)
Chart 14: Affordable Housing Chart 15: House Sale Price
Source: Connecticut DECD Affordable Housing Appeals List 2008 Source: The Warren Group 2008 (NWCCOG)
3.55%
2.22% 2.15%2.06%
1.55% 1.49% 1.12%
0.46%
0.00%
0.50%
1.00%
1.50%
2.00%
2.50%
3.00%
3.50%
4.00%
Comparison of % Affordable Housing - 2008
0% 50% 100% 150%
Sharon
Roxbury
Washington
Salisbury
Warren
Kent
Median House Sale Price Change 1990-2008

KENT: THE STATE OF OUR TOWN
KentStateofTownFinal June 2010 P a g e | 16
Figure 1: Affordable Housing Comparison Figure 2: House Price Comparison
KENT: THE STATE OF OUR TOWN
KentStateofTownFinal June 2010 P a g e | 17
Figure 3: Unemployment Rate Comparison Figure 4: Population Growth Rate Comparison

KENT: THE STATE OF OUR TOWN
KentStateofTownFinal June 2010 P a g e | 18
Figure 5: Tax Levy per Capita Comparison Figure 6: Commercial Industrial Grand List Comparison

KENT: THE STATE OF OUR TOWN
KentStateofTownFinal June 2010 P a g e | 19
STATE OF OUR TOWN
FISCAL AND ECONOMIC CONDITIONS
Managing municipal budgets is an increasing challenge, due at least in part to Connecticut’s reliance on local property taxes to fund education along with all other municipal services. Conservation and development plans do not directly address budget issues, but an understanding of conditions is helpful in developing realistic and achievable strategies to further Plan goals.
MUNICIPAL FINANCES
Tables 15 and 16 and Chart 16 show the recent grand list components and history for Kent.
Chart 17 and Figure 5 compare the tax levy per capita of several area towns. Tables 17 and 18 and Charts 18 and 19 document the growth in operating and education expenditures over the past six years.
Figure 6 compares the commercial and industrial component of municipal grand lists for area towns. Of the eight towns compared, only New Milford has a higher proportion of its grand list in commercial or industrial use.
Table15: Kent 2008 Grand List Assessment Residential $371,591,626 Commercial/Industrial/Utility 36,629,005 Personal Property 12,049,015 Motor Vehicle 25,061,951 Total Net Assessment $481,960,605 Source: OPM Municipal Fiscal Indicators; Totals may vary due to rounding
Table16: Kent Net Grand List History 2004 $318,594,514 2005 $445,949,826 4.0% 2006 $457,443,014 2.6% 2007 $467,432,051 2.2% 2008 $472,403,647 1.1% Source: Connecticut Secretary of State; OPM Municipal Fiscal Indicators
Table 17: Annual Expenditures Operating Education 2003 $2,935,603 $4,654,201 2004 $2,957,642 $4,844,161 2005 $3,075,379 $5,113,182 2006 $3,153,804 $5,516,979 2007 $3,270,686 $5,915,841 2008 $3,366,717 $7,088,353
Source: OPM Municipal Fiscal Indicators;
Table 18: Annual Expenditure Increase (over prior year)
Operating Education 2004 0.75% 4.08% 2005 3.98% 5.55% 2006 2.55% 7.90% 2007 3.71% 7.23% 2008 2.94% 19.82%

KENT: THE STATE OF OUR TOWN
KentStateofTownFinal June 2010 P a g e | 20
Chart 16: Grand List and Mill Rate
Source: Connecticut Secretary of State; OPM Municipal Fiscal Indicators Chart 17: Tax Levy
Source: Connecticut Secretary of State; OPM Municipal Fiscal Indicators Chart 18: Expenditures Chart 19 Expenditure Growth Rate
Source: OPM Municipal Fiscal Indicators
0
5
10
15
20
25
$0
$50
$100
$150
$200
$250
$300
$350
$400
$450
$500
2001 2002 2003 2004 2005 2006 2007 2008
Mill
Rat
e
Net
Gra
nd L
ist
($M
illio
n)Kent - Net Grand List and Mill Rate History
Net Grand List Mill Rate
$0
$500
$1,000
$1,500
$2,000
$2,500
$3,000
$3,500
$4,000
Cornwall Norfolk Washington Kent Warren Sharon Salisbury New Milford
State Median
Property Tax Levy per Capita FYE 2008
$2,000,000
$3,000,000
$4,000,000
$5,000,000
$6,000,000
$7,000,000
$8,000,000
2003 2004 2005 2006 2007 2008
Annual Expenditures
Operating Education
0%
5%
10%
15%
20%
25%
2004 2005 2006 2007 2008
Annual Expenditure Rate of Increase
Operating Education

KENT: THE STATE OF OUR TOWN
KentStateofTownFinal June 2010 P a g e | 21
EMPLOYMENT
Household income for Kent in 1999 is shown in Table 19 and compared to the State and Nation.
According to the Connecticut State Labor Department, 1,547 of Kent’s 1,613 residents considered in the labor force were working in 2008. Chart 20 illustrates the unemployment trend over the past 10 years. Figure 3 (page 17) compares the most recent (2009) average annual unemployment rate for Kent and area towns from the Connecticut State Department of Labor.
According to data from the Connecticut Department of Revenue Services, retail sales of goods in Kent by 270 taxpayers in 2007 totaled $43,000,430.
Table 19: Household Income 1999
Income Number Percent
<$10,000 56 5%
$10,000 – $49,999
457 40%
$50,000 – $99,999
402 35%
$100,000 – $199,999
117 10%
>$200,000 112 10%
Total Households 1,144 100% Median Household Income
Kent $53,906
Connecticut $53,935
United States $41,994 Source: US Census 2000
Chart 20: Workforce
Source: Connecticut State Department of Labor
0.00%
1.00%
2.00%
3.00%
4.00%
5.00%
6.00%
7.00%
8.00%
1420
1440
1460
1480
1500
1520
1540
1560
2000 2001 2002 2003 2004 2005 2006 2007 2008 2009
Une
mpl
oym
ent R
ate
Num
ber E
mpl
oyed
Kent Workforce
Employed Unemployment Rate

KENT: THE STATE OF OUR TOWN
KentStateofTownFinal June 2010 P a g e | 22
Table 20 lists the types of occupations of the Kent labor force from the 2000 Census. Travel times and methods of travel for commuters from Kent are shown on Charts 21 and 22.
Table 21 lists the place of residence for commuters into Kent and the work location for the Kent labor force. 87 residents, or 6% of the workforce, worked at home. These data are from the 2000 Census and should be updated when 2010 Census information is available.
Table 20: Kent – Occupation Categories
Number %
Management, professional 590 40%
Service 213 14%
Sales and Office 389 26%
Farming, Fishing, Forestry 5 0.3%
Construction, Extraction, Maintenance
144 9%
Production, Transportation
169 11%
Source: US Census 2000
Table 21: Kent – Place of Work 2008
Into Kent From: Number %
Kent 654 56% New Milford 103 9% Amenia, NY 68 6% Dover, NY 65 6% Litchfield 61 5% Torrington 57 5% Cornwall 51 4% Warren 44 4% Sharon 42 4% Danbury 31 3%
From Kent To:
Kent 654 57% New Milford 130 11% Danbury 89 8% Manhattan, NY 78 7% Sharon 53 5% Washington 44 4% North East, NY 28 2% Ridgefield 23 2% North Canaan 22 2% Litchfield 22 2%
Source: CPEC 2009 Municipal Profile
Chart 21: Commuting Method Chart 22: Commuting Time
Source: US Census 2000
77.60%
6.30%
2%
7%
5.90%
1.20%
Drive Alone
Carpooled
Public transit
Walked
Worked at home
Other
0% 20% 40% 60% 80% 100%
Kent Commuters Method
0 100 200 300 400 500 600 700
<10
10-29
30-59
>60
Com
mut
e M
inut
es
Kent Commuters Travel Time

KENT: THE STATE OF OUR TOWN
KentStateofTownFinal June 2010 P a g e | 23
ECONOMIC DEVELOPMENT
Kent’s village center, much of which is in a defined Village District subject to special standards including design standards, constitutes the majority of the Town’s economic development.
Table 22 lists the current square footage of commercial and industrial uses in or near the Kent Village Center. Table 23 tabulates the current vacancies in the village retail area, illustrating the ongoing need to promote economic activity to sustain the village center vitality. These data imply a current vacancy rate for commercial use buildings of nearly 10%.
A pending study by the Northwestern Connecticut Regional Planning Collaborative, as of the preparation of this report, will evaluate current conditions, challenges, and opportunities for economic activity in small town village areas throughout the region. The results of that project will be incorporated into the Kent Plan as appropriate.
The fiscal impact of commercial and industrial business in Kent is shown in Chart 23, below. Chart 23: Grand List Components
Source Connecticut OPM Municipal Fiscal Indicators
Table 22: Kent – Village Center Uses
Use Total Sq.Ft. %
Automotive 15,148 3.0 Bank 7,408 1.0 Church 27,297 5.0 Hotel 1,680 0 Industrial 33,800 6.0 Library 8,136 2.0 Light Industry 7,927 1.0 Medical 79,652 15.0 Multi-Family 60,096 11.0 Office 48,311 9.0 Residence 46,072 9.0 Restaurant 27,120 5.0 Retail 117,435 22.0 Municipal 49,315 9.0 Total 529,397 Total Commercial 296,754 Source: Kent Tax Assessor’s Data
Table 23: Kent – Village Center Commercial Use Vacancies (2009)
Sq. Ft. Prior Use 1,800 former Blu Grill 1,500 former Strobles Bakery 800 former paint store 800 former retail 5,280 former design studio 3,000 former yarn store 600 former office 560 former office 1,000 former office 1,000 former hair salon 1,250 former wholesale
bakery 1,558 former retail 9,000 Former Cyberian
Outpost (ground floor) Total - 28,148
Source: Northwestern Connecticut Regional Planning Collaborative data; PZC Input
The limited areas zoned for commercial or industrial use are shown on the Village Center Zoning Map (Figure 8).
Kent - Grand List Components 2007
Other 7.6%
Motor Veh. 5.2%
C/I 7.6%
Personal 2.5 %
Residential 77.1%

KENT: THE STATE OF OUR TOWN
KentStateofTownFinal June 2010 P a g e | 24
STATE OF OUR TOWN
LAND USE AND RESOURCE INVENTORY
OVERVIEW
Kent clearly values its natural, historic, and cultural resources very highly. The Town has an active and effective private land trust and a private historical society.
Kent has also created an Energy and Environmental Task Force, charged with reviewing energy use and developing means of reducing energy use and associated environmental impacts.
The Kent Conservation Commission has recently completed an inventory report Natural and Cultural Riches of Kent, Connecticut. This inventory provides detailed guidance for resource protection along with a comprehensive set of 14 maps prepared by Housatonic Valley Association staff in conjunction with the Conservation Commission, depicting the Town’s natural and cultural resources, land uses and characteristics, and other features. These maps, along with the entire inventory report, should also be used to guide the development of the new Town Plan.
In addition, recently updated land cover and forest fragmentation data from the Center for Land Use Education and Research (CLEAR) provides additional guidance for such future decisions as open space acquisition, zoning and subdivision regulations, municipal facilities siting, and land use decisions generally. This information is summarized in Table 25 and Figures 11 and 12.
These data show that “developed area” in Kent (derived from satellite imagery of surface coverage) increased by 12.2 percent from 1985 to 2006; however the total developed area constitutes only 5.7 percent of the total land area of Kent.
Figure 10 is the Locational Guide Map for Kent from the State Conservation and Development Policies Plan. This map provides some additional information about current and prospective land uses and is also used by the State when decisions are necessary regarding State funding or permitting for such development projects as sewer extensions. Town Plans are expected to be consistent with the State plan, including the designation of conservation, preservation, and development areas.
Nearly one-third of the land area in Kent is protected open space, due primarily to large State and Federal holdings. A tabulation of existing open space in Kent from the Natural and Cultural Riches inventory is reproduced in Table 24, below. Consult the inventory for additional detail.
KENT: THE STATE OF OUR TOWN
KentStateofTownFinal June 2010 P a g e | 25
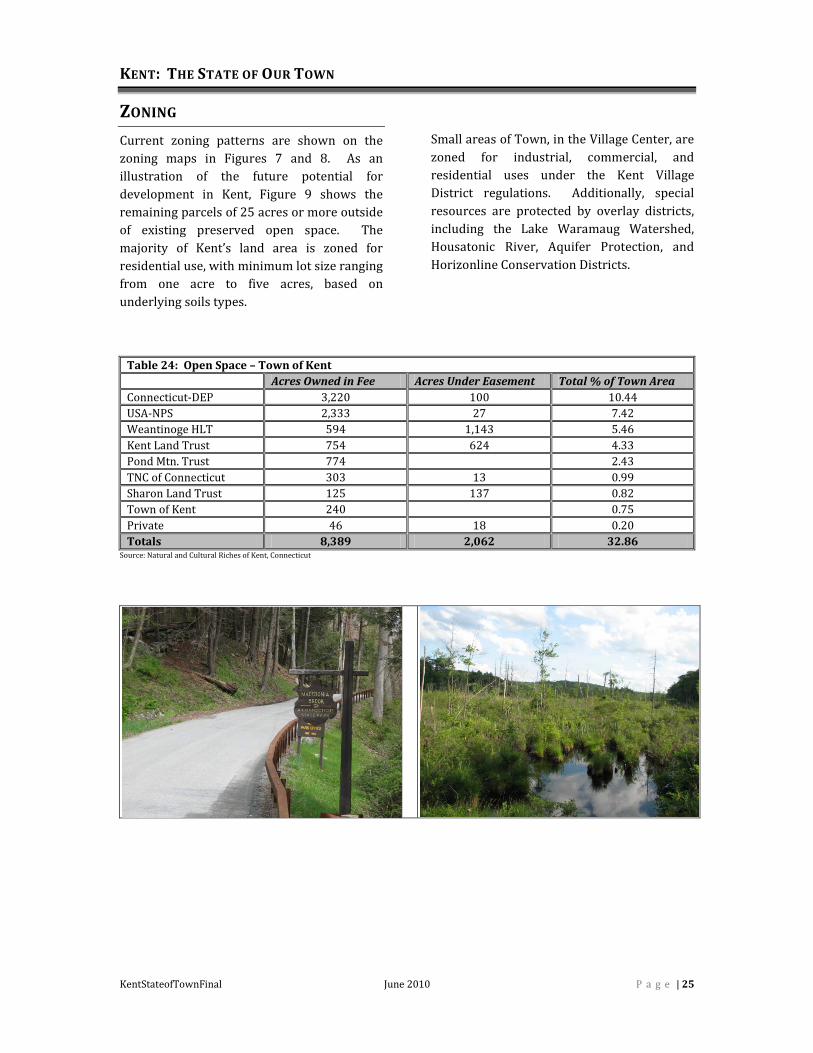
ZONING
Current zoning patterns are shown on the zoning maps in Figures 7 and 8. As an illustration of the future potential for development in Kent, Figure 9 shows the remaining parcels of 25 acres or more outside of existing preserved open space. The majority of Kent’s land area is zoned for residential use, with minimum lot size ranging from one acre to five acres, based on underlying soils types.
Small areas of Town, in the Village Center, are zoned for industrial, commercial, and residential uses under the Kent Village District regulations. Additionally, special resources are protected by overlay districts, including the Lake Waramaug Watershed, Housatonic River, Aquifer Protection, and Horizonline Conservation Districts.
Table 24: Open Space – Town of Kent Acres Owned in Fee Acres Under Easement Total % of Town Area Connecticut-DEP 3,220 100 10.44 USA-NPS 2,333 27 7.42 Weantinoge HLT 594 1,143 5.46 Kent Land Trust 754 624 4.33 Pond Mtn. Trust 774 2.43 TNC of Connecticut 303 13 0.99 Sharon Land Trust 125 137 0.82 Town of Kent 240 0.75 Private 46 18 0.20 Totals 8,389 2,062 32.86
Source: Natural and Cultural Riches of Kent, Connecticut

KENT: THE STATE OF OUR TOWN
KentStateofTownFinal June 2010 P a g e | 26
Figure 7: Current Zoning Map - Town of Kent

KENT: THE STATE OF OUR TOWN
KentStateofTownFinal June 2010 P a g e | 27
Figure 8: Village Center Zoning Map – Town of Kent

KENT: THE STATE OF OUR TOWN
KentStateofTownFinal June 2010 P a g e | 28
Figure 9: Developable Land – Town of Kent

KENT: THE STATE OF OUR TOWN
KentStateofTownFinal June 2010 P a g e | 29
Figure 10: State Plan Locational Guide Map – Town of Kent

KENT: THE STATE OF OUR TOWN
KentStateofTownFinal June 2010 P a g e | 30
Table 25: Land Cover and Land Cover Change – Town of Kent
1985 1995 2006 1985 – 2006
Change
Category acres % of town acres
% of town acres
% of town acres % change
Developed 1612 5.1% 1752 5.5% 1809 5.7% 196.2 12.2%
Turf & Grass
569 1.8% 630 2% 762 2.4% 193.2 34%
Other Grasses
225 0.7% 230 0.7% 232 0.7% 6.9 3.1%
Agricultural Field
3207 10.1% 3121 9.8% 3062 9.6% -145.2 -4.5%
Deciduous Forest
21479 67.5% 21400 67.3% 21293 66.9% -185.2 -0.9%
Coniferous Forest
2759 8.7% 2752 8.7% 2734 8.6% -25.4 -0.9%
Water 977 3.1% 935 2.9% 915 2.9% -61.4 -6.3%
Non-forested Wetland
162 0.5% 174 0.5% 177 0.6% 14.9 9.2%
Forested Wetland
793 2.5% 771 2.4% 774 2.4% -18.9 -2.4%
Tidal Wetland
0 0% 0 0% 0 0% 0 0%
Barren 17 0.1% 36 0.1% 42 0.1% 24.9 147.1%
Utility (Forest)
8 0% 8 0% 8 0% 0 0%
* as a percentage of the 1985 land cover area Source: Connecticut Center for Land Use Education and Research (http://clear.uconn.edu/)

KENT: THE STATE OF OUR TOWN
KentStateofTownFinal June 2010 P a g e | 31
Figure 11: Land Cover – Town of Kent

KENT: THE STATE OF OUR TOWN
KentStateofTownFinal June 2010 P a g e | 32
Figure 12: Forest Cover – Town of Kent

KENT: THE STATE OF OUR TOWN
KentStateofTownFinal June 2010 P a g e | 33
THE PLAN OF CONSERVATION AND DEVELOPMENT
MUNICIPAL FACILITIES
OVERVIEW
A Plan of Conservation and Development should provide guidance for decisions regarding municipal facilities and properties, such as roads, water and sewer systems, stormwater management structures, libraries, schools, municipal offices, recreational facilities and parks, and public safety facilities. The locations of key municipal facilities, parks, and other town owned properties are shown on Figure 13.
SEWER SYSTEM
Portions of Kent, approximately 500 acres in the Village Center and encompassing the Kent School campus, are served by a municipal sewer system managed by the Kent Water Pollution Control Authority (WPCA). Several large private developments and schools are served by private community sewerage systems. A Draft Water Pollution Control Plan, prepared for the WPCA by Loureiro Engineering Associates, Inc. identifies these areas and potential areas for expansion of the municipal system. The WPCA recommended that the Water Pollution Control Plan and Sewer Service Area Map be incorporated into the new Town Plan.
STREETS AND TRAFFIC
The Town of Kent has over 100 miles of town-maintained streets, in addition to approximately 24 miles of State-maintained roads, as shown on Map #1 in the Natural and Cultural Riches inventory. This map may provide the basis for classification of streets in the Town for planning purposes.
Data on average traffic volume is gathered by the Connecticut Department of Transportation and recent data for several important locations along Route 7 are tabulated in Table 26.
PUBLIC WATER SYSTEM
The Kent Village area is served by Aquarion Water Company, which provided approximately 27,170,000 gallons of water to customers in 2008. Average daily demand in February 2010 was 0.0833 million gallon per day compared to the company’s current total production capacity of 0.396 million gallons per day. The company expects no need and has no plans for expansion, although it does recommend that the Town adopt a Water Use Restriction Ordinance to be prepared for possible drought conditions in the future. (all information supplied by Aquarion Water Co. 3-22-10)
Table 26: Route 7 Traffic Average Daily Trips Rt. 7 Segment Ending at: 2007 2005 2003 2000 1996 New Milford Town Line 3500 3400 3700 3800 2700 Route 341 4900 4900 3700 3800 5200 Entrance to Kent Green 6400 5500 6400 No data 5100 Cornwall Town Line 1900 2000 2300 2300 No data Source: Connecticut DOT Traffic Log Data

KENT: THE STATE OF OUR TOWN
KentStateofTownFinal June 2010 P a g e | 34
Figure 13: Municipal Properties – Town of Kent

KENT: THE STATE OF OUR TOWN
KentStateofTownFinal June 2010 P a g e | 35
THE PLAN OF CONSERVATION AND DEVELOPMENT
NEXT STEPS PUBLIC OUTREACH
This report will be made available to Kent residents on the Town’s Web Page and with paper copies in the Kent Memorial Library and at the Town Hall.
Subsequently, the Commission will issue a community opinion survey, seeking input from the Town’s residents and business owners.
The Commission also intends to convene focus groups for discussions on the key issues.
Based on the results of the outreach effort, the Commission will identify the basic themes that will guide the Plan update and the new or revised strategies that may be necessary.
The Planning Commission will also schedule a public workshop to present the results of its research and analysis and to obtain additional input from the community.
Table 27 lists a number of resources that readers may wish to consult for additional background information on Kent and community planning.
Table 27: Resources • Previous Kent Plans of Conservation and
Development (Land Use Office) • Connecticut General Statutes Section 8-23 • State Conservation and Development Policies
Plan (www.ct.gov/opm) • Connecticut Office of Responsible Growth
(www.ct.gov/opm) Schedule
The Commission has established the following preliminary schedule for the Plan of Conservation and Development project:
Phase 1: Data, Analysis, and Outreach
Phase 2: Objectives and Strategies
Phase 3: Plan Preparation
Phase 4: Plan Adoption
September 2009 – September 2010
July – October 2010 November 2010 – March 2011
May – July 2011
Comments on this Report and related planning issues for consideration by the Commission may be sent to [email protected].