kent pension fund report and accounts · 2018-10-18 · 5 - report & accounts 2017/2018 -...
TRANSCRIPT

Kent Pension FundReport and AccountsFor the year ended 31 March 2018

Introduction and overview Investments Administration
Chairman’s foreword 3 Investment strategy overview 15 Administration management performance 2017-18 22
ACCESS Pooling Update 4 Value of Funds under management by Fund Manager 16 CIPFA Benchmark 22
Governance arrangements 5 Investment performance 2017-18 18 Internal Dispute Procedure 22
Risk management and Fund overview 7 Voting by Equity Fund Managers 2017-18 21 Employers 23
Employers 10
Fund trends 10
Financial summary 11
Actuary’s report Financial statements Independent Auditor’s report
Introduction 38 Statement of responsibilities for the Statement of Accounts 40 Opinion 74
Asset value and funding level 38 Fund account for the year ending 31 March 41
Contribution rates 38 Notes to the pension fund account 42
Assumptions 38
Updated position since the 2016 valuation 39
If you have any comments on the annual report,
• please email [email protected], or
• write to: Kent Pension Fund, Treasury and Investments, Kent County Council, Room 3.17, Sessions House, County Hall, Maidstone, Kent ME14 1XQ

3 - REPO
RT & A
CC
OU
NTS 2017/2018 - IN
TROD
UCTIO
N &
OV
ERVIEW
members in the Fund. The number of employers in the Fund also increased, to 432, mainly as a result of staff transferring to new employers as services have been outsourced and schools converting to academy status.
The growth in membership has resulted in an increased workload for the KCC staff who provide the administrative and accounting support to the Fund and I am grateful to them for all their hard work in maintaining high levels of service to members.
I would also like to thank the members of the Superannuation Committee and Pensions Board for their hard work and commitment during 2017-18. 2018-19 looks like being another challenging period for the Fund in terms of its investment strategy and further development of the ACCESS pool, while managing the needs of an increasing membership. As Chairman I am really looking forward to working with Members and Officers over the next 12 months.
Charlie SimkinsChairman
Chairman’s forewordAs the Fund Chairman it is my pleasure to introduce the Kent Pension Fund annual report.
2017-18 was a busy and successful year for the Fund as it grew in value to £5.83bn, having achieved an investment return of 4.7%, and individual and employer membership increased.
We continue to work hard to ensure the Fund is best positioned to deliver the returns needed in the future and it is pleasing to report that this has been a good year for the Fund’s investments and while investment performance varied across strategies and managers our long established global equity, UK equity and direct property managers performed particularly well.
We regularly review the performance of the Fund’s investment managers and asset allocation, and during the year we decided to transfer £200m from a global equity manager to an absolute return fund, banking gains made over a long period of time. Also, in collaboration with other ACCESS LGPS funds, we decided to appoint UBS to manage our UK and global equity passive strategies transferring some £615m from the Fund existing manager while achieving significant savings on investment management fees.
We are now in the process of reviewing the Fund’s strategic asset allocation and I look forward to reporting back on how we have implemented any changes to our arrangements next year.
Investment pooling continues to be a significant piece of work for the Kent Fund and we are represented on the project by Members and Officers. Kent Democratic Services also provides secretarial support to the Joint Committee. Progress made on the establishment of the ACCESS Pool is summarised overleaf.
Individual membership of the Fund increased during the year and at 31 March 2018 there were 52,775 contributing members, an increase of some 2,000 from 31 March 2017 and in total there are now 135,000

4 - REPO
RT & A
CC
OU
NTS 2017/2018 - IN
TROD
UCTIO
N &
OV
ERVIEW
with the Operator responsible for selecting and contracting with managers on behalf of the Funds participating in the Pool.
• With the procurement phase completed, the implementation phase of the project is in train and progressing well. Link is preparing documentation for the FCA authorisation of an umbrella Authorised Contractual Scheme (ACS) and first sub-fund for submission very shortly.
• A key element of governance arrangements focuses on the robust management of the Operator contract and the Operator to ensure it is held to account by the administering authorities of each Fund participating in ACCESS via the Joint Committee. ACCESS is also setting up the ACCESS Support Unit (ASU) which will manage the Operator contract against specified KPIs and provide technical and secretariat support services to the Joint Committee (JC) and Officer Working Group (OWG). Interim arrangements are already in place.
• The Pooling arrangements have been set up to ensure the administering authorities of each Fund may exercise proper democratic accountability and continue to meet fiduciary responsibilities.
• The potential for greater savings in the longer term remains, as the ACCESS Pool applies its leverage as one of the largest asset pools in the UK and collaborates with other pools to achieve further benefits of scale in investment management including new ways of investing in illiquid assets in particular infrastructure.
• In addition to the savings in investment management fees due to the reduction in manager numbers and an increase in mandate size, there are other tangible benefits from pooling including a governance dividend (potential for reduced risk due to manager diversification achieved at pool level), and tax savings for funds moving from pooled funds to segregated mandates in the Pool’s tax transparent ACS. For some asset classes such as global equities tax savings alone are material relative to additional costs of implementing pooling.
ACCESS Pooling Update
The Government is encouraging LGPS Funds to work together to put forward plans to “pool investments to significantly reduce costs, while maintaining investment performance.” Eleven like-minded LGPS Funds including the Kent Pension Fund are working together under the name of ACCESS (A Collaboration of Central, Eastern and Southern Shires). Individually the participating Funds have a strong performance history and potential for substantial benefits for a group of successful like-minded Funds collaborating and sharing their collective expertise. Collectively the ACCESS Pool has significant scale with assets of £43bn, managed on behalf of c3,000 employers and c900,000 members. It is the Government’s expectation that the asset pools are formed in order for assets to begin being transferred from individual LGPS Funds from 1 April 2018.
The ACCESS Pool submitted their Spring Progress report to the Ministry of Housing, Communities and Local Government (MHCLG) on 4 May 2018. It sets out the progress made by the ACCESS Funds to meet the Government’s investment reform agenda and we would like to highlight the following:
• The July 2016 submission to DCLG indicated that ACCESS Funds could benefit from eventual projected savings of £30m annually (excluding any assumptions on asset growth). These estimates of savings remain consistent with current evidence.
• ACCESS Funds have appointed UBS to manage its passive mandates (approx. £11bn). The indicative saving of £5.2m per annum exceeds the estimated saving projection of £4m per annum stated in our July 2016 submission.
• The ACCESS Funds have appointed Link Fund Solutions (Link) as the Pool’s Financial Conduct Authority (FCA) authorised Operator. The appointment means a significant shift in governance arrangements

5 - REPO
RT & A
CC
OU
NTS 2017/2018 - IN
TROD
UCTIO
N &
OV
ERVIEW
Governance arrangementsThe Superannuation Fund Committee The Superannuation Fund Committee exercises all of the powers and duties of the Kent County Council (KCC) in relation to its functions as Administering Authority for the Fund. The Committee is responsible for setting investment strategy, appointing professional fund managers and carrying out regular reviews and monitoring of investments. It also monitors the administration of the Pension Scheme and determines Pension Fund policy in regard to employer admission arrangements.
A new committee was constituted following the Council elections in May 2017. The membership of the Committee during 2017-18 is detailed below. An initial committee meeting was held immediately after the elections to elect the chair of the committee. There were 5 full Committee meetings during the year.
Committee members
Kent Active Retirement FellowshipMary Wiggins David Coupland
Union RepresentativeSophy Lysaght - until 22 March 2018Joe Parsons - from 23 March 2018
Charlie Simkins ChairmainKent County Council
Dan DaleyKent County Council
Nick ChardVice ChairmainKent County Council
Paul Barrington-KingKent County Council
Alan MarshKent County Council(Until 08/09/2017)
Paul BartletKent County Council
Paul CooperKent County Council
Peter HomewoodKent County Council(from 08/09/2017)
Tan DhesiKent County Council(until 07/09/2017)
James McInroyKent County Council
John BurdenGravesham Borough Council
Paul ClokieAshford Borough Council
Nick Eden-GreenCanterbury City Council
John WrightKent County Council
Les WicksMedway Council

6 - REPO
RT & A
CC
OU
NTS 2017/2018 - IN
TROD
UCTIO
N &
OV
ERVIEW
Fund Managers
State Street Global Advisors (SSgA)Kent County Council Treasury Management TeamUBS Asset Management
Local Pensions BoardThe Local Pensions Board for Kent was established in April 2015 in accordance with the relevant Government Legislation.
The membership of the Board during 2017-18 is detailed below; there were 2 full Board meetings during the year.
Board Members
Margaret Crabtree, Chairperson Kent County Council
Rosalind Binks Kent County Council
David Monk Shepway District Council
Alison Kilpatrick Kent and Medway Fire and Rescue Service
Joe Parsons, Vice Chairperson Unison Representative
Sophy Lysaght (until 22 March 2018)
Unison Representative
John Peden Staff Representative
David Coupland Kent Active Retirement Fellowship Representative
Kent County Council Officers and OthersThe day to day operations and management of the Fund and implementing the decisions of the Superannuation Fund Committee are delegated to the KCC Section 151 officer and their staff. This includes the power to seek professional advice and devolve day to day handling of the Fund’s investments to professional fund managers and advisers within the scope of the regulations. KCC undertakes the monitoring and accounting for the investments of and income due to the Fund.

7 - REPO
RT & A
CC
OU
NTS 2017/2018 - IN
TROD
UCTIO
N &
OV
ERVIEW
Risk ManagementKent County Council as the Administering Authority for the Kent County Council Superannuation Fund has delegated responsibility for the management of risk to the Superannuation Fund Committee.
Risk registerThe Committee regularly reviews the Fund’s key risks and has identified the main risks as:
• Fund investment return below that assumed by the actuary
• risks associated with the investment in the ACCESS ACS sub-funds
• change of premises for the Administration staff.
Arrangements have been agreed for the management of these risks in order to mitigate their impact on the Fund.
Financial, demographic, regulatory, and employer risks Details of the counter measures in place for financial, demographic, regulatory, and employer risks are included in the Fund’s Funding Strategy Statement (FSS). The FSS is reviewed annually.
Operational risksKent County Council’s Internal Audit Section conducts regular audits on the management of risk in the Pension Fund.
Third party risk such as that relating to employers in the Fund is managed through monitoring the timeliness of receipts of contributions as well as the annual review of guarantees / bonds provided by Admitted bodies.
Investment risk management Further details of the Fund’s policy on investment risk management are disclosed in the Fund’s Investment Strategy Statement (ISS). The Superannuation Fund Committee formally considers investment risk at four of its five planned meetings during the year.
Assurance over third party operations is provided by investment managers who are required to provide annual AAF 01/06 reports and ISAE 3402 reports.
Further details of the Fund Manager mandates can be found in the Investment Strategy Statement (ISS).
Other Organisations providing services to the Kent FundService Organisation
Custodian Northern Trust Company
Bankers National Westminster Bank
Fund Actuary Barnett Waddingham
Additional Voluntary Contributions (AVC) Providers
Equitable Life AssurancePrudential Assurance CompanyStandard Life Assurance
Investment Consultants Mercers
Auditors Grant Thornton
Legal Advisors Invicta Law
Performance Measurers Northern Trust CompanyPIRC Limited
Administration software provider Aquila Heywood
The Kent Pension Fund maintains the following statutory statements and policies; these are reviewed and updated regularly:
• Funding Strategy Statement• Investment Strategy Statement• Governance Compliance Statement• Communications Policy Statement.
These documents can be found on the Pension Fund‘s website - http://www.kentpensionfund.co.uk/local-government/fund-information/policies

8 - REPO
RT & A
CC
OU
NTS 2017/2018 - IN
TROD
UCTIO
N &
OV
ERVIEW
Fund Overview
Financial Performance
Forecast vs. actual income and expenditure analysis
The table below compares actual income and expenditure with that projected at the 2013 triennial valuations.
2015-16£m
2016-17£m
2017-18£m
2018-19£m
2019-20£m
Forecast
Contributions net of pension payments (11) (24) (1) (6) (18)
Investment Income net of expenses 89 94 96 100 104
Net income 78 70 95 94 86
Actual
Contributions net of pension payments 8 16 11 n/a n/a
Investment Income net of expenses 90 85 94 n/a n/a
Net income 98 101 105 n/a n/a
2016 Triennial ValuationThe Triennial valuation as at 31 March 2016 calculated a funding level of 89%. (2013 - 83%).
The funding level as a percentage has increased due to good investment returns and employer contributions although it has been partly offset due to changes in the financial assumptions used.
The increase in the funding level would normally result in lower employer contributions being required going forward however the lower expected long term return on investments (discount rate) has resulted in higher long term pension liabilities. This, coupled with a shorter recovery period of 17 years as compared to 20 years previously, has resulted in slightly higher contribution rates for employers and a general increase in Payroll has resulted in higher contributions overall. Pension payments are projected to go up in line with CPI and a marginal increase in number of members retiring.
Details of the Actuary’s assumptions used are included in the Barnett Waddingham report on page 37.

9 - REPO
RT & A
CC
OU
NTS 2017/2018 - IN
TROD
UCTIO
N &
OV
ERVIEW
Management ExpensesThe following table compares actual Administration, Governance and Oversight costs against the budget for 2017-18.
Actual£000’s
Budget£000’s
Pensions Administration 2,274 2,370
Fund Administration 393 373
Administration expenses 2,667 2,743
Actuarial Fees 271 283
Actuarial fees directly recovered from employers
-247 -236
Investments and Accounting 288 283
ACCESS pooling costs 78 50
Tax consultants 4 18
Investment Consultants 32 14
FRC Levy 4 3
Performance Measurement Fees 17 32
Audit fee 31 31
Governance and Oversight Expenses
478 478
Amounts due from EmployersOf the total employer and employee contributions received by the Fund the majority are paid monthly by employers and during 2017-18 we collected 98%, (99% in 2016-17) of total contribution income by the due date of the 19th of the month following. The option to levy interest on overdue contributions was not exercised. At 31 March 2018 contributions in respect of the March salaries totalling £16.6m (31 March 2017 £16m) due by 19 April had not been received.
2017-18 performanceDuring 2017-18 the Fund increased in value by £264m (4.7%) as the result of a net return on investments of £253m, and net inflow in respect of dealings with members, taking account of transfers-out, of £11m.
Contributions from Employers and Members increased by £3.8m from 2016-17 mainly as the result of higher Employer contribution rates following the 2016 Triennial valuation which came into effect from 1 April 2017 as well as the increase in contributing members and increase in salaries. Benefits Payable also increased in 2017-18 by £6m mainly due to the higher number of pensioner members and increase in value of the pensions paid.
In 2017-18 management costs, including investment management expenses, were £23.3m, a modest increase on 2016-17 (£22.7m). The increase in investment management fees reflecting the increased value of assets under management was offset by lower administration and other costs.

10 - REPO
RT & A
CC
OU
NTS 2017/2018 - IN
TROD
UCTIO
N &
OV
ERVIEW
EmployersAt 31 March 2018 there were 432 Employers in the Fund. During the year a number of organisations joined the Fund as admitted bodies following the transfer of staff from existing employers, schools converted to academies, and multi academy trusts, local authorities and other public bodies joined the Fund. There was also a consolidation of academy trusts and employers exiting the Fund as their last active member left or retired.
The following table shows a summary of the number of employers in the Fund analysed by scheduled bodies and admitted bodies which are active (i.e. with contributing members) and ceased (i.e. with no active members but with some outstanding liabilities).
Number of employersActive Ceased Total
Scheduled Body 250 58 308
Admitted Body 71 55 126
Total 321 113 432
Fund Trends A summary of the Fund’s key trends is shown below:
2013/14 2014/15 2015/16 2016/17 2017/18
Net Assets @ 31 March (£000’s) 4,137,259 4,539,037 4,597,540 5,565,175 5,828,846
No of Contributors 44,917 48,668 49,816 50,834 52,775
Contributions (£000’s) 209,749 217,714 220,961 228,285 232,037
Number of Pensioners 34,841 35,917 37,260 38,648 39,813
Benefits Paid (£000’s) 195,377 207,356 210,281 214,895 220,876

11 - REPO
RT & A
CC
OU
NTS 2017/2018 - IN
TROD
UCTIO
N &
OV
ERVIEW
Financial SummaryA brief summary for the last 5 years is shown below:
2013/14£000’s
2014/15£000’s
2015/16£000’s
2016/17£000’s
2017/18£000’s
Value of Fund at start of year 3,812,698 4,137,259 4,539,037 4,597,540 5,565,175
Revenue account for year
- Contributions and transfers in 216,637 222,177 224,366 238,851 243,299
- Investment (net) and other income net of expenditure
72,853 74,113 90,449 84,792 93,503
- Benefits and transfers out -203,495 -277,358 -216,314 -222,949 -232,373
Net Revenue 85,995 18,932 98,501 100,694 104,429
Increase (Decrease) in market value of investments in year
238,566 382,846 -39,998 866,941 159,242
Increase (decrease) in Fund during year
324,561 401,778 58,503 967,635 263,671
Value of Fund at end of year 4,137,259 4,539,037 4,597,540 5,565,175 5,828,846

12 - REPO
RT & A
CC
OU
NTS 2017/2018 - IN
TROD
UCTIO
N &
OV
ERVIEW
Fund Assets as at 31 March 2018UK
£000’sNon-UK
£000’sGlobal£000’s
Total£000’s
Equities 1,574,198 1,267,432 1,331,382 4,173,012
Bonds 271,206 328,877 600,083
Property 730,441 1,001 731,442
Alternatives 22,855 5,593 106,040 134,488
Cash and cash equivalents 132,151 16,363 148,514
Other investment balances 1,669 1,722 3,391
Total 2,732,520 1,620,988 1,437,422 5,790,930
Investment IncomeInvestment income accrued during 2017-18 is analysed as follows:
UK£000’s
Non-UK£000’s
Global£000’s
Total£000’s
Equities 38,797 24,302 10,765 73,864
Bonds 1,045 14,190 15,235
Property (direct holdings) 17,107 17,107
Alternatives 639 13,078 13,717
Cash and cash equivalents 630 630
Stock Lending 1,164 1,164
Total 58,218 51,570 11,929 121,717

13 - REPO
RT & A
CC
OU
NTS 2017/2018 - IN
TROD
UCTIO
N &
OV
ERVIEW
Five year analysis of the Fund’s membership
Type of Members 31 March 14 31 March 15 31 March 16 31 March 17 31 March 2018Contributors 44,917 48,668 49,816 50,834 52,775
Pensioners 34,841 35,917 37,260 38,648 39,813
Deferred Pensioners 39,777 41,534 42,476 42,352 42,376
Total 119,535 126,119 129,552 131,834 134,964
Member Age ProfileThe following table shows that at 31 March 2018 the age profile of the contributing membership was:
Age Members
Under 20 558
20 – 25 3,792
26 – 30 4,051
31 – 35 4,473
36 – 40 5,622
41 – 45 6,754
46 – 50 8,663
51 – 55 8,472
56 – 60 6,348
61 – 65 3,294
66 – 70 600
Over 70 148

14 - REPO
RT & A
CC
OU
NTS 2017/2018 - IN
TROD
UCTIO
N &
OV
ERVIEW
Five year analysis of pension overpayments, recoveries and write-offs
OverpaymentsThe overpayments identified over the last 5 years as the result of the Fund’s participation in the National Fraud Initiative are:Year No Value
£Action
2015 2 17,692 Recovered
1 2,906 No response therefore put forward for write off
1 2,040 No response - write-off
Total 4 22,638
2017 1 537.83 Seeking recovery
Total 1 537.83
Note: the number of cases has decreased as a mortality screening service is now used on a monthly basis to identify registered deaths.
Pension overpayments write-offsDetails of the write-offs made in the last 5 years:
Year No of cases Value £
2013-14 15 3,154
2014-15 10 2,975
2015-16 15 3,947
2016-17 36 8,135
2017-18 39 53,946*
* £49,441 of this amount refers to historic overpayments that occurred and all possibilities of recovery have been exhausted.

15 - REPO
RT & A
CC
OU
NTS 2017/2018 - IN
VESTM
ENTS
Investment Strategy Overview This report sets out details of the progress made against the Fund’s investment strategy during the year.
At its regular meetings during 2017-18 the Committee reviewed the Fund’s actual asset allocation compared to the benchmark, and where the variance was in excess of the tolerance level of +/- 2%, agreed any action to be taken.
The Fund’s strategic asset allocation at 31 March 2018 was as follows:
Asset Class Allocation %
Index
UK Equities 32 FTSE All Share
Overseas Equities 32 MSCI World Index NDR
Fixed Income 15 BAML GBP Broad Market
Property 13 IPD All Properties Index
Private Equity & Infrastructure 2 GBP 7 Day LIBID
Absolute Return 5 RPI +5%
Cash 1 GBP 7 Day LIBID
Total 100
Portfolio Distribution at 31 MarchThe graph opposite shows the Fund’s actual portfolio distribution between the main asset-classes as at 31 March 2017 and 31 March 2018 vs the benchmark.

16 - REPO
RT & A
CC
OU
NTS 2017/2018 - IN
VESTM
ENTS
Value of funds under management by Fund ManagerThe following graph shows the proportion of the Fund under management by fund manager as at 31 March 2018 and the table lists the Fund’s 10 largest equity holdings at that date.
29
39
1113
1 1
42
28
38
1012
1 1
7
3
32 32
1513
1 1
5
1
0
5
10
15
20
25
30
35
40
45
UK Equities Overseas Equities Fixed Interest Property Private Equity Infrastructure Absolute Return Cash
%
Asset Allocation as at 31 March
2017
2018
Benchmark
25%
20%
10%
9%
6%
6%5% 7% 4% 8%
Schroders
Baillie Gifford
UBS
DTZ
Goldman Sachs
M&G
Woodford
Pyrford
Sarasin
Others
Assets by Fund Manager

17 - REPO
RT & A
CC
OU
NTS 2017/2018 - IN
VESTM
ENTS
Equity10 Largest Equity Holdings in the Fund as at 31 March 2018
Market Value £m % of the Fund’s Net Assets
Royal Dutch Shell 76 1.3%
British American Tobacco 45 0.8%
BP 42 0.7%
Rio Tinto 41 0.7%
Glaxo Smith Kline 40 0.7%
Amazon 40 0.7%
HSBC 39 0.7%
Lloyds Banking Group 34 0.6%
Prudential 32 0.5%
Vodafone 29 0.5%
Total 418 7.2%
NB. Based on total assets in fund £5,829m.
PropertyThe graph opposite provides details of the type of property in which the Fund invests whilst the second table provides details of the Fund’s 5 largest direct properties held as at 31 March 2018.

18 - REPO
RT & A
CC
OU
NTS 2017/2018 - IN
VESTM
ENTS
Largest 5 properties held by the Fund
Property Property Type Market Valuation
£m
Battersea Park, London SW8 Industrial 51.50
Drury House, London Office 41.60
Lakeside Village, Doncaster Retail 36.40
Colingdale Retail Park, London Retail 28.80
3-5, Charing Cross Road, London WC2 Retail 28.30
128.34
113.85
1.00
242.05
246.20
Property by Sector (£m)
Industrial
Office
Overseas - Property Unit Trusts
Retail
UK - Property Unit Trusts

19 - REPO
RT & A
CC
OU
NTS 2017/2018 - IN
VESTM
ENTS
Investment performance 2017-18The performance of the Fund’s investment managers is reported on a quarterly basis to the Superannuation Fund Committee. The managers submit reports and valuations for this purpose and managers of the larger mandates meet at least annually with the Committee and / or its officers to make presentations and to answer questions.
Managers are required to provide valuation information to Northern Trust which assesses the rate of return achieved and provides performance reports that are for consideration by the Committee.
Total Fund PerformanceThe graph below shows the relative performance of the Kent Fund investments over the last 10 years. The overall return on the Fund investments for 2017-18 was 4.7% compared to the customised Strategic benchmark of 4.8%.
For comparison the PIRC Local Authority Universe average fund return for 2017-18 was 4.5%.
-19.8
36.8
8.9
2.7
14.7
8.511.2
1.2
21.1
4.7
-19.8
36.4
8.1
3.4
13.6
7.5
11.6
0.5
18.1
4.8
-30
-20
-10
0
10
20
30
40
2009 2010 2011 2012 2013 2014 2015 2016 2017 2018
Annual Investment Returns
Fund
Benchmark

20 - REPO
RT & A
CC
OU
NTS 2017/2018 - IN
VESTM
ENTS
Environmental Social and Governance Investments PolicyDetails of the Fund’s responsible investment policies and environmental, social and governance issues are included in the Investment Strategy Statement (ISS).
The graph below shows the long term performance of the Fund’s investments compared against its Strategic benchmark.
Returns by Asset ClassThe analysis set out below shows the returns by asset class for 2017-18:
Performance by Fund ManagerThe following graphs show the performance of the Equity and other Mandates compared to their benchmarks for the year ended 31 March 2018.
8.7
9.2
8.17.6
8.4
7.6
0
1
2
3
4
5
6
7
8
9
10
3 Year 5 Year 10 Year
%
Long Term Performance Summary
FundBenchmark
1.6
14.3
6.7
-1.4
3.5
-0.7
-13.4
1.2
3.5
2.4 2.4 2.42.9
1.3
-15
-10
-5
0
5
10
15
20
Schroders UK Baillie Gifford Sarasin Schroders GAV Impax M&G Woodford
%
Performance Returns by Fund Manager - Equities
Fund Manager
Benchmark
8.8
5.5 5.4
11.3
2.6
8.6
3.5
0.6
3.7 3.8 3.7
8.3
0
2
4
6
8
10
12
Goldman Sachs (Bond) Schroders (Bond) Kames (Property) DTZ (Property) Fidelity (Property) Pyford (Absolute Return)
%
Peformance Returns by Fund Manager - Other MandatesFund
Benchmark
-0.3
7.8
3.1
11.9
7.2
10.3
1.3
2.4 2.2
11.0
0.2 0.2
-2
0
2
4
6
8
10
12
14
UK Equities O/S Equities Bonds Property Private Equity Infrastructure
%
2017-18 Returns by Asset Class
Asset Class
Benchmark

21 - REPO
RT & A
CC
OU
NTS 2017/2018 - IN
VESTM
ENTS
The Fund complies with the UK Stewardship Code through the outsourcing to its external investment managers responsibility for governance, engagement, and voting activity. The Superannuation Fund Committee receives quarterly monitoring reports from the managers.
Voting by Equity Fund Managers 2017/18
Number of ResolutionsFor Against Abstain
Baillie Gifford 1,745 154 16
Schroders 987 45 0
Sarasin 514 180 47
The Fund is a member of The Pensions and Lifetime Savings Association (PLSA) and The Institutional Investors Group on Climate Change (IIGCC), and has signed up to the UN Principles for Responsible Investments (UNPRI).

22 -REPO
RT & A
CC
OU
NTS 2017/2018 - A
DM
INISTRATIO
NAdministration management performance 2017-18Key service standards for Scheme members
Type of case Target time Number processed
Processed within target
Calculation and payment of retirement award
20 days from receipt of paperwork
2,008 98%
Calculation and payment of dependants benefit
15 days from receipt of paperwork
377 99%
Provision of estimates
20 days from receipt of paperwork
3,025 72%
Correspondence Full reply within 15 working days
5,339 99%
CIPFA Benchmark SurveyThe Kent Pension Fund administration section participates in the annual CIPFA Benchmark survey which compares the cost of administration with 30 other local authority administering bodies across the UK. The table below is in respect of the year ending 31 March 2017, which is the most recent survey to be conducted.
Kent£
All scheme average
£Total cost of administration per scheme member
18.08 20.08
Payroll costs per pensioner (including staff)
1.52 1.34
Staff costs per Scheme member (excluding Payroll)
9.02 8.81
Communication costs per member 0.72 0.87
The results place Kent 13th of 30 authorities (1st being the lowest) in terms of the cost of administration per member.
There are 312 employers actively participating in the Fund and the profile of members is as detailed below:
Contributors Pensioners Deferred pensioners
31 Mar 2018
31 Mar 2017
31 Mar 2018
31 Mar 2017
31 Mar 2018
31 Mar 2017
Kent County Council
23,142 22,797 20,865 20,362 22,357 22,595
Other employers
29,633 28,037 18,948 18,286 20,019 19,757
Total 52,775 50,834 39,813 38,648 42,376 42,352
Internal Dispute ProcedureThe Kent Pension Fund has a formal Internal Dispute Procedure to consider a member dispute over a decision made either by a scheme employer or Kent County Council acting as the Administering Authority. An independent person is appointed by each employer to consider an appeal made by a scheme member.
Disputes considered16Appeals upheld3

23 -REPO
RT & A
CC
OU
NTS 2017/2018 - A
DM
INISTRATIO
NThe following table lists contributing employers during 2017-18:
Employers Employer Contributions
£
Employee Contributions
£
Local Authorities and Other Public Bodies
Kent County Council including Schools 68,217,589 20,350,250
Ashford Borough Council 3,250,327 812,522
Canterbury City Council 3,876,403 867,336
Dartford Borough Council 2,560,716 463,723
Dover District Council 3,264,579 621,401
Gravesham Borough Council 2,949,431 744,665
Maidstone Borough Council 3,193,471 831,175
Medway Council 11,167,805 3,931,549
Sevenoaks District Council 3,124,673 701,583
Shepway District Council 2,843,876 612,281
Swale Borough Council 2,518,693 542,582
Thanet District Council 3,715,548 659,605
Tonbridge & Malling Borough Council 2,397,707 463,256
Tunbridge Wells Borough Council 2,356,383 612,064
The Chief Constable of Kent 7,320,667 3,884,606
Commercial Services Kent Limited 772,622 276,119
Gen2 Property Limited 301,778 120,227
Invicta Law Limited 435,245 188,282

24 -REPO
RT & A
CC
OU
NTS 2017/2018 - A
DM
INISTRATIO
NEmployers Employer
Contributions £
Employee Contributions
£
Kent & Essex Sea Fisheries Committee 94,717 27,077
Kent and Medway Fire and Rescue Authority 1,120,394 635,029
Kent Magistrates Courts Committee 1,881,000 -
Medway Commercial Group Limited 85,581 44,573
The Police and Crime Commissioner for Kent 66,059 42,446
Medway (Lower) IDB 67,041 13,205
Medway (Upper) IDB 55,993 12,922
East Kent Housing Arms Length Management Organisation (ALMO) 616,223 261,543
EK Services (Thanet) 780,879 377,734
Ebbsfleet Development Corporation 190,176 97,554
River Stour IDB 37,287 13,799
Romney Marsh Level IDB 23,827 8,044
Parish and Town Councils
Ash Parish Council 1,891 545
Barham Parish Council 1,858 431
Borough Green Parish Council 14,973 3,136
Broadstairs & St Peters Town Council 9,100 -
Chestfield Parish Council 5,936 1,762
Chiddingstone Parish Council 1,722 740
Cranbrook Parish Council 13,973 3,562

25 -REPO
RT & A
CC
OU
NTS 2017/2018 - A
DM
INISTRATIO
NEmployers Employer
Contributions £
Employee Contributions
£
Darenth Parish Council 12,125 2,213
Deal Town Council 21,389 9,470
Ditton Parish Council 22,791 7,465
Dover Town Council 52,274 17,138
Downswood Parish Council 2,635 609
Eastry Parish Council 2,081 587
Edenbridge Town Council 41,762 12,947
Eynsford Parish Council 2,586 1,534
Eythorne Parish Council 2,134 917
Farningham Parish Council 3,709 664
Faversham Town Council 15,525 4,797
Folkestone Town Council 44,139 18,309
Great Chart with Singleton Parish Council 2,960 1,603
Great Mongeham Parish Council 706 199
Harrietsham Parish Council 5,644 2,063
Hartley Parish Council 8,214 3,370
Hawkinge Parish Council 16,451 5,006
Herne & Broomfield Parish Council 10,562 2,304
Hever Parish Council 1,736 620
Higham Parish Council 3,926 1,009

26 -REPO
RT & A
CC
OU
NTS 2017/2018 - A
DM
INISTRATIO
NEmployers Employer
Contributions £
Employee Contributions
£
Hythe Town Council 25,187 7,120
Kings Hill Parish Council 11,139 4,600
Leigh Parish Council 2,690 798
Lydd Town Council 9,646 2,640
Margate Charter Trustees 8,533 2,677
Meopham Parish Council 6,030 1,645
Minster-on-sea Parish Council 7,842 3,762
New Romney Town Council 18,057 3,628
Otford Parish Council 7,243 1,906
Otham Parish Council 1,176 277
Pembury Parish Council 15,585 5,629
Platt Parish Council 2,509 645
Ramsgate Charter Trustees 26,368 8,532
Sandwich Town Council 34,134 9,438
Seal Parish Council 4,044 966
Sevenoaks Town Council 164,094 12,076
Sholden Parish Council 3,552 737
Smeeth Parish Council 3,496 970
Snodland Town Council 17,243 5,180
Southborough Town Council 55,580 13,212
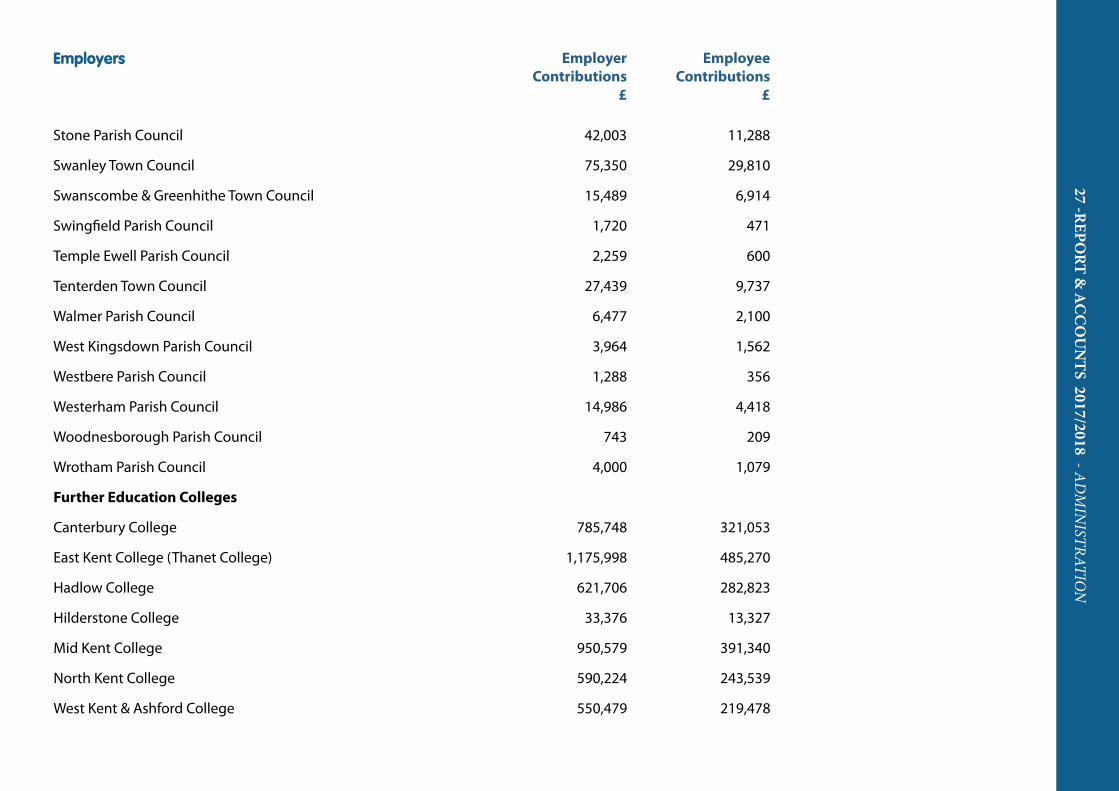
27 -REPO
RT & A
CC
OU
NTS 2017/2018 - A
DM
INISTRATIO
NEmployers Employer
Contributions £
Employee Contributions
£
Stone Parish Council 42,003 11,288
Swanley Town Council 75,350 29,810
Swanscombe & Greenhithe Town Council 15,489 6,914
Swingfield Parish Council 1,720 471
Temple Ewell Parish Council 2,259 600
Tenterden Town Council 27,439 9,737
Walmer Parish Council 6,477 2,100
West Kingsdown Parish Council 3,964 1,562
Westbere Parish Council 1,288 356
Westerham Parish Council 14,986 4,418
Woodnesborough Parish Council 743 209
Wrotham Parish Council 4,000 1,079
Further Education Colleges
Canterbury College 785,748 321,053
East Kent College (Thanet College) 1,175,998 485,270
Hadlow College 621,706 282,823
Hilderstone College 33,376 13,327
Mid Kent College 950,579 391,340
North Kent College 590,224 243,539
West Kent & Ashford College 550,479 219,478

28 -REPO
RT & A
CC
OU
NTS 2017/2018 - A
DM
INISTRATIO
NEmployers Employer
Contributions £
Employee Contributions
£
Voluntary and Charitable Entities, and Private Contractors
Active Life Limited 212,476 68,712
Agilisys Limited 142,060 62,351
Amey Community Limited 125,620 36,419
Amicus Horizon 282,175 28,666
APCOA Parking UK Limited 5,653 2,388
Ashford Leisure Trust 65,550 23,214
Avante Partnership 64,581 8,764
Biffa Municipal Limited (Mid Kent Joint Waste) 38,200 11,132
Birkin Cleaning Services Limited 5,149 1,637
Caldecott Community 99,160 35,236
Canterbury Archaeological Trust 23,375 4,675
Canterbury Christ Church University College 3,953,034 1,495,835
Capita Managed IT Solutions Limited 5,162 1,583
Cater Link Limited 8,492 2,750
Churchill Contract Services Limited 8,112 1,932
Circle 33 Housing Trust Limited (Epic Trust) 18,434 6,032
Circle 33 Housing Trust Limited (Russet Homes) 123,163 27,193
Civica UK Limited 148,719 50,274
Compass Contract Service (UK Ltd) 5,722 1,405

29 -REPO
RT & A
CC
OU
NTS 2017/2018 - A
DM
INISTRATIO
NEmployers Employer
Contributions £
Employee Contributions
£
Enterprise (AOL) Limited 73,646 24,185
Fusion Lifestyle 26,300 9,779
Golding Homes 352,590 163,100
Gravesham Community Leisure 112,996 36,888
Hyde Housing Association 100,000 -
Invicta Telecare Limited 65,850 21,994
Kent College, Canterbury 7,757 1,683
Kent Music School 11,000 -
Kier Facilities Services Limited 32,736 9,192
Kier Limited 6,302 1,183
Medway Community Healthcare CIC 49,427 14,015
Medway Norse Limited 237,093 82,986
MHS Homes 363,256 102,252
Mitie PFI Limited 27,837 10,529
Mitie Security Limited 12,632 3,859
Mytime Active 4,169 2,037
Norwest Holst Limited 7,967 3,286
NSL Limited 27,246 10,323
Orbit South 13,681 4,260
Orchard Theatre Dartford Limited 29,030 11,452

30 -REPO
RT & A
CC
OU
NTS 2017/2018 - A
DM
INISTRATIO
NEmployers Employer
Contributions £
Employee Contributions
£
Pathways to Independence Limited 21,176 4,611
Principal Catering Consultants Ltd 22,534 5,643
Project Salus 33,128 17,881
Rochester Bridge Trust 75,738 23,058
Rochester Care Home Ltd 1,997 626
Sevenoaks Leisure Limited 213,144 96,462
Sevenoaks School 314,383 104,569
Shaw Healthcare (FM Services) 2,077 568
Skanska Construction UK Limited 36,682 10,691
Sodexo Catering 5,577 1,920
Sopra Steria Limited 42,999 17,036
Strode Park Foundation for People with Disabilities 96,492 22,674
Tascor Services Limited 30,823 5,913
TCS (Independent) Limited 1,575 405
Thanet Leisure Force 51,102 14,842
Tonbridge & Malling Leisure Trust 269,744 120,655
Tourism South East 29,639 2,068
Town & Country Group 230,974 64,974
Veolia Limited 21,049 5,524
West Kent Housing Association 1,092,847 289,199

31 -REPO
RT & A
CC
OU
NTS 2017/2018 - A
DM
INISTRATIO
NEmployers Employer
Contributions £
Employee Contributions
£
Westgate Community Trust 2,426 1,038
YBC Cleaning Services Limited 13,377 3,358
Academy Trusts
Academies Enterprise Trust (St James the Great Academy) 32,826 9,158
ACE Learning Trust 179,028 51,249
Aletheia Anglican Academies Trust 375,420 156,723
Amherst School Trust 71,508 21,364
Barnsole Primary Trust 197,594 55,840
Barton Court Academy Trust 238,150 73,139
Borden Grammar School Trust 86,890 25,619
Bradfields Academy Trust 247,500 74,658
Brockhill Park Performing Arts College Trust 165,085 49,089
Brompton Academy Trust 117,074 38,067
Brook Learning Trust 300,928 94,912
Castle Trust (Delce Junior Academy) 101,571 31,054
Chatham & Clarendon Grammar School Trust 191,927 58,236
Chatham Grammar School for Girls Trust 33,626 10,029
Chiddingstone Church of England School Trust 31,839 9,105
Christ Church CE Junior School Ramsgate 50,413 14,268
Christ Church CEP Academy (Folkestone) 78,950 23,679

32 -REPO
RT & A
CC
OU
NTS 2017/2018 - A
DM
INISTRATIO
NEmployers Employer
Contributions £
Employee Contributions
£
Cliffe Woods Primary School Trust 50,081 14,406
Coastal Academies Trust 524,261 158,309
Cranbrook School Trust 311,141 95,535
Cygnus Academies Trust 213,649 61,436
Dartford Grammar School Trust 204,531 61,424
Dover Christ Church Academy Trust 163,307 51,617
DYRMS - An Academy with Military Traditions Trust 355,684 114,830
Education for the 21st Century (E21C) 41,921 12,405
Endeavour MAT 242,895 73,523
Fort Pitt Thomas Aveling Academies Trust 642,436 193,101
Fulston Manor Academies Trust 354,688 101,130
Future Schools Trust 453,215 134,738
Godinton Academy Trust 69,422 19,805
Graveney Primary School Trust 23,314 6,694
Gravesend Grammar School Academies Trust 326,041 96,468
Greenacre Academy Trust 347,981 100,967
Griffin Schools Trust 155,241 44,860
Grove Park Academies Trust 114,717 32,185
Hadlow Rural Community School Limited 31,758 9,054
Hampton Primary School Academy Trust 133,848 38,431

33 -REPO
RT & A
CC
OU
NTS 2017/2018 - A
DM
INISTRATIO
NEmployers Employer
Contributions £
Employee Contributions
£
Herne Bay High School Trust 309,977 94,039
Highsted Academy Trust 68,085 20,966
Highworth Grammar School Trust 129,827 39,122
Hillview School for Girls Academy Trust 166,452 53,218
Inspire Partnership Academy Trust 15,364 4,279
Joydens Wood Infant School Trust 57,808 16,636
Joydens Wood Junior School Trust 42,443 11,890
Jubilee Primary School Trust 33,780 9,248
Kent Catholic School's Partnership 1,641,159 494,070
Knole Academy Trust 154,072 45,954
Leigh Academies Trust 2,176,435 653,371
Luddenham School Trust 41,452 11,667
Maritime Academy Trust 70,865 20,813
Mayfield Grammar School Trust 103,615 30,021
Medway Anglican School Trust 155,774 45,722
Medway UTC (University Technology College) 34,913 10,655
Meopham Community Academies Trust 63,957 18,558
Oakwood Park Grammar School Trust 119,442 39,709
Oasis Community Learning 484,881 146,426
Orchard Academy Trust 115,502 32,292

34 -REPO
RT & A
CC
OU
NTS 2017/2018 - A
DM
INISTRATIO
NEmployers Employer
Contributions £
Employee Contributions
£
Parallel Learning Trust 59,022 18,752
Pathway Academy Trust 144,971 46,113
Peninsula Gateway Academy Trust (Chattenden Primary School) 40,595 12,107
Potential in Everyone Academy Trust 148,830 42,031
Queen Elizabeth's Grammar School Trust (Faversham) 113,643 35,605
Rainham Mark Education Trust 351,167 102,650
REAch2 Academy Trust 354,237 101,255
Rochester Diocesan Multi-Academy Education Trust Limited (Rosherville Church of England Academy)
22,019 6,154
Sandwich Technology School Trust 180,119 52,585
Schools Company Trust 224,337 69,056
Sheldwich Primary School Trust 53,383 15,520
Sir Roger Manwood's School Trust 120,413 36,723
Spires Academy Trust 112,311 34,142
St. Eanswythe's CE Primary School 44,378 12,528
St. James' Church of England Primary Academy 41,034 11,685
St. John's Church of England Primary School Maidstone Trust 73,039 20,436
St. Laurence-in-Thanet Church of England Junior Academy 57,147 16,505
St. Marys COE Primary Academy (Folkestone) 99,216 28,513
St. Stephen's Academy Trust 115,440 40,418
Swale Academies Trust 1,183,220 348,266

35 -REPO
RT & A
CC
OU
NTS 2017/2018 - A
DM
INISTRATIO
NEmployers Employer
Contributions £
Employee Contributions
£
Temple Grove Academy Trust 57,714 16,637
Tenterden School Trust 453,361 138,701
The Abbey School Trust 188,311 54,845
The Academy of Woodlands Trust 192,145 55,336
The Areté Trust 100,141 30,626
The Argent Trust (Danecourt School Academy) 189,094 54,266
The Brent Primary School Trust 96,593 27,491
The Canterbury Academy Trust 417,996 127,807
The Diocese of Canterbury Academies Trust 649,792 188,402
The Dover Federation for the Arts 321,299 94,962
The Folkestone Academy Trust 311,814 90,985
The Folkestone School for Girls Academy Trust 155,255 45,474
The Galaxy Trust 294,086 80,632
The Gateway Primary Academy Trust 28,778 8,003
The Harvey Academy Trust 100,642 31,887
The Howard Academy Trust 419,196 120,684
The Inspiring Change Multi-Academy Trust 50,836 15,229
The Island Learning Trust 263,231 74,353
The John Wallis Church of England Academy, Ashford Trust 290,961 87,974
The Kemnal Academies Trust 1,161,410 349,182

36 -REPO
RT & A
CC
OU
NTS 2017/2018 - A
DM
INISTRATIO
NEmployers Employer
Contributions £
Employee Contributions
£
The Maplesden Noakes School Trust 160,016 48,127
The Marsh Academy Trust 243,186 76,606
The Norton Knatchbull School Academy Trust 128,541 41,235
The Pilgrim Multi Academy Trust 90,718 25,992
The Primary First Trust 181,756 49,885
The Rivermead Inclusive Trust 348,095 99,629
The Skinners' Kent Academy Trust 187,978 61,471
The Skinners' School Academy Trust 99,513 32,932
The Stour Academy Trust 353,215 100,235
The Tenax Schools Trust 299,492 90,430
The Thinking Schools Trust 783,082 231,690
The Village Academy Trust 287,400 80,240
The Wells Free School Trust 24,128 6,468
The Westbrook Trust 164,966 114,699
The Williamson Trust 590,556 178,533
The Woodland Academy Trust 75,811 21,385
TIMU Academy Trust 138,589 38,484
Tonbridge Grammar School Trust 137,405 44,316
Towers School Academy Trust 187,428 57,636
Trinity School and College 85,789 27,328

37 -REPO
RT & A
CC
OU
NTS 2017/2018 - A
DM
INISTRATIO
NEmployers Employer
Contributions £
Employee Contributions
£
Turner Schools 292,531 89,253
United Learning Trust (Wye Free School) 47,999 14,294
University of Kent Academies Trust (UKAT) 208,025 66,888
Valley Invicta Academies Trust 613,678 189,171
Viking Academy Trust 162,045 45,917
Walderslade Girls' School Trust 128,445 37,980
Warden House Primary School Trust 99,416 28,337
Weald of Kent Grammar School Academy Trust 153,104 46,979
Wentworth Primary School Trust 78,374 22,289
West Malling CEP Academy Trust 21,861 6,016
Whinless Down Academy Trust 176,618 49,727
Wilmington Primary School Academy 20,508 5,824
Woodard Academies Trust (St Augustine Academy) 144,668 44,054
Wrotham School Trust 96,407 29,425

38 -REPO
RT & A
CC
OU
NTS 2017/2018 - ACTUA
RY’S REPORT
valuation report dated 31 March 2017.
AssumptionsThe assumptions used to value the liabilities at 31 March 2016 are summarised below: Assumption 31 March 16
Discount rate 5.4% p.a.
Pension increases (CPI) 2.4% p.a.
Salary increases In line with CPI until 31 March 2020 and 3.9% p.a. thereafter
Pension increases on GMP
Funds will pay limited increases for members that have reached SPA by 6 April 2016, with the Government providing the remainder of the inflationary increase. For members that reach SPA after this date, we have assumed that Funds will be required to pay the entire inflationary increases.
Mortality The post retirement mortality assumptions adopted are as follows:
• For members, the S2PA series with a multiplier of 95%, making allowance for CMI 2015 projected improvements and a long-term rate of improvement of 1.5% p.a.
• For dependants, 115% of the S2PMA tables for male dependants and 110% of the S2DFA tables for female dependants, making allowance for CMI 2015 projected improvements and a long-term rate of improvement of 1.5% p.a.
IntroductionThe last full triennial valuation of the Kent County Council Pension Fund was carried out as at 31 March 2016 as required under Regulation 62 of the Local Government Pension Scheme Regulations 2013 (the Regulations) and in accordance with the Funding Strategy Statement of the Fund. The results were published in the triennial valuation report dated 31 March 2017.
Asset value and funding levelAt 31 March 2016, the smoothed value of assets was £4,556m which was 89% of the liabilities valued on an ongoing basis. This corresponded to a deficit of £547m.
Contribution ratesThe contribution rates, in addition to those paid by the members of the Fund, are set to be sufficient to meet:
• The annual accrual of benefits allowing for future pay increases and increases to pensions in payment when these fall due (the primary rate)
• plus an amount to reflect each participating employer’s notional share of the Fund’s assets compared with 100% of their liabilities in the Fund, in respect of service to the valuation date (the secondary rate).
Each employer body participating in the Fund has to pay a contribution rate consisting of the employer’s individual primary rate and a secondary rate reflecting the employer’s particular circumstances and funding position within the Fund. The secondary contribution is as required under Regulation 62(7).
The primary rate of contribution at a whole Fund level was 14.9% of payroll p.a.
Details of each employer’s primary and secondary contribution rates are contained in the Rates and Adjustment Certificate in the triennial

39 -REPO
RT & A
CC
OU
NTS 2017/2018 - ACTUA
RY’S REPORT
Assumption 31 March 16Retirement Each member retires at a single age,
weighted based on when each part of their pension is payable unreduced.
Commutation Members will convert 50% of the maximum possible amount of pension into cash.
Further details of these assumptions can be found in the relevant actuarial valuation report.
Updated position since the 2016 ValuationSince 31 March 2016, investment returns have been higher than assumed at the 2016 triennial valuation. The value placed on the liabilities will, however, have also increased due to the accrual of new benefits as well as a decrease in the real discount rate underlying the valuation funding model. Overall, we expect that the funding level should be slightly higher than at 31 March 2016 although the ongoing cost is likely to have increased due to lower real discount rates.
The next actuarial valuation is due as at 31 March 2019 and the resulting contribution rates required by the employers will take effect from 1 April 2020.
Graeme Muir FFA Partner, Barnett Waddingham LLP

40 -REPO
RT & A
CC
OU
NTS 2017/2018 - FIN
AN
CIAL STATEM
ENTS
Corporate Director of Finance’s ResponsibilitiesThe Corporate Director of Finance is responsible for the preparation of the Superannuation Fund’s Statement of Accounts in accordance with proper practices as set out in the CIPFA / LASAAC Code of Practice on Local Authority Accounting in the United Kingdom (the Code); and is required to give a true and fair view of the financial position of the Superannuation Fund at the accounting date and its income and expenditure for the year ended 31 March 2018.
In preparing this Statement of Accounts the Corporate Director of Finance has:
• selected suitable accounting policies and then applied them consistently
• made judgements and estimates that were reasonable and prudent
• complied with the Code.
The Corporate Director of Finance has also:
• kept proper accounting records which were up to date; and
• taken reasonable steps for the prevention and detection of fraud and other irregularities.
I confirm that these accounts give a true and fair view of the financial position of the Superannuation Fund at the reporting date and its income and expenditure for the year ended 31 March 2018.
Certificate of the Corporate Director of Finance
Cath Head Interim Corporate Director of Finance / Head of Finance (Operations)25 July 2018
Statement of responsibilities for the Statement of AccountsKent County Council’s responsibilities
The Council is required:
• to make arrangements for the proper administration of the Superannuation Fund’s financial affairs and to ensure that one of its officers has the responsibility for the administration of those affairs. In this authority, that officer is the Corporate Director of Finance.
• to manage the Fund’s affairs to secure economic, efficient and effective use of resources and safeguard its assets.
• to approve the statement of accounts.
I confirm that these Accounts were approved by the Governance and Audit Committee at its meeting on 25 July 2018 on behalf of Kent County Council.
Councillor Nick ChardChairman of the Governance and Audit Committee25 July 2018

41 -REPO
RT & A
CC
OU
NTS 2017/2018 - FIN
AN
CIAL STATEM
ENTS
Fund Account for the year ended 31 March
Notes 2017-18 £000’s
2016-17£000’s
Dealings with members, employers and others directly involved in the Fund
Contributions 7 232,037 228,285
Transfers in from other pension funds
8 11,262 10,566
243,299 238,851
Benefits 9 -220,876 -214,895
Payments to and on account of leavers
10 -11,497 -8,054
-232,373 -222,949
Net additions from dealings with members
10,926 15,902
Management expenses 11 -23,285 -22,738
Net additions/withdrawals including fund management expenses
-12,359 -6,836
Returns on investments
Investment income 12 121,717 111,574
Taxes on income -4,929 -4,044
Profits and losses on disposal of investments and changes in the market value of investments
15a 159,242 866,941
Net return on investments 276,030 974,471
Net increase in the net assets available for benefits during the year
263,671 967,635
Net assets statement as at 31 March
Notes 2017-18 £000’s
2016-17£000’s
Investment assets 5,807,787 5,554,683
Investment liabilities -16,857 -12,905
Net investment assets 15 5,790,930 5,541,778
Current assets 24 56,409 37,755
Current liabilities 25 -18,493 -14,358
Net assets available to fund benefits at the period end
5,828,846 5,565,175

42 -REPO
RT & A
CC
OU
NTS 2017/2018 - FIN
AN
CIAL STATEM
ENTS
and Admitted Bodies which participate in the Fund by virtue of an admission agreement made between the Authority and the relevant body. Admitted bodies include voluntary, charitable and similar entities or private contractors undertaking a local authority function following a specific business transfer to the private sector.
There are 321 employers actively participating in the Fund and the profile of members is as detailed below:
Contributors Pensioners Deferred pensioners
31 Mar 2018
31 Mar 2017
31 Mar 2018
31 Mar 2017
31 Mar 2018
31 Mar 2017
Kent County Council
23,142 22,797 20,865 20,362 22,357 22,595
Other employers
29,633 28,037 18,948 18,286 20,019 19,757
Total 52,775 50,834 39,813 38,648 42,376 42,352
FundingThe 2016 valuation certified a common contribution rate of 20.9% of pensionable pay to be paid by each employer participating in the Kent Pension Fund. In addition to this, each employer has to pay an individual adjustment to reflect its own particular circumstances and funding position within the Fund. Details of each employer’s contribution rate are contained in the Statement to the Rates and Adjustment Certificate in the triennial valuation report. These rates came into effect from 1 April 2017.
Notes to the Pension Fund Account
1. Description of the FundThe Kent County Council Superannuation Fund (Kent Pension Fund) is part of the Local Government Pension Scheme (LGPS) and is administered by Kent County Council (KCC) for the purpose of providing pensions and other benefits for the pensionable employees of KCC, Medway Council, the district and borough councils in Kent and a number of other employers within the county area. The Pension Fund is a reporting entity and KCC as the Administering Authority is required to include the Fund’s accounts as a note in its Report and Accounts. Teachers, police officers and firefighters are not included as they come within other national pension schemes. The LGPS is a contributory defined benefit pension scheme.
The Scheme is governed by the Public Service Pensions Act 2013. The Fund is administered in accordance with the following secondary legislation:
• the Local Government Pension Scheme Regulations 2013 (as amended)
• the Local Government Pension Scheme (Transitional Provisions, Savings and Amendments) Regulations 2014 (as amended)
• the Local Government Pension Scheme (Management and Investment of Funds) Regulations 2016.
The Fund is overseen by the Kent County Council Superannuation Fund Committee (the Scheme manager). The Local Pension Board which was established in 2015 assists the Scheme manager to ensure the effective and efficient governance and administration of the Scheme.
MembershipMembership of the LGPS is voluntary and employees are free to choose whether to join or remain in the Scheme or to make personal arrangements outside the Scheme. Employers in the Fund include Scheduled Bodies which are Local Authorities and similar entities whose staff are automatically entitled to be members of the Scheme;

43 -REPO
RT & A
CC
OU
NTS 2017/2018 - FIN
AN
CIAL STATEM
ENTS
2. Basis of preparationThe Statement of Accounts summarises the Fund’s transactions for the 2017-18 financial year and its position at 31 March 2018.
The accounts have been prepared in accordance with the CIPFA Code of Practice on Local Authority Accounting in the United Kingdom 2017-18 which is based upon International Financial Reporting Standards, as amended for the UK public sector. The accounts are prepared on a going concern basis.
The accounts summarise the transactions of the Fund and report on the net assets available to pay pension benefits. The accounts do not take account of obligations to pay pensions and benefits which fall due after the end of the financial year. The actuarial present value of promised retirement benefits, valued on an International Accounting Standard (IAS)19 basis is disclosed at note 23 of these accounts.
3. Summary of significant accounting policiesFund account - revenue recognition
a) Contribution incomeNormal contributions, both from the members and from the employers, are accounted for on an accruals basis at the percentage rate recommended by the fund actuary in the payroll period to which they relate. Employers Deficit funding contributions are accounted for on the due dates on which they are payable under the schedule of contributions set by the scheme actuary or on receipt if earlier than the due date.
Employers’ augmentation contributions and pensions strain contributions are accounted for in the period in which the liability arises. Any amount due in year but unpaid will be classed as a current financial asset. Amounts not due until future years are classed as long-term financial assets.
b) Transfers to and from other schemesTransfer values represent the amounts received and paid during the year for members who have either joined or left the Fund during the financial year and are calculated in accordance with the Local Government
BenefitsPension benefits under the LGPS are based on the following:
Service pre1 April 2008
Membership from 1 April
2008 – 31 March 2014
Membership from
1 April 2014
Pension 1/80 x final pensionable
salary
1/60 x final pensionable
salary
1/49 (or 1/98 if opted for
50/50 section) x career average revalued salary
Lump Sum Automatic
lump sum of 3/80 x final
pensionable salary.
In addition part of the annual
pension can be exchanged for a one-off tax-free cash payment.
A lump sum of £12 is paid for each £1 of pension given
up .
No automatic lump sum.
Part of the annual
pension can be exchanged for a one-off tax-free cash payment.
A lump sum of £12 is paid for each £1 of pension given
up.
No automatic lump sum.
Part of the annual
pension can be exchanged for a one-off tax-free cash payment.
A lump sum of £12 is paid for each £1 of pension given
up.
There is a range of other benefits provided under the Scheme including early retirement, ill health pensions and death benefits. For more details, please refer to the Kent Pension Fund website: www.kentpensionfund.co.uk

44 -REPO
RT & A
CC
OU
NTS 2017/2018 - FIN
AN
CIAL STATEM
ENTS
is included in accrued investment income.
By virtue of Kent County Council being the administering authority, VAT input tax is recoverable on all Fund activities including investment and property expenses.
f) Investment management, administrative, governance and oversight expensesAll expenses are accounted for on an accruals basis. Costs relating to Kent County Council staff involved in the administration, governance and oversight of the Fund, and overheads are incurred by the County Council and recharged to the Fund at the end of the year. Fees of the external investment managers and custodian are agreed in the respective mandates governing their appointments. Broadly these are based on the market value of the investments under their management and therefore increase or reduce as the value of these investments change.
Net Assets Statement
g) Financial and non financial assetsFinancial assets are included in the Net Assets Statement on a fair value basis as at the reporting date. A financial asset is recognised in the Net Assets Statement on the date the Fund becomes party to the contractual acquisition of the asset. Any purchase or sale of securities is recognised upon trade and any unsettled transactions at the year-end are recorded as amounts receivable for sales and amounts payable for purchases. From the trade date any gains or losses arising from changes in the fair value of the asset are recognised by the Fund. The values of investments as shown in the net assets statement have been determined at fair value in accordance with the requirements of the Code and IFRS 13 and IFRS 9. For the purposes of disclosing levels of fair value hierarchy, the fund has adopted the classification guidelines recommended in Practical Guidance on Investment Disclosures (PRAG/Investment Association, 2016).
The values of investments as shown in the Net Assets Statement have been determined as follows:
• Quoted investments are stated at market value based on the closing
Pension Scheme Regulations. Individual transfers in/out are accounted for when received/paid, which is normally when the member liability is accepted or discharged. Transfers in from members wishing to use the proceeds of their additional voluntary contributions to purchase scheme benefits are accounted for on a receipts basis and are included in ‘transfers in’. Bulk transfers are accounted for on an accruals basis in accordance with the terms of the transfer agreement.
c) Investment incomeDividends, interest, and stock lending income on securities have been accounted for on an accruals basis and where appropriate from the date quoted as ex-dividend (XD). Changes in the net market value of investments are recognised as income and comprise all realised and unrealised profits/losses during the year. A large number of the Fund’s investments are held in income accumulating funds that do not distribute income. The accumulated income on such investments is reflected in the unit market price at the end of the year and is included in the realised and unrealised gains and losses during the year. Property related income mainly comprises of rental income which is recognised when it becomes due.
Fund account - expense items
d) Benefits payablePensions and lump-sum benefits payable include all amounts known to be due as at the year end. Any amounts due but unpaid are disclosed in the Net Assets Statement as current liabilities.
e) TaxationThe Fund has been accepted by the HM Revenue and Customs as a registered pension scheme in accordance with paragraph 1(1) of Schedule 36 to the Finance Act 2004 and, as such, qualifies for exemption from tax on interest received and from capital gains tax on proceeds of investments sold. Tax is therefore only applicable to dividend income from equity investments. Income arising from overseas investments is subject to deduction of withholding tax unless exemption is permitted by and obtained from the country of origin. Investment income is shown net of non-recoverable tax, and any recoverable tax at the end of the year

45 -REPO
RT & A
CC
OU
NTS 2017/2018 - FIN
AN
CIAL STATEM
ENTS
h) DerivativesThe Fund uses derivative instruments to manage its exposure to specific risks arising from its investment activities. The Fund does not hold derivatives for speculative purposes. At the reporting date the Fund only held forward currency contracts. The future value of the forward currency contracts is based on market forward exchange rates at the year-end date and determined as the gain or loss that would arise if the outstanding contract were matched at the year-end with an equal and opposite contract. Under the European Market Infrastructure Regulations the Fund’s forward currency contracts are required to be covered by margin cash. These amounts are included in cash or cash equivalents held by the Fund and reflected in a corresponding margin cash liability under investment liabilities.
i) Foreign currency transactionsAssets and liabilities in foreign currency are translated into sterling at spot market exchange rates ruling at the year-end. All foreign currency transactions including income are translated into sterling at spot market exchange rates ruling at the transaction date. All realised currency exchange gains or losses are included in change in market value of assets.
j) Cash and cash equivalentsCash comprises cash at bank and demand deposits. Cash equivalents are short-term, highly liquid investments that are readily convertible to known amounts of cash and that are subject to minimal risk of changes in value. Cash and cash equivalents managed by fund managers and cash equivalents managed by Kent County Council are included in investments. All other cash is included in Current Assets.
k) Financial liabilitiesThe Fund recognises financial liabilities at fair value as at the reporting date. A financial liability is recognised in the Net Assets Statement on the date the fund becomes party to the liability. From this date any gains or losses arising from changes in the fair value of the liability are recognised by the Fund.
bid price quoted on the relevant stock exchange on the final day of the accounting period.
• Fixed interest securities are recorded at net market value based on their current yields.
• Investments in unquoted property and infrastructure pooled funds are valued at the net asset value or a single price advised by the fund manager.
• Investments in private equity funds and unquoted listed partnerships are valued based on the Fund’s share of the net assets in the private equity fund or limited partnership using the latest financial statements published by the respective fund managers. The valuation standards followed by the managers are in accordance with the industry guidelines and the constituent management agreements. Such investments may not always be valued based on year end valuation as information may not be available, and therefore will be valued based on the latest valuation provided by the managers adjusted for cash movements to the year end.
• Pooled investment vehicles are valued at closing bid price if both bid and offer prices are published; or if single priced, at the closing single price. In the case of pooled investment vehicles that are accumulation funds, the change in market value also includes income which is reinvested in the fund.
• The Freehold and Leasehold properties were valued at open market prices in accordance with the valuation standards laid down by the Royal Institution of Chartered Surveyors. The last valuation was undertaken by Colliers International, as at 31 December 2017. The valuer’s opinion of market value and existing use value was primarily derived using comparable recent market transactions on arm’s length terms. The results of the valuation have then been indexed in line with the Investment Property Databank Monthly Index movement to 31 March 2018.
• Debtors / receivables being short duration receivables with no stated interest rate are measured at original invoice amount.

46 -REPO
RT & A
CC
OU
NTS 2017/2018 - FIN
AN
CIAL STATEM
ENTS
market value in net assets on the basis that they will be returned to the Fund at the end of the loan term. Net income from securities lending received from the custodian is shown as income from investments in the Fund Account.
4. Critical judgements in applying accounting policyThe net pension fund liability is recalculated every three years by the appointed actuary, with annual updates in the intervening years. The methodology used is in line with accepted guidelines.
This estimate is subject to significant variances based on changes to the underlying assumptions which are agreed with the actuary and have been summarised in Note 22.
These actuarial revaluations are used to set future contribution rates and underpin the fund’s most significant investment management policies, for example in terms of the balance struck between longer term investment growth and short-term yield/return.
l) Actuarial present value of promised retirement benefitsThe actuarial present value of promised retirement benefits is assessed every three years by the scheme actuary and the methodology used is in line with accepted guidelines and in accordance with IAS 19. To assess the value of the Fund’s liabilities as at 31 March 2018 the actuary has rolled forward the value of the Fund’s liabilities calculated for the funding valuation as at 31 March 2016. As permitted under IAS 26, the Fund has opted to disclose the actuarial present value of promised retirement benefits by way of a note to the Net Assets Statement (Note 23).
m) Contingent assets and liabilities and contractual commitmentsA contingent asset/liability arises where an event has taken place that gives the Fund a possible right/obligation whose existence will only be confirmed by the occurrence or otherwise of uncertain future events not wholly within the control of the Fund. Contingent assets/liabilities also arise in circumstances where a provision would otherwise be made but either it is not probable that an inflow/outflow of resources will be required or the amount of the right/obligation cannot be measured reliably. Contingent assets/liabilities are not recognised in the balance sheet but disclosed in a note to the accounts.
n) Pooling expensesThe Fund is part of ACCESS, a group of 11 LGPS Administering Authorities who, as part of a Government initiative, have agreed to pool their investments to achieve cost and scale benefits. Pooling costs included in the Fund’s accounts reflect the Fund’s proportion of the cost of setting up the governance arrangements of the Pool and the initial costs of establishing an Authorised Contractual Scheme (ACS) to hold the pooled assets. Currently these are initial project costs and are expected to be replaced and supplemented by ongoing governance costs once the investments are migrated into the ACS.
o) Stock lendingThe Fund has a conservative programme of stock lending operated by its custodian. The programme lends directly held global equities and bonds to approved borrowers against a collateral of Government and Supranational fixed interest securities of developed countries, which is marked to market on a daily basis. Securities on loan are included at

47 -REPO
RT & A
CC
OU
NTS 2017/2018 - FIN
AN
CIAL STATEM
ENTS
Item Uncertainties Effect if actual results differ from assumption
Freehold and Leasehold Property and Pooled Property Funds
Valuation techniques are used to determine the fair values of directly held property and pooled property funds. Where possible these valuation techniques are based on observable data, but where this is not possible management uses the best available data. Changes in the valuation assumptions used, together with significant changes in rental growth, vacancy levels or the discount rate could affect the fair value of property.
The effect of variations in the factors supporting the valuation would be an increase or decrease in the value of directly held property of £48m on a fair value of £484m.
6. Events after the balance sheet dateThere have been no events since 31 March 2018, up to the date when these accounts were authorised, that require any adjustment to these accounts.
7. Contributions receivable2017-18
£000’s2016-17
£000’sBy Category
Employers 179,165 176,603
Members 52,872 51,682
232,037 228,285
5. Assumptions made about future and other major sources of estimation uncertainty
Item Uncertainties Effect if actual results differ from assumption
Actuarial present value of promised retirement benefits
Estimation of the net liability to pay pensions depends on a number of complex judgements relating to the discount rate used, the rate at which salaries are projected to increase, changes in retirement ages, mortality rates and expected returns on Pension Fund assets. A firm of consulting actuaries is engaged to provide the Fund with expert advice about assumptions to be applied.
The effects on the net pension liability of changes in individual assumptions can be measured. For instance, a 0.1% increase in the discount rate assumption would result in a decrease in the pension liability of £168m. A 0.1% increase in assumed earning inflation would increase the value of liabilities by approx. £16m, and a one year increase to the life expectancy assumptions would increase the liability by approx. £339m.
Private Equity Valuation of unquoted private equity including infrastructure investments is highly subjective and inherently based on forward looking estimates and judgements involving many factors. They are valued by the investment managers using guidelines set out in the British Venture Capital Association.
The total private equity including infrastructure investments on the financial statements are £129m. There is a risk that this investment may be under-or-over stated in the accounts. Potential change in valuation due to change in these factors is estimated in Note 20.

48 -REPO
RT & A
CC
OU
NTS 2017/2018 - FIN
AN
CIAL STATEM
ENTS
2017-18£000’s
2016-17£000’s
By authorityKent County Council 92,591 91,649
Scheduled Bodies 126,629 122,789
Admitted Bodies 12,817 13,847
232,037 228,285
By type
Employees - normal contributions
52,872 51,682
Employers - normal contributions
123,336 109,564
Employers - deficit recovery contributions
50,546 61,226
Employers - augmentation contributions
5,283 5,813
232,037 228,285
8. Transfers in from other pension funds2017-18
£000’s2016-17
£000’sIndividual 11,262 10,566
Group 0 0
11,262 10,566
9. Benefits payable2017-18
£000’s2016-17
£000’sBy Category
Pensions 184,721 176,065
2017-18£000’s
2016-17£000’s
Retirement commutation and lump sum benefits
32,003 34,194
Death benefits 4,152 4,636
220,876 214,895
By authority
Kent County Council 103,583 101,829
Scheduled Bodies 104,529 101,253
Admitted Bodies 12,764 11,813
220,876 214,895
10. Payments to and on account of leavers2017-18
£000’s2016-17
£000’sGroup transfers 0 0
Individual transfers 10,269 6,568
Payments for members joining state scheme
73 273
Refunds of contributions 1,155 1,213
11,497 8,05411. Management expenses
Notes 2017-18£000’s
2016-17£000’s
Administration costs 2,667 2,752
Governance and oversight costs 369 378
Investment management expenses 14 20,140 19,485
Audit Fees 31 31
Pooling expenses 78 92
23,285 22,738

49 -REPO
RT & A
CC
OU
NTS 2017/2018 - FIN
AN
CIAL STATEM
ENTS
12. Summary of income from Investments
Notes 2017-18 2016-17£000’s % £000’s %
Bonds 15,235 12.5 15,694 14.1
Equities 61,986 50.9 57,164 51.2
Pooled Investments 11,878 9.7 10,351 9.3
Private Equity / Infrastructure
7,444 6.1 5,976 5.4
Property 13 17,107 14.1 13,549 12.1
Pooled Property Investments
6,273 5.2 7,480 6.7
Cash and cash equivalents
630 0.5 315 0.3
Stock Lending 1,164 1.0 1,045 0.9
Total 121,717 100.0 111,574 100.0
13. Property income and expenditure2017-18
£000’s2016-17
£000’sRental income from investment properties
21,419 20,995
Direct operating expenses
-4,312 -7,446
Net operating income from property
17,107 13,549
14. Investment management expenses2017-18
£000’s2016-17
£000’sInvestment Managers fees 18,573 18,170Transaction costs 1,491 1,232Custody fees 76 83Total 20,140 19,485
The management fees disclosed above include all investment management fees directly incurred by the fund including those charged on pooled fund investments.
In addition to the transaction costs disclosed above, indirect costs are incurred through the bid-offer spread on investments within pooled investment vehicles. The amount of indirect costs is not separately provided to the Pension Fund.

50 -REPO
RT & A
CC
OU
NTS 2017/2018 - FIN
AN
CIAL STATEM
ENTS
15. InvestmentsMarket Value
as at 31 March 18
£000’s
Market Value as at
31 March 17£000’s
Investment Assets
Bonds 353,090 339,752
Equities 2,224,616 2,192,637
Pooled Investments 2,195,389 2,030,342
Private Equity/Infrastructure 128,895 137,717
Property 484,241 468,827
Pooled Property Investments 247,201 230,129
Derivative contracts
- Forward Currency contracts 5,593 2,905
Investment Cash and cash equivalents
148,514 121,323
Investment Income due 17,995 16,948
Amounts receivable for sales 2,253 14,103
Total Investment Assets 5,807,787 5,554,683
Investment LiabilitiesAmounts payable for purchases -8,864 -12,905
Margin cash liability -7,993 0
Total Investment Liabilities -16,857 -12,905
Net Investment Assets 5,790,930 5,541,778

51 -REPO
RT & A
CC
OU
NTS 2017/2018 - FIN
AN
CIAL STATEM
ENTS
15a. Reconciliation of movements in investments and derivatives
Market Value as at 31 Mar 17
Purchases at cost Sales proceeds Change in market value
Market value as at 31 Mar 18
£000’s £000’s £000’s £000’s £000’s
Bonds 339,752 96,357 -51,109 -31,910 353,090
Equities 2,192,637 462,950 -569,918 138,947 2,224,616
Pooled Investments 2,030,342 822,973 -615,671 -42,255 2,195,389
Private Equity/Infrastructure 137,717 13,891 -33,963 11,250 128,895
Property 468,827 0 -19,728 35,142 484,241
Pooled Property Investments 230,129 14,236 -16,157 18,993 247,201
5,399,404 1,410,407 -1,306,546 130,167 5,633,432
Derivative contracts
- Forward Currency contracts 2,905 7,540,507 -7,567,732 29,913 5,593
5,402,309 8,950,914 -8,874,278 160,080 5,639,025
Other Investment balances
- Investment cash and cash equivalents 121,323 -838 148,514
- Amounts receivable for sales 14,103 2,253
- Amounts payable for purchases -12,905 -8,864
- Margin cash liability 0 -7,993
- Investment Income due 16,948 17,995
Net Investment Assets 5,541,778 159,242 5,790,930

52 -REPO
RT & A
CC
OU
NTS 2017/2018 - FIN
AN
CIAL STATEM
ENTS
Market Value as at 31 Mar 16
Purchases at cost Sales proceeds Change in market value
Market value as at 31 Mar 17
£000’s £000’s £000’s £000’s £000’s
Bonds 310,896 51,750 -75,882 52,988 339,752
Equities 1,732,669 335,891 -312,898 436,975 2,192,637
Pooled Investments 1,664,750 67,233 -67,189 365,548 2,030,342
Private Equity/Infrastructure 114,699 17,732 -12,677 17,963 137,717
Property 438,105 314 0 30,408 468,827
Pooled Property Investments 226,697 0 -269 3,701 230,129
4,487,816 472,920 -468,915 907,583 5,399,404
Derivative contracts
- Forward Currency contracts 7,607 7,149,625 -7,112,846 -41,481 2,905
4,495,423 7,622,545 -7,581,761 866,102 5,402,309
Other Investment balances
- Investment Cash and cash equivalents 70,117 839 121,323
- Amounts receivable for sales 4,214 14,103
- Amounts payable for purchases -5,300 -12,905
- Margin cash liability 0 0
- Investment Income due 12,702 16,948
Net Investment Assets 4,577,156 866,941 5,541,778

53 -REPO
RT & A
CC
OU
NTS 2017/2018 - FIN
AN
CIAL STATEM
ENTS
Market Value as
at 31 Mar 18
Market Value as
at 31 Mar17
£000’s £000’s
Property 484,241 468,827
Property Unit Trusts 247,201 230,129
Private Equity Funds/Infrastructure 128,895 137,717
860,337 836,673
Derivatives 5,593 2,905
Cash and cash equivalents 148,514 121,323
Investment income due 17,995 16,948
Amounts receivable for sales 2,253 14,103
174,355 155,279
Total Investment Assets 5,807,787 5,554,683
Investment Liabilities
Amounts payable for purchases -8,864 -12,905
Margin cash liability -7,993 0
Total Investment Liabilities -16,857 -12,905
Net investment assets 5,790,930 5,541,778
16. Analysis of InvestmentsMarket
Value as at
31 Mar 18
Market Value as
at 31 Mar17
£000’s £000’sBonds
UK
Corporate Quoted 24,213 17,301
Overseas
Public Sector Quoted 42,724 40,223
Corporate Quoted 286,153 282,228
353,090 339,752
Equities
UK
Quoted 957,184 957,638
Overseas
Quoted 1,267,432 1,234,999
2,224,616 2,192,637
Pooled Funds
UK
Fixed Income Unit Trusts 246,993 241,654
Unit Trusts 617,014 651,716
Overseas
Unit Trusts 1,331,382 1,136,972
2,195,389 2,030,342

54 -REPO
RT & A
CC
OU
NTS 2017/2018 - FIN
AN
CIAL STATEM
ENTS
16a. Analysis of Derivative Contracts Objectives and policy for holding derivatives
Most of the holding in derivatives is to hedge liabilities or hedge exposures to reduce risk in the Fund. Derivatives may be used to gain exposure to an asset more efficiently than holding the underlying asset. The use of derivatives is managed in line with the investment management agreement agreed between the Fund and the investment manager.
Open forward currency contracts
In order to maintain appropriate diversification and to take advantage of overseas investment returns, a significant portion of the Fund’s fixed income portfolio managed by Goldman Sachs Asset Management is invested in overseas securities. To reduce the volatility associated with fluctuating currency rates, the investment manager fully hedges the overseas, excluding emerging markets, exposure of the portfolio. This is approximately 75% of the portfolio managed by Goldman Sachs.
Settlement Currency bought Local value Currency sold Local value Asset value Liability value£000’s £000’s £000’s £000’s
Up to one month CHF 1,000 GBP 742 2
Up to one month USD 203,803 GBP 145,012 258
Up to one month USD 203,803 GBP 144,983 287
Up to one month EUR 17,106 GBP 14,973 26
Up to one month USD 508 GBP 359 3
Up to one month USD 392 GBP 278 1
Up to one month USD 777 GBP 552 2
Up to one month USD 2,102 GBP 1,497 1
Up to one month USD 2,226 GBP 1,606 -19
Up to one month USD 1,890 GBP 1,360 -13
Up to one month USD 958 GBP 690 -7
Up to one month GBP 359 USD 508 -3
Up to one month GBP 689 USD 975 -6
Up to one month GBP 745 CHF 1,000 0
Up to one month GBP 1,433 USD 2,033 -16

55 -REPO
RT & A
CC
OU
NTS 2017/2018 - FIN
AN
CIAL STATEM
ENTS
Settlement Currency bought Local value Currency sold Local value Asset value Liability value£000’s £000’s £000’s £000’s
Up to one month GBP 386 USD 539 2
Up to one month GBP 1,198 USD 1,674 5
Up to one month GBP 500 USD 696 4
Up to one month GBP 1,363 USD 1,886 19
Up to one month GBP 1,358 USD 1,886 14
Up to one month GBP 630 USD 875 6
One to Six months GBP 1,015 USD 1,398 18
One to Six months GBP 15,201 EUR 17,128 183
One to Six months GBP 146,901 USD 202,275 2,719
One to Six months GBP 146,859 USD 202,275 2,677
One to Six months GBP 144,811 USD 203,803 -287
One to Six months GBP 144,843 USD 203,803 -255
One to Six months GBP 743 CHF 1,000 -2
One to Six months GBP 14,984 EUR 17,106 -26
6,227 -634
Net forward currency contracts at 31 March 2018 5,593
Prior year comparative
Open forward currency contracts at 31 March 2017 2,973 -68
Net forward currency contracts at 31 March 2017 2,905

56 -REPO
RT & A
CC
OU
NTS 2017/2018 - FIN
AN
CIAL STATEM
ENTS
16b. Property HoldingsYear ending 31 March 18
Year ending 31 March 17
£000’s £000’s
Opening Balance 468,827 438,105
Additions 0 314
Disposals -19,728 0
Net increase in market value 35,142 30,408
Closing Balance 484,241 468,827
There are no restrictions on the realisability of the property or the remittance of income or proceeds on disposal and the Fund is not under any contractual obligation to purchase, construct or develop these properties. As at 31 March 2018, the Fund had exchanged contracts for the purchase of a property at Trafford Park Manchester, which was completed on 3 April 2018 at a purchase price of £11.5m.
The future minimum lease payments receivable by the Fund are as follows:
Year ending 31 March 18
Year ending 31 March 17
£000’s £000’sWithin one year 19,928 20,547
Between one and five years 58,943 63,622
Later than five years 65,086 88,650
143,957 172,819
17. Investments analysed by Fund Manager
Market value as at 31 March 2018
Market value as at 31 March 2017
£000’s % £000’s %Baillie Gifford 1,169,875 20.1 1,201,818 21.7
DTZ 539,450 9.3 520,265 9.4
Fidelity 121,047 2.1 109,577 2.0
Goldman Sachs 368,217 6.4 354,877 6.4
HarbourVest 67,867 1.1 65,469 1.2
Impax 44,550 0.8 42,993 0.8
Kames 52,615 0.9 60,596 1.1
M&G 338,730 5.9 330,157 6.0
Partners Group 38,173 0.7 57,191 1.0
BMO (Pyrford) 409,629 7.1 218,498 3.9
Sarasin 230,105 4.0 215,589 3.9
Schroders 1,423,802 24.6 1,408,560 25.4
State Street 0 0.0 589,586 10.6
UBS 602,911 10.4 0 0.0
YFM 22,855 0.4 15,056 0.3
Kent County Council Investment Team
86,799 1.5 34,939 0.6
Woodford 274,305 4.7 316,607 5.7
5,790,930 100 5,541,778 100
All the external fund managers above are registered in the United Kingdom. During the year the Fund’s passive equity investments with State Street were transferred to UBS as part of the ACCESS Pooling project. £200m was also transferred from Baillie Gifford to Pyrford.

57 -REPO
RT & A
CC
OU
NTS 2017/2018 - FIN
AN
CIAL STATEM
ENTS
17a. Single investments exceeding 5% of net assets available for benefits
Investments 31 March 2018£000’s % (of net
assets)UBS Life UK Equity Tracker Fund 315,980 5.4
M&G Global Dividend Fund 315,095 5.4
BMO Investments Ireland (Plc) Global Total Return Fund
409,629 7
Investments 31 March 2017£000’s % (of net
assets)MPF UK Equity Index Sub-Fund 311,495 5.6
CF Woodford Equity Income Fund 316,607 5.7
M&G Global Dividend Fund 316,673 5.7
Schroder GAV Unit Trust 280,716 5
18. Stock lendingThe Custodians undertake a conservative programme of stock lending to approved UK counterparties against non-cash collateral mainly comprising of Sovereigns and Treasury Bonds.
The amount of securities on loan at year end, analysed by asset class and a description of the collateral is set out in the table below.
Loan type 31 March 2018Market value
£000’sCollateral
value £000’sCollateral type
Equities 214,815 226,963 Treasury Notes and otherGovernment debt
Bonds 18,042 19,062 Treasury Notes and otherGovernment debt
232,857 246,025
Loan type 31 March 2017Market value
£000’sCollateral
value £000’sCollateral type
Equities 156,014 165,118 Treasury Notes and otherGovernment debt
Bonds 12,460 13,187 Treasury Notes and otherGovernment debt
168,474 178,305

58 -REPO
RT & A
CC
OU
NTS 2017/2018 - FIN
AN
CIAL STATEM
ENTS
31 March 2018 31 March 2017Designated
as fair value through profit
and loss
Loans and receivables
Financial liabilities at
amortised cost
Designated as fair value
through profit and loss
Loans and receivables
Financial liabilities at
amortised cost
£000’s £000’s £000’s £000’s £000’s £000’sFinancial Assets
Bonds 353,090 339,752
Equities 2,224,616 2,192,637
Pooled Investments 2,195,389 2,030,342
Property Pooled Investments 247,201 230,129
Private Equity/Infrastructure 128,895 137,717
Derivative contracts 5,593 2,905
Cash & Cash equivalents 176,232 132,102
Other Investment Balances 20,248 31,051
Debtors/ Receivables 28,692 26,975
5,154,784 225,172 0 4,933,482 190,128 0
Financial Liabilities
Other Investment balances -16,857 -12,905
Creditors -18,493 -14,358
0 0 -35,350 0 0 -27,263
Total 5,154,784 225,172 -35,350 4,933,482 190,128 -27,263
19. Financial Instruments
19a. Classification of Fianncial InstrumentsThe following table analyses the carrying amounts of financial assets and liabilities by category and Net Assets Statement heading.

59 -REPO
RT & A
CC
OU
NTS 2017/2018 - FIN
AN
CIAL STATEM
ENTS
19b. Net Gains and Losses on Financial Instruments31 March 18 31 March 17
£000’s £000’sFinancial assets
Fair value through profit and loss 124,938 835,694
Loans and Receivables (838) 839
Total 124,100 836,533
20. Valuation of assets and liabilities carried at Fair ValueThe basis of the valuation of each class of investment asset is set out below. There has been no change in the valuation techniques used during the year. All assets have been valued using fair value techniques which represent the highest and best price available at the reporting date.
Description of Asset
Valuation Hierarchy
Basis of Valuation Observable and unobservable inputs
Key sensitivities affecting the valuation provided
Quoted Equities 1 Bid Market price on last day of accounting period
Not required Not required
Quoted Bonds 1 Market value on last day of accounting period
Not required Not required
Quoted Pooled Investments
1 Net Asset Value/Bid prices on last day of accounting period
Net Asset Values Not required
Unquoted Pooled Investments
2 Net Asset Value/Bid prices on last day of accounting period
Net Asset Values Not required
Private Equity and Infrastructure Funds
3 Fair values as per International Private equity and venture capital guidelines (2012)
Valuation of underlying investment/assets/ companies/EBITDA multiples
Estimation techniques used in valuations, changes in market conditions, industry specific conditions
Property 2 Independent valuation by Colliers using RICS valuation standards
Market values of similar properties, existing lease terms estimated rental growth, estimated vacancies
Not required
Forward exchange contracts
2 Market forward exchange rates on the last day of accounting period
Exchange rate risk Not required

60 -REPO
RT & A
CC
OU
NTS 2017/2018 - FIN
AN
CIAL STATEM
ENTS
Sensitivity of assets valued at level 3
Having analysed historical data and current market trends, and consulted with independent investment advisors, the Fund has determined that the valuation methods described above, are likely to be accurate to within the following ranges, and has set out overleaf the consequent potential impact on the closing value of investments held at 31 March 2018.
Assessed valuation range
Value as at 31 March 2018
Value on increase Value on decrease
(+/-) £000’s £000’s £000’sPrivate Equity 20% 90,722 108,866 75,602
Infrastructure 20% 38,173 45,808 31,811
Assessed valuation range
Value as at 31 March 2017
Value on increase Value on decrease
(+/-) £000’s £000’s £000’sPrivate Equity 20% 80,526 96,630 64,420
Infrastructure 20% 57,191 68,629 47,659
20a. Fair Value Hierarchy
Level 1Assets and Liabilities at Level 1 are those where the fair values are derived from unadjusted quoted prices in active markets for identical assets or liabilities. Investments include quoted equities, quoted fixed interest securities, quoted index linked securities and quoted unit trusts.
Level 2Assets and Liabilities at Level 2 are those where quoted market prices are not available or where valuation techniques are used to determine fair value. These techniques use inputs that are based significantly on observable market data. Investments include Derivatives, Direct Property Investments and Property Unit Trusts.
Level 3Assets and Liabilities at Level 3 are those where at least one input that could have a significant effect on the instrument’s valuation is not based on observable market data and are valued using various valuation techniques that require significant judgement in determining appropriate assumptions. They include private equity and infrastructure investments the values of which are based on valuations provided by the General Partners to the funds in which the Pension Fund has invested. Assurances over the valuation are gained from the independent audit of the accounts.

61 -REPO
RT & A
CC
OU
NTS 2017/2018 - FIN
AN
CIAL STATEM
ENTS
These valuations are prepared by the fund managers in accordance with generally accepted accounting principles and the requirements of the law where these companies are incorporated. Valuations are usually undertaken periodically by the fund managers, who provide a detailed breakdown of the valuations of underlying assets as well as a reconciliation of movements in fair values. Cash flow adjustments are used to roll forward the valuations where the latest valuation information is not available at the time of reporting.
The table overleaf provides an analysis of the assets and liabilities of the Pension Fund grouped into levels 1 to 3, based on the level at which the fair value is observable.
Values at 31 March 2018 Quoted market price
Using observable inputs
With significant unobservable
inputs
Total
Level 1£000’s
Level 2£000’s
Level 3£000’s £000’s
Assets
Financial assets at fair value through profit and loss 4,773,095 252,794 128,895 5,154,784
Non-Financial assets at fair value through profit and loss 0 484,241 0 484,241
Financial liabilities at fair value through profit and loss 0 0 0 0
Net Investment Assets 4,773,095 737,035 128,895 5,639,025
Values at 31 March 2017 Quoted market price
Using observable inputs
With significant unobservable
inputs
Total
Level 1£000’s
Level 2£000’s
Level 3£000’s £000’s
Assets
Financial assets at fair value through profit and loss 4,562,731 233,034 137,717 4,933,482
Non- Financial assets at fair value through profit and loss 0 468,827 0 468,827
Financial liabilities at fair value through profit and loss 0 0 0 0
Net Investment Assets 4,562,731 701,861 137,717 5,402,309

62 -REPO
RT & A
CC
OU
NTS 2017/2018 - FIN
AN
CIAL STATEM
ENTS
Reconciliation of fair value measurementswithin level 3
Total£000’s
Market Value 1 April 2017 137,717
Transfers into level 3 0
Transfers out of level 3 0
Purchases during the year 13,891
Sales during the year -33,963
Unrealised gains / losses 4,407
Realised gains/losses 6,843
Market Value 31 March 2018 128,895
21. Nature and extent of risks arising from financial instruments
Risk and risk managementThe Fund’s primary long-term risk is that the value of its assets will fall short that of its liabilities (i.e. promised benefits payable to members). Therefore the aim of investment risk management is to minimise the risk of an overall reduction in the value and to maximise the opportunity for gains across the whole Fund portfolio. The Fund achieves this through asset diversification to reduce exposure to market risk (price risk, currency risk and interest rate risk) and credit risk to an acceptable level. In addition, the Fund manages its liquidity risk to ensure there is sufficient liquidity to meet the Fund’s forecast cash flows. The Council manages these investment risks as part of its overall pension fund risk management programme.
Responsibility for the Fund’s risk management strategy rests with the Superannuation Fund Committee. Risk management policies are established to identify and analyse the risks faced by the Council’s pensions operations. Policies are reviewed regularly to reflect changes in
activity and in market conditions.
a) Market riskMarket risk is the risk of loss from fluctuations in equity and commodity prices, interest and foreign exchange rates and credit spreads. The Fund is exposed to market risk from its investment activities, particularly through its equity holdings. The level of risk exposure depends on market conditions, expectations of future price and yield movements and the asset mix. The objective of the Fund’s risk management strategy is to identify, manage and control market risk exposure within acceptable parameters, whilst optimising the return on risk. In general, excessive volatility in market risk is managed through diversification of the portfolio in terms of geographical and industry sectors and individual securities. To mitigate market risks, the Council and its investment advisors undertake appropriate monitoring of market conditions and benchmark analysis.
Other price riskOther price risk represents the risk that the value of a financial instrument will fluctuate as a result of changes in market prices (other than those arising from interest rate risk or foreign exchange risk), whether those changes are caused by factors specific to the individual instrument or its issuer or factors affecting all such instruments in the market. The Fund is exposed to security and derivative price risks. This arises from investments held by the Fund for which the future price is uncertain. All security investments present a risk of loss of capital. Except for shares sold short, the maximum risk resulting from financial instruments is determined by the fair value of the financial instruments. The possible loss from shares sold short is unlimited. The Fund’s investment managers mitigate this price risk through diversification and the selection of securities and other financial instruments and their activity is monitored by the Council to ensure it is within limits specified in the Fund Investment Strategy.
Other price risk - sensitivity analysisFollowing analysis of historical data and expected investment return movement during the financial year, in consultation with the Fund’s investment advisors, the Council has determined that the following
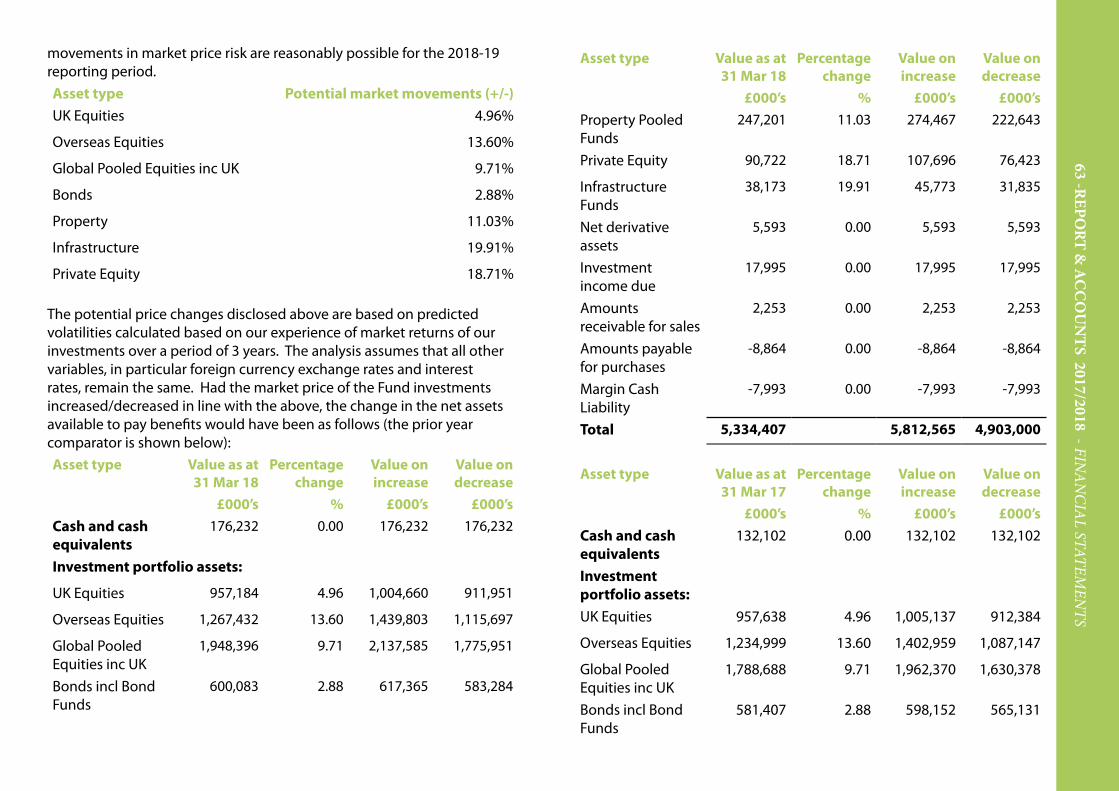
63 -REPO
RT & A
CC
OU
NTS 2017/2018 - FIN
AN
CIAL STATEM
ENTS
movements in market price risk are reasonably possible for the 2018-19 reporting period.Asset type Potential market movements (+/-)UK Equities 4.96%
Overseas Equities 13.60%
Global Pooled Equities inc UK 9.71%
Bonds 2.88%
Property 11.03%
Infrastructure 19.91%
Private Equity 18.71%
The potential price changes disclosed above are based on predicted volatilities calculated based on our experience of market returns of our investments over a period of 3 years. The analysis assumes that all other variables, in particular foreign currency exchange rates and interest rates, remain the same. Had the market price of the Fund investments increased/decreased in line with the above, the change in the net assets available to pay benefits would have been as follows (the prior year comparator is shown below):Asset type Value as at
31 Mar 18Percentage
changeValue on increase
Value on decrease
£000’s % £000’s £000’sCash and cash equivalents
176,232 0.00 176,232 176,232
Investment portfolio assets:
UK Equities 957,184 4.96 1,004,660 911,951
Overseas Equities 1,267,432 13.60 1,439,803 1,115,697
Global Pooled Equities inc UK
1,948,396 9.71 2,137,585 1,775,951
Bonds incl Bond Funds
600,083 2.88 617,365 583,284
Asset type Value as at 31 Mar 18
Percentage change
Value on increase
Value on decrease
£000’s % £000’s £000’sProperty Pooled Funds
247,201 11.03 274,467 222,643
Private Equity 90,722 18.71 107,696 76,423
Infrastructure Funds
38,173 19.91 45,773 31,835
Net derivative assets
5,593 0.00 5,593 5,593
Investment income due
17,995 0.00 17,995 17,995
Amounts receivable for sales
2,253 0.00 2,253 2,253
Amounts payable for purchases
-8,864 0.00 -8,864 -8,864
Margin Cash Liability
-7,993 0.00 -7,993 -7,993
Total 5,334,407 5,812,565 4,903,000
Asset type Value as at 31 Mar 17
Percentage change
Value on increase
Value on decrease
£000’s % £000’s £000’sCash and cash equivalents
132,102 0.00 132,102 132,102
Investment portfolio assets:UK Equities 957,638 4.96 1,005,137 912,384
Overseas Equities 1,234,999 13.60 1,402,959 1,087,147
Global Pooled Equities inc UK
1,788,688 9.71 1,962,370 1,630,378
Bonds incl Bond Funds
581,407 2.88 598,152 565,131

64 -REPO
RT & A
CC
OU
NTS 2017/2018 - FIN
AN
CIAL STATEM
ENTS
Asset type Value as at 31 Mar 17
Percentage change
Value on increase
Value on decrease
£000’s % £000’s £000’sProperty Pooled Funds
230,129 11.03 255,512 207,267
Private Equity 80,525 18.71 95,591 67,833
Infrastructure Funds
57,191 19.91 68,578 47,695
Net derivative assets
2,905 0.00 2,905 2,905
Investment income due
16,948 0.00 16,948 16,948
Amounts receivable for sales
14,103 0.00 14,103 14,103
Amounts payable for purchases
-12,905 0.00 -12,905 -12,905
Margin Cash Liability
0.00 0.00 0.00 0.00
Total 5,083,730 5,541,452 4,670,988
Interest rate riskThe Fund invests in financial assets for the primary purpose of obtaining a return on investments. These investments are subject to interest rate risks, which represent the risk that the fair value or future cash flows of a financial instrument will fluctuate because of changes in market interest rates. The Fund’s interest rate risk is routinely monitored by the Council and its investment advisors in accordance with the Fund’s risk management strategy, including monitoring the exposure to interest rates and assessment of actual interest rates against the relevant benchmarks. The Fund’s direct exposures to interest rate movements as at 31 March 2018 and 31 March 2017 are set out below. These disclosures present interest rate risk based on the underlying financial assets at fair value.
Asset type 31 March 18 31 March 17
£000’s £000’sCash and cash equivalents 149,724 121,323
Cash Balances 26,508 10,779
Bonds
- Directly held securities 353,090 339,752
- Pooled Funds 246,992 241,654
Total 776,314 713,508
Interest rate risk - sensitivity analysisThe Council recognises that interest rates can vary and can affect both income to the Fund and the value of the net assets available to pay benefits. A one percent movement in interest rates is consistent with the level of sensitivity applied as part of the Fund’s risk management strategy. The Fund’s investment advisor has advised that long-term average rates are expected to move less than one percent from one year to the next and experience suggests that such movements are likely. The analysis that follows assumes that all other variables, in particular exchange rates, remain constant, and shows the effect in the year on the net assets available to pay benefits of a +/- one percent change in interest rates:

65 -REPO
RT & A
CC
OU
NTS 2017/2018 - FIN
AN
CIAL STATEM
ENTS
Asset type Carrying amount as
at 31 Mar 18
Change in the net assets available to pay benefits
+1% -1%£000’s £000’s £000’s
Cash and cash equivalents 149,724 1,497 -1,497
Cash Balances 26,508 265 -265
Bonds
- Directly held securities 353,090 -3,351 3,351
- Pooled Funds 246,992 -2,470 2,470
Total change in assets available
776,314 -4,059 4,059
Asset type Carrying amount
as at 31 Mar 17
Change in the net assets available to pay
benefits
+1% -1%£000’s £000’s £000’s
Cash and cash equivalents 121,323 1,213 -1,213
Cash Balances 10,779 108 -108
Bonds
- Directly held securities 339,752 -3,398 3,398
- Pooled Funds 241,654 -2,417 2,417
Total change in assets available
713,508 -4,494 4,494
Changes to both the fair value of assets and the income received from investments impact on the net assets available to pay benefits. The analysis demonstrates that a 100 bps increase in interest rates will not affect the interest received on fixed interest assets but will reduce their fair value and vice versa. Changes in interest rates do not impact on
the value of cash/cash equivalent balances but they will affect interest income received on those balances.
Currency riskCurrency risk represents the risk that the fair value of future cash flows of a financial instrument will fluctuate because of changes in foreign exchange rates. Through their investment managers, the Fund holds both monetary and non-monetary assets denominated in currencies other than GBP, the functional currency of the Fund. Most of these assets are not hedged for currency risk. The Fund is exposed to currency risk on these financial instruments. However, a large part (£286m) of the assets managed by Goldman Sachs Asset Management held in non GBP currencies is hedged for currency risk through forward currency contracts. The Fund’s currency rate risk is routinely monitored by the Council and its investment advisors in accordance with the Fund’s risk management strategy, including monitoring the range of exposure to current fluctuations. The following table summarises the Fund’s currency exposure excluding the hedged investments as at 31 March 2018 and 2017:
Currency exposure - asset type Asset value as at
31 March 18
Asset value as at
31 March 17£000’s £000’s
Overseas Equities 1,267,432 1,234,999
Overseas Pooled Funds 1,331,382 1,136,971
Overseas Bonds 42,724 40,223
Overseas Private Equity, Infrastructure and Property funds
107,041 125,388
Non GBP Cash 38,240 14,125
Total overseas assets 2,786,819 2,551,706
Currency risk - sensitivity analysisFollowing analysis of historical data and expected currency movement during the financial year, in consultation with the fund’s investment

66 -REPO
RT & A
CC
OU
NTS 2017/2018 - FIN
AN
CIAL STATEM
ENTS
advisors, the Council has determined that the following movements in the values of financial assets denominated in foreign currency are reasonably possible for the 2018-19 reporting period. This analysis assumes that all other variables, in particular interest rates, remain constant. A relevant strengthening/weakening of the pound against various currencies in which the Fund holds investments would increase /decrease the net assets available to pay benefits as follows:
Currency exposure - asset type Asset value as at 31 March 18
Change to net assets available to pay benefits
Change to net assets available to pay benefits
+9.0% -9.0%£000’s £000’s £000’s
Overseas Equities 1,267,432 1,381,501 1,162,782
Overseas Pooled Funds 1,331,382 1,451,206 1,221,451
Overseas Bonds 42,724 46,569 39,196
Overseas Private Equity, Infrastructure and Property funds 107,041 116,675 98,203
Non GBP Cash 38,240 41,682 35,083
Total change in assets available 2,786,819 3,037,633 2,556,715
Currency exposure - asset type Asset value as at 31 March 17
Change to net assets available to pay benefits
Change to net assets available to pay benefits
+9.0% -9.0%£000’s £000’s £000’s
Overseas Equities 1,234,999 1,346,149 1,133,026
Overseas Pooled Funds 1,136,971 1,239,298 1,043,093
Overseas Bonds 40,223 43,843 36,902
Overseas Private Equity, Infrastructure and Property funds 125,388 136,673 115,035
Non GBP Cash 14,125 15,396 12,959
Total change in assets available 2,551,706 2,781,359 2,341,015
b) Credit riskCredit risk represents the risk that the counterparty to a transaction or a financial instrument will fail to discharge an obligation and cause the Fund to incur a financial loss. The market values of investments generally reflect an assessment of credit in their pricing and consequently the risk of loss is implicitly provided for in the carrying value of the Fund’s financial assets and liabilities.

67 -REPO
RT & A
CC
OU
NTS 2017/2018 - FIN
AN
CIAL STATEM
ENTS
In essence the Fund’s entire investment portfolio is exposed to some form of credit risk, with the exception of the derivatives positions, where the risk equates to the net market value of a positive derivative position. However, the selection of high quality counterparties, brokers and financial institutions minimises credit risk that may occur through the failure to settle a transaction in a timely manner.
Contractual credit risk is represented by the net payment of a receipt that remains outstanding, and the cost of replacing the derivative position in the event of a counterparty default. The residual risk is minimal due to the various insurance policies held by the exchanges to cover defaulting counterparties. Derivative contracts are also covered by margins which provide collateral against risk of default by the counterparties.
Deposits are not made with banks and financial institutions unless they are rated independently and meet the Council’s credit criteria. The Council has also set limits as to the maximum amount that may be placed with any one financial institution. The Fund’s cash was held with the following institutions:
Rating Balance as at 31 March 18
Balance as at 31 March 17
£000’s £000’sMoney Market Funds
Northern Trust Sterling Fund AAAm 40,386 75,918
SSGA Liquidity Fund AAAm 6,497 28
Blackrock USD Government Liquidity Fund AAAm 6,519 3,302
Aberdeen Sterling Liquidity Fund AAAm 39 6,870
Goldman Sachs Liquid Reserve Government Fund AAAm 15,085 8,187
Aviva Investors Sterling Liquidity Fund AAAm 8,184 6,931
Deutsche Managed Sterling Fund AAAm 8,210 33
HSBC Global Liquidity Fund AAAm 85 4,943
LGIM Liquidity Fund AAAm 7,447 9,795
Insight Sterling Liquidity Fund AAAm 7,414 95
99,866 116,102
Cash Plus Funds
Royal London Cash Plus Fund AAAf 14,996 0
Payden Sterling Reserve Fund AAAf 14,941 0

68 -REPO
RT & A
CC
OU
NTS 2017/2018 - FIN
AN
CIAL STATEM
ENTS
Rating Balance as at 31 March 18
Balance as at 31 March 17
£000’s £000’sAberdeen Ultra Short Duration Sterling Fund AAAf 10,017 0
39,954 0
Bank Deposit Accounts
HSBC BIBCA AA- 2,435 2,435
NatWest SIBA BBB+ 12 508
2,447 2,943
Bank current accounts
Natwest Current Account BBB+ 91 87
NatWest Current Account - Euro BBB+ 26,416 8,893
NatWest Current Account - USD BBB+ 1 1,800
Northern Trust - Current Accounts AA- 5,695 178
Barclays - DTZ client monies account A 1,762 2,099
33,965 13,057
Total 176,232 132,102
c) Liquidity riskLiquidity risk represents the risk that the Fund will not be able to meet its financial obligations as they fall due. The Council therefore takes steps to ensure that the Fund has adequate cash resources to meet its commitments. The Council has immediate access to the Fund’s money market fund and current account holdings.
Management prepares periodic cash flow forecasts to understand and manage the timing of the Fund’s cash flows. The appropriate strategic level of cash balances to be held forms part of the Fund investment strategy.
All financial liabilities at 31 March 2018 are due within one year.
Refinancing riskThe key risk is that the Council will be bound to replenish a significant proportion of its Pension Fund financial instruments at a time of unfavourable interest rates. The Council does not have any financial instruments that have a refinancing risk as part of its treasury management and investment strategies.

69 -REPO
RT & A
CC
OU
NTS 2017/2018 - FIN
AN
CIAL STATEM
ENTS
22. Funding arrangementsIn line with Local Government Pension Scheme (Administration) Regulations 2013 (as amended), the Fund is required to obtain an actuary’s funding valuation every three years for the purpose of setting employer contribution rates for the forthcoming triennial period. The last such valuation took place as at 31 March 2016.
The key elements of the funding policy are:
• To ensure the long-term solvency of the Fund and ensure that sufficient funds are available to meet all the benefits as they fall due for payment• To ensure employer contribution rates are as stable as possible• To minimise the long term cost of the scheme by recognising the link between assets and liabilities and adopting an investment strategy that balances
risk and return• To reflect the different characteristics of employing bodies in determining contribution rates where the administering authority considers it reasonable
to do so.
At the 2016 valuation a maximum deficit recovery period of 17 years (2013 - 20 years) is used for all employers. Shorter recovery periods have been used where affordable. This will provide a buffer for future adverse experience and reduce the interest cost paid by employers. For Transferee Admission Bodies the deficit recovery period is set equal to the future working life of current employees or the remaining contract period, whichever is the shorter.
In the 2016 triennial valuation, the smoothed value of the Fund’s assets at the valuation date was £4,556m and the liabilities were £5,103m. The assets therefore, represented 89% (2013 - 83%) of the Fund’s accrued liabilities, allowing for future pay increases.
The contribution rate for the average employer, including payments to target full funding has increased from 20% to 20.9% of pensionable salaries in 2017-18 and to 21% in 2018-19 and 2019-20. The funding level as a percentage has increased (due to good investment returns and employer contributions) although this has been partly offset by the changes in the financial assumptions used to calculate the liabilities.
The actuarial valuation has been undertaken on the projected unit method. At individual employer level the projected unit funding method has been used where there is an expectation that new employees will be admitted to the Fund. The attained age method has been used for employers who do not allow new entrants. These methods assess the costs of benefits accruing to existing members during the remaining working lifetime, allowing for future salary increases. The resulting contribution rate is adjusted to allow for any differences in the value of accrued liabilities and the market value of assets.

70 -REPO
RT & A
CC
OU
NTS 2017/2018 - FIN
AN
CIAL STATEM
ENTS
The Fund accounts do not take account of liabilities to pay pensions and other benefits in the future. Based on the latest valuation, the fair value of net assets of the Fund represents 64.6% of the actuarial valuation of the promised retirement benefits. Future liabilities will be funded from future contributions from employers.
The liability above being calculated on an IAS 19 basis and differs from the results of the 2016 triennial funding valuation because IAS 19 stipulates a discount rate rather than a rate which reflects a market rate.
Assumptions used: % p.a.Salary increase rate 3.8%
Inflation/Pensions increase rate 2.3%
Discount rate 2.6%
The 2016 actuarial assumptions were as follows:
Valuation of Assets: assets have been valued at a 6 month smoothed
market rateRate of return on investments (discount rate)
5.4% p.a.
Rate of general pay increases: 3.9% p.a.
Long term 3.9% p.a.
Short term CPI for period 31 March 2016 to 31 March 2020
Rate of increases to pensions payment (in excess of guaranteed minimum pension):
2.4% p.a.
23. Actuarial present value of promised retirement benefitsIn addition to the triennial funding valuation, every year the fund’s actuary undertakes a valuation of the Fund’s liabilities on an IAS 19 basis, using the same base data as the funding valuation rolled forward to the current financial year, taking account of changes in membership numbers and updating assumptions to the current year.
Actuarial present value of promised retirement benefits
31 March 18£000’s
31 March 17£000’s
Present value of promised retirement benefits
(9,029.1) (9,062.3)
Fair value of scheme assets at bid value
5,828.8 5,565.2
Net liability (3,200.3) (3,497.1)

71 -REPO
RT & A
CC
OU
NTS 2017/2018 - FIN
AN
CIAL STATEM
ENTS
24. Current Assets31 March 2018 31 March 2017
£000’s £000’sDebtors
- Contributions due - Employees 4,040 3,816
- Contributions due - Employers 12,592 11,974
- Sundry debtors 12,060 9,982
Total External Debtors 28,692 25,772
Amounts due from Kent County Council 0 1,203
Cash 27,717 10,780
56,409 37,755
Analysis of External Debtors
Other Local Authorities 24,911 22,437
Other Entities and individuals 3,781 3,335
28,692 25,772
25. Current Liabilities31 March 2018 31 March 2017
£000’s £000’sCreditors- Benefits Payable 11,320 7,018- Sundry Creditors 4,079 3,406Total External Creditors 15,399 10,424Owing to Kent County Council 3,094 3,934Total 18,493 14,358
Analysis of External CreditorsOther Local Authorities 10,934 5,790Other Entities and individuals 4,465 4,634Total 15,399 10,424

72 -REPO
RT & A
CC
OU
NTS 2017/2018 - FIN
AN
CIAL STATEM
ENTS
26. Additional Voluntary ContributionsScheme members have the option to make additional voluntary contributions to enhance their pension benefits. In accordance with regulation 4(2)(b) of the LGPS (Management and Investment of Funds) Regulations 2009, these AVC contributions are not included within the Pension Fund Accounts. These contributions are paid to the AVC provider directly by the employer and are invested separately from the Pension Fund, with either Equitable Life Assurance Company, Prudential Assurance Company or Standard Life Assurance Company. These amounts are included within the disclosure note figures below.
Prudential Standard Life Equitable Life2017-18 2016-17 2017-18 2016-17 2017-18 2016-17
£000’s £000’s £000’s £000’s £000’s £000’s
Value at 1 April 7,591 6,371 2,373 2,049 614 628
Value at 31 March 8,480 7,591 2,087 2,373 534 614
Contributions paid 1641 1,438 124 166 1 6
27. Related party transactionsThe Kent Pension Fund is required to disclose material transactions with related parties, not disclosed elsewhere, in a note to the financial statements. During the year each member of the Kent County Council Superannuation Fund Committee is required to declare their interests at each meeting. None of the members of the Committee or senior officers undertook any material transactions with the Kent Pension Fund.
2017-18 2016-17£000’s £000’s
Kent County Council is the largest single employer of members of the Pension Fund and during the year contributed:
71,592 70,822
A list of all contributing employers and amount of contributions received is included in the Fund’s annual report available on the pension fund website Charges from Kent County Council to the Kent Pension Fund in respect of pension administration, governance arrangements, investment monitoring, legal and other services
3,022 2,940
Year end balance due to Kent County Council arising out of transactions between Kent County Council and the Pension Fund
-3,094 -2,731

73 -REPO
RT & A
CC
OU
NTS 2017/2018 - FIN
AN
CIAL STATEM
ENTS
Key management personnelThe employees of Kent County Council who held key positions in the financial management of the Kent Pension Fund during 2017-18 was the Corporate Director of Finance.
Total remuneration payable to key management personnel is set out below:
31 March 18£000’s
31 March 17£000’s
Salary 141 139
Allowances 8
Other 5 6
Employer’s pension contributions 32 30
Total 186 175
28. Contingent Liabilities and Contractual CommitmentsOutstanding capital commitments (investments) as at 31 March 2018 totalled £89.3m (31 March 2017: £102.3m).
These commitments relate to outstanding call payments due on unquoted limited partnership funds held in private equity and infrastructure parts of the portfolio. The amounts ‘called’ by these funds are irregular in both size and timing over the life of each fund. The amount includes a commitment on the purchase of a property which was settled in April 2018.
29. Contingent Assets37 admitted body employers in the Kent Pension Fund hold insurance bonds to guard against the possibility of being unable to meet their pension obligations. These bonds are drawn in favour of the Fund and payment will only be triggered in the event of employer default.

74 -REPO
RT & A
CC
OU
NTS 2017/2018 - IN
DEPEN
DEN
T AUD
ITOR’S REPO
RTassume responsibility to anyone other than the Authority and the Authority’s members as a body, for our audit work, for this report, or for the opinions we have formed.
The audited financial statements and our Report thereonWe expressed an unmodified audit opinion on the pension fund financial statements in the Statement of Accounts in our report dated 25 July 2018.
Interim Corporate Director of Finance and Head of Finance Operations’ responsibilities for the pension fund financial statements in the Pension Fund Annual Report Under the Local Government Pension Scheme Regulations 2013 the Chief Financial Officer of the Authority is responsible for the preparation of the pension fund financial statements, which must include the Fund Account, the Net Asset Statement and supporting notes and disclosures prepared in accordance with proper practices. Proper practices for the pension fund financial statements in both the Statement of Accounts and the Pension Fund Annual Report are set out in the CIPFA/LASAAC code of practice on local authority accounting in the United Kingdom 2017/18.
Auditor’s responsibilityOur responsibility is to express an opinion on whether the pension fund financial statements in the Pension Fund Annual Report are consistent, in all material respects, with the audited pension fund financial statements in the Statement of Accounts based on our procedures, which were conducted in accordance with International Standard on Auditing 810 (Revised), Engagements to Report on Summary Financial Statements.
Paul Dossettfor and on behalf of Grant Thornton UK LLP, Appointed Auditor
Grant Thornton UK LLP30 Finsbury SquareLondon, EC2P 2YU
26 July 2018
Independent auditor’s report to the members of Kent County Council on the consistency of the pension fund financial statements included in the Pension Fund Annual Report
OpinionThe pension fund financial statements of Kent County Council (the “Authority”) for the year ended 31 March 2018 which comprise the Fund Account, the Net assets statement and the notes to the financial statements, including a summary of significant accounting policies, of the Kent Pension Fund are derived from the audited pension fund financial statements for the year ended 31 March 2018 included in the Authority’s Statement of Accounts (the “Statement of Accounts”).
In our opinion, the accompanying pension fund financial statements are consistent, in all material respects, with the audited financial statements in accordance with proper practices as defined in the CIPFA/LASAAC code of practice on local authority accounting in the United Kingdom 2017/18 and applicable law.
Pension Fund Annual Report - Pension fund financial statements The Pension Fund Annual Report and the pension fund financial statements do not reflect the effects of events that occurred subsequent to the date of our report on the Statement of Accounts. Reading the pension fund financial statements and the auditor’s report thereon is not a substitute for reading the audited Statement of Accounts and the auditor’s report thereon.
Who we are reporting toThis report is made solely to the members of the Authority, as a body, in accordance with Part 5 paragraph 20(5) of the Local Audit and Accountability Act 2014 and as set out in paragraph 43 of the Statement of Responsibilities of Auditors and Audited Bodies published by Public Sector Audit Appointments Limited. Our work has been undertaken so that we might state to the members of the Authority those matters we are required to state to them in an auditor’s report and for no other purpose. To the fullest extent permitted by law, we do not accept or