kent county 2011 community health needs assessment and ... · combined populations of los angeles,...
TRANSCRIPT

Kent County 2011 Community Health Needs Assessment
And Health Profile

1
Kent County 2011 Community Health Needs Assessment
And Health Profile
A partnership of 80 organizations conducted a study of the health needs of Kent County during 2011. The results were made available in January 2012. The entire document is posted on the Mary Free Bed website. The direct link is: http://www.maryfreebed.com/About-Us/Community-Health-Needs-Assessment Or, go to the Mary Free Bed website (www.maryfreebed.com) click on the About Us tab and find “Community Health Needs Assessment” in the left navigation. The Executive Summary and Key Findings are below. Executive Summary The vision of Kent County Working Together for a Healthier Tomorrow is a high quality of life, health, and well-being for all people in Kent County. The Kent County Community Health Needs Assessment (CHNA) is a systematic process for involving community partners in examining indicators of health in the population, gathering input from community members, identifying strategic issues, and identifying strategic priorities that, if addressed, would improve the health of Kent County residents. Community partners that sponsored the CHNA were the Kent County Health Department and several non-profit community hospitals. These partners convened a large Coalition that represented the agencies and institutions in the county that impact health. These partners also contracted with the Michigan Public Health Institute to facilitate a community health needs assessment and health improvement plan for Kent County. The mission of the Kent County CHNA process is to ensure that the people of Kent County are empowered to achieve lifelong physical, mental and social wellbeing through 1) equal access to high quality, affordable healthcare; 2) a coordinated system of care that is local, preventive, holistic, and patient centered; and 3) an environment that supports healthy living for all. In order to achieve this mission, the Coalition formed two workgroups that collected population and community input data that spoke to community health across groups and in multiple areas of health. The Population Data Workgroup identified indicators of health and reviewed existing local, state, and national secondary data sources (see Appendix C) to compile a comprehensive overview of the health status across populations within Kent County. These data are limited in populations represented and health indicators. Additional data collection methods were used by the Community Input Workgroup to gather data from community members whose voice and health status may not be represented through the local, state, and national secondary data sources. Community Input Walls were placed in large public venues as a method of

2
collecting community feedback from the general public. Intercept interviews were conducted with vulnerable populations who were accessible within Grand Rapids and Kent County. Finally, focus groups were used to gather feedback from diverse and hard to reach populations within Grand Rapids and Kent County. The CHNA Coalition reviewed assessment findings and identified 44 crosscutting, strategic issues. Using a structured prioritization process, the CHNA Steering Committee and Coalition narrowed this list to 5 strategic priorities that align with the mission to address through a community health improvement plan in the next phase of this project. Strategic Priorities 1. Increase the proportion of community members, including the uninsured and
the working poor, that have (sic) access to affordable healthcare to promote equal access to high quality, affordable healthcare.
2. Increase the number of providers available that accept Medicaid or offer low-cost/free services to promote a coordinated system of care that is local, preventive, holistic, and patient centered.
3. Reduce disparities in adequacy of prenatal care to promote a coordinated system of care that is local, preventive, holistic, and patient centered.
4. Increase healthy eating by ensuring access to healthy foods to promote an environment that supports healthy living for all.
5. Reduce the disparity in health risk factors and protective factors between students to promote an environment that supports healthy living for all.
Key Findings in Healthcare Resource Availability 13.6% of adults had no healthcare access during the past 12 months.
However, the proportion increased for adults with less than a high school education (45.3%) and those lacking health insurance (54.9%).
10.7% of adults in Kent County report that they have no healthcare coverage. These numbers increase to 16.9% for African Americans, 19.7% for adults with only a high school education, and 23.6% for adults with less than a high school education.
Only 52.4% of youth who receive Ds/Fs in school had received a check-up in the past 12 months.
25.8% of adults in Kent County had not seen a dentist in the previous 12 months and this proportion increased to 47.9% for adults lacking health insurance.
The current supply of dentists to serve low-income patients is about 55% of what is needed in Grand Rapids and only 29% of what is needed countywide.
Access to healthcare was one of the most salient concerns of community members during focus groups and intercept interviews. Some of the issues that community members face include:

3
• inability to afford preventive health care, using the emergency department to address deteriorating health,
• inability to access dental and mental health providers, lack of availability of low-cost and free providers, and
• lack of providers who serve patients who are ensured through Medicaid.
Key Findings in Maternal and Child Health Prenatal care in Kent County is more likely to be adequate if you are White and inadequate if you are Arab, Black, or Hispanic/Latino:
White: 78% with adequate and 9.6% with inadequate prenatal care Arab: 69.1% with adequate and 17.5% with inadequate prenatal care Black: 67.1% with adequate and 19.8% with inadequate prenatal care Hispanic: 67.2% with adequate and 17.9% with inadequate prenatal care
The teen pregnancy rate is higher in Kent County (61.5/1,000 females ages 15-19) than Michigan (53.6/1,000 females ages 15-19). Teens are more likely than adult women to receive late or no prenatal care, deliver pre-term, and deliver a baby at a low birth weight. The Kent County Fetal Infant Mortality Review found that African American babies are significantly more likely to die before their first birthday than any other race. Further, African American and Hispanic mothers were more likely to receive Medicaid, have had late entry into or no prenatal care, and have experienced distrust, fear, or dissatisfaction with their healthcare. Key Findings in Healthy Lifestyles and Access to Healthy Food
19,172 residents in Kent County live in a food desert, meaning they do not have access to a grocery store, and there are 17,920 residents who have limited access to grocery stores in their neighborhoods.
The food insecurity rate for Kent County is 15.2% overall; however, children in Kent County experience a much higher food insecurity rate of 23.2%.
34% of youth in Kent County report eating five or more servings of fruits and vegetables per day during the past 7 days and 52.4% report being physically active 60 minutes or more on at least 5 of the 7 days.
10.5% of Kent County youth are obese, and the youth most at-risk for being obese are males, American Indians, and students with Ds/Fs.
27.7% of Kent County adults are obese and 35.4% are overweight. Adult residents lacking health insurance are the least likely to be overweight, adult males are the most likely to be overweight, and African American adults are the most likely to be obese.

4
Key Findings in Youth Risk Factors 22.8% of 9th and 11th grade students reported that they had at least one
drink of alcohol during the past 30 days.
Youth reported driving under the influence (7.5%) and riding with someone who had been drinking alcohol (22.6%) in the past 30 days.
6.5-7.3% of Kent County students took prescription medication in the last 30 days that did not belong to them. White students were more likely to take stimulants than their peers while African American and Hispanic/Latino were more likely than their peers to take pain killers.
91.6% of youth usually wear a seat belt but of those riding bicycles, 83.8% of 9th and 11th grade youth report rarely or never wearing a helmet.
31.3% of students reported ever having sexual intercourse.
Among Kent County students who had sexual intercourse during the past 3 months, 62.8% wore a condom.
Students receiving Ds/Fs were on average twice as likely as their peers to engage in health risk behaviors mentioned above and further, they were more likely to have felt hopeless, expressed suicidal ideation, or attempted suicide.

5
Mary Free Bed Rehabilitation Hospital 2011 Kent County Health Needs Assessment and Health Profile Addendum One
MARY FREE BED WHEELCHAIR & ADAPTIVE SPORTS PROGRAM Approximately 700 athletes participate in Mary Free Bed’s Wheelchair & Adaptive Sports Program. There are nearly a dozen competitive teams, some with national rankings. These sports support physical, emotional and mental health for participants and their families. Sports include basketball, hand cycling, sled hockey, quad rugby and tennis. In addition, the Junior Wheelchair Sports Camp is held every summer. Clinics are also offered for camping, golfing, kayaking/rowing, racing, sailing, scuba diving, snow skiing, softball, water skiing and rock climbing. Living with Paralysis – National Statistics Between 2006 and 2008, The Christopher and Dana Reeves Foundation and the University of New Mexico’s Center for Development and Disability collaborated on one of the largest population-based, disability studies ever conducted. The results were surprising, showing one in 50 people in the United States lives with paralysis. That’s 40% more than previously believed – or the equivalent of the combined populations of Los Angeles, Philadelphia and Washington, D.C. When patients experience paralysis, it is important to remain as active as possible to be holistically healthy. Adaptations have been developed for many sports enabling participants to lead active, healthy and enjoyable lives. In the study, paralysis was defined as “a central nervous system disorder resulting in difficulty or inability to move the upper or lower extremities.”
Approximately 5,596,000 people were living with some form of paralysis (1.9% of the United States population)
The three largest causes of paralysis were:
• 29% -- Stroke
• 23% -- Spinal cord injury
• 17% -- Multiple sclerosis
• 7% -- Cerebral palsy
• 5% -- Post-polio syndrome
Spinal cord injuries
• 1,275,000 people reported spinal cord injuries (more than five times the number estimated in 2007).
• The five top causes of spinal cord injury were: o 28% -- Accidents at work o 24% -- Motor vehicle accidents o 16% -- Sporting and recreational accidents

6
o 9% -- Falls o 4% -- Victim of Violence
Paralysis appears to be disproportionately distributed among some minority communities such as African Americans and Native Americans.
People living with paralysis have lower household incomes.
• Annual household income for most respondents was $30,000.
• 25% of the respondents reported annual incomes under $10,000 compared with 7% of the general population.
The University of Alabama National Spinal Cord Injury Statistical Center and the Centers for Disease Control and Prevention report the cost of living with a spinal cord injury can be very expensive, depending on the severity of the injury
• 87.9% of spinal cord injury patients return to private homes.
• Average yearly expenses can range from $229,000 to $776,000.
• Lifetime costs can range from $682,000 to more than $3 million for a 25 year-old person.
Benefits of Wheelchair Sports Programs Multiple studies of adaptive sports programs quantify their positive benefits which reach far beyond the obvious physical conditioning. The U.S. Department of Veterans Affairs has vast experience with servicemen and women who return from combat with war injuries. The following information is from the Adaptive Sports page of the VA website:
“…besides the fun, new friendships and exercise, why should you consider adaptive sports? Studies show that adaptive sports provide the following clear benefits for disabled Veterans:
Less stress Reduced dependency on pain and depression medications Fewer secondary medical conditions (i.e. diabetes, hypertension) Higher achievement in education and employment More independence”
A study entitled “Quality of Life and Identity: The Benefits of a Community-Based Therapeutic Recreation and Adaptive Sports Program” appeared in the July 1, 2005 issue of Therapeutic Recreation Journal. Investigators concluded “participation positively influenced quality of life, overall health, quality of family life and quality of social life.” In early 2008, more than 1,100 participants were surveyed in a study commissioned by Disabled Sports USA. Harris Interactive queried 704 physically active adults with disabilities, 201 additional adults involved in Disabled Sports adaptive sports, and 203 wounded adult service members who were also part of Disabled Sports USA activities. Major findings include:
In all three surveys, physically active adults with disabilities report exercise has helped them obtain jobs and advance in them.
7
All groups report sports-related exercise is beneficial citing improvements in physical and mental health, quality of life, and leading healthier lifestyles.
Those who are physically active also enjoy socializing more, have a strong support network, and are more likely to say they look forward to the rest of their life than those who are physically inactive.
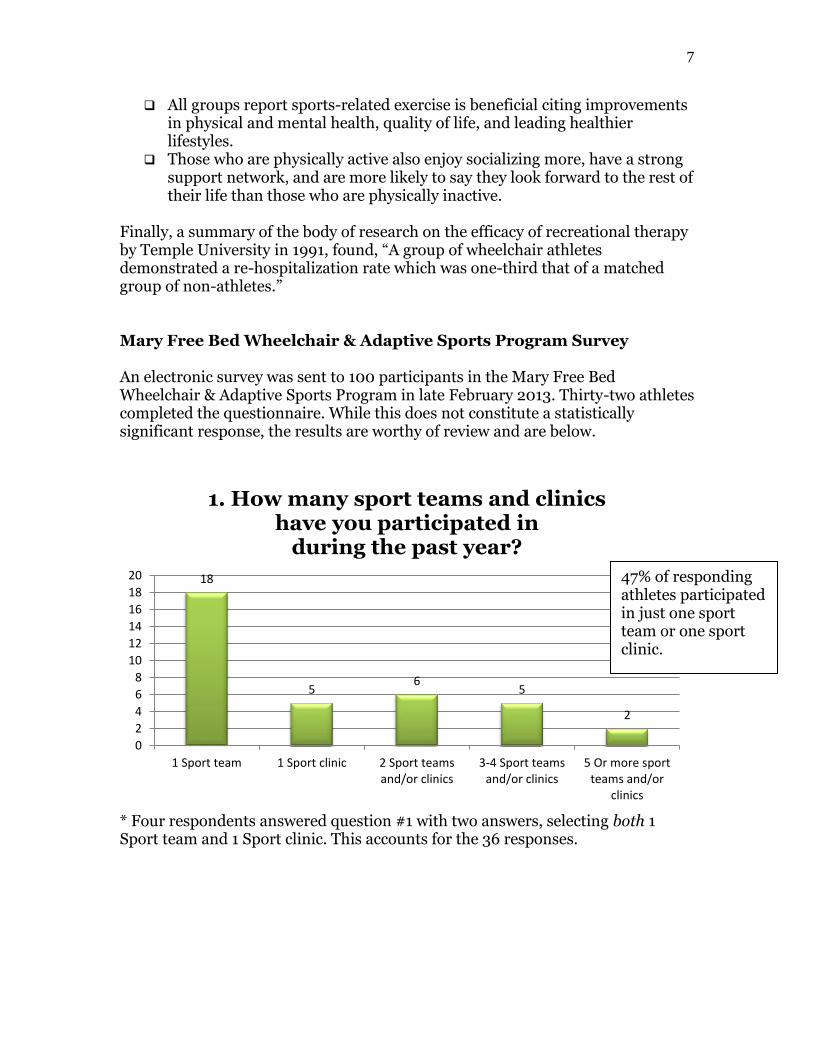
Finally, a summary of the body of research on the efficacy of recreational therapy by Temple University in 1991, found, “A group of wheelchair athletes demonstrated a re-hospitalization rate which was one-third that of a matched group of non-athletes.” Mary Free Bed Wheelchair & Adaptive Sports Program Survey An electronic survey was sent to 100 participants in the Mary Free Bed Wheelchair & Adaptive Sports Program in late February 2013. Thirty-two athletes completed the questionnaire. While this does not constitute a statistically significant response, the results are worthy of review and are below.
* Four respondents answered question #1 with two answers, selecting both 1 Sport team and 1 Sport clinic. This accounts for the 36 responses.
18
56
5
2
0
2
4
6
8
10
12
14
16
18
20
1 Sport team 1 Sport clinic 2 Sport teamsand/or clinics
3-4 Sport teamsand/or clinics
5 Or more sportteams and/or
clinics
1. How many sport teams and clinics have you participated in
during the past year?
47% of responding athletes participated in just one sport team or one sport clinic.

8
* One respondent answered question #2 with two answers, selecting both Never active and Somewhat active. This accounts for the 33 responses.
* One respondent answered question #3 with two answers, selecting both Never active and Somewhat active. This accounts for the 33 responses.
7
13
11
1 1
0
2
4
6
8
10
12
14
Very active Active Somewhat active Rarely active Never active
2. What best describes your activity level BEFORE participating in
Wheelchair & Adaptive Sports?
17
9
6
01
0
2
4
6
8
10
12
14
16
18
Very active Active Somewhat active Rarely active Never active
3. As a Wheelchair & AdaptiveSports participant, what
best describes your CURRENT activity level?
63% of respondents considered themselves very active or active prior to participating in Wheelchair & Adaptive Sports.
After participating in Wheelchair & Adaptive Sports, 81% of respondents report feeling very active or active compared with 63% before participation.

9
89
15
0 00
2
4
6
8
10
12
14
16
Strongly agree Agree Neither agree nordisagree
Disagree Strongly disagree
4. Participating in Wheelchair & Adaptive Sports has helped
control my weight.
15 15
2
0 00
2
4
6
8
10
12
14
16
Strongly agree Agree Neither agree nordisagree
Disagree Strongly disagree
5. Participating in Wheelchair & Adaptive Sports has improved
my upper-body strength.
53% of respondents strongly agreed or agreed that Wheelchair & Adaptive Sports has helped them control their weight. 49% were undecided.
94% of respondents strongly agreed or agreed that participating in Wheelchair & Adaptive Sports improved their upper-body strength.

10
* Four respondents answered question #7 with two answers, selecting both Happy and Confident. This accounts for the 36 responses.
5
11
15
10
0
2
4
6
8
10
12
14
16
Strongly agree Agree Neither agree nordisagree
Disagree Strongly disagree
6. My sleeping habits have improved since participating in
Wheelchair & Adaptive Sports.
9
16
10
10
0
2
4
6
8
10
12
14
16
18
Confident Happy Neutral Insecure Depressed
7. What best describes your emotional wellbeing BEFORE participating in
Wheelchair & Adaptive Sports?
50% of the athletes strongly agreed or agreed that their sleeping habits improved since participating in Wheelchair & Adaptive Sports. 48% were undecided.
66% of respondents reported feeling happy or confident prior to involvement in Wheelchair & Adaptive Sports.

11
* Seven respondents answered question #8 with two answers. Six respondents selected both Happy and Confident and one selected both Happy and Neutral. This accounts for the 39 responses.
21
15
3
0 00
5
10
15
20
25
Confident Happy Neutral Insecure Depressed
8. As a participant in Wheelchair & Adaptive Sports, how would you describe your
CURRENT emotional wellbeing?
17
13
2
0 00
2
4
6
8
10
12
14
16
18
Strongly agree Agree Neither agree nordisagree
Disagree Strongly disagree
9. Wheelchair & Adaptive Sports teams and clinics positively impact
my quality of life.
94% of respondents reported feeling either happy or confident as a current Wheelchair & Adaptive Sports participant. Some athletes selected feeling both happy and confident!
94% of survey respondents strongly agreed or agreed that the Wheelchair & Adaptive Sports has positively impacted their quality of life!

12
10. Additional Comments:
I feel that wheelchair sports are great for kids and adults to help stay physically fit, make new friends, keep you motivated and positive, and is a good resource with other people in the same situation. It is also good community awareness to show what people in wheelchairs can do. We are very lucky to have a place like this in Grand Rapids and don't have to travel far. 3/8/2013 12:03 PM Rugby Rules!!! 3/7/2013 9:39 am I really appreciated wheelchair/adaptive sports. I wished that they were around when I was at an earlier age during early 1970's 3/6/2013 7:34 PM
There needs to be a change in sled hockey. This is an intense sport and these kids need to be in top shape, just like all contact sports to prevent injury. Easy practices and lack of knowledge from coaches are going to get our kids hurt. 3/1/2013 3:16 PM I enjoy playing tennis meeting new people and the tournaments i've participated in. 2/28/2013 1:14 PM I haven't been as active playing tennis as years past due to my work life. I teach tennis at Orchard Hills, East Hills, and the MAC, so I don't play tennis as often as I did in years past. 2/27/2013 8:39 AM I would like to see more of the wheelchair martial arts 2/26/2013 5:17 PM This has helped me go places,like flying by myself, to events and people see you playing. They are impressed and that gives you confidence. 2/26/2013 4:56 PM Let's Go Grand Rapids Sled Wings!!!! 2/26/2013 4:55 PM Doesn't always have to be team sports. Maybe a group that likes to do the same thing can get together to have the friendship of doing the activity. Also want more outdoor activities, fishing & archery. 2/26/2013 3:12 PM It has been excellent means of physical exercise and team building experiences for me. 2/26/2013 2:37 PM

13
Mary Free Bed Rehabilitation Hospital 2011 Kent County Health Needs Assessment and Health Profile Addendum Two CANCER REHABILITAITON PROGRAM
Early detection and better treatment regimes are increasing the number of people who live longer lives following a cancer diagnosis. The goal of this program is to maximize the physical, cognitive and psychosocial aspects of those lives. Living with Cancer – National Statistics The American Cancer Society publication, Cancer Facts & Figures 2012, includes the following information:
The National Cancer Institute estimates nearly 12 million Americans with a history of cancer were alive in January 2008. Some of these individuals were cancer free, while others still had evidence of cancer and may have been undergoing treatment.
Approximately 1,638,910 new cancer cases were expected to be diagnosed in 2012. This estimate does not include carcinoma in situ (noninvasive cancer) of any site except the urinary bladder, and also does not include basal and squamous cell skin cancers, which are not required to be reported to cancer registries.
In 2012, about 577,190 Americans were expected to die of cancer. That’s more than 1,500 people a day. Exceeded only by heart disease, cancer is the second most common cause of death in the United States, accounting for nearly one of every four deaths.
The 5-year relative survival rate for all cancers diagnosed between 2001 and 2007 is 67%, up from 49% in 1975-1977. The improvement in survival reflects both progress in diagnosing certain cancers at an earlier stage and improvements in treatment.
Survival statistics vary greatly by cancer type and stage at diagnosis. Relative survival compares survival among cancer patients to that of people not diagnosed with cancer who are of the same age, race, and gender. It represents the percentage of cancer patients who are alive after some designated time period (usually 5 years) relative to persons without cancer. It does not distinguish between patients who have been cured and those who have relapsed or are still in treatment. Information in the following table is based on data collected by the American Cancer Society and the National Cancer Institute’s Surveillance Epidemiology and End Results (SEER) regarding the number of cancer survivors in the United States. Statistically predictive models for 2022 are also included.

14
Cancer Survivors in the United States
Top 3 Occurring Cancers
As of January 1, 2012 Predicted - January 1, 2022
Females Breast 2,971,610
Breast 3,786,610
Uterine Corpus 606,910
Colorectal 735,720
Colorectal 603,530
Uterine Corpus 725,870
Males Prostate
2,778,630 Prostate 3,922,600
Colorectal 595,210
Colorectal 751,590
Melanoma (skin) 481,040
Melanoma (skin) 661,980
Living with Cancer – Michigan Statistics According to the American Cancer Society’s report on Cancer Survivorship Facts and Figures 2012-2013, there were 513,400 cancer survivors living in Michigan as of January 1, 2012. The latest available statistics for Kent County indicate nearly 16,000 cancer survivors through December 2009. These residents were diagnosed with invasive cancer between 1985 and 2009. Cancer Survivors The term “cancer survivor” is becoming more common in medical parlance, and typically defines people diagnosed with cancer who remain survivors throughout their remaining life. According to the American Cancer Society’s report on Cancer Survivorship, there are three distinct phases:
From the time of initial diagnosis to end of initial treatment. Transition from treatment to extended survival. Long-term survival.
The lives of cancer survivors can take several paths.
Cancer-free throughout the remainder of life. Cancer-free, but developing serious “delayed late effects” of cancer
treatment. Cancer-free for many years, but dying after a late recurrence. Cancer-free after the first (primary) cancer treatment, then developing a
second cancer. Cancer-free for a period of time, then developing a recurrence of the initial
cancer that requires further treatment. Living with cancer continuously without a disease-free period.

15
Cancer Rehabilitation As the ranks of cancer survivors grow, the need for specialized cancer rehabilitation increases. There are several goals:
Help patients regain and maintain maximum cognitive and physical function. Improve independence and quality of life. Provide assistance and education to patients and caregivers.
Categories of Cancer Rehabilitation
Prevention Oncology Rehabilitation • Focuses on reducing the severity of the effect of a disability when the
disability can be predicted. • Example – Physical therapists work pre-operatively with breast cancer
patients to teach them lymphedema prevention and management techniques before they undergo mastectomy and axillary dissection.
Restorative Rehabilitation
• Focuses on restoring patients to their former level of function when impairment is not expected to be permanent.
• Example – Occupational therapists help breast cancer patients become more functional in self-care activities and more independent carrying out their daily activities.
Supportive Rehabilitation
• Focuses on maximizing function when a permanent impairment exists. • Example – Orthotics and prosthetics are used for patients who have
surgical amputations as part of their cancer treatment. Physical and occupational therapy is also necessary to assist these patients with muscle strengthening, gait training, and self-care.
• Additional components of supportive rehabilitation include social work as well as neuropsychology evaluations and counseling.
Palliative Rehabilitation
• Focuses on providing care that reduces complications that may develop as cancer progresses. Palliative rehabilitation also provides supportive care interventions for the patient and family during this phase of the advancing cancer.
• Example – Occupational and physical therapists as well as speech-language pathologists work with lung cancer patients to help with bed mobility and positioning, swallowing, prevention of contractures, and adaptive equipment to assist with eating and self-care.
• Additional palliative rehabilitation clinicians include dieticians and nutritionists.

16
Side effects of cancer and cancer treatment Because many cancer survivors are so grateful to be alive, they consign themselves to suffer with the side effects of treatment and the disease, or they believe there is nothing that can be done to mitigate their discomfort. Rehabilitation not only addresses these issues, but also promotes a healthy lifestyle to reduce the possibility of cancer recurrence. Cancer treatment side effects that patients most likely experience include:
Cognitive dysfunction Sometimes called “chemobrain” or “chemofog,” patients have difficulty with memory, word processing, thinking clearly, concentration, multitasking, and performing daily living or work activities.
Fatigue Peripheral neuropathies Pain Generalized Weakness/Deconditioning Nutritional/Weight Issues Psychosocial Distress Mood disorders Bowel/Bladder/Sexual Dysfunction Fertility/Endocrine Dysfunction Sleep/Wake Disturbances Vocational Issues
Summary Cancer patients have been receiving rehabilitation at Mary Free Bed for years. We know first-hand how valuable rehabilitation is for survivors as they work to regain function, independence and hope. As the rate of survival increases, so concurrently does the need for specialized cancer rehabilitation.

17
REFERENCES Cancer Rehabilitation Program
Cancer Treatment and Survivorship Facts and Figures 2012-2013. American Cancer Society: Atlanta: 2012. Available at: http://www.cancer.org/acs/groups/content/@epidemiologysurveilance/documents/acspc-033876.pdf.
Cancer Treatment and Survivorship Facts and Figures 2012-2013. American Cancer Society: Atlanta: 2012. Available at: Siegel, R., DeSantis, C., Virgo, K., Stein, K., Mariotto, A., Tenbroek, S., et al. (2012).
Cancer Treatment and Survivorship Statistics 2012. Cancer, 62, 220-241.
Directory of cancer terms [homepage on the Internet]. National Cancer Institute (2006). www.cancer.gov/Templates/db_alpha.aspx?CdrlD=441257)
Gonzalez-Fernandez, M. & Friedman, J. D. (2011). Physical
Medicine and Rehabilitation Pocket Companion. Demos Medical Publishing: New York.
Michigan Public Health Institute and Michigan Department of
Community Health. The Cancer Burden in Michigan: Selected Statistics 1993-2011. September 2011.
Michigan Resident Cancer Incidence File, Michigan Department of
Community Health, Division for Vital Records and Health Statistics by December 29, 2011.
Mullan, F. (1985). Seasons of survival: Reflections of a physician
with cancer. New England Journal of Medicine, 313(4):270-3.
Taylor, R.M. (2011). Personalized Cancer Care, pp. 3-6. In: Cancer Rehabilitation and Survivorship: Transdisciplinary approaches to personalized care (Lester, J. L & Schmitt, P., Eds). Oncology Nursing Society Publications: Pittsburgh, PA.
U. S. National Institutes of Health (2013). Surveillance
Epidemiology and End Results Database. National Cancer Institute: Washington, DC: 2013. Available at: http://seer.cancer.gov/statfacts/html/breast.html Accessed 1/15/13.
Davis, MP; Feyer, P.C.; Ortner, P., & Zimmermann, C. (2011).
Supportive Oncology. Elsevier Sauders: Philadelphia, PA.

18
REFERENCES Wheelchair and Adaptive Sports Program
One Degree of Separation: Paralysis and Spinal Cord Injury in the United States retrieved from: http://www.christopherreeve.org/atf/cf/%7B3d83418f-b967-4c18-8ada-adc2e5355071%7D/8112REPTFINAL.PDF
Quality of life and identity: The benefits of a community-based therapeutic recreation and adaptive sports program by Ramon B Zabriskie, Neil R Lundberg, Diane G Groff, Therapeutic Recreation Journal (July 2005) Volume: 39, Issue: 3, Pages: 176-191, ISSN: 0040591, Therapeutic Recreation Journal
Spinal Cord Injury Information Network at the University of Alabama at Birmingham http://www.va.gov/adaptivesports/va_groups_main.asp
Sports and Employment among Americans with Disabilities http://dsusa.org/DSUSA-Srv09.pdf
Temple University Study http://www.atraonline.com/associations/10488/files/SummaryOutcomesTR.pdf
U.S. Department of Veterans Affairs web site
http://www.va.gov/adaptivesports/va_groups_main.asp