kendal, simon, gabonthone, lynette, gabotshajwe, edith...
TRANSCRIPT

Kendal, Simon, Gabonthone, Lynette, Gabotshajwe, Edith, Tumisang, Mogotsi, Iqbal, Mohammad Falaq, Moitho, Botlhe T, Setlalekgosi, Khumo, Smith, Connor William Reed, Tinmouth, Darren, Wilson, Adam and Flatters, Adam (2019) Selected Computing Research Papers Volume 8 June 2019. University of Sunderland, Sunderland.
Downloaded from: http://sure.sunderland.ac.uk/id/eprint/10822/
Usage guidelines
Please refer to the usage guidelines at http://sure.sunderland.ac.uk/policies.html or alternatively

contact [email protected].

Selected Computing Research Papers
Volume 8
June 2019
Dr. S. Kendal (editor)


Published by the
University of Sunderland The publisher endeavors to ensure that all its materials are free from bias or discrimination on grounds of religious or political belief, gender, race or physical ability. This material is copyright of the University of Sunderland and infringement of copyright laws will result in legal proceedings. © University of Sunderland Authors of papers enclosed here are required to acknowledge all copyright material but if any have been inadvertently overlooked, the University of Sunderland Press will be pleased to make the necessary arrangements at the first opportunity. Edited, typeset and printed by Dr. S Kendal University of Sunderland David Goldman Informatics Centre St Peters Campus Sunderland SR6 0DD Tel: +44 191 515 2756 Fax: +44 191 515 2781


Contents Page Critical Evaluation of Machine Learning Research Aimed at Improving Lie Detection Accuracy (Lynette Gabonthone) .......................................................................... 1 A Critical Evaluation of Current Published Face Recognition Systems Research Aimed at Improving Security for ATM transactions (Edith Gabotshajwe) .......................... 7 An Evaluation of Current Research Aimed at Improving Network Security in Internet of Things (IoT) (Tumisang Mogotsi) .................................................................... 13 Evaluating the currently proposed techniques to secure Software Defined Networks from Denial of Service (DDoS/DoS) attacks (Mohammad Fakhar Iqbal) ......................... 21 Evaluation of Current Load Balancing Techniques in a Software Defined Network Aimed at Improving Quality of Service (Mohammad Falaq Iqbal) ................................... 29 An Analytical Review of Published Face Recognition Research Aimed at Improving Accuracy in Identification (Botlhe T Moitho) .................................................................... 35 Evaluation Of Current Security Measures Used In Automated Teller Machines (ATM) (Khumo Setlalekgosi) ............................................................................................. 43 An In-Depth Evaluation of Current Limitations in Autonomous Vehicle Object Detection Systems (Connor William Reed Smith) ............................................................. 49 Critical Evaluation of e-learning and ICT Methodologies used to help those with Learning Difficulties (Darren Tinmouth) ........................................................................... 55 Analysis of Current Virtual Reality Methods to Enhance Learning in Education (Adam Wilson).................................................................................................................... 61 An Evaluation of Current Research into Machine Learning Aimed To Improve Weather Prediction (Adam Flatters) ................................................................................... 67


1
Critical Evaluation of Machine Learning Research Aimed at Improving Lie Detection Accuracy
Lynette Gabonthone
Abstract
Over the years, lie detection has gained interest across researches. The Polygraph technique, invented by John Augustus in 1921, has received critics across researches due to its inaccuracy and unscientific justification. Different methodologies have been researched as a way to come up with a much better technology to improve accuracy of the polygraph machine. This is to ensure that systems dependent on lie detection such as the legal systems, do not prosecute the innocent nor leave the guilt unprosecuted. This paper evaluates researches by different writers, to improve deception detection through machine learning. Conclusions pointed to the Electro-Encephalogram (EEG) Analysis standing a better chance at deception detection as it is not dependent on physiological reactions, but rather brain activity which is less likely to be influenced. The results lead to requiring more research to be carried out in order to improve the EEG technology for much finer results.
1 Introduction Lie detection polygraphs became a topic of interest in legal systems to backup evidence when administering justice. According to Badhe (2016), its unreliability resulted in it not being approved in most courts of law. The State of California has recorded 17 % failure of the polygraph resulting in false conviction of suspects (Bonpasse 2013). However, Harne and Tale (2015) claim that, the polygraph is currently the most widely used technique, but have not given any statistical values to support the claims, making their claims quiet biased and questionable. Dayal (2014) stated that since the invention of the polygraph, its accuracy to detect deception has remained vigorously debated and has forced researchers to develop more accurate techniques. This was supported by Rajoub and Zwiggelaar (2014) who mentioned that thermal facial analysis technique has been studied by different researchers to improve deception detection. Tale and Harne (2014) also mentioned that other techniques have been investigated for deception detection e.g. Electro-Encephalogram Analysis (EEG) and Radar based lie detection. This paper gives a critical evaluation of the current lie detection research on Thermal Facial Analysis, EEG and Radar based lie detection, based on their experiments, outcomes as well as the claims made by the researchers and their conclusions reached.
2 Current Lie Detection Methods This section reviews thermal facial analysis, EEG and radar based lie detection researches carried out by different researchers. It will discuss the method and the validity of the experiments as well as the implications of the results. 2.1 Thermal Facial Analysis Thermography is defined as a technique to record generated thermal radiation from the functioning of physical systems or the internal characteristics of heat interaction (Echeverry et.al. 2017). Rajoub and Zwiggelaar (2014) mentioned that thermal facial analysis is a non-contact approach for measuring physiological reactions. According to Echeverry et.al. (2017), the development of thermal imaging cameras enabled obtaining of images under infrared spectrum with a high resolution, focus and comes at a lower cost, and increases the number of people that are being examined. However, their claims do not provide a conducive environment to carry out interrogations as participants may always work together to share information, and the lower cost claims are subjective and may not apply across. Echeverry et.al. (2017) also claims that thermographic facial-analysis is less controversial, which contradicts with Rajoub and Zwiggelaar (2014) statement that the examinees periorbital area must directly face the camera as shown in figure 1, for easy detection of eye-corners used in the experiment. Echeverry et.al. (2017) claims remain

2
questionable, as there is not a solid reason to claim the less-controversial aspect of the technique as it seems as though the examinee is fully aware they are under interrogation.
Figure 1 Participants face during interrogation (Rajoub and Zwiggelaar 2014). Rajoub and Zwiggelaar (2014) carried out different experiments to simulate anxiety, guilt and innocence, as well as deception detection test to test the accuracy of thermal facial analysis. Echeverry et.al. (2017), Rajoub and Zwiggelaar (2014) carried out an experiment based on an assumption that human behavior such as facial expressions, result due to internal states such as stress caused by an attempt to conceal the truth that end up in physiological changes. These assumptions are to some extent questionable as there has not been any scientific justification that stress or anxiety is a result of deception, leaving the reason for carrying out the research quiet unconvincing. The design of the study, how long responses take, rehearsed or unrehearsed responses affect the strength of deception (Rajoub and Zwiggelaar, 2014). During the anxiety, guilt and innocence experiment, examinees were given an option of whether to lie or tell the truth (Echeverry et.al. 2017). Both Echeverry et.al. (2017), Rajoub and Zwiggelaar (2014) created mock crimes to create anxiety. During this experiment, the examinee would be given time in the interrogation room to think about what they are going to say. To test if rehearsed or unrehearsed deception affects the results of the test. The experimental simulation left gaps in-between as they did not cater for people who believe their stories to be true. Any person who believes their story to be true and believe what they saw could easily deceive both examiners, and the machines as they would remain calm and not raise any physical or psychological reaction.
According to Echeverry et.al. (2017), the participants were chosen from one university, but in different programs. This was done to reduce chances of the experiment proceedings being disclosed and they were given a payment just for participating, with the subject who manages to deceive the examiner getting triple the payment. The participants were informed that the experiment was testing their communication skills. The Economic and Social Research Council (ESRC) ethics clearly state that all the participants should be well informed of what the research is all about and what it intends to find out. However, with Rajoub and Zwiggelaar (2014) research, the examiners were not honest with the participants, which is against the ESRC ethics. Another experiment carried out was the deception detection test that was aimed at testing the accuracy of thermal facial analysis. Rajoub and Zwiggelaar (2014) mentioned that the participants attended two (2) examination sessions (lie and truth), with a character profile provided to them that they had to learn a few minutes before the interrogation could commence. The interrogations were two (2) hours apart. However, Rajoub and Zwiggelaar (2014) did not mention why they felt the need for interrogations to be two hours apart, which could be enough time for the participant to rehearse what they previously said for accuracy. In addition, they did not state why the need for two (2) sessions which clearly could have an effect on the results. Figure 2 below shows an experimental setup with the examinee facing the camera and examiner caring out the investigation.
Figure 2 The examinee carrying out the interview. Rajoub and Zwiggelaar (2014)

3
Rajoub and Zwiggelaar (2014) mentioned that as the interview commences, the examiner asks the participant four (4) baseline questions about themselves that were not part of the experiment to register the resting thermal state of the participant. Figure 3 below shows the variances in thermal state during different kinds of questionings.
Figure 3 Participants representation of thermal reactions during an interrogation (Echeverry et.al. 2017) Echeverry et.al. (2017) mentioned that non-accusatory questions in the first phase of the interview were meant to record the resting thermal physiological reactions of the participant, while the accusatory questions were meant to increase the stress levels if the participant is being deceptive and lastly the non-accusatory questions were supposed to take back the stress levels to resting baseline. Their claims were supported by Rajoub and Zwiggelaar (2014), who argued that, an attempt to conceal the truth may result in change in physiological changes. Making it reasonable to take the participants through different phases of questioning. Between-person approach: this approach is known as the leave-one-person-out, and determines whether deception patterns are similar across all populations (Rajoub and Zwiggelaar 2014). Ibraheem (2016) argued that, it did not make sense to classify all persons with the same results. In addition, Rajoub and Zwiggelaar (2014) results prove that different persons react differently when being deceptive, as shown on table 1 below. Therefore, it is not an appropriate measure to classify deception.
Table 1: classification using between person approaches (Rajoub and Zwiggelaar 2014). Within-Person Approach: According to Vrij (2016), this is the most proven method to classify deception, as it is based on individuals derail from the baseline behavior. Rajoub and Zwiggelaar (2014) supported Vrij (2016) claims that there are people who are simply bad liars and those who are good liars and that people react differently when being deceptive. From both the researchers, it proves to be the fairest and most effective approach. The deception detection approach used by Rajoub and Zwiggelaar (2014) to some extent proves accurate in lie detection, as it bases its results on the examinees deviation from the baseline. The baseline is first analyzed during the small talk into the interrogation. It however fails to touch bases on how to tell if someone is being deceptive based on what they believe to be true, as mentioned previously under simulation of anxiety, innocence and guilt. Therefore, it would fail to cover areas where the person giving evidence believes their story to be true. In addition, some people are just good at telling lies and may not show any deviations from the said baseline, e.g. experts who have been trained on espionage or military bases. Rendering Thermal Facial analysis, a less efficient method to detect deception. 2.2 Electro-Encephalogram During EEG analysis, a sample of Guilt Knowledge test is collected. The questions collected include critical items and non-critical items. Tale and Barne (2014) outlined that the P300 brain wave is triggered whenever a person recognizes something familiar. In addition, Badhe et.al. (2016) mentioned that, the P300 may be used to uncover concealed knowledge that only the examinee is familiar with. Tale and Barne (2014) and Badhe et.al. (2016) carried out an experiment to analyze EEG. Badhe
4
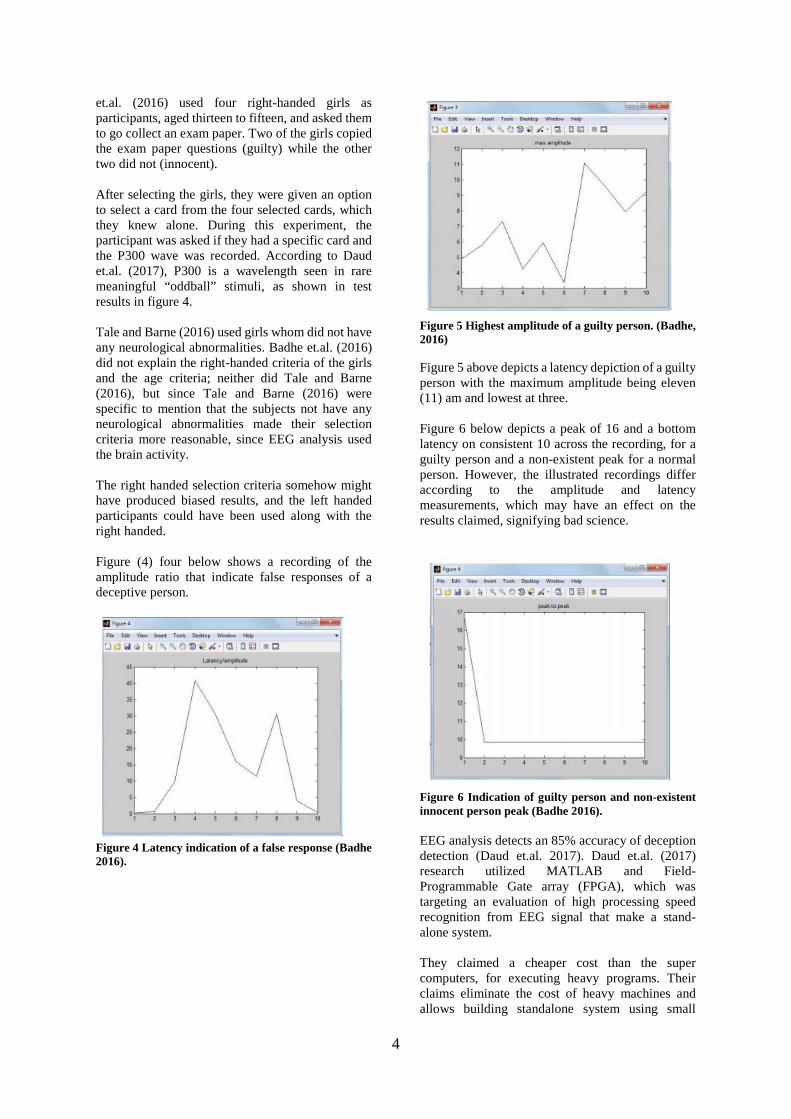
et.al. (2016) used four right-handed girls as participants, aged thirteen to fifteen, and asked them to go collect an exam paper. Two of the girls copied the exam paper questions (guilty) while the other two did not (innocent). After selecting the girls, they were given an option to select a card from the four selected cards, which they knew alone. During this experiment, the participant was asked if they had a specific card and the P300 wave was recorded. According to Daud et.al. (2017), P300 is a wavelength seen in rare meaningful “oddball” stimuli, as shown in test results in figure 4. Tale and Barne (2016) used girls whom did not have any neurological abnormalities. Badhe et.al. (2016) did not explain the right-handed criteria of the girls and the age criteria; neither did Tale and Barne (2016), but since Tale and Barne (2016) were specific to mention that the subjects not have any neurological abnormalities made their selection criteria more reasonable, since EEG analysis used the brain activity. The right handed selection criteria somehow might have produced biased results, and the left handed participants could have been used along with the right handed. Figure (4) four below shows a recording of the amplitude ratio that indicate false responses of a deceptive person.
Figure 4 Latency indication of a false response (Badhe 2016).
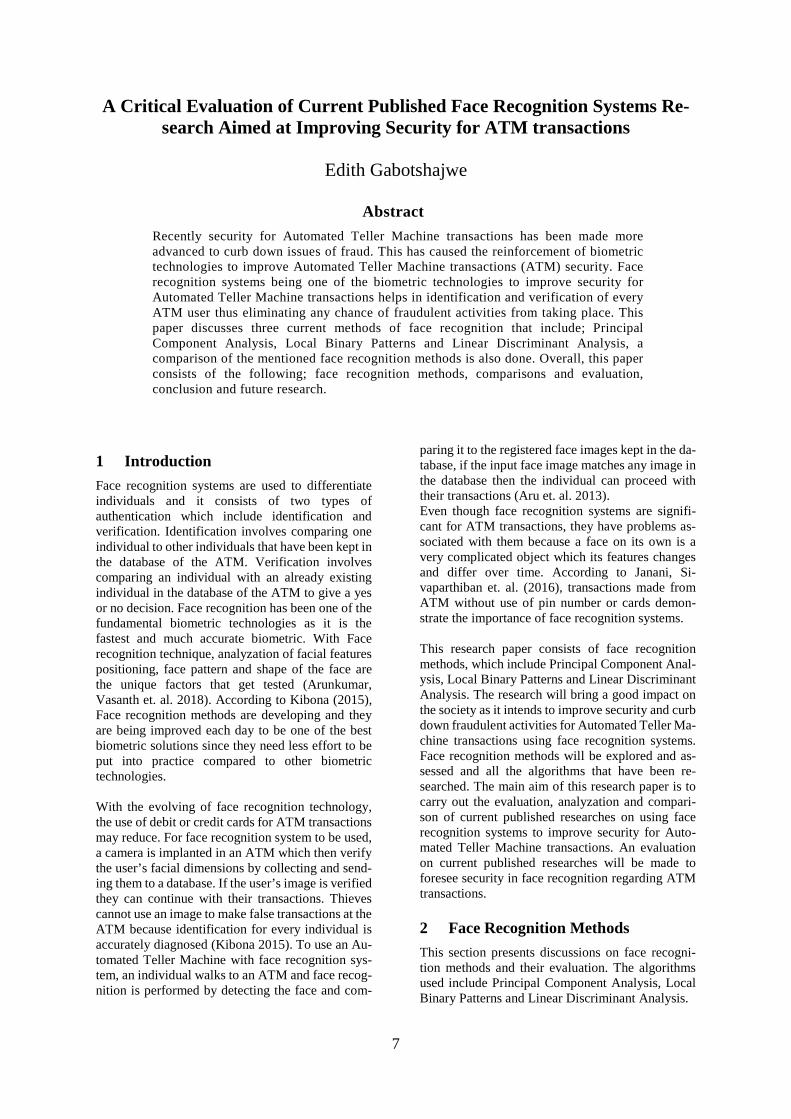
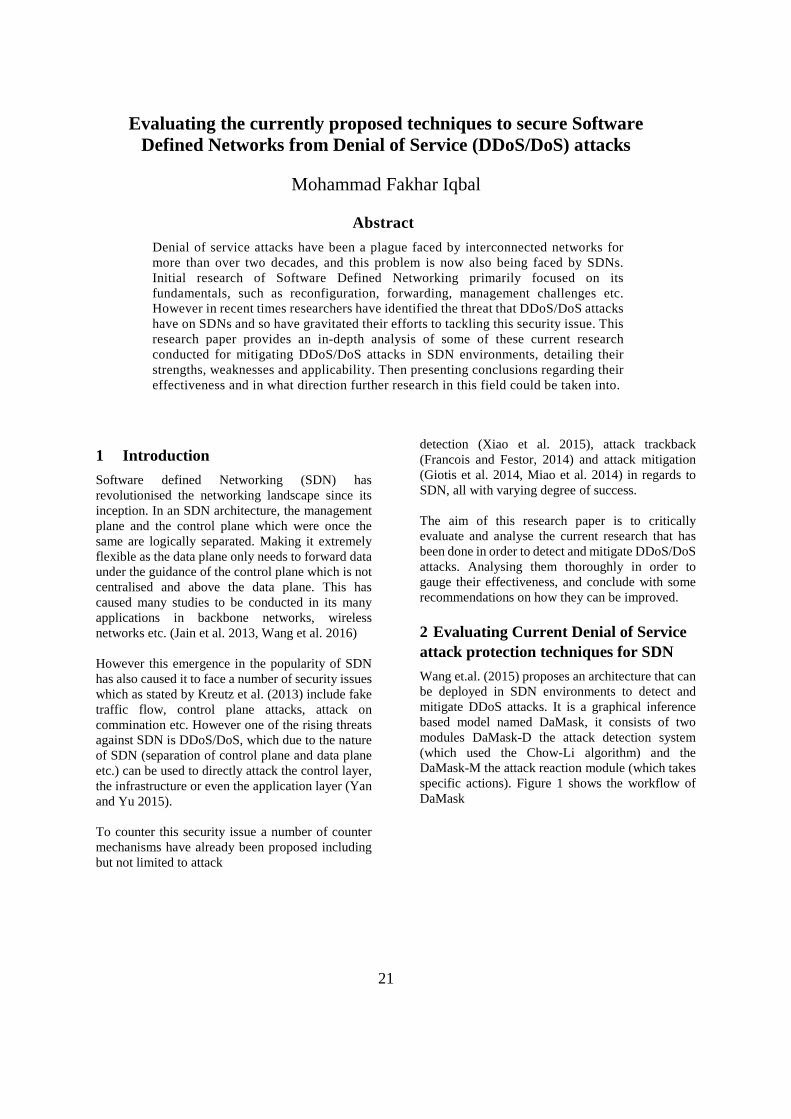
Figure 5 Highest amplitude of a guilty person. (Badhe, 2016) Figure 5 above depicts a latency depiction of a guilty person with the maximum amplitude being eleven (11) am and lowest at three. Figure 6 below depicts a peak of 16 and a bottom latency on consistent 10 across the recording, for a guilty person and a non-existent peak for a normal person. However, the illustrated recordings differ according to the amplitude and latency measurements, which may have an effect on the results claimed, signifying bad science.
Figure 6 Indication of guilty person and non-existent innocent person peak (Badhe 2016). EEG analysis detects an 85% accuracy of deception detection (Daud et.al. 2017). Daud et.al. (2017) research utilized MATLAB and Field-Programmable Gate array (FPGA), which was targeting an evaluation of high processing speed recognition from EEG signal that make a stand-alone system. They claimed a cheaper cost than the super computers, for executing heavy programs. Their claims eliminate the cost of heavy machines and allows building standalone system using small

5
hardware that emits good performance. Due to the above stated arguments, EEG proves to be quiet a reasonable method of lie detection to be considered. 2. 3 Radar Based Lie Detection Naidu et.al. (2014) explained radar based lie detection as a non-contact, non-invasive, uncontroversial technology that uses Ultra Wide-Band (UWB) pulses. They went on to mention that, UWB passes through the human thorax then echoed back by the heart walls. Badhe et.al. (2016) mentioned that a heartbeat could be detected from a distance of 15 to 20 cm away from the heart.
Figure 7 Radar-based detection test environment (Naidu et.al. 2014). In figure 7 of a diagram simulating test environment above, the participant was asked to seat on a chair and a radar placed behind the chair. According to Naidu et.al. (2014) electro-cardiograph signal and the UWB signals were passed through the thorax, with an electro-cardiogram (ECG) comprising of P, Q, R waves. From the experiment, it was mentioned that only the R waves were detected. Naidu et.al. (2014) does not explain why the R waves were the only ones selected and what selection criteria was followed. This action renders the experiment biased, and may have the results influenced. Despite its incredible features, the radar based lie detection method is dependent on the physical reactions of the participants, associated with anxiety. Still to date, there has not been any scientific justification relating anxiety to being deception. The radar based lie detection may just be viewed as a non-contact polygraph, as they bear the same qualities just that the other one is contact and the other is non-contact. Claims by Naidu et.al. (2014) of the technique not being stealthy are to some extent not true, as the radar would have to be placed behind the participant. Due to the above arguments, radar based may not be referred to as a technique to improve lie detection accuracy, as it does not help with the accuracy or anything for that matter but rather an enhanced polygraph.
4 Recommendations The use of EEG, as it is not dependent on physical reaction but rather brain activities that are almost impossible to influence remains a better option for lie detection. Other methodologies that depend on physiological reactions need more research to associate anxiety with deception. 5 Conclusions This paper evaluated different researches carried out by the different researchers to improve deception detection. The researches included Facial thermal analysis, EEG analysis and radar based detection. Upon critically evaluating the above-mentioned technologies, it clearly shows that the EEG analysis is the most suitable methodology to detect deception. This is because it is more focused on the brain waves of the participant that are close to impossible to be tempered with or influenced. Even though there is still room for improvement in the application of the EEG to not be pinned on the participant, to reduce controversies. The results of this research will benefit the entire human race as it would allow recruiting agencies, security and law enforcement organizations to detect deception. This will help in refining investigations where necessary, enforce laws world-wide as well as fight corruption, and separate the good and the bad guys. Facial thermal analysis and Radar based lie detection still leave loopholes on the claims that becomes hard to consider as a lie detection method. As long as there is a questionable relationship between stress, anxiety and deception, the lie detection methodologies dependent on physical reactions will remain questionable. References Badhe S.G, Bombatkar U.P, Khandelwal R.J, Juilee D. Mahajan J.D, 2016, ‘Analysis of EEG Signals for Deception Detection’, International Journal of Advanced Research in Electrical, Electronics and Instrumentation Engineering, Vol 5 (2), Pages 836-843. Daud M.I., Khan Z., Jiang A., Khan M.I, Haider S.K., 2017, ‘Evaluation of P300 based Lie Detection Algorithm’, International Journal of Advanced Research in Electrical, Electronics and Instrumentation Engineering, Vol 7 (3), Pages 69-76.

6
Echeverry S., Belalcázar-Ramírez H., Loaiza-Echeverry H., Nope-Rodríguez S., Pinedo-Jaramillo, C., Restrepo-Girón A., 2017, ‘Detection of lies by facial thermal imagery analysis’, Revista Facultad De Ingeniería, Vol 26(44), Pages 47-59. Goswami H., Kakker A., Ansari N., Lodha A., Pandya A., 2016, ‘The Deception Clues in Forensic Contexts’, The Lie Detection Psychology. Vol 1(113), Pages 1-3. Ibraheem M., 2016, ‘Thermal Imaging in Face Recognition and Deception Detection’, International Journal of Research in Advent Technology, Vol 4 (11), Pages 11-15. Judee B., 2018, ‘Expectancy violations theory’, International Encyclopedia of Interpersonal Communication, Vol (0) Pages 1 – 12.
Naidu Dr. C.D., Sahu K.N. and Sankar Dr. K.J., 2014, ‘Radar based lie detection technique’, Global journal of researches in engineering: Electrical and Electronics Engineering, Vol 14 (5), Pages 7-8. Rajoub B.A. and Zwiggelaar R., 2014, ‘Thermal facial analysis for deception detection’, IEEE Transactions on information forensics and security, Vol 9 (6), Pages 1015-1023. Tale R.D. and Harne B.P., 2015, ‘Deception detection method using independent component analysis of EEG signals’, International Journal of Advanced Research in Electronics and Communications Engineering, Vol 4 (5), Pages 1293-1297. Vrij A., 2016, ‘Baselining as a lie detection method’, Applied Cognitive Psychology, Vol (30), Pages 1112- 1119.
7
A Critical Evaluation of Current Published Face Recognition Systems Re-search Aimed at Improving Security for ATM transactions
Edith Gabotshajwe
Abstract
Recently security for Automated Teller Machine transactions has been made more advanced to curb down issues of fraud. This has caused the reinforcement of biometric technologies to improve Automated Teller Machine transactions (ATM) security. Face recognition systems being one of the biometric technologies to improve security for Automated Teller Machine transactions helps in identification and verification of every ATM user thus eliminating any chance of fraudulent activities from taking place. This paper discusses three current methods of face recognition that include; Principal Component Analysis, Local Binary Patterns and Linear Discriminant Analysis, a comparison of the mentioned face recognition methods is also done. Overall, this paper consists of the following; face recognition methods, comparisons and evaluation, conclusion and future research.
1 Introduction Face recognition systems are used to differentiate individuals and it consists of two types of authentication which include identification and verification. Identification involves comparing one individual to other individuals that have been kept in the database of the ATM. Verification involves comparing an individual with an already existing individual in the database of the ATM to give a yes or no decision. Face recognition has been one of the fundamental biometric technologies as it is the fastest and much accurate biometric. With Face recognition technique, analyzation of facial features positioning, face pattern and shape of the face are the unique factors that get tested (Arunkumar, Vasanth et. al. 2018). According to Kibona (2015), Face recognition methods are developing and they are being improved each day to be one of the best biometric solutions since they need less effort to be put into practice compared to other biometric technologies. With the evolving of face recognition technology, the use of debit or credit cards for ATM transactions may reduce. For face recognition system to be used, a camera is implanted in an ATM which then verify the user’s facial dimensions by collecting and send-ing them to a database. If the user’s image is verified they can continue with their transactions. Thieves cannot use an image to make false transactions at the ATM because identification for every individual is accurately diagnosed (Kibona 2015). To use an Au-tomated Teller Machine with face recognition sys-tem, an individual walks to an ATM and face recog-nition is performed by detecting the face and com-
paring it to the registered face images kept in the da-tabase, if the input face image matches any image in the database then the individual can proceed with their transactions (Aru et. al. 2013). Even though face recognition systems are signifi-cant for ATM transactions, they have problems as-sociated with them because a face on its own is a very complicated object which its features changes and differ over time. According to Janani, Si-vaparthiban et. al. (2016), transactions made from ATM without use of pin number or cards demon-strate the importance of face recognition systems. This research paper consists of face recognition methods, which include Principal Component Anal-ysis, Local Binary Patterns and Linear Discriminant Analysis. The research will bring a good impact on the society as it intends to improve security and curb down fraudulent activities for Automated Teller Ma-chine transactions using face recognition systems. Face recognition methods will be explored and as-sessed and all the algorithms that have been re-searched. The main aim of this research paper is to carry out the evaluation, analyzation and compari-son of current published researches on using face recognition systems to improve security for Auto-mated Teller Machine transactions. An evaluation on current published researches will be made to foresee security in face recognition regarding ATM transactions.
2 Face Recognition Methods This section presents discussions on face recogni-tion methods and their evaluation. The algorithms used include Principal Component Analysis, Local Binary Patterns and Linear Discriminant Analysis.

8
2.1 Local Binary Patterns Method Local binary patterns improve performance for de-tecting faces precisely and often on some datasets when combined with Histogram descriptor (Kapil & Jain 2015). According to Kapil & Jain (2015), In Lo-cal binary patterns the facial image is divided into the logical regions and texture descriptor is extracted from these regions and these are concatenated to form a global description of the face. Local binary patterns present a texture description and the opera-tor labels the pixels of the face image by threshold-ing the 3*3 neighborhood of each pixel with the cen-ter value and considering the result as a binary num-ber and later the histogram with the labels can be used as a texture operator (Shah & Ukani 2014).
Figure 1 show Logical binary patterns decoding which represent 3*3 neighborhood of pixels be-ing compared (Kapil & Jain 2015) Local binary pattern (LBP) is used in different ap-plications even the ATM machine and it is consid-ered the finest performing texture descriptors (Arunkumar V, Vasanth Kumar V et. al. 2018). To present a given face image, histograms estimated from Local binary patterns are linked together to form a single histogram sequence. Histogram T of image f (x, y) can be defined as:
Equation 1 (Zhang W et. al. 2016) The h represents number of pixels for an image with gray level and i represent the gray level.
Equation 2 (Zhang W et. al. 2016) Equation 2 shows a histogram where images were represented which had local facial patterns infor-mation including also features of a face that could either be face edges, location, eyes etc. In case of using an ATM machine, a database is used for storing captured and detected user images, once the image is stored any user who uses the ATM ma-
chine their face images are detected and if their im-age exists in the database they can proceed with their transactions. Nonetheless, challenges may arise as facial expressions for users may be different and dif-ficult to control. The local binary pattern operator can be displayed to compare every pixel value with center pixel together with the center pixel value.
Figure 2 (Condole & Salunkhe 2018) Figure 2 shows an example of face images on a da-tabase that could be a bank database. The local bi-nary features are extracted from face images for them to be recognized. The face images show differ-ent expressions and they depend on environment conditions and lighting. The input face image is compared with different images that exist in the da-tabase.
Table 1 show experiment results of each local face image database recognition (Gondole & Salunkhe 2018) From the experiment results, the percentage for LBP face recognition differs from 65.281% to 100% with total average of 76.96%. Local Binary Pattern show higher percentages because it is more powerful in facing conditions and getting better face recognition compared to LDA and PCA which decreases face recognition due to face conditions. Local Binary Pattern is one of the greatest face recognition systems as it present good outcomes. Face images can be combined into micro patterns, which could be edges, lines, spots or flat surfaces and all these can be greatly defined by Local binary patterns as it has about 99% rate for face recognition.
2.2 Principal Component Analysis Method Principal Component Analysis (PCA) is a face recognition method which performs a reduction of dimensions by carrying out extraction of principal components of multi-dimensional data (Shah &

9
Ukani 2014). With PCA, representation of faces is in a linear form with Eigen faces. Both Principal Component Analysis and Eigen faces present small number of features, which provide fundamental in-formation that is used for classifying purposes. Ac-cording to Saiteja, Vasavi et al (2016), Principal component analysis method converts faces into a small set of vital features being the main compo-nents of the initial set of learning images, recogni-tion is then taken into process by presenting new im-ages in the dataset after an individual is identified by matching it with positions of already existing indi-viduals.
Figure 3 show representation of a face by a small number of features (Beham & Roomi 2013) The benefit of using Principal component analysis method compared to other face recognition systems is because of its speed, simplicity and insensitivity to small and regular changes that affect the face (Sa-iteja, Vasavi et. al. 2016). Principal component anal-ysis uses distance to compare identical faces by ex-tracting their features. When using Principal Com-ponent Analysis, first an individual image is recog-nized and processed as they approach the ATM ma-chine, the face is then detected and processing takes place. A dataset is then presented for the face image inputs to be stored. To ensure face verification the following are performed; capturing of the image, de-tecting face, extracting face characteristics and test-ing the image with the already existing images stored in the database. If the face verification goes well an individual can begin with their transactions automatically.
Figure 4 show representation of stored images in a database that were used for testing (Saiteja, Vasavi et. al. 2016) Testing was done by using eight faces from the da-tabase that were taken from the database that were captured from the ATM machine web cam. From the main initial set of images, ten images were used in
which 8 were known and 2 were unknown. All im-ages were put in the same position and they could either be colored or not. For the captured face to be recognized the distance of each image from the da-tabase was calculated. After that results showed which image from the database equals the image be-ing presented for testing. If the results showed that the testing image equals any image from the data-base, then an individual gets prompt to proceed with their ATM transactions else they cannot proceed to any step.
Figure 5 show result of testing which prompt an individual to proceed with their transactions (Sa-iteja, Vasavi et. al. 2016) From the experiment result above, it may come to a conclusion that face recognition works much better with Principal component analysis when testing is done with many images available in the database to match the face features. Principal Component Anal-ysis identifies and eliminates multi-collinearities in the information provided and it present the data in accord to directions in which mostly the data pro-vided varies. According to Beham & Roomi (2013), Principal Component Analysis is considered the best global compact representations. With Principal Component Analysis 90% of the total variance is contained in 5-10% of the dimensions compared to other face recognition methods (Karovaliya, Kare-dia et. al. 2015). This experiment was going to be more accurate and the results produced were going to be of high quality if repetition was done and if the faces used for test-ing were showing different expressions.
2.3 Linear Discriminant Analysis Method According to Zainudin et al (2012), Linear Discri-minant Analysis (LDA) is based on appearance method and it is used in a linear combination of fea-tures that are characterized by classes of objects, representation of each face image is by a large num-ber of pixel values. Before classifying images LDA decreases the number of features for ease of manage. LDA works on class frequencies that are not the same and their performance are examined on ran-domly generated test data (Zainudin et. al. 2012). Compared to PCA which concentrate more on clas-sification of features, LDA focuses more on classi-fying data.

10
In case of identifying and classifying a user for an ATM machine, when carrying out testing, Linear Discriminant Analysis makes an optimal linear dis-criminant function which draws the input face image into a classifying space where identification is car-ried out based on Euclidean distance. The main goal for Linear Discriminant Analysis is to find effi-ciency in representing face image vector space. For face images that are stored in a database, Linear Dis-criminant Analysis works on different variables of an object and figure out which group the object may belong to.
Figure 6 show different expressions of an input face image in a database (Zainudin et. al. 2012) When carrying out experiments two databases were used for testing. Linear Discriminant Analysis was compared with Principal Component Analysis by testing both of them. The one database had ten unique face images with forty distinct subjects and the face images taken had different expressions and were taken in different conditions. The other data-base had images with different expressions and dis-tinct subjects which had 11 different expressions and pose for each face.
Figure 7 show accuracy results of LDA compared with PCA (Zainudin et. al. 2012) Figure 7 above show accuracy of input face image being compared to images existing in the database, 50% of images in the database were taken as a train-ing set while the remaining 50% were taken for test-ing. In that manner results showed that LDA has more face recognition accuracy of 93% when com-pared to PCA which has face recognition accuracy of 89.5%.
Linear Discriminant Analysis is the best method for face recognition because when compared to Princi-pal Component Analysis and Local Binary Patterns it is much better as it presents more accuracy. When testing in small or large dataset to generate results, Linear Discriminant Analysis is faster than Principal Component Analysis. 3 Comparison and Evaluation of Face Recognition Methods This section presents comparison of the three algo-rithms mentioned above. Results show that when testing using four different datasets Linear Discriminant Analysis proves to be performing much better than Principal Component Analysis as the results showed that it has higher total average of 83.1%. For Principal Component Analysis, when datasets are transformed to be in different space their loca-tion and shape changes whereas for Linear Discri-minant Analysis the datasets location and shape stays the same and comparison is made between the classes given. When accuracy is tested, Linear Dis-criminant Analysis performs much better compared to Principal Component Analysis. Even though Linear Discriminant Analysis is the best when compared to Principal Component Anal-ysis, PCA is known for its simplicity, speed and its insensitivity to small and regular face changes whereas LDA sometimes find it difficult to control facial expressions for users who may be different. Results show that Local Binary Pattern is the best and most effective method for face recognition when compared to other methods. When compared with PCA and LDA, LBP is much powerful when facing some factors that could be speed, environment con-ditions or lightning and it performs better for face recognition. The LBP has a face recognition rate of 99% which is the highest compared to PCA and LDA. 4 Conclusions Face recognition is a biometric technique that can be used in different applications for security means. That is why it was chosen to be applied in improving security for ATM transactions. It was found that the face image expressions, face edges, lines, spots, flat surfaces, environment conditions are the factors that affect the accuracy for face recognition. Moreover, the comparisons for the face recognition methods which were; Local Binary Patterns, Principal Com-ponent Analysis and Linear Discriminant Analysis was carried out regarding experiments that were

11
done in line with ATM security. Results from the experiments showed that Local Binary Pattern method has the highest face recognition rate of 99% and its percentage for face recognition differs from 65.281% to 100% with total average of 76.96%. Lo-cal Binary Pattern is considered the best face recog-nition method. In general, this research brought good results even though only three methods were studied which were affected by some factors during experiments. 5 Future Works The algorithms used in this paper have shown good results and they are positive to be used for ATM se-curity transactions. It has been found that with Local Binary Pattern method better results are produced for face recognition. More improvement can be made for PCA and LDA to produce good results by combining them together since each method carries an advantageous role. As the given time was not friendly enough the re-searcher was not able to look more on the other face recognition methods that could bring more good re-sults than the studied methods. For the future, consideration on more databases with different variations should be carried out. Algorithms for face recognition can be produced by observing the disadvantages on the already studied algorithms.
References Aru, Eze Okereke, Gozie Ihekweaba, 2013, ‘Facial Verification Technology for Use in Atm Transac-tions.’ American Journal of Engineering Research (AJER), Vol 2, Issue 5, pp 188-193 Arunkumar V, Vasanth Kumar V, Naveenly King K, Aravidan T, 2018, ‘ATM Security Using Face Recognition.’ Technical Research Organization In-dia, Vol 5, Issue 4 Beham Parisa. M, Roomi Mansoor Mohamed. S, 2013, ‘A Review of Face Recognition Methods.’ In-ternational Journal of Pattern Recognition and Ar-tificial Intelligence, Vol 27, No. 4
Gondole Devendra, Salunkhe A. P, 2018, ‘Face Recognition Based on Local Binary Pattern.’ IJSRSET, Vol 4, Issue 1 Janani. S. R, Sivaparthiban. C. B, Lekha. T. R, 2016, ‘Secured Credit Card Transactions Using Webcam.’ International Research Journal of Engineering and Technology (IRJET), Vol 3, Issue 4 Kapil Deeksha, Jain Abhilasha. Er, 2015, ‘A Brief Review on Feature Based Approaches for Face Recognition.’ International Journal of Science and Research (IJSR), Vol 4, Issue 5 Karovaliya Mohsin, Karedia Saifali, Oza Sharad, Dr Kalbande. D. R, 2015, ‘Enhanced security for ATM machine with OTP and Facial recognition features.’ International Conference on Advanced Computing Technologies and Applications (ICACTA), Vol 45, pp 390-396 Kibona Lusekelo, 2015, ‘Face Recognition as a Bi-ometric Security for Secondary Password for ATM Users. A Comprehensive Review.’ IJSRST, Vol 1, Issue 2 Saiteja Bala. P, Vasavi. K, Prasad Sathveek. A. M, Ramakrishna. K, Prasad. V. D. K. V. V, 2016, ‘En-hanced Security for ATM Transactions using Facial Verification.’ International Journal of Electronics and Communication Engineering, Vol 3 Issue 3 Shah Keyur, Ukani Vijay, (2014), ‘Efficient Face Recognition System Using Hybrid Methodology.’ International Journal of Advanced Research in En-gineering and Technology (IJARET), Vol 5, Issue 4, pp 179-189 Zainudin Shah M. N, Radi H. R, Abdullah Muniroh. S, Rahim Abd Rosman, Ismail Muzafar. M, Idris Idzdihar. M, Sulaiman. A. H, Jaafar. A, 2012, ‘Face Recognition using Principle Component Analysis (PCA) and Linear Discriminant Analysis (LDA).’ IJECS, Vol 12, No 5 Zhang Wenchao, Shan Shiguang, Gao Wen, Chen Xilin, Zhang Hongming, 2016, ‘Local Gabor Binary Pattern Histogram Sequence (LGBPHS): a novel non-statistical model for face representation and recognition.’ School of computer science and tech-nology

12

13
An Evaluation of Current Research Aimed at Improving Network Security in Internet of Things (IoT)
Tumisang Mogotsi
Abstract
This paper provides a critical evaluation of current research aimed at improving the network security of Iot devices. As a result of its heterogeneity regarding network architecture and transfer protocols the Iot network has often been a victim of various network attacks such as denial of service which get stronger every year increasing the cost of producing security patches and tools for the gadgets. This paper focuses on Software Defined Network, Secure Key Distribution, Machine Learning and Block-Chain Security in securing the Iot network. Findings from the paper indicate that Machine learning has a 75.75 % in detecting network intrusion on the network. Comparison of methods is carried out through the paper to determine which method is potent and recommendations are made on improving each discussed method.
1 Introduction Iot devices are vastly turning into a member of our day to day lives, with every new gadget another one emerges that can be merged with it to enhance or improve performance. These devices mostly rely on internet connection to allow them to gather and share data with users and because they are affordable a large number of individuals are purchasing and installing them in their homes, offices and for personal use. Qin Z. et al, (2014) states that with the increase in trend securing the data that is shared/transferred amongst devices should be a priority. Moharana N. S. et al, (2017) stresses out that Securing the Iot network is rather difficult because of the heterogeneity of the devices, “there are some additional threats and vulnerabilities because of the unprotected and unsafe channels of communication, limited resources, and limited bandwidth” ( Eltaeib T. et al,2014 ). In a study to find out the impact of DDOS attacks in multiple types of Iot network protocols, Zunnurhain K. et al, (2018) deduced that by just flooding one resource server the whole system can collapse. Xu Q. et al, (2016) elaborates that with emerging broadcast protocols such as the 5G wireless communication eavesdropping on the devices is still a major concern and the strategies used on the previous protocols should not repeated looking into the next generation of technological communication.
Keoh L.S. et al (2017) proposes a standard security framework for securing the transfer channels by using Datagram Transport Layer Security. As a result of not supporting any security firewalls or diagnostic tools, the cost of deploying security features gets very expensive. This research paper will evaluate the current techniques used to secure the Iot network, it is organized as follows. Section 2 discusses and evaluates current methods used to secure the Iot network. Section 3 gives comparisons of the discussed methods and Conclusions on the research paper is discussed at section 4.
2 Evaluation of Methods used to secure the IoT Network
In this section of the paper we will discuss four methods namely; Software Defined Networking, Secure Key Distribution, Machine Learning and Block Chain.
2.1 Software Defined Networking Qin Z et al (2014) proposes that SDN can be used for securing the Iot network by developing a networking architecture using SDN components. The researchers insist that the proposed network will be able to function effectively across all the heterogeneous wireless network channels. To prove their claims Qin Z. et al (2014) carried out a simulation experiment on using the Qualnet simulation platform to design multiple scenarios for the various network protocols e.g. WIFI, BLUETOOTH. The researchers used OpenFlow SDN controller and altered the flow scheduling of

14
the controller to access the network state and the links between the nodes. For each flow on the network they classified it as delay, throughput and jitter.
Figure 1 operational flow diagram of the proposed SDN architecture, Qin Z et al, (2014).
Figure 2 Node Jitter Comparison using proposed algorithm, Qin Z et al, (2014).
Figure 3 Node Delay Comparison using proposed algorithm Qin Z et al, (2014).
Figure 4 Node Throughout put Comparison using proposed algorithm, Qin Z et al, (2014). The authors compared the performance of their framework against two other methods used in the Iot network SDN architecture. Therefore, concluded that the proposed technique operates better in the Node Jitter scenario. They do acknowledge that the method needs improvement in the case of Node delay. The experiment from Qin Z et al, (2014) presents no bias, the researchers compared their technique with other techniques to check if their method is effective although did not present comparison results. Also, they were clear on how they conducted the experiment, allowing other researchers to test for themselves. Tang A.T. et al, (2016) proposes an improved SDN architecture that uses a deep learning approach to improve Network Intrusion Detection.
Figure 5 Proposed SDN Security Architecture, Tang A.T et al (2016). The security architecture aims to take advantage of Machine Learning ideologies to improve SDN architecture. It works by managing traffic on the network using SDN controller and allows the machine learning algorithm to extract information on the network by separating malicious packets from normal ones.

15
Tang A.T et al, (2016) developed a Deep Neural Network for intrusion detection which was implemented tested on the NSL-KDD Dataset. In the execution of the experiment the researchers preferred to use six features obtained from the SDN controller. The model was evaluated using the Confusion Matrix.
Table 1 Attacks on the NSL-KDD Dataset, Tang A.T et al, (2016).
Table 2 above shows the learning rate of the deep learning model on the SDN architecture.
Table 4 above shows accuracy rate for different learning rates, Tang A.T et al, (2016). Conclusions from the authors is that they were able to detect the malicious packets on the network. Results from the above tables indicate that decreasing the loss rate will increase the learning rate subsequently the accuracy rate. The experiment carried out presents no bias and the setup was well documented. Outcomes from the experiment are well presented. The researchers carried the experiment multiple times and compared their algorithm against other machine Learning algorithms and mention that their accuracy level was at 75.75%.
Table 5 above compares the DNN Model against other Machine Learning Algorithms, Tang A.T et al, (2016). The above experiments are justified and were conducted on multiple scenarios without any bias towards the proposed method. The experiments were well explained and documented. The proposed method can be effective in monitoring traffic flow and detecting malicious attacks on the Iot network, concern is on finding out on where the attack might be coming from and cutting out the source.
2.2 Secure Key Distribution All Key Distribution functions by requiring a sensor node on the network to solve computing algorithms before sending or receiving data, the keys are shared amongst the devices before any communication. Hajjar E.A. (2016) carried out an investigation using Eschenauer and Giglor Algorithm to find out the performance of the algorithms in securing Iot network nodes and the percentage of leaves in the Routing in Low Power (RPL). The research focused on 6LoWPAN Iot networks and the keys were generated randomly using Random techniques.
Figure 7 Number of Motes Vs Percentage of Shared of Keys for various pool sizes, Hajjar E.A (2016). The experiment was carried out in a simulation environment and presents no bias. The graph above shows the number of motes in comparison to the keys shared by the motes. The authors compared the RPL against Distributed Sensor Networks (DSN) and concluded their algorithms does not offer full secure connection on the network, only 54.01% of

16
nodes shared a key. This means links between nodes are not secure. Moharana et al (2017) aimed to secure Key Distribution in Iot network by using Balanced Incomplete Block Design (BIBD) to enforce a Key Management Policy. The authors propose a network architecture that uses a gateway/master key to keep track of all communication occurring in a user group and all devices below it.
Figure 8 Proposed Network Architecture, Moharana et al, (2017) A simulation experiment was carried to find out malicious nodes circulating between user groups on the network connection. For their experiment they used the Diffie-Hellman Algorithm for Key exchange.
Table 6 Resiliency metrics of Nodes, Moharana et al, (2017). Table 6 indicates the Resiliency Metric of the nodes against possible capture or being compromised. Moharana et al (2016) later describes that not all links between nodes are considered only a select few are taken. This means they only take the best possible links or strongest. Although the work carried out by the authors demonstrate levels of testability and reproducibility. Both Key Distribution methods have a low rating when it comes to securing nodes on the network. This may be due to the encryption speed of the nodes
and also the low bandwidth of Iot devices. This can affect the time taken to send a response on the key. Major issue of SKD is its inconsistency in channeling the link between the nodes. One major difference between SDN and SKD is room for scalability on the network, SKD does not offer any monitoring on the network it investigates the use of cryptography on securing nodes on the network while SDN aims to secure the network as a whole. But one disadvantage of using these techniques is that once one node is comprised the whole network fails.
2.3 Machine Learning Machine Learning is divided into two techniques; 1. Supervised Learning, 2. Unsupervised Learning. Meidan Y. et al (2017) implemented machine learning techniques to identifying unauthorized devices on the network, their approach emphasized on automatic whitelisting of devices on the Network. They claim that by whitelisting devices their model is able predict devices according to their names. For their experiment, Meidan Y. et al (2017) opted to use Random Forest for model training and tuned their parameters according to F-Measure.
Figure 6 Parameter Tuning. Meidan et al (2017)
Table 7 Iot devices used in the experiment and performance on the Validation Test, Meidan Y. et al (2017). The table above displays the devices that were used in the experiment and the performance on the validation Set. From the results, an accuracy of 94% was obtained on the accuracy of detecting devices as unknown from a single session, 97% were correctly whitelisted according to their specific type, Meidan Y. et al (2017).

17
Table 8 Performance on the Test Set based on 20 sessions. Meidan Y. et al (2017).
Table 9 Features for detecting unauthorized devices, Meidan Y. et al (2017). The experiment carried out demonstrate levels of reproducibility, don't produce any bias and were conducted multiple times. The findings indicate this method can be adopted to building other models such as DDOS Attacks and Intrusion Detection. The assumption made is that devices that are unauthorized cannot be allowed to connect to the network, hence restricting them from accessing network data. The researchers mention concerns of Hackers mimicking behavior of the devices that are connected on the network. Haffez I. et al (2016) proposes semi-supervised learning model for identifying malicious traffic flows in an Iot network. The aim is to be able to tell the difference between malicious and benign activity of devices. For their experiment, the researchers extracted 39 features from the network log and used Fuzzy C-Mean algorithm to identify benign traffic and malicious traffic generated by the devices on the network.
Table 10 Scenarios Tested Against, Haffez I. et al (2016).
Table 11 Performance of Prediction Model on the Scenarios, Haffez I. et al (2016). Table 11 displays different measures for different attacks during the experiment. Looking at the results from the experiment, conclusions can be made that the authors were able to predict the various type of traffic on the Iot network. The researchers state how they prepared the dataset which allows for reproducibility. The authors failed to mention that the experiments were conducted multiple times under different network communication protocols (WLAN, Bluetooth) which should be put into consideration to further improve their work. Haffez et al (2016) mentions that they have compared their method against other techniques in a qualitative manner which makes it difficult to critically analyze their technique. Looking at this method, it can be observed that two different Machine Learning techniques were used to secure the Iot network. Both methodologies have clear objectives and were properly documented so that other researchers may be able to repeat the experiment thus analyze and improve the findings, this can help in building a better detection technique. Conclusively, the Machine Learning techniques proposed by the researchers could be applied to solving various network attacks by detecting malicious nodes on the network.
2.4 Block Chain Block Chain technology offers a decentralized approach, therefore creating room for scalability at a large volume subsequently increasing the performance and security of the network. Qu C. et al (2018) proposes a Block Chain framework to be used for device credibility verification. The idea behind this is to allow the device monitoring the network to verify that the data received is from a gadget that belongs to the network. The framework consists of Block-Chain Structures at different

18
layers and levels of the network. The figure below shows an overview of the Framework.
Figure 7 Overview of proposed framework, Qu C. et al (2018). The researchers conducted an experiment to investigate the Storage Capacity Iot nodes and efficiency of their credibility when it comes to computing power, this would help in deciding whether nodes in Iot devices can use this kind of technology considering Block Chain uses high computing power.
Figure 8 Iot node Storage Capacity using Block Chain, Qu C. et al, (2018). The researchers concluded indeed Block chain can be used in securing the Iot network, but mention that Iot devices provide only 51% of computing power which is a low number considering the amount of computing they have to accomplish when implementing Block Chain. The hypothesis and ideologies discussed by the author are of good science and they give closure to the conclusions they reached. However, they fail to disclose the steps and resources they used to carry the experiment, which puts into question the results they obtained. This makes it difficult for future researchers to validate their claims.
It would have been better if they had run experiments on different network attacks, especially on node capture and verification test to check whether registered on the network certainly belong to the network. The proposed method can be useful for authenticating and building strong connections between the devices and resource center.
3 Comparison of Methods Following the critical evaluation of each method, the most promising method is the use of Machine Learning in detecting potential network security threats and monitoring device activity in the network. The SDN method using Machine Learning by Tang A.T et al, (2016) obtained a value of 75.75% for detecting Network Intrusion, whereas a 97% accuracy was obtained when detecting devices on the network by Meidan et al (2017). Haffez et al (2016) used Machine Learning to identify between benign and malicious on the network, and on the experiment various scenarios were accurately predicted at an average of 98%. These experiments carried more rigor and the hypothesis presented were of good science. Block Chain by Qu C. et al (2018) still requires more work because of the limited memory storage of Iot gadgets, hence implementing all its services is rather difficult. Software Defined Networking methods and Secure Key Distribution techniques imitate a master-slave scenario whereby the gadgets depend on the resource center for security. Which may not reliable or ideal considering if the resource center fails, the whole network is compromised.
4 Conclusions In this research paper, different methods for securing the Iot network have been critically evaluated. From the discussed methods, the use of machine learning in detection of network threats and monitoring the network stands above the other methods as a result of its various implementations. Methods which focus on node key authentication are limited when considering the scalability of one’s network and as shown from the experiments nodes are prone to easy capture which leaves the network vulnerable. Many of the experiments carried out did not put into perspective the various transfer protocols/channels used by Iot gadgets. A lot of focus was on WLAN, disregarding Bluetooth and Mobile Data (4g, 5g), only Qin Z. et al (2014) provided testing for the various network protocols. Machine learning methods by Tuan T et al (2016), Meidan Y. et al (2017), Haffez A. et al (2016) ensured that their results they presented were accurate by running their

19
experiments multiple times. One other concern of using SDN and SKD is the overload on the resource center by the devices. A number of vulnerabilities on the proposed network architectures and methods on protecting the nodes were discovered. These included imitation of registered device behavior on the network by hackers to pose as device that belongs to the network. Controlling when devices can execute updates can play a huge role in managing external traffic coming into the network. In any case, the presented methods can be combined together to develop one security solution which covers all the theories presented eventually having one Iot networking architecture or standard.
References Addya K. S., Majhi B., Moharana R. S., Satpathy A., Turuk K.A & Vijay J. K., 2017. ‘Secure Key-distribution in IoT Cloud Networks’. 10.1109/SSPS.2017.8071591. Ahmed E. M. & Kim H., 2017, ‘DDos Attack Mitigation in Internet of Things Using Software Defined Networking’.2017 IEEE Third International Conference on Big Data Computing Service and Applications (BigDataService), San Francisco, CA, 2017, pp-271-276. doi: 10.1109/BigDataService.2017.41. Antikainen M., Ding Y. A., Hafeez I. & Tarkoma S. 2018, ‘Real-Time IoT Device Activity Detection in Edge Networks’. 12th International Conference on Network and System Security: NSS. DOI: 10.1007/978-3-030-02744-5_17. Bellavista P., Denker G., Giannelli C., Venkatasubramanian N. & Qin Z., 2014, ‘A Software Defined Architecture for The Internet-of-Things’. IEEE/IFIP NOMS 2014 - IEEE/IFIP Network Operations and Management Symposium: Management in a Software Defined World. 1-9. 10.1109/NOMS.2014.6838365.
Bohadana M., Elovici Y., Guarnizo D. J., Meidan Y., Ochoa M., Shabtai A. & Tippenhauer O. N., 2017. ‘Detection of Unauthorized IoT Devices Using Machine Learning Techniques’. CoRR, abs/1709.04647. Du Q., Ren P., Song H. & Xu Q., 2016, ‘Security Enhancement for IoT Communications Exposed to Eavesdroppers with Uncertain Locations,’ in IEEE Access, vol. 4, pp. 2840-2853, 2016. doi: 10.1109/ACCESS.2016.2575863 Elleithy Khaled. & Eltaeib T. & Hassan Abdalraouf. 2014. ‘Developing Network Security Protocol using Key Pre-Distribution for Wireless Sensor Network’. 27th International Conference on Computer Applications in Industry and Engineering, CAINE 2014. Ghogho M., McLernon D., Mhamdi L., Tang A.T. & Zaidi A.R.S., 2016. ‘Deep Learning Approach for Network Intrusion Detection in Software Defined Networking’. 10.1109/WINCOM.2016.7777224. Hajjar E.A, 2016. ‘Securing the Internet of Things Devices Using Pre-Distributed Keys’. 2016 IEEE International Conference on Cloud Engineering Workshop (IC2EW), Berlin, 2016, pp. 198-200. doi: 10.1109/IC2EW.2016.22 Hong X., Tao M., Qu C. J., Zhang J., 2018, ‘Blockchain Based Credibility Verification Method for IoT Entities’. Security and Communications Networks. 2018. 1-11. 10.1155/2018/7817614. James M., Patel J.A & Zunnurhain K. 2018, ‘Investigation of Vulnerabilities with Monitoring Tools’. International Conference Security and Management 2018. Keoh L.S., Kumar S. S. & Tschofenig H. (2014). “Securing the Internet of Things: A Standardization Perspective”. Internet of Things Journal, IEEE. 1. 265-275. 10.1109/JIOT.2014.2323395.

20
21
Evaluating the currently proposed techniques to secure Software Defined Networks from Denial of Service (DDoS/DoS) attacks
Mohammad Fakhar Iqbal
Abstract
Denial of service attacks have been a plague faced by interconnected networks for more than over two decades, and this problem is now also being faced by SDNs. Initial research of Software Defined Networking primarily focused on its fundamentals, such as reconfiguration, forwarding, management challenges etc. However in recent times researchers have identified the threat that DDoS/DoS attacks have on SDNs and so have gravitated their efforts to tackling this security issue. This research paper provides an in-depth analysis of some of these current research conducted for mitigating DDoS/DoS attacks in SDN environments, detailing their strengths, weaknesses and applicability. Then presenting conclusions regarding their effectiveness and in what direction further research in this field could be taken into.
1 Introduction Software defined Networking (SDN) has revolutionised the networking landscape since its inception. In an SDN architecture, the management plane and the control plane which were once the same are logically separated. Making it extremely flexible as the data plane only needs to forward data under the guidance of the control plane which is not centralised and above the data plane. This has caused many studies to be conducted in its many applications in backbone networks, wireless networks etc. (Jain et al. 2013, Wang et al. 2016) However this emergence in the popularity of SDN has also caused it to face a number of security issues which as stated by Kreutz et al. (2013) include fake traffic flow, control plane attacks, attack on commination etc. However one of the rising threats against SDN is DDoS/DoS, which due to the nature of SDN (separation of control plane and data plane etc.) can be used to directly attack the control layer, the infrastructure or even the application layer (Yan and Yu 2015). To counter this security issue a number of counter mechanisms have already been proposed including but not limited to attack
detection (Xiao et al. 2015), attack trackback (Francois and Festor, 2014) and attack mitigation (Giotis et al. 2014, Miao et al. 2014) in regards to SDN, all with varying degree of success. The aim of this research paper is to critically evaluate and analyse the current research that has been done in order to detect and mitigate DDoS/DoS attacks. Analysing them thoroughly in order to gauge their effectiveness, and conclude with some recommendations on how they can be improved.
2 Evaluating Current Denial of Service attack protection techniques for SDN Wang et.al. (2015) proposes an architecture that can be deployed in SDN environments to detect and mitigate DDoS attacks. It is a graphical inference based model named DaMask, it consists of two modules DaMask-D the attack detection system (which used the Chow-Li algorithm) and the DaMask-M the attack reaction module (which takes specific actions). Figure 1 shows the workflow of DaMask

22
Figure. 1 - Workflow of DaMask (Wang et.al. 2015)
In their evaluation Wang et.al. (2015) set up a hybrid cloud, delegating the public side of the cloud by using amazon web service EC2 and simulating the private cloud in housing using Mininet. The researcher adopted the UNB ISCX dataset for their tests which evaluated the overhead, adaptive topology change etc. of their proposed method. Figure 2 shows the topology that they used.
Figure. 2 - The simulated hybrid cloud topology (Wang et.al. 2015)
The researcher compared their method to Xu and Shelton (2010) which uses CTBN. Using the ROC curve (Figure 3) as evidence they stated that “the performance of our method is similar to theirs. However, our model excels in terms of smaller computational cost” (Wang et.al. 2015)
Figure. 3 - ROC curves for Mbasic (GM), Mglobal (update both CPDs and structure) and Mlocal (update CPDs only) and CTBN (Wang et.al. 2015) Afterwards they compared DaMask with Snort and Snort AD. Stating that their proposed method was more effective in detecting anomalies as “Snort reported 6.73% of the attack packets” (Wang et.al. 2015) and “Snort.AD generated 23 more alerts that Snort but only two of them were real attacks” (Wang et.al. 2015) Based on the output data of their experiments the researcher concluded that the solution that they had proposed was more effective than the ones currently available and required less changes to be made to the existing cloud computing service architecture used by cloud providers. In the research done by Wang et.al. (2015) the tests that the researchers conducted were all direct implementation of their proposed method using a combination of real life equipment (amazon web service) and virtual equipment (Mininet). Combined with the researcher’s use of the UNB ISCX dataset, makes these tests highly repeatable, unbiased and accurate. However the researcher did not express any limitations of their tests, such as data transmission errors between their virtual lab and the amazon webservers or of their method such as its overall scalability and its real world application. Chen and Yu (2016) proposed CIPA (Collaborative Intrusion Prevention Architecture), CIPA is an ANN-based CID. It functions by using artificial neural networks deployed as a virtual network over the network to be protected from attacks such as DDoS and worm spreading. Figure 4 shows the workflow of CIPA.

23
Figure. 4 – Workflow of CIPA. (Chen and Yu 2016)
The researcher evaluation included using the simulation tool OMNeT++4.3 to simulate a variety of virtual network and utilizing BRITE with the Waxman algorithm to generate the random topologies. Creating a total of 50 topologies entailing 5 different sized topologies each being 50, 100, 200, 500 and 1000 nodes large with 10 sets for each of them and lastly running their tests multiple times. Then they compared their test results with Gamer (2012), which was the latest CIDS to counter large scale distributed coordinated attacks at that time. For the datasets in their experiments they used the, Shannon and Moore (2004) and the CAIDA datasets. Figure 5 shows the test result of the 50 nodes network test.
Figure. 5 - Detection results of CIPA against DDoS under 50 node simulated networks (Chen and Yu 2016) With the test results show above the researcher stated that in smaller networks (50 nodes and below) CIPA was inferior to Gamer (2012) however as the size of the network increased CIPA become more effective. Lastly stating how CIPA had more overall communication overhead (Figure. 6) but arguing that these amount of overheads “are much lower than the normal traffic generating rate of each node and volume of the aggregated attack” (Chen and Yu 2016)
Figure. 6 - Comparison of communication overhead of two CIDS when DDoS occurs (Chen. X, Yu. S 2016) The researcher concluded that their proposed method CAIPA was better than the existing method proposed by Gamer (2012) in regards to detecting DDoS flooding and other attacks. Then going on to detail future work that included deploying CIPA in large real world networks and detecting as many types of intrusions as possible. In the research done by Chen and Yu (2016). The research provided detailed information regarding how they tested their proposed method, also detailing how they compared their method and what

24
exact data sets that they used, all of which makes this research highly repeatable, accurate and unbiased (assuming that the data analysis was done without biases). Furthermore the researcher’s remark that their method was more effective than Gamer (2012) is valid, however it must be kept in mind that CIPA possess higher overhead and is less effective in smaller node environments. Therefore this must be taken into consideration when real world implementations and further evaluations are considered. Sahay et.al (2017) proposed ArOMA which is an autonomous DDoS defence framework that uses the programmability and centralized feature of SDN to provide automation in regards to DDoS attacks in the ISP network and in turn the customers network. Which was one of the main arguing points made by Sahay et.al (2017) as they argued that attacks targeting a customer of an ISP also effect the ISP itself as the attack traffic is going through the ISP as well. Figure 7 show the framework that the researcher proposed
Figure.7 – SDN – enabled DDoS mitigation framework (Sahay, R et.al 2017)
For evaluation, the researcher implemented the framework in a use case and tested it using both a Mininet-based simulation and a testbed-based experiment.
In the Mininet based simulation they used the topology shown in figure 8. Using the traffic generator iPerF to generate the test traffic to evaluate the end-to-end effectiveness and network jitter when the network was protected while under attack. Figure 9 shows some of the test results
Figure. 8 – Network topology used for the simulations
Figure 9 - Response of ArOMA and throughput of legitimate (Sahay et.al 2017) For the testbed based experiment the researcher used a hardware platform, and video traffic generated by using TAPAS, a video streaming tool to generate the traffic for the tests. On the other hand used the QoE metrics analysed in other researches such as Dobrian et al (2011), Krishnan and Sitaraman (2013) for their evaluation metrics/criteria. Figure 10, shows some of the results of this test.
Figure – 10 Time to rebuffer (Sahay et.al 2017) The researcher concluded that they had provided an effective framework usable in maintaining performance in a network during a DDoS flooding attacks. Using the results of their test data to back this statement, then ending with some future work

25
that entailed studying their method in scenarios involving multiple customers among other things. The tests conducted by Sahay et.al (2017) involved both virtual simulation and on real equipment tests, in which they provided detailed configuration and settings they used during each of them. All of this coupled with the use of detailed testing data and specialized packet generators (TAPAS and iPerF) make these experiments highly repeatable, relatively reliable and unbiased. However the researcher did not ascertain the limitations of their tests results such as network size, node quantity or the overhead of their method. Neither did they state the real world limitations of their method, they only focused in providing evidence on how effective their method was and not of its shortcomings. However they did acknowledge the problem of multiple customers which they stated would be tackled in future research. Deng et.al (2019) proposed a method called DosDefender which can be used to detect SDN-aimed DoS attacks and protect the infrastructure resources in an SDN network (controller, secure channel OFA etc.). Figure 11 shows the architecture
Figure. 11 - The architecture of DosDefender (Deng et.al 2019) To evaluate their method they implemented it into a physical environment which comprised of a floodlight controller, a Pica8 P-3297 OpenFlow switch and some hosts as show in figure 12. They also used packetETH to simulate a DoS attack by creating and sending random packets to the hardware being tested.
Figure. 12 - Deng et.al (2019) DoS attack experiment setup. In order to gauge the OFA protection, secure channel and SDN controller protection and overall overhead of their proposed method they measured the CPU usage, the memory usage and the bandwidth of the secure channel under DoS attack and idle situations. The test results of these are given below, in figure 13, 14 and 15.

26
Figure. 13 - Protection of the OFA. (Deng et.al 2019)
Figure. 14 - Protection on the secure channel (Deng et.al 2019)
Figure. 15 - DosDefender's CPU and Memory Usage under normal operation (Deng et.al 2019) In their conclusion the researcher went over the contents of their research paper detailing some of their findings in regards to DoS attacks in SDN. Going over how they tested their method and using the test results of the evaluations to states that their proposed method DosDefender was effective in mitigating DoS attacks. In regards to evaluating the research done by Deng et.al (2019). Firstly their evaluation criteria and tools that they used, are easy to replicate and understand. Which when combined with the use of packetETH makes this a repeatable, reliable, and error free experiment. However the researcher assumed that SDN DoS attacks target SDN controller only which is not always true. Because while layer 2/3 attacks do target SDN controllers, a layer 7 based DoS attack such as one done “by manipulating OSI layer 7 protocols such as HTTP, domain name service etc.” (Thongam et.al, 2018) might also occur on a webserver residing in an SDN. This aspect was not included/considered in the research done by Deng et.al (2019), furthermore they also did not consider their method for DDoS attacks.
27
3 Comparing current DDoS/DoS protection techniques for SDN
The technique proposed by Wang et.al (2015), is highly customizable and flexible as it uses modules that can be moved/run on any node in the network as the need arises. But as these modules are not intelligent based, special care must be taken during initial implementation, furthermore this method was not tested on larger node environments so its implementation on those types of network is uncertain. While the research proposed by Chen and Yu (2016), due to the fact that it uses artificial neural networks superimposed on the existing network via virtualization also exhibits the flexibility found in Wang et.al (2015)’s method. However the limitations of this method are that for one, its mitigation strategy only encompasses two outcomes (forward or deny) which limits QoS features as a result. Secondly tests show that it is not superior to its nearest counterpart Gamer (2012) in terms of small network implementations. On the other hand the framework proposed by Sahay et.al (2017) leverages the programmability and centralized nature of SDN to make their method function. Making it more suitable for larger network implementations such as ISPs, but this also causes it to need more active support from administrators during attacks. While Sahay et.al (2017)’s main arguing point of combining DDoS mitigation responsibilities between ISPs and their customers might not resonate with some organisations. But compared to the three above methods the research proposed by Deng et.al (2019) focuses on protecting the SDN controller in the network rather than the whole network, by assuming that DoS attack in SDN always target the SDN controller. Which in turn make their method of terminating attack packets at ingress ports simple, easy to manage and implement. However this method is not scalable, becoming more complex and tedious to manage as the number of SDN controllers in the network increase. Furthermore its effectiveness against DDoS is uncertain as that was not tested. All of the results of each of the methods analysed above show that they have different limitations proposed on them, such as real world application, network size, use case etc.
4 Conclusions From reading the work done above one point that can be concluded is that although the methods evaluated are effective in countering and mitigating
DDoS attacks, they are not without their specific pros and cons. Hence more research must be done in order to decrease their cons; which is a commonplace statement, as more research will always be needed. However instead of researching new methods, we propose combining methods (all DDoS/DoS mitigation methods). For example by combining the method proposed by Kirti et.al (2018) into the method proposed by Chen and Yu (2016) will add more QoS features and response metrics to it that it is currently lacking. While combining the method proposed by Vidal et.al (2018) into Wang, et.al (2015) can aid it in its overall scalability. On the other hand combining the methods proposed by Deng et.al (2019) and Sahay et.al (2017) can solve both of their cons, Sahay et.al (2019)’s con of customer disapproval/distrust and Deng et.al (2015)’s con of being vulnerable to layer 7 attacks. Thus this is an unexplored avenue as almost all of the research that we have evaluated references already established research for comparison purposes but do not add, incorporate, combine or build upon them. Therefore exploring the idea of combining methods may lead to an uncompromised permanent solution to the problem of DDoS/DoS in every network type.
References Chen, X. Yu, S (2016) "CIPA: A collaborative intrusion prevention architecture for programmable network and SDN", Computers & Security, Volume 58, May 2016, Pages 1-19 Deng. S, Xing. G, Lu. Z, Li. Z, Gao. X (2019) “DoS vulnerabilities and mitigation strategies in software-defined networks”, Journal of Networks and Computer Applications, Volume 125, 1 January 2019, Pages 209-219. Dobrian. F, Sekar. V, Awan. V, Stoica. I, Joseph. D, Ganjam. A, Zhan. J, Zhang. H (2011) “Understanding the impact of video quality on user engagement”, SIGCOMM '11 Proceedings of the ACM SIGCOMM 2011 conference, Canada, August 15-19 2011. Francois. J, Festor. O (2014) “Anomaly traceback using software defined networking”, IEEE International Workshop on Information Forensics and Security (WIFS), December 2014, pages 203-208 Gamer. T (2012) “Collaborative anomaly-based detection of large-scale internet attacks”, Computer
28
Networks, Volume 56, Issue 1, 12 January 2012, Pages 169-185 Giotis. K, Argyropoulos. C, Androulidakis. G, Kalogeras. D, Maglaris. V (2014) “Combining OpenFlow and sFlow for an effective and scalable anomaly detection and mitigation mechanism on SDN environments”, Computer Networks, Volume 62, April 2014, Pages 122-136 Jain. S, Kumar. A, Mandal. S, Ong. J, Poutievski. L, Singh. A., Venkata. S, Wanderer. J, Zhou. J., Zhu. M, Zolla. M, Holzle. U, Stuart. S, Vahda. A (2013) “B4: experience with a globally-deployed software defined wan” Proceedings of SIGCOMM, Hong Kong, China, ACM, pp. 3-14. Kirti, Agrawal. N, Kumar. S, Sah. D.K (2018) “Prevention of DDoS attack through harmonic homogeneity difference mechanism on traffic flow”, 2018 4th International Conference on Recent Advances in Information Technology (RAIT) Recent Advances in Information Technology (RAIT), 2018 4th International Conference on. :1-6 Mar, 2018 Krishnan. S.S, Sitaraman. R.R (2013) “Video stream quality impacts viewer behaviour: inferring causality using quasi-experimental designs”, IEEE/ACM Transactions on Networking (TON), Volume 21 Issue 6, December 2013, Pages 2001-2014. Kreutz. D, Ramos. F.M.V, Verissimo. P (2013) “Towards secure and dependable software-defined networks” Proceedings of the second ACM SIGCOMM workshop on Hot topics in software defined networking, Hong Kong, China, August 2013, pages 55-60. Miao. R, Yu. M, Jain. N (2014) “Nimbus: cloud-scale attack detection and mitigation”, Proceedings of the 2014 ACM conference on SIGCOMM, Chicago, Illinois, USA, ACM, August 2014, pages 121-12 Sahay. R, Blanc. G, Zhang. Z, Debar. H (2017) "ArOMA: An SDN based autonomic DDoS
mitigation framework", Computers & Security, Volume 70, September 2017, Pages 482-499 Shannon. C, Moore. D (2004) “The spread of the Witty worm”, IEEE Security & Privacy, Volume 2, Issue 4, Pages 46-50 Thongam. K, De. T, Sing. K.J (2018) “Detection and differentiation of application layer DDoS attack from flash events using fuzzy-GA computation”, IET Information Security, Volume 12, Issue 6, Pages 502-512. Vidal. J, Orozco. A, Villalba. L (2018) “Adaptive artificial immune networks for mitigating DoS flooding attacks”, Swarm and Evolutionary Computation, Volume 38, February 2018, Pages 94-108 Wang. B, Zheng. Y, Lou. W, Hou. Y.T (2015) "DDoS attack protection in the era of cloud computing and Software-Defined Networking", Computer Networks, Volume 81, April 2015, pages 308-319. Wang. Y, Chen. H, Wu. X, Shu. L (2016) “An energy-efficient sdn based sleep scheduling algorithm for wsns”, Journal of Network and Computer Applications, Volume 59, January 2016, pages 39-45. Xiao. P, Qu. W, Qi. H, Li. Z (2015) “Detecting DDoS attacks against data center with correlation analysis”, Computer Communications, Volume 77, August 2015, pages 66-74 Xu. J and Shelton. C.R (2010) “Intrusion Detection using Continuous Time Bayesian Networks”, Journal of Artificial Intelligence Research, Volume 39, December 2010, pages 745-774. Yan. Q and Yu. F (2015) “Distributed denial of service attacks in software-defined networking with cloud computing”, IEEE Communications Magazine, Volume 53, Issue 4, April 2015, pages 52-59

29
Evaluation of Current Load Balancing Techniques in a Software Defined Network Aimed at Improving Quality of Service
Mohammad Falaq Iqbal
Abstract
Quality of Service is at the centerpiece with the growth of modern networks and the services they provide, existing literature review has underlined that an adequate solution to QoS in multiple cases does not exist or is not viable. In this paper, the methodology of three different QoS mechanisms utilizing a Software Defined Network with load balancing where evaluated and analyzed, these included: Multi-Link load balancing, Control Plane Management Load balancing and a Hybrid solution. The purpose was to investigate the advantages and disadvantages of each approach. Recommendations where made throughout this paper regarding future research, comparison of these techniques and their real life application.
1 Introduction With the growth of the internet, new types of networking application and services have emerged which generate their own unique type of data flows requiring delivery over the internet or large scale networks. However, these applications necessitate differential treatments of their own flows for delivery to be successful over a network (Yujie L et al.,2015). To fulfill the dynamic requirement nature of services a well-defined Quality of Service (QoS) mechanism is needed. Yet, “today's de facto delivery model, best-effort, in the Internet is not capable of serving to all of the aforementioned services. In addition, proposed QoS solutions have not been successful enough to solve the QoS issues of the traditional networking paradigms” Murat K and Arjan D, (2016). This is further emphasized by Umme Z and Hanene B Y (2017) “the underlying infrastructure of the internet, often experience imbalanced traffic load as few links endure congestions while most links are underutilized.” Mohammad M T et.al. (2017) conducted research on developing a QoS-aware resource reallocation algorithm to increase network throughput and table compression to improve traffic flow management without drastic changes to the forwarding tables. Haibo W et.al (2018), Olena T and Abdulghafoor R Y (2016) and Pengzhan W et.al (2017) provide research into higher link utilization using load balancing techniques to achieve dynamic traffic flow management for individual application flows allowing improved QoS across a software defined network.
This research paper will focus on critical evaluation and analysis of a number of solutions utilizing various techniques (Notably SDN) in order to improve Quality of Service (QoS). This paper will discuss the proposed methods, their evaluation results and their potential outcomes, while reaching conclusions throughout the paper on identified all methods effectiveness against each other in regards of solving the QoS problem. The paper primarily focuses on QoS solutions based on the Software Defined Networking model by looking at possible solutions using Load Balancing, their shortcomings and probable implementation scenarios.
2 Evaluation of Current Quality of Service Methods in a SDN
This section of the paper will focus on Load Balancing techniques to achieve QoS in a Software Defined Networking environment.
2.1 Multi-Link Utilization Hong Z et.al, (2017) proposed a load balancing scheme based on server response time rather than traditional metrics such as load or bandwidth utilization. This method called LBBSRT is capable of obtaining real-time response times of servers to choose the server with the most minimal or stable response time. The authors emphasized that “the server response time directly reflects the server load capability, selecting server based on the response times helps to send user requests to the servers operating under minimum server load to extract maximum performance.” Hong Z et.al (2017). They tested this method by employing a OpenFlow environment using a floodlight controller in a single controller SDN topology with 30 clients and 3 server utilizing HTTP requests and responses as a source

30
of traffic. The testing compared server response times across a period of time with a number of cases which simulated real-world scenarios. In addition, the proposed method was tested against a solution presented by Hailong Z and Xiao G (2014). Their result showed that the average server’s response time of the three schemes, Round Robin, Random and LBBSRT where 1.236 s, 1.366 s and 1.119 s respectively. The authors highlighted that LBBSRT achieved more stable performance due to their metric of choice and consistence CPU & Memory utilization across all servers. The authors concluded that their method is better than both traditional load balancing and the method proposed by Hailong Z and Xiao G (2014). The research by Hong Z et.al (2017) was both conducted and structured well, as it fairly displayed the differences between all tested methods eliminating bias and inconsistences in results. Their experiments itself utilized open source software which increases repeatability and testability of the research. The analysis of the results showed that the proposed scheme achieved low average server response time and load balancing with the solution being simple and low cost. However, this method uses only one controller, therefore suffering from low availability, stability and a potential system bottleneck. Furthermore, the study did not equate the performance gains in bandwidth utilization and network delay to server response times, thus requiring more investigating to prove this methods viability in a real-world application.
Figure 1 Basic architecture of SMCLBRT (Jie C et.al, 2018) Jie C et.al, (2018) on the other handle built upon the method proposed by Hong Z et.al, (2017) and proposed an alternative multi-controller solution to QoS by utilizing server response times to achieving load balancing via switch migration named SMCLBRT. This method used three modules to
monitor, detect and migrate traffic in order to identify congestion in the network to switch a network flow from one controller to another promptly as shown by the architecture in Fig 1. They gauged the performance of this new method in a Mininet virtual environment under the topology by Simon K et.al, (2011) using 20 nodes which were then divided into five switches and five controllers. They conducted tests on two schemes by Chuan W et.al, (2017), Yaning Z et.al, (2017) and the switch-controller mapping model while comparing the average load across all five controllers.
Figure 2 Balance rate of different schemes (Jie C et.al, 2018) The results shown by Fig 2 exhibited a clear performance benefit of SMCLBRT as it outperformed all other tested schemes. However, the authors concluded “Our current simulation does not apply to most of load distribution patterns” and added that adaptable simulations with migration processing on network quality tests as future works. The claims made by the researches are well justified as their evaluation was performed without any bias and a number of testing schemes where used to validate their findings. The authors also list multiple problems found in their testing methodology and deign as improvements for future works. Hence, leading to the conclusion that this research is incomplete, while it does show the benefits of the proposed solution. Therefore, keeping in light the research done by both Hong Z et.al (2017) and Jie C et.al (2018) a conclusion can be drawn is that “Server Response Time” is a valid metric to be used by any load balancing mechanism. But future research is required to develop a method which utilizes this metric to its fullest in a Multi-Link Load Balancing solution or product.
2.2 Control Plane Management Yi-Wei M.et.al, (2016) proposed a load balancing mechanism by implementing a hierarchical control plane with a local and a meta control plane in a multi-controller SDN environment. The meta-control plane is used to gather resource and

31
utilization statistics of the local control plane to improve processing performance. This optimizes the data plane performance and remove bottlenecking, thus the researchers determined that this method would achieve a global utilization of a given SDN controller in the range of 30% to 60%. The experiment was carried out in an Mininet environment utilizing a tree and leaves topology. Whereas, the algorithms performance was evaluated in terms of utilization over a period of time and the maximum throughput achieved. The testing included two cases assessing the algorithms effectiveness in both active and standby local plane controllers.
Figure 3 System loading analysis (Yi-Wei M.et.al, 2016)
Figure 4 Throughput analysis (Yi-Wei M.et.al, 2016) The results in Fig.3 shows that after 35.5 seconds the load balancing threshold was reached which caused the algorithm to load balance traffic across all controllers. The total utilization after convergence remained between 25% to 50%. Whereas, Fig 4 shows that after complete convergence the total throughput remained equal load balanced across all controllers. Thus, achieving the goals set by the author. The methodology used is well justified and the evaluation was fairly done as all methods where run under the same conditions and given adequate time to converge before conclusions where reached. The topology however did not follow standard DNC
implementations by Daegyu L. et.al, (2002) this may impact the repeatability of this study as the topology path selection process can vary to an extent. Result analysis indicated that the proposed method did reduce the loading for the control plane and improved bandwidth utilization in comparison to a single controller implementation without the meta control-based manager. However, as concluded by the author “provides a greater system throughput than normal multiple controllers and a single controller.” Yi-We M.et.al, (2016) is incorrect as only a single controller method was tested resulting in a more in-depth comparative analyzing being required to prove this claim. Therefore, real life application of this method is limited as it requires multiple controllers for management of the control plane, thus suffering from high complexity and much higher energy consumption. Chunzhi W .et.al (2016), on the other hand investigated a solution modeled on the Ant Colony Optimization (LLBACO) algorithm which was capable of achieving higher utilization on a single SDN controller leading to the conclusion that a hybrid multi-controller solution running an optimized link load balancing algorithm on every controller can be achieved, this can further the research done by Yi-We M.et.al, (2016) and Chunzhi W .et.al, (2016) to improve real-life application of both solutions.
2.3 An Hybrid Approach Haibo W .et.al (2018) proposed an alternative load balancing algorithm named RDMAR which preforms both controller load balancing and link load balancing in a statically switch-controller configured with multiple SDN controllers. RDMAR achieves this by implementing bounds dedicated to routing decisions and managing flows, local link load balancing is conducted within these bounds which results in decreased link utilization and server response times. The evaluation consisted of a Mininet environment using a Fat Tree topology by Daegyu L et.al, (2002) and the VL2 topology by Albert G et.al, (2011) consisting of 180 switches with a total number of 432 hosts. The network itself was divided into four areas with dedicated controllers. All test events followed the “Eighty-Twenty” rule for all network flows. The results where then compared with four other load balancing schemes by Marco et.al, (2017), Albert et.al, (2011), Amin T et.al, (2015) and OSPF evaluating response times and the link load utilization over a given time slot.

32
Figure 5 Testing results on the fat-tree topology (Haibo W .et.al, 2018) The results shown by Fig 5 highlighted a performance improvement in link load of 37% and 17% over both OSPF and ECMP respectively. RDMAR also showed a performance benefit of 3% over Marco et.al, (2017) and Albert et.al, (2011) while outperforming both solution in response times. This lead to the authors reaching the conclusions that “our proposed algorithm can largely reduce controller response time compared with existing solutions, while achieve similar performance of link load balancing.” The research carried out by Haibo W .et.al, (2018) was rigorous as multiple method where tested against the proposed solution under two different topologies Fat Tree by Daegyu L et.al, (2002) and VL2 by Albert G et.al, (2011). The testing was done on multiple documented events encompassing a range of real-world traffic flows and patterns. This leads to the study being repeatable, lacking bias and errors in findings. The evaluation results showed a performance increase in all tested methods in terms of both response times and link utilization achieving a stable load balancing across the network justifying the authors conclusion. The choice of Mininet for environment virtualization and benchmarking is applauded as the system provided a stable accurate platform as investigated by Philippos I .et.al, (2016). However, some important aspects of the implementation were not explored such as energy consumption, the hardware performance impact and systems stability. With this being said the real-world application of this method is viable as explored by Muhammad I.etl.al, (2018) in a DDoS prevention mechanism.
3 Comparison of Load Balancing Techniques to Achieve QoS
The research evaluated throughput this paper all had the single aim to improve load balancing via a Software Defined Network environment to achieve Quality of Service. The methods evaluated showed advantages in certain cases and limitations in others stated throughout this paper, whereas the results allowed for comparison to be made for recommendation for the most appropriate methods. Multi-link load balancing utilizing a dedicated metric to detect and mitigate congestion has an
advantage of a simpler deployment, lower overall cost, higher extensibility and potentially lower energy consumption. As the research by Hong Z at.al, (2017) and Jie C et.al, (2018) showed that by utilizing “Server Response Time” as a metric yielded real-time congestion detection with lower CPU & Memory usage both in a single and multiple SDN controller configuration. Therefore, this method can be integrated with other methods to providing per-link load balancing resulting in a much more flexible solution. Control Plane load balancing proposed by Yi-Wei M.et.al, (2016) showed considerable improvement to performance in terms of both per link utilization and bandwidth usage in a multi-controller environment. The method provided better traffic flow management if compared to a per-link or a multi-link solution, at the cost of energy consumption, equipment costs and complexity both in network design and deployment. Thus, research into methods extending from the data plane and control plane optimization can improve the real life application of this method as proposed by Chunzhi W .et.al, (2016). Haibo W .et.al, (2018) on the other hand showed a hybrid approach taking ques from both “Multi-Link” and “Control Plane” load balancing techniques to achieve independent traffic flow management at both the controller and link level. Haibo W .et.al, (2018) compared their method with a number of other popular techniques and delivered better performance in terms of both server response time and link utilization. However, this method showed limitations with regards of equipment compatibility, cost, energy consumption and stability. The results underlined that all tested methods had limitations in one or multiples areas which included real-world application, use cases, complexity, stability and energy consumption. Thus, requiring further research to be conducted to achieved a fully intuitive solution for the QoS problem.
4 Conclusions In this paper, the problems of achieving Quality of Service in modern networks is underlined with Software Defined Networking combined with an effective load balancing method, proposed as a solution. A literature review has shown various techniques have been presented by researchers in an attempt to improve/better the QoS problem faced by a number of implementations. A comparison of the research exhibited that the methods put forth by Hong Z at.al, (2017) and Jie C et.al, (2018) provided evidence that a “Multi-Link”

33
solution to QoS via Load Balancing is a viable method, but due to its current limitations should only be employed by a small to mid-sized SDN environment. As a larger deployment may prove to be higher demand on both customer edge and internal routing equipment. Whereas, the technique by Yi-Wei M.et.al, (2016) mitigate some of the problems faced by a Multi-Link solution by offloading the QoS policies to the SDN controllers is effective, at the expense of increased overall cost and system complexity. Resulting in the conclusion that “Control Plane’ load management schemes require further research to become viable as a standalone method. Form the research reviewed a “Hybrid” approach such as the one proposed by Haibo W .et.al, (2018) may alleviate multiple issues faced by other singular QoS technologies by deploying Load Balancing mechanisms at both the Control and Data Plane of the SDN model. This would result in greater customization, flexibility and may prove cost effective over a period of time. Therefore, research should be conducted into using both “Multi-Link” and “Control Plane’ management to improve load balancing at various layers of the SDN stack to create a customizable, stable and simpler QoS scheme.
References Albert G, James R, Navendu J, Srikanth K, Changhoon K, Parantap L, David A, Parveen P, Sudipta S, 2011, “VL2: A Scalable and Flexible Data Center Network”, communications of the acm; mar 2011, 54 3, p95-p104, 10p. Amin T, Sergey G, Yashar G, 2012, “On Controller Performance in Software-Defined Networks”, Hot-ICE 12 (2012) 1–6 Chunzhi W, Gang Z, Hui X, Hongwei C, 2016, “An ACO-based Link Load-Balancing Algorithm in SDN”, 2016 7th International Conference on Cloud Computing and Big Data (CCBD), 2016 7th International Conference on. :214-218 Nov, 2016 Chuan W, Bo H, Shanzhi C, Desheng L, Bin L, 2017, “A Switch Migration-Based Decision-Making Scheme for Balancing Load in SDN”, IEEE Access, IEEE. 5:4537-4544 2017 Daegyu L, Jincheol Y, Kyusun C, J. Ghaznavi, 2002, “Fat tree encoder design for ultra-high speed flash A/D converters”, The 2002 45th Midwest Symposium on Circuits and Systems, 2002. MWSCAS-2002
Hong Z, Yaming F, Jie C, 2016, “LBBSRT: An efficient SDN load balancing scheme based on server response time”, Future Generation Computer Systems 68 (2017) 183–190 Hailong Z and Xiao G, 2014, “SDN-Based Load Balancing Strategy for Server Cluster”, 2014 IEEE 3rd International Conference on Cloud Computing and Intelligence Systems, Page s: 662 - 667 Haibo W, Hongli X, Liusheng H, Jianxin W, Xuwei Y, 2018, “Load-balancing routing in software defined networks with multiple controllers”, Computer Networks; aug 4 2018, 141 p82-p91, 10p. Jie C, Qinghe L, Hong Z, Miaomiao T, Lu L, 2018, “A Load-Balancing Mechanism for Distributed SDN Control Plane Using Response Time”, IEEE transactions on network and service management, vol. 15, no. 4, December 2018 Murat K and Arjan D, 2016, “Quality of Service (QoS) in Software Defined Networking (SDN): A survey”, journal of network and computer applications; Feb 15 2017, 80 p200-p218, 19p. Mohammad M T, Behzad A, Nader M, 2018, “Optimal QoS-aware network reconfiguration in software defined cloud data centers”, Computer Networks Volume 120, 19 June 2017, Pages 71-86 Marco C, Yang X, Anwar W, Gordon W, H. Jonathan C, Mario M, 2017, “BalCon: A Distributed Elastic SDN Control via Efficient Switch Migration”, 2017 IEEE International Conference on Cloud Engineering Muhammad I, Muhammad H D, Farrukh A K, Abdelouahid D, 2018, “Toward an optimal solution against Denial of Service attacks in Software Defined Networks”, Future Generation Computer Systems 92 (2019) 444–453 Olena T, Abdulghafoor R Y, 2016, “A network load balancing algorithm for overlay-based SDN solutions”, 2016 Third International Scientific-Practical Conference Problems of Infocommunications Science and Technology (PIC S&T), 2016 Third International Scientific-Practical Conference. :139-141 Oct, 2016 Pengzhan W, Hongli X, Liusheng H, Jie H, Zeyu M, 2017, “Control Link Load Balancing and Low Delay Route Deployment for Software Defined Networks”, IEEE journal on selected areas in communications, vol. 35, no. 11, November 2017 Philippos I, Lin G, 2016, “Performance Benchmarking of SDN Experimental Platforms”,

34
2016 IEEE NetSoft Conference and Workshops (NetSoft) NetSoft Conference and Workshops (NetSoft), 2016 IEEE. :116-120 Jun, 2016 Simon K, Hung X N, Nickolas F, Rhys B, Matthew R, 2011, “The Internet Topology Zoo”, IEEE Journal on Selected Areas in Communications IEEE J. Select. Areas Commun. Selected Areas in Communications, IEEE Journal on. 29(9):1765-1775 Oct, 2011 Umme Z, Hanene B Y, 2017, “Dynamic Load Balancing in SDN-Based Data Center Networks”, 2017 8th IEEE Annual Information Technology, Electronics and Mobile Communication Conference (IEMCON) Information Technology, Electronics and Mobile Communication Conference (IEMCON), 2017 8th IEEE Annual. :242-247 Oct, 2017
Yujie L, Yong L, Yue W, Jian Y, 2015, “Optimal scheduling for multi-flow update in Software-Defined Networks”, In Journal of Network and Computer Applications August 2015 54:11-19 Yi-Wei M, Jiann-Liang C, Yao-Hong T, Kui-He C, Wen-Chien H, 2016, “Load-Balancing Multiple Controllers Mechanism for Software-Defined Networking”, Wireless Personal Communications 94(4). Yaning Z, Ying W, Jinke Y, Junhua B, Shilei Z, 2017, “Load Balancing for Multiple Controllers in SDN Based on Switches Group”, 2017 19th Asia-Pacific Network Operations and Management Symposium (APNOMS) Network Operations and Management Symposium (APNOMS), 2017 19th Asia-Pacific. :227-230 Sep, 2017

35
An Analytical Review of Published Face Recognition Research Aimed at Improving Accuracy in Identification
Botlhe T Moitho
Abstract
Face recognition has over the years experienced tremendous growth mainly as a tool for identification, from smartphones to airport scanning devices, face recognition is also being used to combat several crimes including identity theft worldwide. This paper critically studies and evaluates the different feature-based approaches that have been tried out to better identification. The approaches reviewed in this paper are mostly state of the art, being face recognition based on gradation contour of face color, face recognition using the K-mean algorithm, face recognition using Haar classifier and local binary pattern and face recognition using the convolutional neural networks. After the employment of the above approaches, it was seen that the use of the convolutional neural networks was by far the most effective approach towards tackling the issue of accuracy.
1 Introduction Identification of a person through their facial features has become a key aspect on our daily lives over the past years. “Face recognition is a rapidly evolving technology, which has been widely used in forensics such as criminal identification, secured access, and prison security.” (Rath and Rautaray 2014). Agrawal and Singh (2017) stated that face recognition has grown over the years, but the major challenge that remains is the accuracy of these systems. Face recognition technology is also being used to combat several crimes across the world, examples being finding missing babies, passport fraud, identity theft, robberies and many more (Agrawal and Singh 2017). Researchers have over the years identified different approaches to alienate the problem of accuracy being faced by face recognition systems. Gururaj et al (2018) stated that face recognition systems are one of the biometric systems that are used to combat threats to online social media attacks. The author stated that face recognition systems have high usability and show high accuracy as compared to other biometric systems. Agrawal and Singh (2017) state in their study that legacy systems that have come and passed have one problem in common, this being the inability to recognize facial features given different conditions such as lighting, background and occlusion. Ragad et al (2017) proposed a new approach that would apply the multi-class logical analysis of data as a face recognition technique, while Wijaya et al (2018) proposed another new method, real time face
recognition which was based on face descriptor and its application for door locking. Hua et al (2018) came up with an approach focused on the face verification where they employed the second-order statistical property of the face pairs and used a binary classification model. This paper focuses on analyzing the many different approaches that have been proposed by researchers, which will be beneficial to the world at large as to which method has better chances of efficiency and how if at all these methods can be merged to come up with one major elucidation to the problem. These approaches include face recognition based on gradation contour of face color, face recognition using the K-mean algorithm, face recognition using Haar classifier and local binary pattern and face recognition using the convolutional neural networks. This paper has been divided into three different sections being Feature Based Approach Analysis, Conclusions and Recommendations.
2 Feature Based Approach Analysis In this section critical analysis and evaluation of face recognition approaches that are feature based is done. According to Supriana and Pratama (2017) feature based methods of face recognition generally have a high success rate and are relatively economical. They proposed a new technique which focuses mainly on the gradation contour of face color. To achieve this the gradation contour extraction process was done by calculating the difference of light intensity on a grayscale channel.

36
The process is divided into five major steps, being the modelling of the image, preprocessing, feature extraction, recognition and finally results phase. The preprocessing stage was then divided into three stages being the face and eye detection which was done to reduce the search area for the algorithm, the algorithm used to detect the eye and face area was the Viola Jones algorithm. The next step is the face ROI normalization based on golden ratio. Noise elimination is then done through use of the Gaussian blur In order to check the similarity between the two images a comparison between the contours that had been previously extracted was done. The technique was tested on two face databases, one from the Aberdeen site and another from the Yale database. The accuracy for both the Aberdeen and the Yale database ranked between 85 and 90 percent with lighting being the biggest factor for failure and facial expression difference hardly affected the results. The gradation of contour of face color technique was generally representative for identifying a unique face. A table representing the results from the testing of the technique in comparison to other techniques is shown below.
Table 1 Results comparing the face color gradation approach against other approaches, Supriana and Pratama (2017). Supriana and Pratama (2017) reached the conclusion that indeed the difference in light illumination is still an affecting matter when it comes to their proposed method, light direction also contributed to the failure of the method and thus improvement is still required. According to Itz et al (2016) caricaturing shape and color also as an aspect of implying the use of color and shape influences face recognition. They found that recognition of unfamiliar faces also benefited from caricaturing. The technique presented by Supriana and Pratama (2017) represented good science on the most part as to eliminate bias two datasets instead of only one were used in the testing of the approach. The approach also allows for reproducibility and
testability as the results have been documented and all the procedures that have been used are correctly documented meaning anyone can redo the test and get the same results even on different databases or data sets. However, this approach is not the most effective as given the same experiments with different aspects such as head pose, different lighting and different facial expression this approach might not give the best results in terms of accuracy. Wei et al (2018) proposed a feature-based method where features were extracted using the K-mean algorithm. The K-mean algorithm as it is a distance-based algorithm, depicts that the more the distance between two points the less likely of there being a similarity and vice versa (Wei et al 2018). The process included seven steps. A figure depicting the seven steps followed is illustrated below.
Figure 1 Steps involved in the proposed approach using the K-mean algorithm, Wei et al (2018). In the study SVM is used, face feature vector is taken as input feature, jackknife method is used as test sample partition method and RBF is taken as SVM kernel function. In testing, the data was taken from the cas-Peal database from the Institute of Technology of the Chinese Academy of Sciences in 2003. Hundred face samples were used in the experiment. Expression, illumination and scars were used as experimental subjects. Since feature extraction is performed for different sites, a table showing the mean of the feature values given the different experimental subjects from above is shown below.

37
Table 2 Mean of the feature values in different poses, Wei et al (2018).
Table 3 Continuation of mean of the feature values in different poses, Wei et al (2018). The K-mean algorithm is then used on the same samples for clustering. And the results are shown below, depicting recognition rate before and after the use of the K-mean for clustering. Showing a significant increase for the recognition effect with the expression feature and a relatively average increase for the light illumination and the scar feature.
Figure 2 Results comparison before and after use of the k-mean clustering algorithm, Wei et al (2018). In conclusion Wei et al (2018) stated that even though the method they proposed seemed effective on the dataset used for training and testing, future work was still needed in order to improve the method. The approach proposed by Wei et al (2017) is a study that is quite effective and has shown great potential to possibly eliminate the problem of accuracy currently being faced by face recognition across the world. It shows purposiveness as it clearly sets out the goal being to eliminate inaccuracy in face recognition, and it shows generalizability because the K-mean algorithm can be implemented anywhere by anyone in the world so the study is impactful worldwide. As a strength the major advantages of the K-mean clustering algorithm are its simplicity and high speed thus being able to compute the recognition faster. The study however does not bring in the concept of objectivity as for the training and testing only one data set is used from a single database without any comparison to other databases available worldwide. This shows that even though this approach may prove effective, further work is still required in order to eliminate bad science. Das et al (2018) proposed a prototype which uses the HAAR cascade classifier as the face detection tool and the local binary pattern for the face recognition. The researchers state that both negative and positive images are used to train the classifier respectively. Every area of the image is examined using classifiers called Haar features that act as a funnel called the Haar cascade. The images are then rejected as soon as they do not match to a face.

38
For the facial recognition the local binary pattern histogram is used for the study. Which looks at 9 pixels at a time to construct a histogram. The algorithm then uses four parameters being the radius, neighbors, grid x and grid y to construct the histogram. The local binary pattern histogram creates an intermediate image that describes the original image by emphasizing the facial characteristics. When given an image the local binary pattern histogram matches the face to all other images in the database. If a match is found an image with a name at the bottom is produced as the identity. The proposed algorithm was tested using Python in Python IDLE 3.6.4 on Windows 8.1 operating system with Intel core i3 running at 2.6 GHz. Database used was sqlite3. The images presented were of different postures. The first step was to test face detection on different sources, being real time video image, image file and video file. Below are the tables showing the results from the above sources.
Table 4 Showing performance results for image file, Das et al (2018).
Table 5 showing performance results on video file, Das et al (2018).
Table 6 Showing performance results on real time video image, Das et al (2018). The results above show that the face detection is most effective on a video file while it is averagely consistent and good on real time video images and the image files show a less accurate and effective result. For the face recognition step a portion of the detected face is then cropped out and the local binary pattern histogram is used to detect and recognize the face. The table below shows the results obtained from this step.
Table 7 Performance of the LBPH for face recognition, Das et al (2018). The table above clearly shows that with an increase in the number of samples presented to the algorithm there is a significant decrease in the recognition rate. To conclude their paper Das et al (2018) explained that according to the maximum error rate of their algorithm, being 0.4 percent, it shows that their algorithm is efficient. The approach proposed by Das et al (2018) is relatively effective as it shows a great face detection and face recognition rate given the use of the classifier and the LBPH algorithm used. However, the study does not fully provide precision as it does not show how exactly data was collected and from where. However, the main weakness with this

39
method is that with the increase in samples there is a decrease in the efficiency of the face recognition, which poses a problem given the time it would take to divide samples into smaller groups. The study also does not have 100% accuracy though when compared to the approaches analyzed before being the K-mean algorithm and the shape and color focus proves to be the most effective as it proves better results for both the face detection and the face recognition. Nimbarte and Bhoyar (2018) proposed a method that uses convolutional neural network (CNN) to combat the problem of the age invariant face recognition. For this approach instead of the traditional manual extraction of features, the CNN is used by capturing the desired feature descriptors. A seven-layer CNN architecture is used for feature extraction. Below is a figure showing the hierarchy of this architecture.
Figure 3 7-Layer CNN Architecture for AIFR-CNN, Nimbarte and Bhoyar (2018). The architecture is made up of three convolution layers, two pooling layers and two fully connected output layers. For classification the support vector machine (SVM) was used. This algorithm was used as a classifier to identify a person even over a long period. In testing this approach two locally available datasets were used being the FGNET and MORPH (Album II). Both datasets contain images of the same person at different ages, with different
expressions, with different light illumination and different head positions. From the FGNET database 980 images were used of which 852 were for training and 128 for testing. Experiments carried out on these images varied in case of image size and pose. For performance CNN was used with Euclidian Distance and Nearest Neighbor as classifiers instead of the SVM. The results obtained for the different experiments are shown below.
Figure 4 Results from experiments carried out on FGNET database images, Nimbarte and Bhoyar (2018). For the MORPH (Album II) database a total of 1005 images were used, 750 being used for training and 255 used for testing in the head pose experiment. For the frontal images experiment a total of 2084 images were used, 1509 used for training and 575 for testing. For performance CNN was used with Euclidian Distance and Nearest Neighbor as classifiers instead of the SVM. Below is a figure showing results of the above experiments on MORPH (Album II) database.
Figure 5 Results from experiments carried out on MORPH (Album II) database images, Nimbarte and Bhoyar (2018).

40
In conclusion, Nimbarte and Bhoyar (2018) settled that CNN is a better recognition method as compared to available methods as it has no complicated preprocessing steps and that it gives better performance on 32 by 32 image sizes as compared to 64 by 64 image sizes. The approach presented by Nimbarte and Bhoyar (2018) is probably the most effective in the struggle with accuracy as compared to the other approaches analyzed in this paper. This approach is very effective and represents good science in the sense that the results presented after testing are both meaningful and can be reproduced by any second researcher. The researchers also made sure to implement objectivity by using two different datasets to train and test their experiments, they also used two different classifiers to test the performance of their approach instead of just using one classifier thus eliminating any bias. Convolutional neural networks take lesser time to extract relevant information from an image thus reducing the computational cost, now given the reduction in computational cost this then means a significant save in memory while still giving better performance results. Tripathi (2017) also proposed an approach centered on machine learning where they used artificial neural networks, the approach as the CNN is very effective and testable. In conclusion the CNN approach is most effective and can be the future answer to this continuing struggle with accuracy in recognition. A merge in the CNN for its fast performance with the K-Mean clustering for its quick recognition rate would be a great step towards combating the problem of accuracy.
3 Conclusions Face recognition generally is a great approach towards the world of artificial intelligence that the world at large is driving at. As seen above, there are quite several approaches that have been employed by researchers at large to combat the problem with accuracy. Basis of face recognition on gradation contour of face color is one approach that has been employed however still requires a few touch ups to make it more effective, and the use of the K-mean clustering algorithm is a step up from the first approach analyzed as it proves to have the strength of being relatively fast on the face detection aspect as it is done with the K-mean algorithm. Moving further up the efficiency hierarchy is the use of the Haar classifiers, with a higher accuracy rate as compared to the first two approaches, however
showing a weakness in that it cannot work effectively given a larger state space. The CNN approach proved to be the most effective approach analyzed in this paper, showing a higher efficiency rate and having the advantages of the low computational cost and reduced memory. Generally, looking at all the approaches mentioned above, the most affecting matters are the light intensity, the head pose and the difference in age. The fight towards eliminating the problem with accuracy continues for face recognition, however the methods above have proven that it can be done, with the right work put in.
References Agrawal, A.K. & Singh, Y.N. 2017, ‘An efficient approach for face recognition in uncontrolled environment’, Multimedia Tools and Applications, vol. 76, no. 3, pp. 3751-3760. Das, I., Gangopadhyay, I. & Chatterjee, A. 2018, ‘Face Detection and Recognition Using Haar Classifier and LBP Histogram’, International Journal of Advanced Research in Computer Science, vol. 9, no. 2, pp. 592-598. Gururaj, H.L., Swathi, B.H. & Ramesh, B. 2018, ‘Threats, Consequences and Issues of Various Attacks on Online Social Networks’, International Journal of Education and Management Engineering, vol. 8, no. 4, pp. 50. Hua, Q., Dong, C. & Zhang, F. 2018, ‘A Novel Approach to Face Verification Based on Second-Order Face-Pair Representation’, Complexity, vol. 2018, pp. 10. Itz, M.L., Schweinberger, S.R. & Kaufmann, J. 2016, ‘Effects of Caricaturing in Shape or Color on Familiarity Decisions for Familiar and Unfamiliar Faces’, PLoS One, vol. 11, no. 2. Nimbarte, M. & Bhoyar, K. 2018, ‘Age Invariant Face Recognition using Convolutional Neural Network’, International Journal of Electrical and Computer Engineering, vol. 8, no. 4, pp. 2126-2138. Ragab, A., de Carné, d.C., Yacout, S. & Ouali, M. 2017, ‘Face recognition using multi-class Logical Analysis of Data’, Pattern Recognition and Image Analysis, vol. 27, no. 2, pp. 276-288. Rath, S.K. & Rautaray, S.S. 2014, ‘A Survey on Face Detection and Recognition Techniques in Different Application Domain’, International Journal of Modern Education and Computer Science, vol. 6, no. 8, pp. 34-44.

41
Supriana, I. & Pratama, Y. 2017, ‘Face Recognition New Approach Based on Gradation Contour of Face Color’, International Journal on Electrical Engineering and Informatics, vol. 9, no. 1, pp. 125-138.
Tripathi, B.K. 2017, ‘On the complex domain deep machine learning for face recognition’, Applied Intelligence, vol. 47, no. 2, pp. 382-396.

42

43
Evaluation Of Current Security Measures Used In Automated Teller Machines (ATM)
Khumo Setlalekgosi
Abstract Increasing usage of Automated teller machines (ATM) have attracted lot of fraud cases, which became a profitability concern for banking sector and customers. It has given a rise to more methods introduced as a way of securing ATM’s. This paper critically evaluate four security methods implemented in ATMs being three-tier authentication, multimodal biometric strategy, multifactor authentication and thumbprint based authentication which integrate various methods to secure ATM’s more. These methods are plausible and their majority has fairly presented results. More experiments need to be done for clear evidence of justified conclusions and validity of these methods.
1. Introduction Teller Machines (ATM) by banking sector have The increase use of Automated caused a vast advantage, as they are convenient and flexible, but their popularity attracted cybercrimes like fraud, causing authentication and security in ATM’s to be a drawback. Narayanan et al (2018) and Sharif et al (2018). Narayanan et al (2018) further expressed that security and authentication of ATM has been evolving concern recently, and its drawback affect the financial assets of the user. They further articulated that even though there are different methods incorporated to deal with security issues in ATMs, they still do not solve with major problem being ATM transactions security, which is where vulnerability in security is currently. Onyesolu and Okpala (2017) mentioned that existing systems has identity theft and fraudsters are able to access the users PIN and access user’s cash unauthorized, causing financial loss to the bank businesses and customers, this suggests that more secure methods are needed. Imanah and Konyeha (2017) said security loopholes being identity theft caused by self-banking offered by ATM are increasing and they are threatening the security and profitability. Onyesolu and Okpala (2017) proposed three-tier authentication model, which combines three layers being password usage, fingerprint and one-time password (OTP). Its test results show that the existing system method’s authentication process in terms of speed is faster than the new proposed system but it’s more secure as it uses three levels of authentication than one in the old method. Kassem et al (2014) proposed multimodal biometric model which integrates
fingerprint and iris biometric for identification and authentication method for ATM. Twum et al (2016) proposed multifactor authentication method which integrates PIN and fingerprint authentication as way securing ATM’s. Babatunde et al (2014) proposed thumbprint-based authentication that uses fingerprint as a verification method in ATM’s. This paper has three sections; section one is introduction, section two is evaluation of current security methods used in ATMs by other authors, experiments results of each method and lastly conclusions.
2. Current Security Measures of ATM This section evaluate four current ATM security measures proposed by other authors, the evaluation is based on experiments and test results.
2.1 Three-tier Authentication Onyesolu and Okpala (2017) introduced three-tier authentication, which combines three layers being password usage, fingerprint and one-time password (OTP). It solves the validity of users who access the ATM. The validation of password is done by the system through comparison with the inserted card, and if they match, the users are able to proceed to the next level of authenticating being the fingerprint. The fingerprint is compared with the card encoded and if they match, the user is allowed to reach the final level of authentication being the OTP. Here the user provide eight characters generated by OTP and users receive them as mobile message. Users are granted access to perform transactions if the OTP was correct and entered in specified time. Onyesolu and Okpala (2017) articulated that through the acceptance of this model, financial organizations

44
will have a strong ATM systems and assurance to customers will be restored. The evaluation of this model was based on speed and security level comparing it with the existing system. In terms of security authors articulated that new proposed model proved to be more secure as multiple wrong passwords, OTP’s and fingerprints were tried on the model but none of them managed to get access, thus proving that its robust. The current system in terms of security utilize one means of verifying customer’s identity, which is by PIN and in cases if identity theft where a guess is successful on a customer’s PIN by attacker’s cash will be illegally withdrawn from ATM. As for the new proposed system, it offers an improved security as it utilizes three different mechanisms for authentication. Through this combination of three authentication mechanisms, every loophole that could lead to identity theft is covered up. It is clear that the three mechanisms will not fail at the same time hence getting rid of issues of identity theft. Onyesolu and Okpala (2017). Table 1 and figure 1 depict results of time taken by three users to complete authentication process in current system and proposed system. Group A represents: Current system. Group B represents: New proposed system.
Table 2 Comparison of time taken to complete au-thentication by both the proposed model and existing system. Onyesolu and Okpala (2017)
Figure 3 Time taken to complete authentication process of both the proposed model and existing system line chart. Onyesolu and Okpala (2017) Comparing above results from table 1 and figure 1, it’s evident that the existing system method’s authentication process in terms of speed is faster than the new proposed system, that caused by three levels of authentication in the proposed method and one level of authentication in the existing system. Researchers further stated that even though the existing system is faster, it is important to know that
security should not be traded or compromised for speed. Experiment of this method have limitations and they affect it to be scientifically sound as small sample size is used during experiment. In terms of security improvement, the results given are not fairly proved and justified with clear presentation and evidence linked to them as compared to the presentation of the speed aspect in the experiment. More research need to be done to improve the validity of this method and fairly prove and present results. It also would be appealing to see the aspect of security’s results comparison in metrics like line graphs.
2.2 Multimodal Biometric Strategy Kassem et al (2014) proposed multimodal biometric model that integrated fingerprint and iris. This fusion system employs a minutiae matcher for fingerprint and a hamming distance matcher for iris with matching score level. The main aim of this research is to have a framework that is more secure for ATM users and deal with identity problems. To conduct the experiment for this model, fingerprint images on DB1_B in FVC2004 and DB3_B in FVC2004 each having (640*480) pixel images were used. For iris database images CASIA iris image version 1.0 was used. Kassem et al (2014). 20 people are in a database, each person have seven images for fingers and seven images for iris, four images for each person are used on training phase and three images are utilized for testing phase. First level tests, tested iris and fingerprint separately and the second level tests integrated iris and fingerprint through the proposed model. The evaluation was in terms of performance and the following three (3) criteria was used to measure it, false acceptance rate (FAR), false rejection rate (FRR) and accuracy. After the experiments the following results in table 2 and figure 2 were obtained for fingerprint and iris separately, which shows that maximum accuracy happened when threshold was 0.6, which produced 96.67% accuracy, 0% FAR, and 5% FRR. The below results were obtained when using threshold and without it.
Table 3 Experimental results. Kassem et al (2014)

45
Figure 4 Results Histogram. Kassem et al (2014) Kassem et al (2014) stated that when the time for two proposed matching technique was computed, for the first technique, being the minutiae matcher for fingerprint got the max match score for the entire system without threshold and its time was 44 seconds. For the second matching technique that get fusion for finger that pass threshold relating to iris the time was 32 seconds. They further articulated that because the second matching technique takes less time, it will be used for the ATM. Table 3 depict results.
Table 4 Final Reults. Kassem et al (2014) The results demonstrate strong prospects of success but they are only limited to the new system and that limiting it being scientifically sound, as its tests were not compared with the ones of the existing systems. Therefore, this method lacks a fair comparison in terms of methods performance of both the existing system and new system. There is generalization in the method as 20 users were used to test during the experiment. The results were fairly proved and presented with evidence.
2.3 Multifactor Authentication Twum et al (2016) proposed a multifactor authentication which integrated PIN and fingerprint authentication as way of enhancing security and safety for ATM users. The proposed method contains three-tier structure. First tier is verification; its focus is on the phases of enrolment, enhancement, feature extraction and fingerprints matching. The database end is the second tier, which stores all fingerprints of all ATM users who are already registered as templates and Pin text. System platform that relates monetary transactions is the last tier. Twum et al (2016). For verification process, the user will enter their PIN into the ATM and if it matches the one on the system database, user will be granted an access to the second level of authentication being fingerprint recognition. When the fingerprint scanned matches with the enrolled fingerprints in the system database, the user is given an access to perform their transactions on the ATM.
To implement the proposed method windows 8 was used, running on a 32-bit processor with a speed of 3.0 GHz. Its evaluation of performance was based on false rejection rate (FRR), false acceptance rate (FAR); average matching time (AMT) and total error rate (TER) conducted which helped in proving its reliability and security. To conduct tests 450 people who were randomly selected were used. To conduct tests on the effectiveness and robustness of this method, two sets of thumbprints data are used to test FRR and FAR because as indicators they are common and simpler to check the accuracy, effectiveness and performance of fingerprint pattern matching. Five datasets were used to contain thumbprints, where by dataset (A) had 1,800 thumbprints, which accounted for four thumbprints, collected from 450 respondents’ right thumb. Dataset (B) had same amount of thumbprints from the respondents’ left thumb. Dataset (C), (D) and (E) each had 450 thumbprints of right thumbs of each person with different thumb pose for intra-class variation test. All of these thumbprints were enrolled into the system utilizing digital persona fingerprint reader.
Figure 5 Intra- Class Variations test (Matching Score Distribution). Twum et al (2016) Figure 3 shows the scores obtained from 20 selected fingerprint templates in (C) matched against fingerprint in the dataset (D) and (E) from the same person. The results above, scores obtained differs from dataset to another and it’s caused by the different poses of people made in the enrolment phase. Researchers articulates that if respondents were authenticated with templates in datasets (D) and (E) 7 imposters would have been in dataset D and on E to totalize to 13 being 65% of 20 selected samples. Conclusion of the results is that if clients are not controlled at the enrolment phase to positioning thumbs well on the sensor, FAR rate will be high at the authentication stage.

46
Figure 6 FRR Score Test. Twum et al (2016) Figure 4 depict score for randomly selected 50 templates in dataset (A) and out of 50 only 1 false reject happened making FRR 2% when compared to 3.33% recorded from past results by other authors, that made the proposed method better having a low record of FRR. Genuine Acceptance rate (GAR) is 98%.
Figure 7 FAR Test. Twum et al (2016) Figure 5 reveals FAR test results on dataset (A) represented by a curve which shows 35 threshold value and two imposter values that were recorded out of 50 samples selected randomly, thus making FAR 4%. The 4% recorded was compared with performance results by Manish, which was 6.6%, that made the proposed method to have a better performance. The new method also recorded 6% of TER for 50 total access and comparing to 13.3% recorded by other authors it performed well.
Figure 8 ROC curve. Twum et al (2016) Figure 6 shows ROC curve average matching times 1.023, 1.075, 1.155 records in datasets A, B and A+B. Looking at the results, the new method’s performance is better than the current solutions available. Majority of its results were fairly reported and compared to other past results but some conclusion of tests is not justified clearly, as they
were not linked to any evidence gathered. The research is scientifically sound as it used more sample size for testing.
2.4 Thumbprint-based authentication Babatunde et al (2014) proposed thumbprint-based authentication to build a more secure ATM through the formulation of fingerprint to help bank users with identification and verification. It has three-tier structure; first tier is the verification, which is formed by enrolment, enhancement and fingerprints matching. Second tier is the database, which stores information on registered customer’s fingerprints. Third tier is the platform for transactions. Researchers further articulates that the operation of this method starts by enrolling customer’s thumbprints, then enhancing where image foreground regions are separated from background regions. The feature extraction locates, extract and store in the database feature points of thumb images. Feature points form a template of a thumbprint that is unique and if that thumbprint presented, match any in the database during verification, the transaction component will be introduced to the user. The experiments and evaluation were carried using FVC2004, FVC2006 and FVC2008 databases to measure false rejection rate (FRR), false acceptance rate (FAR) and average matching time. Results obtained were compared with similar and recently formed algorithms.
Table 5 Average Matching Time for 3 datasets. Babatunde et al (2014) These results record standard deviations of 0.1067, 0.0685 and 0.00714 for datasets FVC2004, FVC2006 and FVC2008 individually and proved that average matching times recorded in each database are closed significantly. The low recorded matching times prove that the proposed method is better for verification and identification of users at a very short time.
Table 6 FRR and FAR of Different algorithms on FVC2004. Babatunde et al (2014)

47
Table 5 depicts FRR and FAR results for three different referenced algorithms and current study using similar dataset being FVC2002. (Babatunde et al, 2014) claimed that the higher performance of the proposed algorithm is proved by its lowest FRR results than other algorithms and it is only algorithm with zero FAR results.
Figure 9 Column Charts of FRR values. Babatunde et al (2014)
Figure 10 Column chart of FAR values. Babatunde et al (2014) Figures above support the claim by (Babatunde et al, 2014) of high performance of the proposed method as they depict lowest values for FAR and FRR over referenced algorithms.
Table 7 Different Average Computation Time in second. Babatunde et al (2014) Table and figures presents a comparison of average computation time between referenced algorithm and proposed method on FVC2002 fingerprint database to measure FAR and FRR. In all datasets, the proposed algorithm recorded low computation results that indicating its dominance.
Figure 11 FRR matching time for various fingerprint matching algorithms Column chart. Babatunde et al (2014)
Figure 12 FAR matching time for various fingerprint matching algorithms. Babatunde et al (2014)
Figure 13 FVC2000 database ERR graphs. Babatunde et al (2014) Above figures, indicate equal error rates (ERR) generation, which decides algorithm’s best description of the error rate. The lower the result of ERR, the lower error rate and algorithm’s adequacy. FVC2000 database ERR recorded points are (0.2442, 0.00716), (0.2473, 0.00628), (0.2382, 0.00765) and (0.2509, 0.00861) for 4 datasets which implies that 0.2442 threshold guarantee that there is similar FAR and FRR error rate for DB1 and that applies to other 3 datasets. Babatunde et al (2014) stated that above ROC curves and recorded ERR indicated that the proposed method is exceptional for strong verification and giving access to authorized users in ATM’s. Method’s results presentation and report was fair, giving it an advantage of being scientifically sound.

48
Majority of claims and conclusions were justified as the authors’ supports with results that proved their claim. The experiments were not bias as there was comparison of the new method with different algorithms to measure performance of its accuracy and adequacy, thus making the method plausible and its experiment can be repeatable.
3. Conclusions Majority of current ATM security methods evaluated in this paper had well-presented experiments and strong prospect of success results, but for some there was a question of validity and reliability as their conclusions and claims were not justified with evidence linked to them. The methods solve current limitations of securing ATM’s. The method by Onyesolu and Okpala (2017) is promising with its three authentication layers, its able to securely authenticate and verify customers’ identity using all three authentication mechanisms but its validity is questioned as small sample size is used for experiments and other part of results and conclusions are not fairly presented because there is no evidence provided. Kassem et al (2014)’s method is plausible and it meet its objective of securing ATM’s, but experiments need to be repeated for fair comparison of it’s the results of against the existing system. Twum et al (2016)’s method has fair presented results but more evidence is needed to justify its conclusions for accuracy approval. Babatunde et al (2014) have an exceptional results presentation and justified conclusions but they recommended that there is a need to reduce error rate through integration with other biometrics to further improve verification. For future recommendations, it may be ideal to consider usability of the ATM when implementing these methods, as the more the authentication layers, the more time consuming in its usage, which affect users. Jaiswal and Bartere (2014) mentioned one of limitations with biometrics equipment as being expensive thus need to be considered when implemented.
References Babatunde, I.G., Charles, A.O., Lange, M.J. and Olumuyiwa, D.J., 2014. ‘Experimental study of thumbprint-based authentication framework for
ATM machines’. In Science and Information Conference (SAI), pp. 505-514. IEEE. Imanah, D., & Konyeha, S. 2017. ‘Enhancing electronic banking security in Nigeria using finger vein biometric’. International Journal of Computer Science and Software Engineering, Vol 6 (5), pp. 120-129. Jaiswal, A. and Bartere, M., 2014. ‘Enhancing ATM Security Using Fingerprint and GSM Technology’. International Journal of Computing Science and Mobile Computing (IJCSM), Vol 3(4). Kassem, M.A., Mekky, N.E. and EL-Awady, R.M., 2014. ‘An Enhanced ATM Security System Using Multimodal Biometric Strategy. International Journal of Electrical & Computer Sciences IJECS-IJENS, Vol 14(4), pp. 9-16. Narayanan, H.I, M. J., Uttham, K., Ibrahim, M., & Kiran, M. 2018. ‘Advanced ATM multilevel authentication using fingerprint verification and OTP validation’. International Journal of Advanced Research in Computer Science, Vol 9, pp. 284-288. Ochang, P.A. and Ofem, P.O., 2017. ‘An Enhanced Automated Teller Machine Security Prototype using Fingerprint Biometric Authentication’. International Journal of Advanced Networking and Applications, Vol 8(4), p.3110. Onyesolu, M.O. and Okpala, A.C., 2017. ‘Improving Security Using a Three-Tier Authentication for Automated Teller Machine (ATM)’. International Journal of Computer Network and Information Security, Vol 9 (10), p.50. Sharief, A., Patil, A., Anushree, G.K., Kumari, J. & Krishnaswamy, V. 2018, ‘NFC Featured Three Level ATM Security’, International Journal of Advanced Research in Computer Science, Vol. 9, pp. 289-292. Thilagavathy, T. and Siruba, K., 2014. ‘Personal Verification Through Finger Vein Pattern Recognition Using Support Vector Machine’. International Journal of Applied Science and Engineering, Vol 2(1), p.13. Twum, F., Nti, K. and Asante, M., 2016. ‘Improving Security Levels In Automatic Teller Machines (ATM) Using Multifactor Authentication’. International Journal of Science and Engineering Applications Vol 5 (3), pp.126-124.

49
An In-Depth Evaluation of Current Limitations in Autonomous Vehicle Object Detection Systems
Connor William Reed Smith
Abstract
Autonomous vehicles are perhaps one of the most exciting prospects of the future within the field of AI and engineering. This paper will identify current research that is being carried out, specifically focussing on vehicle sensor systems and how they can integrate object detection. Finally, the paper will conclude by discussing what the future could hold for autonomous vehicles, and how their sensors can be implemented as solutions to problems within modern day society. The operational scope for AI systems is not just restricted to vehicles – they hold the potential to be utilised across almost any industry.
1 Introduction By using a combination of different sensory systems such as cameras and Infrared scanners, we can create an intelligent vehicle that can essentially drive itself from one destination to another without the need to be piloted manually. The core concepts of autonomous vehicles, such as object detection, are already being utilised to improve vehicle safety. Yang, et al. (2017) evaluated the effects of in-vehicle traffic lights, and concluded that in-vehicle traffic lights also drastically increases safety. With over one billion vehicles in the world (Meifang, 2018), it is imperative that any intelligent vehicle systems are safe to operate within society. Most intelligent vehicle systems are viable because the possibility of human intervention exists – creating a completely auotnomous car means having a perfect system that can operate without that human interaction. In this regard, there are weaknesses. One of these weaknesses was shown by Diaz-Cabrera et. al. (2015). They attempted to develop a technique to detect traffic lights in daytime and night-time conditions. Though their results were positive and showed a solid detection rate, they concluded that their system “yields some limitations in extreme situations… such as the strong light changes or the sun behind traffic signals” (Diaz-Cabrera, et al., 2015). It is limitations such as the aforementioned one that are acting as barriers to true autonomy for vehicles. Because of the risk vehicles pose to pedestrians and other motorists, there is no margin for error. Machiraju & Channappayya (2018) essentially created a failsafe to alert the driver of technical errors in their object detection system. This is just one example of how researchers are taking safety into account, even when the driver does not have a technical understanding.
This survey paper will evaluate current research that is being performed on the topic of autonomous vehicle sensor systems and what their existing limitations are. To be more specific, how object detection systems perform using different research methods.
2 Current Autonomous Vehicle Sensor Systems Research
Because of the constantly evolving technology behind Artificial Intelligence (AI) and likewise systems, there are often multiple different approaches that researchers can undertake to tackle some of the most pressing issues within the autonomous vehicle research sector. Artificial Neural Networks (ANN’s) and Sensor Fusion are perhaps some of the most emerging solutions.
2.1 Artificial Neural Network Sensor Fusion
Ultrasonic and Infrared sensors are the most commonly used sensors in obstacle detection systems (Farias, et al., 2018). An autonomous vehicle cannot rely these alone, however. Farias, et al. (2018) attempted to use multiple sensors to build an improved object detection model for a robot to navigate around. Using 13 sensors (8 Infrared (IR) and 5 Ultrasonic (US) sensors) to gather the raw values, the distances to the objects can be relayed to the robot. The robot can then use the provided data to keep a distance from the obstacles and freely move without colliding with anything. This newly developed method was compared to the most widely used method of solely using either IR or US to detect obstacles. This comparison would go on to form the conclusion of the research, based on how successful the new method was in contrast with existing standards.

50
Fig. 1 – Results of the new method vs. traditional (Farias, et al., 2018). The ANN was the Artificial Neural Network approach. The path that the robot took using each method is shown in the illustration figure 1. Generally, the path taken using the ANN method seemed to result in more direct, linear pathways to the target destination. Alongside developing the method, the researchers also attempted to create a new way of calibrating IR/US sensors automatically (figure 2). This consisted of:
1. Set up the workspace and scan the area. 2. Store the data from the scans. 3. Synchronise the data using multiple
algorithms. 4. Build the ANN using calculated values and
raw data of the sensors. 5. Test the ANN.
Fig. 2 – Results of the ANN calibration against traditional calibration (Farias, et al., 2018). The scientists concluded that the new method is “undoubtedly an advance in the calibration of proximity sensors” (Farias, et al., 2018). They claimed the new method was an improvement on the traditional method (Farias, et al., 2018), on the basis that the new method was far more practical and yielded a much more consistent path to the target destination. The authors of the paper intended to improve object detection by combining sensors and set out to
formulate an automatic calibration method. It could be argued that the scale in which the tests were carried out were small, but it is important to consider how new this approach is. The way the scientists conducted the experiment was good – an obstacle course in which the robot movements are tracked and compared afterwards is thorough enough to gather a good set of results. The science behind this paper is solid. The graphs and illustrations in figures 1 and 2 both correlate alongside the conclusions – it can therefore be concluded that the ANN method generally yields better results than what the traditional method does. The ANN yields a more direct and linear path, alongside much more accurate calibration results. In every aspect, the ANN approach is a direct improvement upon using the traditional model.
2.2 Indoor Odometrical and Magnetic Sensor Fusion
Autonomous vehicles will primary be used outdoors, though there are applications in which they could be used indoors. Keeping this in mind, it is important to consider how sensor systems perform in indoor conditions. Typically, sonar, laser and visual sensors are used to aid indoor navigation, but they have their flaws which can be detrimental to performance. For example, lasers are often bulky and slow at processing data (Jeon, et al., 2016). Research carried out by Jeon, et al. (2016) focussed on indoor localisation using magnetic sensor fusion. GPS systems are traditionally used for autonomous vehicle navigation, but have frequent outages which would reduce local indoor performance (Jeon, et al., 2016). To combat this, the project will develop a localisation system which is based on magnetic markers without the use of a GPS system.
Fig. 3 – The localisation process (Jeon, et al., 2016). The localisation works in three key parts, labelled A, B and C in figure 3. Part A generates an odometry model based on wheel and steering angle data. Part B uses the magnetic sensor to detect magnetic fields, and then a map is created by referencing the position

51
of the fields. Finally, section C merges the data form all sensors (Jeon, et al., 2016). Figure 4 shows the path in which the simulated car will take to test the localisation method. A series of magnets will be placed approximately 2.5 meters apart to generate a desired path through the cones. Using the newly developed method, the car should follow the magnets.
Fig. 4 – The slalom course for the car to navigate (Jeon, et al., 2016). The results gathered at the end of the experiment showed that the car remained on the desired path for most of the experiment. Figure 5 shows positional errors that appeared during the testing. When first examined, it looks like most of the errors affected forward movements, in this case when the car was turning between the cones. However, Gaussian white noise models were used to filter the input data before being calculated. As a result, the actual outcome was that the car successfully navigated with a very small amount of errors. Any errors that did occur were not major and did not compromise the experiment.
Fig. 5 – Positional errors that occurred forward and laterally (Jeon, et al., 2016). This research is fundamentally very similar to the research carried out by Farias, et al. (2018) in that
both sets of scientists wanted to enable automated movement from one point to another. The primary difference between them is the method which is applied to achieve their results. Jeon, et al. (2016) used magnets to essentially create a “trail” for the car to follow, whereas Farias, et al. (2018) used sensors to constantly scan the environment and make subtle changes to the movement of the robot. The algorithm and localisation process used by Jeon, et al. (2016) yielded a consistent dataset, with minor errors. The researchers were aware that odometrical errors would occur because of the nature of the experiment; to account for this, they applied a Gaussian white noise model to correct the course of the vehicle. There are two problems with the experiments, though the authors did acknowledge this and have suggested future remedies. The first is that Gaussian noise models are not ideal for real world scenarios because they have input data limitations (Jeon, et al., 2016). Finally, the scientists also accepted that forward direction errors were more prominent than lateral ones – it was suggested that other environmental sensors could be used to fuse further magnetic sensor data. Using a magnet-detecting based system alongside Gaussian white noise models, the approach seems to point towards a successful direction. The vehicle managed to navigate the slalom course without any catastrophic errors, though there were some minor discrepancies in navigation. Assuming that these can be resolved, this approach looks to be a promising area for pre-determined navigational tasks.
2.3 High Speed Navigation Systems
There is no shortage of research regarding autonomous vehicle or robots, though there is a distinct lack of references to autonomous heavy vehicles (Rodriguez, et al., 2016). From a commercial perspective, an autonomous truck would need to be able to follow a route or road to its destination. Rodriguez, et al. (2016) attempted to create a navigation system for trucks going at a high speed, around different tracks and road conditions. The research firstly acknowledges that GPS receivers alone are not enough to contribute to controlling a vehicle at high speeds. Rodriguez, et al. (2016) go on to say that this is due to GPS sensors using low-frequency. The authors also concur that a Kalman filter would be the best approach to undertake.

52
Fig. 6 – The sensor data fusion diagram that was used (Rodriguez, et al., 2016). Using a fuzzy sensor data fusion, they will take measurements from a tachometer, gyroscope and a DGPS receiver. Applying the fuzzy logic to the collected sensor data, the system can estimate the position and orientation of the track. This, in turn, will help the truck navigate. The truck was tested on four different tracks, with each one having different road surfaces, terrain shapes and total distances covered – the tracks were labelled A, B, C and D. Track A was a 2.8km asphalt road, with straights, and low to moderate curves Track B was an unpaved road, made up of straights and large curves. Tracks C and D both featured paved straight sections as well as mixed variations of road curves. The results recorded the speed in which the truck entered each corner, and how much the vehicle deviated when committing to a turn. The maximum error distance was also calculated.
Fig. 7 – Track A. The numbers are each curve indicate the radius of the turn in meters (Rodriguez, et al., 2016).
Fig. 8 – Track A results. (Rodriguez, et al., 2016).
Fig. 9 – Track C. The numbers are each curve indicate the radius of the turn in meters (Rodriguez, et al., 2016).
Fig. 10 – Track D. The numbers are each curve indicate the radius of the turn in meters (Rodriguez, et al., 2016).
Fig. 11 – Track C and D results. (Rodriguez, et al., 2016). The results of the tests from the tracks show that tracks with large turning radiuses often result in a higher maximum error range. The average maximum error for track A (figure 8) was 46.5cm, whereas the average maximum errors for tracks C and D were 69.6cm and 64.8cm, respectively (figure 11). The standard deviation results for all tracks were similar and were consistently within the same range.

53
From these results, the researchers concluded that a “good performance is achieved following paths with very different curvatures” (Rodriguez, et al., 2016). They also suggested that considering the slips in motion in their estimations could improve future results. There was one concern about the results – there were four tracks, but the authors only provided a table of results for A, C and D. Though they did briefly mention track B, there is no results documentation. Furthermore, this issue is not justified nor addressed within the paper. In order to conclusively say that this project was a success, all tracks must be documented so that others can see how the truck performed in all conditions. This results exemption is particularly concerning since track B was the only track that was unpaved. Failing to document the results of the track means that it is impossible to verify whether this system can perform well in a variety of surfaces. The real-world applications of this would make it a requirement that unpaved roads (i.e. dirt roads) are tested. Taking these concerns into account, the conclusions of the researchers are brought into doubt. Because the testing procedure cannot be fully verified, the researchers have ultimately invalidated their own conclusions.
3 Conclusions The limitations of sensor systems in current autonomous vehicles is often caused by technical shortcomings – this includes software limitations and a lack of gathered environmental information. Jeon, et al. (2016), Meifang (2018) and Fairas, et al. (2018) all concluded that their works could’ve resulted in better results had they had the technology to do so. As a result, it is common to instead use more sensors (or at least a wider variation of sensors) to try and compensate for these downfalls, as was also suggested by Girrbach, et al. (2017). The applications of autonomous vehicles can vary from emergency to commercial, to construction and transport. The research carried out by Rodriguez, et al. (2018) and Jeon, et al. (2016) both have elements that could be applied to public transport systems, even though this was not an area of focus. Both papers looked at allowing a driverless vehicle to follow a pre-determined route - in theory, it would be possible to apply this to public transport routes to allow autonomous public transport systems. Furthermore, freight companies could also apply the routing to send cargo without the need to hire employees.
Wuthishuwong, et al. (2015) proposed research which allows vehicles to communicate with each other to enable trajectory planning at intersections. By sending sensor data to other cars, it is theoretically possible to have hundreds of cars working in tandem to create the most efficient traffic system possible. Furthermore, Al-Mashhadani, et al. (2015) attempted to use a vehicle dashboard traffic light system to improve traffic flow – applying both of these concepts creates an exciting prospect of a perfect traffic system. To finalise, these exciting prospects cannot be achieved unless sensors are perfected; and to perfect sensors we must understand their limitations so that they can be improved. Perhaps the most critical aspect is the safety of pedestrians. Lenard, et al. (2018) conducted a study on collision analysis between pedestrians and cyclists on the road. Their results showed that cyclists are detected 90% of the time by sensors when they are 42 meters in front of the vehicle. For pedestrians, the 90% detection rate extended to 50 meters. If data like this can be used in studies like those conducted by Morales, et al. (2017) in fast object detection, it would be possible to dramatically increase the safety of those around the autonomous vehicle. Future models could also use advanced AI (Artificial Intelligence) techniques such as Deep Neural Networks (DNN), as demonstrated by Naghavi & Pourreza (2018). Though relatively new in the computing world, their results indicate that further research into DNN applications for autonomous vehicles could yield more accurate, and thus safer, vehicles.
References Al-Mashhadani, M., Shu, W. & Min-You, W., 2015. Enhancing Traffic Flow by Using Vehicle Dashboard Traffic Lights. Boston, MA, USA, IEEE. Diaz-Cabrera, M., Cerri, P. & Medici, P., 2015. Robust Real-Time Traffic Light Detection and Distance Estimation Using a Single Camera. Expert Systems with Applications, 42(8), pp. 3911-3923. Farias, G. et al., 2018. A Neural Network Approach for Building An Obstacle Detection Model by Fusion of Proximity Sensors Data. Sensors, 18(3). Girrbach, F., D. Hol, J., Giovanni, B. & Diehl, M., 2017. Optimization-Based Sensor Fusion of GNSS and IMU Using a Moving Horizon Approach. Sensors, 17(5), p. 1159.

54
Jeon, D., Choi, H. & Kim, J., 2016. UKF Data Fusion of Odometry and Magnetic Sensor for a Precise Indoor Localization System of an Autonomous Vehicle. XI'an, IEEE. Lenard, J., Welsh, R. & Danton, R., 2018. Time-to-collision analysis of pedestrian and pedal-cycle accidents for the development of autonomous emergency braking systems. Accident Analysis & Prevention, Volume 115, pp. 128-136. Machiraju, H. & Channappayya, S. S., 2018. An Evaluation Metric for Object Detection Algorithms in Autonomous Navigation Systems and its Application to a Real-Time Alerting System. Athens, Greece, IEEE. Meifang, H., 2018. Application of Artificial Intelligence Detection System Based on Multi-sensor Data Fusion. iJOE, 14(6), pp. 31-43. Morales, N., Toledo, J., Acosta, L. & Sanchez-Medina, J., 2017. A Combined Voxel and Particle Filter-Based Approach for Fast Obstacle Detection and Tracking in Automotive Applications. IEEE
Transactions on Intelligent Transportation Systems, 18(7), pp. 1824-1834. Naghavi, S. H. & Pourreza, H., 2018. Real-Time Object Detection and Classification for Autonomous Driving. Mashhad, Iran, IEEE. Rodriguez, A., Heredia, G. & Ollero, A., 2016. High-Speed Autonomous Navigation System for Heavy Vehicles. Applied Soft Computing, Volume 43, pp. 572-582. Wuthishuwong, C., Traechtler, A. & Bruns, T., 2015. Safe trajectory planning for autonomous intersection management by using vehicle to infrastructure communication. EURASIP Journal on Wireless Communications and Networking, December. Yang, B., Zheng, R., Shimono, K., Kaizuka, T., Nakano, K., 2017. Evaluation of the effects of in-vehicle traffic lights on driving performances for unsignalised intersections. IET Intelligent Transport Systems, 09 March, 11(2), pp. 76-83.

55
Critical Evaluation of e-learning and ICT Methodologies used to help those with Learning Difficulties
Darren Tinmouth
Abstract
Learning difficulties are fast becoming more aware in the eyes of society thanks to more studies on people who live with difficulties such as memory loss, Asperger’s syndrome, Alzheimer’s / Dementia etc. What this review paper does is study existing literature on the subject of E-Learning and ICT methodologies and their use to assist people who live with learning disabilities/difficulties. The literature that has been perused covers different demographics ranging from pre-school education to the elderly to ascertain if there is enough being done in the world of computer based learning to cater for as many (if not all) of these focus groups as possible or if not, then suggest if more research into this is needed to further improve matters. Areas looked at ranged from learning difficulties to memory deficiencies.
1 Introduction E-Learning (Electronic Learning) “has seen increased usage as it has been helpful for lecturers to improve the quality of the learning process.” (Ninik. S & Rukimininsih, 2018). In recent years, it’s become a very useful tool in the training of staff in the workplace. Through E-Learning portals, these courses and tests can be done from home through a PC or even with a smart device. This is very beneficial in today’s world where from a young age, “studies have shown that students/people with learning disabilities are confident enough in their computer skills that teachers may freely use modern teaching methods with them.” (Bagon, S & Vodopivec, J.L, 2016). It’s increasing use however has led researchers to investigate it’s adaptability elsewhere, like for instance there are studies focused on E-Learning’s use when used to cater for those of older age where “tests focused on intrinsic motivation, metacognition, self-regulated learning and learning strategies” (De Palo et.al. 2018). “How E-Learning can improve the attributional style of students with Special Educational Needs” (Berizzi. et.al. 2018) & “the use of synchronous E-Learning systems amongst students” (Kang & Shin, 2015). Also studies have even gone as far as “developing an explanatory model for the ICT competencies of students/people with or without learning disabilities” (Ting-Fang. et.al. 2018). It is
this demographic that is of interest in this research paper. What this research paper will do is focus on studies that have been carried out on E-Learning and ICT competency and specifically it’s use on people who live with learning difficulties and ways that the research done can suggest future positive adaptability for that demographic. This paper will evaluate tests carried out in the research papers that have been studied and conclusions gained from that research. Not only this but also determine whether the research carried out can be considered “good science” and whether it can be considered useful in the hope of finding a viable E-Learning solution for the user demographics discussed. It’s hoped that this will help lead to a better understanding of how to better incorporate e-learning for people with learning disabilities and at the end, decide whether further research in the field is required to improve upon this.
2 Systems Helping Those Working with Learning Disabilities
Chuchuca-Mendez, F. et.al (2016) proposed a system developed to support decision making for patients based on a Case Profile Ontology with the goal helping support the training of future Speech Language Therapists. Also, another example

56
where another line of research proposed to use an ontology called BLOOMS in their system. The research uses the knowledge gained from the related work to propose a structure focusing on a number of modules grouped into three layers, this is detailed in the diagram in Figure 1.
Figure 1: General Architecture of the pro-posed approach (Chuchuca-Mendez, F. et.al. 2016) To assist the development of this E-Learning system, Chuchuca-Mendez, F. et.al. (2016) went about tailoring the E-Learning system to the needs of the patients in question with learning and communication disorders. They analysed 154 patients aligned to 3 institutions in Ecuador along with 98 individual therapy plans. These disorders covered a wide spectrum and identified those with major prevalence in the country. These include Downs Syndrome, Infantile cerebal palsy, Autism Spectrum Disorder and communication disorders like language retardation, dyslalia & dysarthria. The results of these studies are shown in Table 1.
Table 1: “The different elements of infor-mation used to populate the proposed ontol-ogy” (Chuchuca-Mendez, F. et.al. 2016) Note that some patients may possess more than one of these conditions
The conclusions drawn in this paper propose future work to improve the proposed system with plans to implement new ideas in the E-Learning system centered on specific learning and communication difficulties & to design and develop a complementary ontology with the goal of implementing communication aid compatibility and adaptations for use in sensory rooms during therapeutic intervention processes. This suggests that in order for the proposed system to be improved upon, more research is required on the subject. The overall proposal for this new system brings about some interesting suggestions which would aid any future development like use of an already existing virtual environment (MOODLE) as a baseline. This system would be beneficial for developers both from a development timescale standpoint and also cost. However, this investigative research carried out doesn’t go into any detail into how the data in question was obtained and analysed lawfully. There is no indication the information was obtained with or without the consent of the person or guardians in question and whether it meets any data protection laws. This may be to do with the country in question (Ecuador) and the possibility of its laws being more lenient than in other countries like for example the guidelines set out in the UK’s Data Protection Act 1998. The research itself could also be benefitted more by expanding the focus group beyond the 3 institutions used as this would help improve the scope of the research being carried out and would help give more weight to the final conclusions.
3 Considering Learning Difficulties Amongst the Elderly
However, this is research to benefit the lecturer side of the problem, what about from some of focus groups that these E-Learning programs are meant to benefit? Another line of research by De Palo, V. et. al. (2018) focuses more on the efficiency of E-Learning in older adults, due to the rapidly ageing population’s increased exposure to modern technology. The study focuses on how computer usage in general can benefit in factors like social interaction, self-esteem and cognitive capacity and

57
making a link quoting research which was later compiled by Wilson, J.P. (2012) suggesting that older people are more internally motivated than young adults. From this, the paper proceeded to focus on cognitive styles and investigate how to link it to an E-Learning program and to cater it for older adults. For data analysis, 94 test cases (50 females & 44 males & an average age of around 65) were asked to participate in an experimental procedure that comprised of three steps
• A Questionnaire (e-learning and pencil/paper based)
• Presentation of prototype E-Learning units
• Examination of results/learning outcomes
The tasks were based around a model known as AMOS Cognitive Style Questionnaire these involved activities such as observing a figure for 30 seconds, reproducing that figure from memory and answering 9 questions on that which would determine their approach preference whether it be analytical or global. The results would be measured through a measure called Cronbach’s Alpha. Through these results, the conclusion was that there were differences in gender. Using the Cronbach’s Alpha method, Females scored higher in Metacognition than Males (26.32 to 25.63) while males scored higher in Learning Strategies (24.28 to 23.12). There were also relationships identified between four different factors of learning amongst the elderly detailed in Figure 2 which further conclude that lifelong learning can help prolong the wellbeing of an elderly person no matter what their mental state.
Figure 2: “Path diagram of the relationships between intrinsic motivation, metacognition and self-regulated learning, learning strate-gies, & learning outcomes with standardised parameter estimates“ (De Palo, V. et.al. 2018)
The findings are corroborated in research by Rodriguez-Ch. P, et.al. (2017) where that expands beyond the research here in proposing Massive Open Online Courses (MOOC’s) for the elderly. Putting the research into context by claiming “by the year 2060, the elderly population will double its current size in comparison to the results presented in the previous census.” (Rodriguez-Ch, P. et. al. 2017). So it is important for learning programs to cater in future for this demographic. The overall study is very thorough, going through analysis carried out on theselected subjects in large detail. Yes, many of the research papers De Palo, V et.al (2018) focus on are old papers (some go as far back as 1984) but these are used to fall back on previous research to corroborate their findings. The large number of test cases involved in the experimental procedure coupled with the use of the Chronbach’s Alpha method to record the test results helps give the results of the investigation to give a detailed conclusion to the research carried out.
4 ICT Competency Amongst the Youth
Another demographic to consider when looking at E-Learning for those with learning difficulties is schoolchildren and college/university students. Research by Ting-Fang. W, et.al. (2018) looks into this field by carrying out a comparative study between ICT users who have Learning Difficulties and those who don’t in order to monitor performance as to how different focus groups react to exposure to information technology. The study focuses on ICT access and availability of systems to the focused demographic, access being defined in their view as “the actual availability of and access to ICT devices.” (Ting-Fang. W, et.al. 2018) with the goal of testing a conceptual model which comprised of five constructs to ascertain the benefits of using this model for future research in learning difficulty technology use, these constructs were,
• Attitude towards using ICT • ICT Competency • Demographic characteristics • ICT access • Purpose for using ICT

58
For this investigation, the paper set about gathering data from groups of students from two age groups using the conceptual model, firstly 234 students of elementary/primary school age and 204 students of high school/secondary school age in the country of Taiwan. In both cases, there was an exact even spread of those with and without learning disabilities, the breakdown of which is in Table 2 showing genders and age brackets.
Table 2: Students with and without Learning Disabilities and gender breakdowns (Ting-Fang. W, et.al. 2018) For this procedure, care was taken to cover the eventuality of learning difficulty students not being able to participate without help due to deficiencies with reading for which questions were read out loud to cover their difficulty in this. Also the results were gathered in elementary and high school age groups. These were represented in a table using the statistical method called Pearson Product-Moment correlation measuring student responses using both an initial model and the proposed revised model.
Table 3: Standardized path coefficients of ini-tial and revised ICT competence models (Ting-Fang. W, et.al. 2018) In conclusion, the results gathered determined that the competency measurement model used in this investigative study showed that ICT for learning is an important issue and that the attitude towards computer technology amongst students both with
and without learning difficulties is positive. Results also showed that use of ICT for social and leisure reasons was more prevalent than use for educational purposes. However results also showed that not just learning difficulties but disability in general has a negative effect on ICT competency compared to those who do not suffer from such. Overall the research carried out is very thorough analysing over 400 students from 2 different age groups across 6 grades. And the results gathered from the 438 subject’s monitored show the conceptual model used to carry out the investigative study works well in gathering an accurate viewpoint of their experience with computer technology. The study doesn’t go into detail about how to cater E-Learning for people with learning difficulties as such but the investigations carried out can be beneficial to assist potential developers of future E-Learning programs to understand use of computer technology (desktop and mobile) by those subjects that have learning difficulties, and from that, suitable E-Learning programs can be proposed and developed as suggested in research by Dai Fei. Y, et.al. (2013) which proposes a solution using online experiences in VET pathway students at university that had learning difficulties. Better results though could have been gathered from a larger group of the same demographic from countries where exposure to information technology is more prevalent along with the studies carried out here. This way, a bigger, and more diverse set of results can be obtained and just like in the previously discussed research by Chuchuca-Mendez, F. et al (2016), the results would be able to have carried more validity.
5 Experiences Amongst Pre-School One other factor to look at is the use of ICT and E-Learning technology amongst children of pre-school age. Diagnoses of learning difficulties are getting ever younger allowing for them to receive the appropriate help earlier. Research by Drigas. A, et al (2015) focused on this demographic through reviewing other research papers in order to ascertain their experiences with such technology, specifically pre-school children who have had early diagnoses of learning and

59
memory difficulties. Focusing largely on the following
• Memory Deficit Diagnostic Tools • Supporting Memory Skills (Literacy &
Numeracy) • Role of ICT in coping with these
problems The goal, to present the role ICT and e-learning can make in dealing with these problems in pre-school education. To start, the paper talks about tools to deal with the early identification of children who may have a memory deficits. Methods are suggested such as Automated Working Memory Assessments, Mental Attributes Profiling Systems and Cognitive Profiling Systems to aid with this. There is focus on a problem brought up by developers that teaching young children can be more difficult than say an older person or the elderly for that matter, a problem further amplified if that child has a learning difficulty due to their attention span as a young child is more easily distracted than say an adult. Especially prevalent when teaching a child in literacy and numeracy skills. This paper talks about the role of ICT and E-Learning to not only suggest using technology to help aid a pre-school child’s learning experience but also keep them motivated and focused on the tasks in hand. Overall, the arguments looked at and reviewed upon have extensive focus on research carried out in pre-school programs across many countries and though despite the body of papers studied being between the years 2003 and 2013 (which could suggest some outdated methodologies being suggested), valid arguments have been made that can be looked and researched upon more in the future to help gain a more involved understanding about learning difficulties at pre-school age with more up to date methods. More research is also suggested in the paper as not a lot of studies centered on memory & inhibition in pre-school children exist despite positive results being reported in an assessment using computerized training.
6 Discussion Looking back at the main bodies of research read it’s clear that an area that can benefit from further research which was not hugely touched upon was the personalisation of systems to meet the needs of individuals as learning difficulties can come in many different forms. It can be seen as lazy by some if software or hardware platforms were built with “one size fits all” attitudes which would feel like excluding those with learning difficulties from participating. Especially as “past studies have focused more on undergraduate or postgraduate students and ICT or on children with more complex special educational needs (Bagon. S & Vodopivec, J.L. 2016). Tacking on features to benefit them may seem like an afterthought if the system was not designed with them in mind so it would be important for any future software or hardware system for someone with a learning difficulty or a memory deficiency is designed for them from the outset.
7 Conclusions In this Literature review, we have looked at the use of E-Learning and ICT methodologies from 4 standpoints, all of which would help in one way or another go some way to helping those with learning difficulties use ICT and assist in the world of e-learning, papers covering three different standpoints were studied with other papers used to support statements, these standpoints included lecturers that worked with learning disabilities as well as users from different age groups ranging from pre-school to the elderly. Each demographic looked at the use of E-Learning and ICT from different viewpoints taking into account intrinsic situations, results of surveys carried out and the potential benefits this could bring to them. The conclusion we can draw up is that although the articles studied hold significant weight and make some very valid arguments and proposals, its recommended that more research needs to be carried out in order to gain more of an understanding as to how we as humans can potentially deliver better solutions in order for those people who are disadvantaged mentally to integrate with technology from experience and educational standpoints. This is due to the fact that

60
the research carried out (although thorough) would be benefitted with more participation on a wider scale from which more reliable and accurate results could be acquired.
References Bagon, S & Vodopivec, J. L., 2016, ‘Motivation for using ICT and Pupils with learning difficul-ties’. International Journal of Emerging Technol-ogies in Learning. 2016, Vol 11, Issue 10, p70-75. 6p. Berizzi. G, Di Barbora. E & Vulcani. M., 2017, ‘Metacognition in the e-learning environment: A successful proposition for inclusive education’, Journal of E-Learning & Knowledge Society – 2017, Vol 13, Issue 3, p47-57, 11pp Chuchuca-Mendez. F, Robles-Bykbaev. V, Vanegas-Peralta. P, Lucero-Saldana. J, Lopez-Nores. M & Pzos-Arias, J., 2016, ‘An educative environment based on ontologies and E-Learning for training on design of speech-language therapy plans for children with disabilities and communi-cation disorders.’ IEEE Congreso Argentino de Ciencias de la Informatica y Desarrollos de Inves-tigacion (CACIDI), IEEE Congreso Argentino de. :1-6 Nov, 2016. Dai Fei. Y, Catterall. J, & Davis. J, 2013, ‘Sup-porting new students from vocational education and training: Finding a reusable solution to ad-dress recurring learning difficulties in E-Learning’ Australasian Journal of Educational Technology. 2013 Vol 29, Issue 5, p640-650. 11p. De Palo. V, Limone. P, Moncais. L, Cegile. F & Sinatra, M., 2018, ‘Enhancing E-Learning in old
age’, Australian Journal of Adult Learning – v58 n1 p88-109 Apr 2018. 22pp. Drigas. A, Kokkalia. G & Lytras. Miltiadis B, 2015, ‘ICT and collaborative co-learning in pre-school children who face memory difficulties’, Computers in Human Behavior October 2015 Vol51 Part B 645-651. Kang. M & Shin. W.S., 2015, ‘An emphirical in-vestigation of student acceptance of synchronious E-Learning in an online university’, Journal of Ed-ucational Computing Research – Jul 2015 Vol 52, Issue 4, p475-495, 21pp. Ninik. S & Rukminingsih, 2018, ‘Evaluating E-Learning as a learning media: A case of entrepre-neurship E-Learning using schoology as media’, International Journal of Emerging Technologies in Learning. 2018, Vol 13 Issue 9. p269-279. 11p. Rodriguez-Ch. P, Cedillo, P. Beltran, P & Ortiz, J., 2017,’MOOCEP: A method for building mas-sive open online courses for elderly people, the analysis activity.’, IEEE Frontiers in Education Conference (FIE): 1-8 Oct, 2017 Ting-Fang. W, Cheng-Ming. C, Hui-Shan. L, Yao-Ming. Y & Ming-Chung, C., 2018, ‘Factors re-lated to ICT competencies for students with learn-ing disabilities’, Journal of Educational Technol-ogy & Society – Oct 2018, Vol 21, Issue 4, p76-88. 13pp. Wilson, J.P., 2012, ‘The adult learner: The defini-tive classic in adult education and human resource development.’, Industrial & Commercial Train-ing, Vol. 44, Issue 7, pp438-439.

61
Analysis of Current Virtual Reality Methods to Enhance Learning in Education
Adam Wilson
Abstract
Virtual Reality is integrating itself into education with the benefits of being an interactive technology that can redefine the way and the what users (Students and Teachers) can see, learn and interact with. This paper critically evaluates current research into Virtual reality as a medium for education to aid teaching using both mobile based and desktop-based headsets as learning devices and evaluates their uses and testing methodologies to understand how their methods can be used in other areas of education. Methods used by other researchers will be compared against one another to provide conclusions and recommendations based upon the evaluation of their methods. The paper will conclude with recommendations of where the technology could impact an area of education for implementing the technology and gaps of knowledge in the field.
1 Introduction Teaching methods haven’t drastically changed over the last few years and with the different learning styles that students can have it’s important to find the best methods for their learning. Virtual Reality learning would as stated by Minocha et. al. (2018) “foster creativity and inquiry” this would provide students a method that would inspire them to think creatively as well as let them get used to future technologies. Virtual reality is perceived as a gaming system by many however these games can be educational as research by Jin, G et.al (2018) showed with an educational game designed to teach high school students cyber security using virtual reality the results were highly positive based off result surveys. Problems can occur when introducing Virtual Reality as not all students will be able to participate within Virtual Reality lessons due to potential health risks such as Seizures for epileptics or eye pains for those with bad eye sight, A large area of space is also required for some methods of Virtual Reality such as the HTC Vive and Oculus Rift. In order for effective use Vesisenaho and Juntunen et.al (2019)believe that “To promote active learning in VR, students should have the ability to interact with relevant content (e.g., seek information, ask questions).”
There are different applications of virtual reality that can be applied to education such as a mobile based approach which some focus on using with applications like Google Expeditions to show students areas of the world. Researcher Pulijaala (2018) researches into Virtual Reality on the training of professionals such as surgeons by using an oculus rift environment to conclude if the Virtual Reality is effective for the learners, concluding that the self-confidence of performing surgeries for the control group were higher. Other methods have designed fully interactive scenarios that the learners will go through in order to learn such as Zhang et.al. (2017) that devised a new method to change fire safety education which “the experiment results prove the feasibility and effectiveness of the proposed approach”. The Virtual Reality Headsets described are computer based however there are also mobile based Virtual reality systems that are cheaper than the computer based headsets however they do require students to own a mobile device. This Research paper will analyse experiments that have been conducted on Virtual Reality in Education with the aim of comparing different researchers’ methods through Mobile based and desktop based
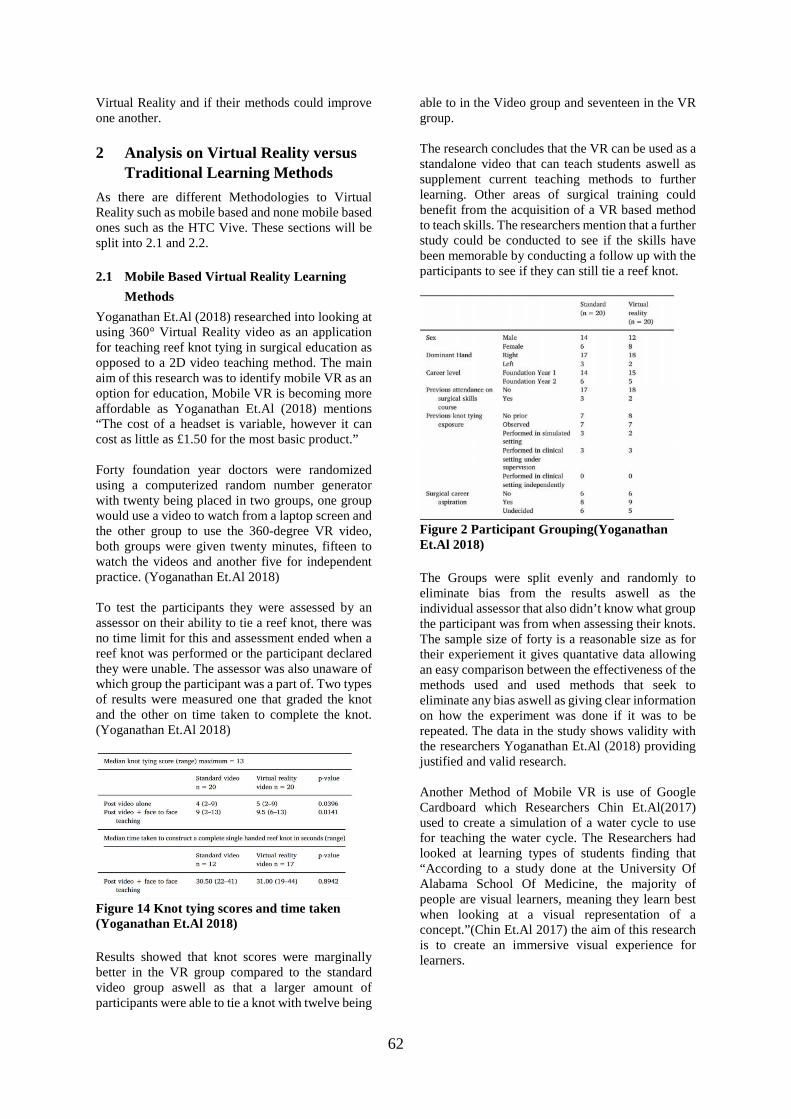
62
Virtual Reality and if their methods could improve one another.
2 Analysis on Virtual Reality versus Traditional Learning Methods
As there are different Methodologies to Virtual Reality such as mobile based and none mobile based ones such as the HTC Vive. These sections will be split into 2.1 and 2.2.
2.1 Mobile Based Virtual Reality Learning Methods
Yoganathan Et.Al (2018) researched into looking at using 360° Virtual Reality video as an application for teaching reef knot tying in surgical education as opposed to a 2D video teaching method. The main aim of this research was to identify mobile VR as an option for education, Mobile VR is becoming more affordable as Yoganathan Et.Al (2018) mentions “The cost of a headset is variable, however it can cost as little as £1.50 for the most basic product.” Forty foundation year doctors were randomized using a computerized random number generator with twenty being placed in two groups, one group would use a video to watch from a laptop screen and the other group to use the 360-degree VR video, both groups were given twenty minutes, fifteen to watch the videos and another five for independent practice. (Yoganathan Et.Al 2018) To test the participants they were assessed by an assessor on their ability to tie a reef knot, there was no time limit for this and assessment ended when a reef knot was performed or the participant declared they were unable. The assessor was also unaware of which group the participant was a part of. Two types of results were measured one that graded the knot and the other on time taken to complete the knot. (Yoganathan Et.Al 2018)
Figure 14 Knot tying scores and time taken (Yoganathan Et.Al 2018) Results showed that knot scores were marginally better in the VR group compared to the standard video group aswell as that a larger amount of participants were able to tie a knot with twelve being
able to in the Video group and seventeen in the VR group. The research concludes that the VR can be used as a standalone video that can teach students aswell as supplement current teaching methods to further learning. Other areas of surgical training could benefit from the acquisition of a VR based method to teach skills. The researchers mention that a further study could be conducted to see if the skills have been memorable by conducting a follow up with the participants to see if they can still tie a reef knot.
Figure 2 Participant Grouping(Yoganathan Et.Al 2018) The Groups were split evenly and randomly to eliminate bias from the results aswell as the individual assessor that also didn’t know what group the participant was from when assessing their knots. The sample size of forty is a reasonable size as for their experiement it gives quantative data allowing an easy comparison between the effectiveness of the methods used and used methods that seek to eliminate any bias aswell as giving clear information on how the experiment was done if it was to be repeated. The data in the study shows validity with the researchers Yoganathan Et.Al (2018) providing justified and valid research. Another Method of Mobile VR is use of Google Cardboard which Researchers Chin Et.Al(2017) used to create a simulation of a water cycle to use for teaching the water cycle. The Researchers had looked at learning types of students finding that “According to a study done at the University Of Alabama School Of Medicine, the majority of people are visual learners, meaning they learn best when looking at a visual representation of a concept.”(Chin Et.Al 2017) the aim of this research is to create an immersive visual experience for learners.

63
Figure 3 Learner Types (Chin Et.Al 2017) For this research the researchers programmed what they called SplashSim in unity designed to work for the Google cardboard which is an inexpensive approach for Virtual Reality.
Figure 4 SplashSim (Chin Et.Al 2017) This research goes into depth on the process of creating the software however it doesn’t mention how it was tested or if tests were done, ideas of how the technology can be taken forward mentions using it to show lab experiments but with a lack of evidence showing any improvement on student learning further research would need to be done. There is no methodology on how the experiments were done therefore these conclusions are not justified. Lucas (2018) researched a method of using a headset based VR in Construction education similar to Chin Et.Al(2017) they created a simulation of a house mid development this was to allow students to see a house during development which can be beneficial for their studies. Before the experiments participants were surveyed for experience on Virtual Reality as well as a survey quizzing them on understanding of wood frame construction, After completing the first survey, participants received a description of how to navigate through the environment and what to expect while in the environment. A total of approximately 110 students were enrolled in the three classes (some students in more than one of the classes). Those who were highly prone to
motion sickness or had any issues with cyber-sickness during any prior VR-type experience were asked to not participate. Otherwise, there was no criteria besides being a student in the program to take part in the study. They then took 5-8 minutes to explore the environment. Participants were also quizzed after to ask about the simulations influence on their understanding now. Usability was also surveyed. (Lucas 2018) The research concluded that user navigation and wayfinding was easy for the participants with controller based navigation being a familiar concept to the participants. The researcher wanted to figure out how this method compared with traditional education materials which they showed the participants in the first survey and gather data from. The research concluded that the participants had a 64% improved understanding with Virtual Reality. This research used 110 participants during its experiments which is a good size it gathered good qualitative data by using surveys, However the research does its experiments in a order which affects the results by first showing the participants traditional learning methods of wood frame construction and asking their understanding and then making them use the Virtual Reality simulation as they will get an improved understanding simply because they’re getting a second time learning about wood frame construction therefore the results are biased making them invalid.
2.2 Computer based Virtual Reality Learning Methods
Bogusevschi Et. Al. (2018) took to computer based Virtual reality to provide primary school children with an immersive experience in a nature application. For this research they used 58 primary school children and split them into two groups a control group and an experimental group.
Figure 5 Grouping Activities (Bogusevschi Et.Al 2017)
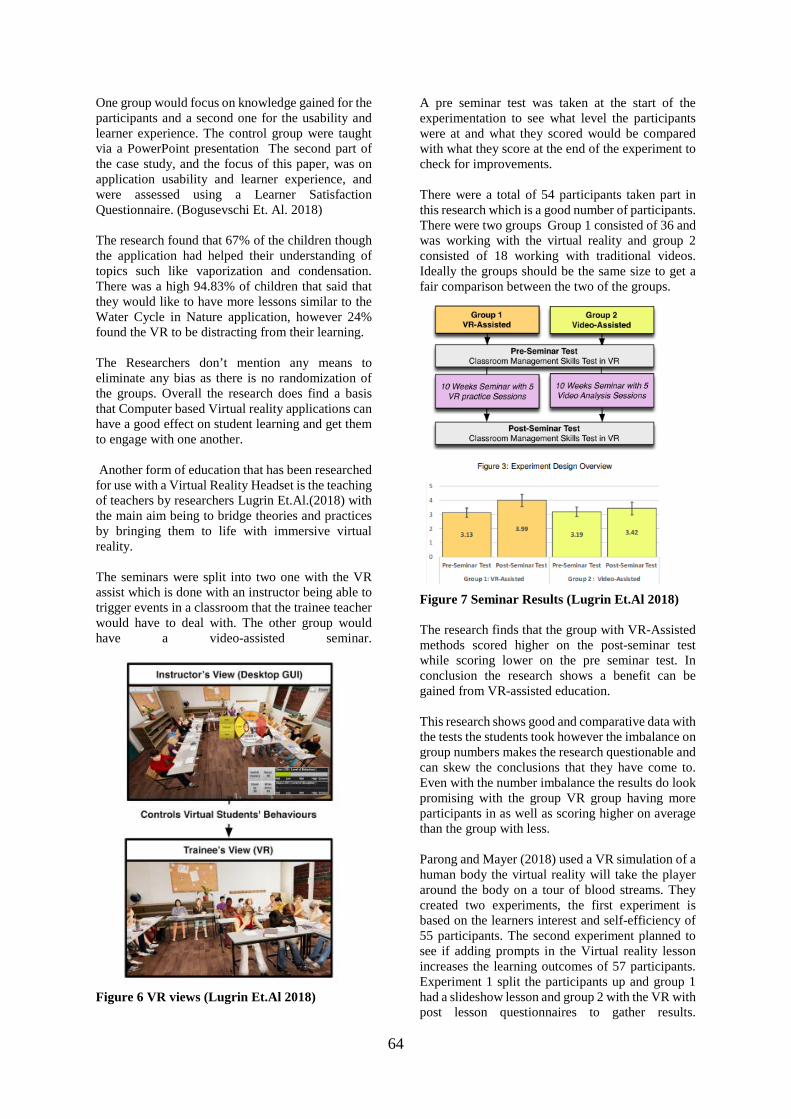
64
One group would focus on knowledge gained for the participants and a second one for the usability and learner experience. The control group were taught via a PowerPoint presentation The second part of the case study, and the focus of this paper, was on application usability and learner experience, and were assessed using a Learner Satisfaction Questionnaire. (Bogusevschi Et. Al. 2018) The research found that 67% of the children though the application had helped their understanding of topics such like vaporization and condensation. There was a high 94.83% of children that said that they would like to have more lessons similar to the Water Cycle in Nature application, however 24% found the VR to be distracting from their learning. The Researchers don’t mention any means to eliminate any bias as there is no randomization of the groups. Overall the research does find a basis that Computer based Virtual reality applications can have a good effect on student learning and get them to engage with one another. Another form of education that has been researched for use with a Virtual Reality Headset is the teaching of teachers by researchers Lugrin Et.Al.(2018) with the main aim being to bridge theories and practices by bringing them to life with immersive virtual reality. The seminars were split into two one with the VR assist which is done with an instructor being able to trigger events in a classroom that the trainee teacher would have to deal with. The other group would have a video-assisted seminar.
Figure 6 VR views (Lugrin Et.Al 2018)
A pre seminar test was taken at the start of the experimentation to see what level the participants were at and what they scored would be compared with what they score at the end of the experiment to check for improvements. There were a total of 54 participants taken part in this research which is a good number of participants. There were two groups Group 1 consisted of 36 and was working with the virtual reality and group 2 consisted of 18 working with traditional videos. Ideally the groups should be the same size to get a fair comparison between the two of the groups.
Figure 7 Seminar Results (Lugrin Et.Al 2018) The research finds that the group with VR-Assisted methods scored higher on the post-seminar test while scoring lower on the pre seminar test. In conclusion the research shows a benefit can be gained from VR-assisted education. This research shows good and comparative data with the tests the students took however the imbalance on group numbers makes the research questionable and can skew the conclusions that they have come to. Even with the number imbalance the results do look promising with the group VR group having more participants in as well as scoring higher on average than the group with less. Parong and Mayer (2018) used a VR simulation of a human body the virtual reality will take the player around the body on a tour of blood streams. They created two experiments, the first experiment is based on the learners interest and self-efficiency of 55 participants. The second experiment planned to see if adding prompts in the Virtual reality lesson increases the learning outcomes of 57 participants. Experiment 1 split the participants up and group 1 had a slideshow lesson and group 2 with the VR with post lesson questionnaires to gather results.
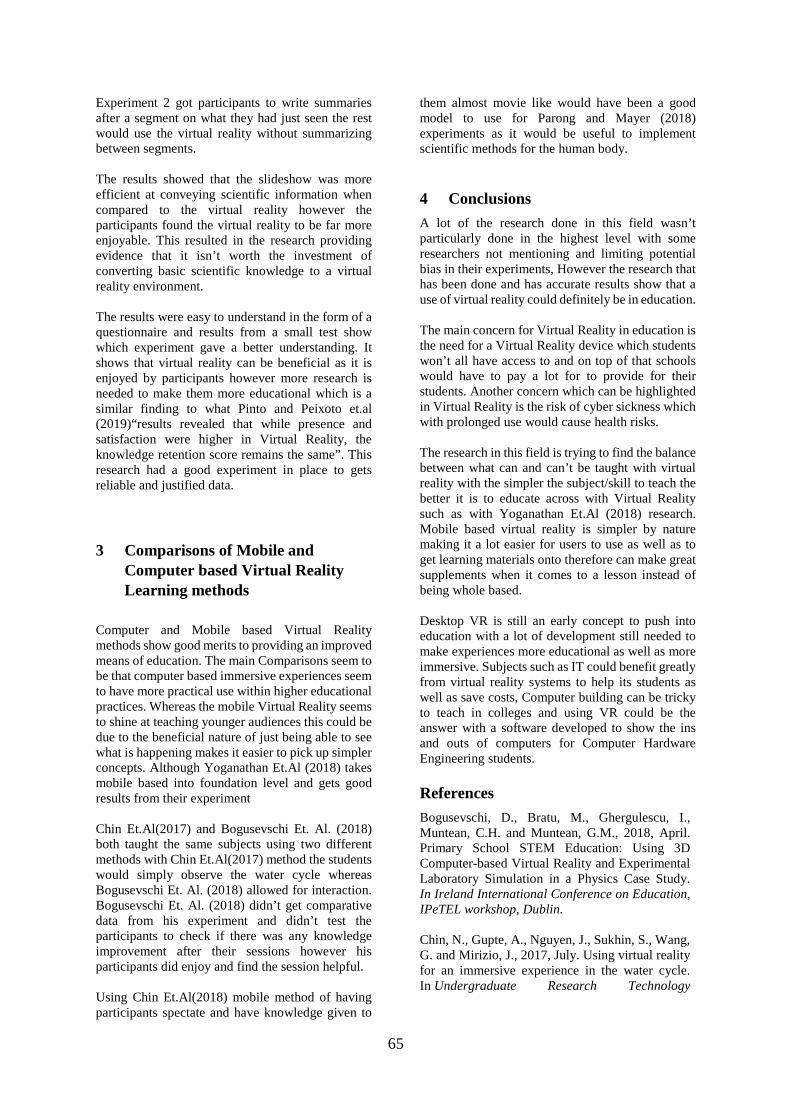
65
Experiment 2 got participants to write summaries after a segment on what they had just seen the rest would use the virtual reality without summarizing between segments. The results showed that the slideshow was more efficient at conveying scientific information when compared to the virtual reality however the participants found the virtual reality to be far more enjoyable. This resulted in the research providing evidence that it isn’t worth the investment of converting basic scientific knowledge to a virtual reality environment. The results were easy to understand in the form of a questionnaire and results from a small test show which experiment gave a better understanding. It shows that virtual reality can be beneficial as it is enjoyed by participants however more research is needed to make them more educational which is a similar finding to what Pinto and Peixoto et.al (2019)“results revealed that while presence and satisfaction were higher in Virtual Reality, the knowledge retention score remains the same”. This research had a good experiment in place to gets reliable and justified data.
3 Comparisons of Mobile and Computer based Virtual Reality Learning methods
Computer and Mobile based Virtual Reality methods show good merits to providing an improved means of education. The main Comparisons seem to be that computer based immersive experiences seem to have more practical use within higher educational practices. Whereas the mobile Virtual Reality seems to shine at teaching younger audiences this could be due to the beneficial nature of just being able to see what is happening makes it easier to pick up simpler concepts. Although Yoganathan Et.Al (2018) takes mobile based into foundation level and gets good results from their experiment Chin Et.Al(2017) and Bogusevschi Et. Al. (2018) both taught the same subjects using two different methods with Chin Et.Al(2017) method the students would simply observe the water cycle whereas Bogusevschi Et. Al. (2018) allowed for interaction. Bogusevschi Et. Al. (2018) didn’t get comparative data from his experiment and didn’t test the participants to check if there was any knowledge improvement after their sessions however his participants did enjoy and find the session helpful. Using Chin Et.Al(2018) mobile method of having participants spectate and have knowledge given to
them almost movie like would have been a good model to use for Parong and Mayer (2018) experiments as it would be useful to implement scientific methods for the human body.
4 Conclusions A lot of the research done in this field wasn’t particularly done in the highest level with some researchers not mentioning and limiting potential bias in their experiments, However the research that has been done and has accurate results show that a use of virtual reality could definitely be in education. The main concern for Virtual Reality in education is the need for a Virtual Reality device which students won’t all have access to and on top of that schools would have to pay a lot for to provide for their students. Another concern which can be highlighted in Virtual Reality is the risk of cyber sickness which with prolonged use would cause health risks. The research in this field is trying to find the balance between what can and can’t be taught with virtual reality with the simpler the subject/skill to teach the better it is to educate across with Virtual Reality such as with Yoganathan Et.Al (2018) research. Mobile based virtual reality is simpler by nature making it a lot easier for users to use as well as to get learning materials onto therefore can make great supplements when it comes to a lesson instead of being whole based. Desktop VR is still an early concept to push into education with a lot of development still needed to make experiences more educational as well as more immersive. Subjects such as IT could benefit greatly from virtual reality systems to help its students as well as save costs, Computer building can be tricky to teach in colleges and using VR could be the answer with a software developed to show the ins and outs of computers for Computer Hardware Engineering students.
References Bogusevschi, D., Bratu, M., Ghergulescu, I., Muntean, C.H. and Muntean, G.M., 2018, April. Primary School STEM Education: Using 3D Computer-based Virtual Reality and Experimental Laboratory Simulation in a Physics Case Study. In Ireland International Conference on Education, IPeTEL workshop, Dublin. Chin, N., Gupte, A., Nguyen, J., Sukhin, S., Wang, G. and Mirizio, J., 2017, July. Using virtual reality for an immersive experience in the water cycle. In Undergraduate Research Technology

66
Conference (URTC), 2017 IEEE MIT (pp. 1-4). IEEE. Jin, G., Tu, M., Kim, T.H., Heffron, J. and White, J., 2018, February. Game based Cybersecurity Training for High School Students. In Proceedings of the 49th ACM Technical Symposium on Computer Science Education (pp. 68-73). ACM. Lucas, J. 2018. Immersive VR in the construction classroom to increase student understanding of sequence, assembly, and space of wood frame construction. Journal of Information Technology in Construction (ITcon), Vol. 23, pg. 179-194, Lugrin, J.L., Oberdorfer, S., Latoschik, M.E., Wittmann, A., Seufert, C. and Grafe, S., 2018. VR-Assisted vs Video-Assisted Teacher Training. In Proceedings of the 25th IEEE Virtual Reality (VR) conference. Minocha, Shailey; Tilling, Steve and Tudor, Ana-Despina 2018. Role of Virtual Reality in Geography and Science Fieldwork Education. Knowledge Exchange Seminar Series, Learning from New Technology, 25 Apr 2018, Belfast. Parong, J., & Mayer, R. E. (2018). Learning Science in Immersive Virtual Reality. Journal of Educational Psychology, 110(6), 785-797 Pinto, D., Peixoto, B., Krassmann, A., Melo, M., Cabral, L. and Bessa, M., 2019, April. Virtual Reality in Education: Learning a Foreign Language. In World Conference on Information Systems and Technologies (pp. 589-597). Springer, Cham Pulijala, Y., Ma, M., Pears, M., Peebles, D. and Ayoub, A., 2018. Effectiveness of immersive virtual reality in surgical training—a randomized control trial. Journal of Oral and Maxillofacial Surgery, 76(5), pp.1065-1072. Vesisenaho, M., Juntunen, M., Häkkinen, P., Pöysä-Tarhonen, J., Fagerlund, J., Miakush, I. and Parviainen, T., 2019. Virtual Reality in Education: Focus on the Role of Emotions and Physiological Reactivity. Journal of Virtual Worlds Research, 12(1).
Yoganathan, S., Finch, D.A., Parkin, E. and Pollard, J., 2018. 360° virtual reality video for the acquisition of knot tying skills: A randomised controlled trial. International Journal of Surgery, 54, pp.24-27.

67
An Evaluation of Current Research into Machine Learning Aimed To Improve Weather Prediction
Adam Flatters
Abstract
Within the professional weather prediction field, AI has become an area of developmental interest, the creation of an accurate AI system could increase the speed and reliability of weather prediction significantly higher than traditional models. Within this paper, researchers focused on two primary prediction methods, linear regression and artificial neural networks will have their relevant experiments into weather prediction evaluated and their results compared for their contributions to the field alongside their reliability and validity. Conclusions on the state of the field, such as quality of the currently available research, future research opportunities based on the extension of previous findings, and the gaps in the current methods will also be addressed in the closing statement.
1 Introduction Weather forecasting is regarded as one of the “most scientifically and technologically difficult issues around the world of the last century” (Jain and Mallick 2016) and is also noted that “there is a huge life and property loss due to unexpected Weather conditions” (Jillella et. al. 2015) be it humidity, wind speeds, rainfall or general climate changes, weather is a vital part of society. Many rely on accurate forecasting for daily activities, however, the core methods for predicting changes; utilising various predictive models through the physical representation of planetary atmosphere’s using live samples, coupled with fluid and thermodynamic calculations based on previous knowledge to create a prediction, is being shown as very unstable and inaccurate when perturbations and uncertainties in the live samples are shown. (Holmstrom 2016) Research attempts and their related papers have been published into attempting to locate a suitable alternative, or improvements to the system to increase the accuracy and consistency of weather prediction. For example, Janani (2014) suggests broadening the usage of “Fuzzy logic” which uses a method based on “Degrees of truth” rather than Boolean logic, which could increase the accuracy of predictions by providing
a “chance” of an event happening. While this is utilised in some aspects of forecasting, notably rainfall, it is not the core predictive method. Similarly, Gupta and Singhal (2016) provide another potential method through development of machine learning algorithms, notably through the usage of Linear Regression Techniques, a statistical method of modelling a relationship between a dependent variable (Such as humidity) with an explanatory variable (Such as rainfall). Within the paper, Gupta and Singhal (2016) perform an experiment with these variables and an AI given training data to learn the linear regression of the two. The paper showed great potential in the progress of using an artificial intelligence in weather prediction and encouraged the development of more experiments in the field, including the creation of this survey paper. Throughout the remaining sections of this paper, various experiments within the field of weather predictive AI will have their processes and results evaluated, including methods used, their validity and reliability and any gaps in the research identified, with suggestions for further changes or possible future experiments.

68
2 Current strategies for implementing machine learning in weather prediction
The state of the current research of machine learning based weather prediction was determined from the results of various experiments from several researchers, which is identified below.
2.1 Regression Models Creation of a weather prediction learning algorithm relies heavily on the choice of statistical models that can be reliably used for data mining and correlative statistics. One such model is the regression model, used because it enables the identification of the rate of correlation between multiple variables. Rani et. al. (2015) presented research into the capability of regression models and data mining by implementing a prediction system for rainfall. Citing that “To quickly discover and analyse complex patterns and requirements, we need the efficient techniques” (Rani et. al. 2015). The data sets used were built utilizing three regressive (SOM/SVM/ID3) algorithms, which would then be passed through a Support vector Regression Kernel Agent to make the prediction (Rani et. al. 2015). The first stage of Rani et. al.’s (2015) experiment was the pass of raw weather data, provided by the Indian weather office through the SOM Algorithm. This algorithm was utilised to build the weights of the data map The second stage of Rani et. al.’s (2015) experiment consisted of passing the data through an SVM Algorithm. This was done to initialize the set with its point pairs for future correlative calculations, however, Rani et. al. (2015) notes; “We observe that finding the closest pair of points in kernel space requires n2 kernel computations where n represents the total number of data points” (Rani et. al. 2015) concluding that overuse of this algorithm will be very costly to computational time. The final stage of Rani et. al.’s (2015) experiment consists of the ID3 algorithm and the SVRK, the ID3 algorithm utilises the training data produced by the previous algorithms to
create a decision tree from the cluster. The SVRK then builds tables based on the to assist in the final predictions, the tables that were made in the experiment are below, alongside the final results.
Figure 1: Rani et. al. (2015) Tables. The work concludes with the results of the experiment. “we clearly observe that there is almost 82% accuracy… this proposed approach can outperform traditional systems” (Rani et. al. 2015) Rani Et. Al.’s (2015) report presents significant evidence based on their claims and states their

69
method to allow for reproduction and verification of their claims. However, the researcher failed to consider issues with using a singular set of data when testing the artificial intelligence, due to the large variation of weather variables and their activity across the world, AIs developed for the field must be tested with multiple datasets from across the world to ensure accuracy in all areas. Rani et. al (2015), also presents no comparative data with traditional prediction methods, simply stating that “this proposed approach can outperform traditional systems” (Rani et. al. 2015) but not providing citations or references to research or results of traditional models to verify this claim, leaving it as an open statement with no evidence. Similarly, to Rani et. al. (2015), Zhu et. al. (2018) conducted an experiment using a regression model to predict the air quality of an American city on an hourly basis. The first step of Zhu et. al.’s (2018) experiment was data collection and pre-processing so the data is usable for the upcoming algorithms. Data from two air quality sites between the years of 2006-2015 was used for pollutant data, and data from the Department of Meteorology at the University of Utah was used for the meteorological data. For preprocessing, Zhu et. al. (2018) organized the data by hour but noted null data due to recording errors. To counteract this, Zhu et. al. (2018) replaced the null values with neighboring values. Once the data was collected, Zhu et. al. (2018) created 3 datasets to be tested. The “Baseline” model, which Zhu et. al. (2018) notes “predicts the hourly concentration based on the same hourly historical data of the previous day” (Zhu et al 2018) The second model, the “Heavy” model, utilized all variables and data collected in the previous phase on an hourly basis. The final model, the “Light” model, was noted as being between the baseline and heavy models and considers the 24-hour state of pollutants and meteorological data, rather than hourly. Zhu et. al. (2015) also uses four different regularization techniques within the experiment
that will be used in conjunction with the models. These are; Frobenius norm regularization, `2,1-norm regularization, Nuclear norm regularization and consecutive close regularization. The experiments Zhu et. al. (2018) conducted consisted of running the models with each regularization technique, then using 8 days of training data to teach each algorithm. An intial run with the baseline model and Frobenius norm regularization was conducted to create a set of control data. Below, the different combinations used are shown:
Figure 2: Zhu et. al. (2018) combinations. Below, the location table, and results table of Zhu et. al.’s (2018) experiment is shown.
Table 1: Zhu et. al. (2018) location table.
Table 2: Zhu et. al. (2018) Results table. The paper concluded by noting the best results for each pollutant. They also state their opinions on the results and state of the experiment; “we have developed efficient machine learning methods for air pollutant prediction.” Zhu et. al. (2018)

70
The experiment conducted by Zhu et al (2018) followed accepted rulings to ensure validity and accuracy in the data and allow the experiment to be repeated. However, the research contains an issue with the usage of estimate data in place of null values, introducing innacurate information into the dataset. Zhu et. al (2018) does not make the amount of replaced data known, or make the dataset used available for study, making this issue an unverifiable variable. When compared with the work of Rani et. al. (2015), the work of Zhu et. al. (2018) provides a similar goal with a differing method, both using a linear regressive model to build the weighted datasets, with Zhu et. al. (2018) using 3 differing dataset models and 4 regularization algorithms, and Rani et. al focusing on an ID3 algorithm with a singular dataset. By combining the two and utilizing Zhu et. al.’s (2018) 3 dataset model with the ID3 algorithm developed by Rani et. al. (2015), a more accurate prediction model could be constructed, as this addresses the issue with Rani et. al.’s (2015) experiment’s lack of multiple datasets, while also providing a more consistent algorithm for the multiple dataset test, as when compared by results, Rani at. al’s (2015) algorithm had a better average accuracy. Biradar et al (2017) also performed experimental research into regression algorithms for weather prediction. Their research was conducted to improve accuracy of weather prediction and to “improve essential functions…, such as climate monitoring…, pollution dispersion… and military operations.” (Biradar et. al. 2017) The experiment started with the creation of a system model, including a data flow diagram, this allowed the author to properly plan their proposed system. The DFDs created are shown below.
Figure 3: Biradar et. al. (2017) Level 0 DFD
Figure 4: Biradar et. al. (2017) Level 1 DFD The methodology of Biradar et. al.’s (2017) involved the usage of the Naïve Beyes algorithm. As quoted by Biradar et. al. (2017) “Along with simplicity, Naive Bayes is known to outperform even highly sophisticated classification methods.” The methodology also included the usage of the K-Medoids algorithm, a partitional algorithm used to organize data clusters. The research is concluded by stating their experiments “yields good results and can be considered as an alternative” but provides no evidence of these claims. Biradar et. al’s (2017) conclusions are missing parts of an accurate and valid experiment, including a lack of evidence and methodology description, making the experiment non-repeatable by other researchers, the work also does not identify the reasoning of choosing a linear regression over other known methods.
2.2 Artificial Neural Network A second commonly used method, artificial neural networking, is used in weather prediction experiments, due to various advantages, such as Adaptive learning, Self-Organization and Real time operation. (Maind and Wankar 2014) Narvekar and Fargose (2015) presented research through forecasting weather based around an Artificial Neural Network (ANN). Their research was conducted due to the desire to improve weather forecasting techniques for the various uses that accurate forecasting benefits. The research consisted of the design of an ANN, utilizing several variables received from weather recording centers. These variables included “temperature, humidity, rainfall amount, cloud

71
distance and size, wind speed and direction” (Narvekar and Fargose 2015) The authors suggested using the backpropagation approach for the ANN, an approach centered around the adjustment of neuron weights through a gradient descent optimization algorithm. The authors note that approximately 70% of the dataset will be used for training, with 30% for testing. The process of their proposed experiment is shown below.
Figure 5: Narvekar and Fargose (2015) Experiment Plan The authors conclude their research with an explanation of the advantages the backpropagation ANN would give. “…uses an iterative process of training where, it repeatedly compares the observed output with targeted output and calculates the error…hence this method tries to minimize the error” (Narvekar and Fargose 2015) the authors also state that an ANN is the best method to take for AI based weather prediction, due to the complexity of weather prediction variables. Narvekar and Fargose’s (2015) potential experiment was properly reasoned and the methodology, theory and objectives are constructed well. However, the paper consisted of the suggestions of a possible experimental attempt, and as such contains unvalidated claims with no evidence. The authors also make claims
on the superiority of an ANN system, but make no comparisons, citations or references of other system types. Malik et. al. (2014) Also conducted research into the usage of ANNs in weather forecasting. Their research was conducted due to the need to protect life and property with accurate weather forecasting techniques. Malik et. al. (2014) notes their reasoning for choosing to design an ANN was due to its ability to “that it can fairly approximate a large class of functions.”(Malik et. al. 2014) The ANN Malik et. al. (2014) designed used a feedforward, backpropagation design, an ANN type that only allows one-way signals coupled with supervised learning and a negative gradient system for the neural weights. The author notes their choice was due to the ability for feedforward ANNs to learn complex relationships quicker than traditional designs, but also states their computational requirements are higher, the paper ended with a selection of results and overall conclusion of the experiment. They claim their created ANN “is the fastest method among other weather forecasting methods.” (Malik et. al. 2014)
Figure 6: Malik et. al. (2014) Performance

72
Figure 7: Malik et. al. (2014) Training
Figure 8: Malik et. al. (2014) Regression Data Malik et. al. (2014) provided high quality results from their algorithms, but did not provide evidence of the algorithm itself, highly limiting re-creation for other researchers to confirm. They also provide no evidence for their claim of FF/BD algorithms being faster than traditional methods, and no references to other experiments that can allow for comparison. Abhishek et. al. (2012) also provided research into feedforward backpropagation ANNs. Like Malik et. al. (2014) they created an ANN with these choices alongside the usage of hidden data layers as they believed it best for speed and error minimization. The ANN was created to predict weather variables, such as temperature, rainfall and wind. The created ANN utilized the mentioned techniques as well as the MATLAB tool nntool.
The experiment was planned to use 3 forms of data, 10-year input, previous and target data and the export prediction data. The dataset consists of a 365 colomn sheet for each day in the year, with fields for each variable to be tracked. The neural network itself was trained using the Levenberg-Marquardt algorithm. Abhishek et. al. (2012) noted the ongoing issue with “Overfitting”, when a low Mean Squared Error (MSE) false flags as good accuracy, which Abhishek et. al. (2012) notes as being caused by the isolated test data that was used. “The final MSE generated is due to the isolated test data which is random 20% of the samples” (Abhishek et. al. 2012) The paper concludes by stating that their model “can reduce this processing cost by working on raw data” (Abhishek et. al. 2012) They explain that their work has discovered a large correlation between utilizing hidden data layers and increased performance and provide evidence for this claim, showcasing the potential of an ANN system when compared to the linear regression work of those such as Rani et. al. (2015) and Zhu Et. al. (2018). Abhishek Et. al. (2012) also identifies issues within his work and provides explanations for anomalistic results. The paper also provided results into the applications of hidden layers and the identification and fixing of overfitting. The showcase of physical results, as well as the measures taken to fix errors, greatly increases the reliability and accuracy of the results.
3 Conclusions Within this paper, the current state of technology for weather prediction AI software was examined and analyzed based on several factors that are used to determine the quality of the research, such as accuracy, reliability, repeatability and results, as well as gaps in the methods. Zhu et al (2018) provided the highest quality piece of research of those analyzed, adhering to scientific principles, properly explaining method and showcasing the results, as well as identifying errors that could cause future issue, such as using “guess” data. The paper successfully showcased the potential in Regression Algorithm based systems and forwarded the technology.

73
Rani et al (2015) also provided a significant experiment into regressive algorithms, providing a detailed method, results and graphical evidence of the findings, however their experiment was flawed with a lack of testing, only using a single data set from one location. Overall, based on research analyzed, the linear regressive method has shown considerable improvement over the artificial neural network method, which was backed by the work of Mailk (2016) who acknowledged the high computational requirements of the ANN strategy, and Abhishek et. al. (2012), who identified the issue of overfitting. The linear system has the potential of a new method involving the integration of the previous linear regression research noted above to address the issues of the singular experiments to create the potential of a superior development and improvement in the field.
4 Future Work Should research in this field be taken further, it is recommended the repetition or creation of experiments based on regressive algorithms, but with a higher focus on testing accuracy in multiple data sets over time with the full use of real-life data, alongside the integration of the work of Rani Et. al. (2015) and Zhu et. al. (2018) to create a new method with high potential accuracy.
References
Abhishek, K Singh, M, P Ghosh, S Anand., 2012, ‘A Weather forecasting model using Artificial Neural Network.’ Procedia Technology 4, 311(318), pp.1-8
Biradar, P Ansari, S Paradkar, Y Lohiya, S., 2017, ‘Weather Prediction Using Data mining.’ International Journal of Enigneering Development and Research, 5(2), pp.1-3
Jain, G Mallick, B., 2016, ‘A Review on Weather Forecasting Techniques.’ International Journal of Advanced Research in Computer and Communication Engineering, 5(12), p.1 Gupta, S. K, I. Singhal, G., 2016, ‘Weather Prediction Using Normal Equation Method and Linear regression Techniques.’ International
Journal of Computer Science and Information Technologies, 7(3), pp.2-3 Holmstrom, M Liu, D Vo, C., 2016, ‘Machine Learning Applied to Weather Forecasting.’ Stanford University, December 2016, p.1 Janani, B., 2014, ‘Analysis on the weather forecasting and techniques.’ International Journal of Advanced Research in Computer Engineering & Technology (IJARCET), 3(1), p.2
Jillella, P, R Kiran, P, B, S Chowdary, P, N., 2015, ‘Weather forecasting using artificial neural networks and data mining techniques.’ International Journal of Innovative Technology and research, 13(6), p.1
Malik, P Singh, B Arora, S., 2014, ‘An Effective Weather Forecasting Using Neural Networks.’ International Journal of Emerging Engineering Research and Technology, 2(2), pp.2-3
Manid, S, B Wankar, M, P., 2014, ‘Research Paper on Basics of Artificial Neural Networks.’ International Journal on Recent and Onnivation Trends in Computing and Communication, 2(1), p.1
Narvekar, M Fargose, P., 2015, ‘Daily weather forecasting using artificial neural networks.’ Internal Journal of Computer Applications, 121(22), pp.1-5
Rani, R,K Rama, T,K Rao, K Reddy, R, R, K., 2015, ‘An efficient machine learning regression model for rainfall prediction.’ International Journal of Computer Applications, 116(23), pp.1-6
Zhu, D Cai, C., 2018, ‘A machine learning approach for air quality prediction: Model Regularization and Optimization.’ Big Data Cognitive Computing, 2(5), pp.1-12