kenanga growth fund series 2 · 2019-07-26 · kenanga growth fund series 2 contents page corporate...
TRANSCRIPT
AnnuAl REPORT
For the Financial Period from 28 May 2018 (date of commencement) to 31 May 2019
KEnAnGA GROwTh fund sERiEs 2


KEnAnGA GROwTh fund sERiEs 2
Contents Page
Corporate directory ii Directory of Manager’s Offices iiifund information 1 - 2Manager’s Report 3 - 8fund Performance 9 - 11Trustee’s Report 12independent Auditors’ Report 13 - 15statement by the Manager 16financial statements 17 - 55
ii Kenanga Growth Fund Series 2 Annual Report
CORPORATE diRECTORYManager: Kenanga investors Berhad (Company No. 353563-P)
Registered OfficeLevel 17, Kenanga Tower,237, Jalan Tun Razak,50400 Kuala Lumpur, Malaysia.Tel: 03-2172 2888Fax: 03-2172 2999
Business OfficeLevel 14, Kenanga Tower,237, Jalan Tun Razak,50400 Kuala Lumpur, Malaysia.Tel: 03-2172 3000Fax: 03-2172 3080E-mail:[email protected]: www.KenangaInvestors.com.my
Board of directorsDatuk Syed Ahmad Alwee Alsree (Chairman)Syed Zafilen Syed Alwee (independent
director)Peter John Rayner (independent director)Imran Devindran bin Abdullah (independent
director)Ismitz Matthew De AlwisNorazian Binti Ahmad Tajuddin (independent
director)
investment Committee Syed Zafilen Syed Alwee (independent
Member)Peter John Rayner (independent Member)Imran Devindran bin Abdullah (independent
Member)Ismitz Matthew De AlwisNorazian Binti Ahmad Tajuddin (independent
Member)
Company secretary: norliza Abd samad (MAICSA 7011089)
Level 17, Kenanga Tower, 237, Jalan Tun Razak, 50400 Kuala Lumpur, Malaysia
Trustee: CiMB Commerce Trustee Berhad (Company No. 313031-A)
Registered Office Level 13, Menara CIMBJalan Stesen Sentral 2Kuala Lumpur Sentral50490 Kuala Lumpur.Tel: 03-2261 8888Fax: 03-2261 0099Website: www.cimb.com
Business Office Level 21, Menara CIMBJalan Stesen Sentral 2Kuala Lumpur Sentral50490 Kuala Lumpur.Tel: 03-2261 8888Fax: 03-2261 9889
Auditor: Ernst & Young (AF: 0039)
Level 23A, Menara Milenium, Jalan Damanlela, Pusat Bandar Damansara, 50490 Kuala Lumpur.Tel: 03-7495 8000 Fax: 03-2095 5332
Tax Adviser: Ernst & Young Tax Consultants sdn Bhd (Company No. 179793-K)
Level 23A, Menara Milenium, Jalan Damanlela, Pusat Bandar Damansara, 50490 Kuala Lumpur.Tel: 03-7495 8000 Fax: 03-2095 5332
Membership: federation of investment Managers Malaysia (fiMM)19-06-1, 6th Floor, Wisma Tune, 19, Lorong Dungun, Damansara Heights, 50490 Kuala Lumpur, Malaysia.Tel: 03-2093 2600 Fax: 03-2093 2700 Website: www.fimm.com.my
Kenanga Growth Fund Series 2 Annual Report iii
diRECTORY Of MAnAGER’s OffiCEsRegional Branch Offices :
Kuala lumpurLevel 13, Kenanga Tower,237, Jalan Tun Razak,50400 Kuala Lumpur, MalaysiaTel: 03-2172 3123 Fax: 03-2172 3133
Johor BahruNo. 63 Jalan Molek 3/1,Taman Molek 81100 Johor Bahru, JohorTel: 07-288 1683Fax: 07-288 1693
MelakaNo. 25-1, Jalan Kota Laksamana 2/17Taman Kota Laksamana, Seksyen 275200 MelakaTel: 06-281 8913 / 06-282 0518Fax: 06-281 4286
Kuching1st Floor, No 71Lot 10900, Jalan Tun Jugah93350 Kuching, SarawakTel: 082-572 228 Fax: 082-572 229
KlangNo. 12, Jalan Batai Laut 3, Taman Intan41300 Klang, Selangor Darul EhsanTel: 03-3341 8818 / 03-3348 7889 Fax: 03-3341 8816
KuantanGround Floor ShopNo. B8, Jalan Tun Ismail 125000 Kuantan, PahangTel : 09-514 3688Fax : 09-514 3838
Penang5.04, 5th Floor, Menara Boustead Penang No. 39, Jalan Sultan Ahmad Shah 10050 PenangTel : 04-210 6628Fax : 04-210 6644
ipohSuite 1, 2nd Floor,No. 63, Persiaran Greenhill,30450 Ipoh, Perak, MalaysiaTel: 05-254 7573 / 7570 / 7575Fax: 05-254 7606
Miri 2nd Floor, Lot 1264, Centre Point Commercial Centre, Jalan Melayu, 98000 Miri, Sarawak Tel: 085-416 866 Fax: 085-322 340
Kota KinabaluLevel 8, Wisma Great EasternNo. 68, Jalan Gaya, 88000 Kota Kinabalu, SabahTel: 088-203 063 Fax: 088-203 062
seremban 2nd Floor, No. 1D-2, Jalan Tuanku Munawir 70000 Seremban, Negeri Sembilan Tel: 06-761 5678 Fax: 06-761 2242
Petaling Jaya44B, Jalan SS21/35Damansara Utama47400 Petaling Jaya, SelangorTel: 03-7710 8828Fax: 03-7710 8830
1 Kenanga Growth Fund Series 2 Annual Report
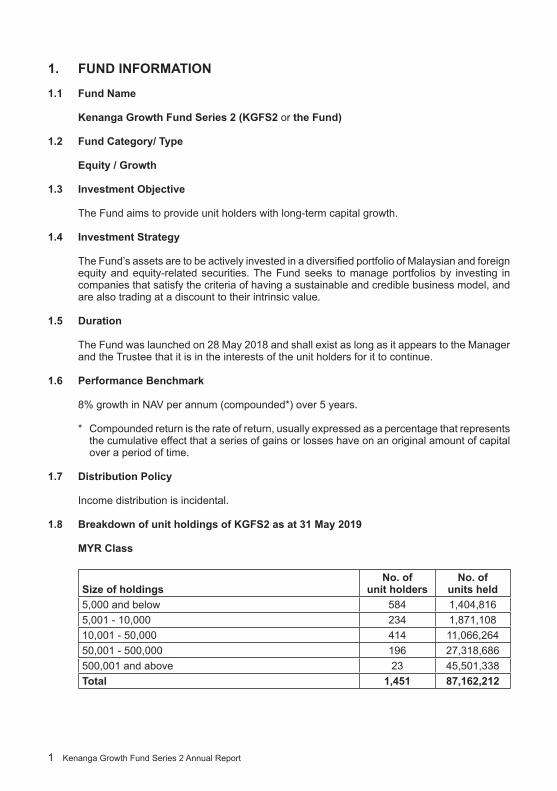
1. fund infORMATiOn
1.1 fund name
Kenanga Growth fund series 2 (KGfs2 or the fund) 1.2 fund Category/ Type
Equity / Growth
1.3 investment Objective
The Fund aims to provide unit holders with long-term capital growth.
1.4 investment strategy
The Fund’s assets are to be actively invested in a diversified portfolio of Malaysian and foreign equity and equity-related securities. The Fund seeks to manage portfolios by investing in companies that satisfy the criteria of having a sustainable and credible business model, and are also trading at a discount to their intrinsic value.
1.5 duration
The Fund was launched on 28 May 2018 and shall exist as long as it appears to the Manager and the Trustee that it is in the interests of the unit holders for it to continue.
1.6 Performance Benchmark
8% growth in NAV per annum (compounded*) over 5 years.
* Compounded return is the rate of return, usually expressed as a percentage that represents the cumulative effect that a series of gains or losses have on an original amount of capital over a period of time.
1.7 distribution Policy
Income distribution is incidental.
1.8 Breakdown of unit holdings of KGfs2 as at 31 May 2019
MYR Class
size of holdingsno. of
unit holdersno. of
units held5,000 and below 584 1,404,8165,001 - 10,000 234 1,871,10810,001 - 50,000 414 11,066,26450,001 - 500,000 196 27,318,686500,001 and above 23 45,501,338Total 1,451 87,162,212
Kenanga Growth Fund Series 2 Annual Report 2
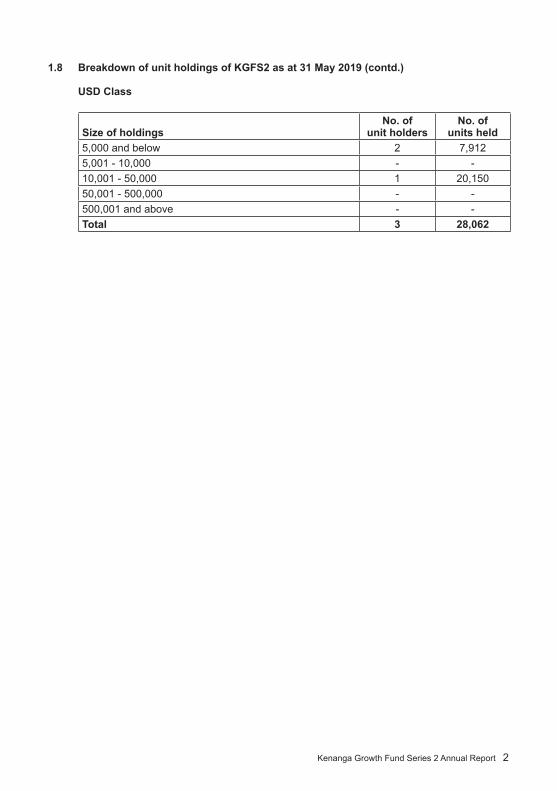
1.8 Breakdown of unit holdings of KGfs2 as at 31 May 2019 (contd.)
usd Class
size of holdingsno. of
unit holdersno. of
units held5,000 and below 2 7,9125,001 - 10,000 - -10,001 - 50,000 1 20,15050,001 - 500,000 - -500,001 and above - -Total 3 28,062

3 Kenanga Growth Fund Series 2 Annual Report
2. MAnAGER’s REPORT
2.1 Explanation on whether the fund has achieved its investment objective
Since inception, the MYR Class has depreciated by -0.42% in Net Asset Value terms (whilst its benchmark rose 8.39%). The fund has been incepted for about a year and aims to achieve a target return of 8% p.a. on average over the economic cycle.
2.2 Comparison between the fund’s performance and performance of the benchmark
Performance Chart since launch (28/05/2018 - 31/05/2019)Kenanga Growth fund series 2 vs Benchmark*
* 8% growth p.aSource: Lipper
2.3 Investment strategies and policies employed during the financial period under review
The Fund’s assets are to be actively invested in a diversified portfolio of Malaysian and foreign equity, and equity-related securities. The Fund seeks to manage portfolios by investing in companies that satisfy the criteria of having a sustainable and credible business model, and are also trading at a discount to their intrinsic value. However, under conditions of extreme market volatility and/or when the market is trading at valuations deemed unsustainable, the Fund will seek to judiciously scale back its equity exposure.
2.4 The fund’s asset allocation as at 31 May 2019
Asset 31 May 2019Listed investment securities 80.2%Short term deposits and cash 19.8%

Kenanga Growth Fund Series 2 Annual Report 4
2.5 fund performance analysis based on nAV per unit (adjusted for income distribution; if any) since last review period
Period under review
Kenanga Growth fund series 2- MYR Class -0.42%- USD Class -5.04%
Compounded Return of 8% p.a 8.39%Source: Lipper IM
For the period under review, the MYR Class registered a return of -0.42% underperforming the benchmark by 8.81% whereas the USD Class registered a return of -5.04%, underperforming the benchmark by 13.43%. The underperformance was mainly due to stock selection.
2.6 Review of the market
Market review
FTSE Bursa Malaysia Kuala Lumpur Companies Index (FBM-KLCI) declined 3.5% for the interim period under review. US Federal Reserve raised rate in June and September, effectively lifting US rates to 2.25% and kept guidance of total 4 hikes for 2018. US-China trade tensions escalated with the imposition of tariff from both sides. On the local front, market sentiment turned bearish in September, after strong performance in previous two months due to implementation of Sales and Service Tax (SST) and the announcement of minimum wage hike. FBM-KLCI recorded biggest single day fall in five months after Finance Minister Lim Guan Eng signalling Budget 2019 will require “sacrifices” during an investor conference.
The FBM-KLCI started the month positive during the first week of June. However, the positive momentum failed to sustain as foreigners continue to sell the market. The initial decline was dragged by finance related stocks which brought the index lower on 11 June; bucking regional trend which closed in the green on optimism that the U.S-North Korea summit in Singapore may lead to the denuclearization of the Korean peninsula. The downtrend for the index continued, in line with regional markets on trade-war fears after Donald Trump threatened to have additional tariffs on another USD200 billion of Chinese imports.
US stock indices ended positively in August led by solid US corporate earnings, despite the intra-month volatility caused by the on-going trade negotiations between the US and international trade partners. U.S. consumer spending increased a solid 0.4% in July, the sixth straight month of healthy gains, suggesting strong economic growth early in the 3Q18, while a measure of underlying inflation hit the US Federal Reserve’s 2% target for the third time this year. Elsewhere, investors were focused on emerging markets, including Turkey and Argentina, which are both embroiled in currency crises that Wall Street fears could have knock-on effects across the globe.
On the local front, 2Q18 Gross Domestic Product (GDP) growth of 4.5% YoY was reported in August, which was below market expectations. This was the slowest pace since 4Q16 as the country’s mining and agriculture sectors contracted at 2.2% and 2.5% respectively. Nevertheless, the underlying data are better than the headline implies. The domestic demand growth accelerated to 5.6% year-on-year (YoY) from 4.1% YoY in 1Q18 driven by consumption. The SST was reintroduced on September 1 with proposed sales tax at 5% and 10%, while service tax at fixed rate of 6%. The government is drawing up new directions for the 11th Malaysia Plan which will be tabled in the Parliament in October.

5 Kenanga Growth Fund Series 2 Annual Report
2.6 Review of the market (contd.)
Market review (contd.)
Despite escalation in US-China trade tension, US stock indices continued to hit new highs, on the back of stronger than expected macro-economic data in September. As widely expected, the Federal Reserve raised interest rate by another 25 basis points (bps) at September Federal Open Market Committee (FOMC) meeting, which reflected the positive economic outlook. Elsewhere, the European Central Bank reiterated expectation of no rate change until at least summer 2019. However, concerns over potential no-deal Brexit and Italy budget capped upside in the European markets.
October was a brutal month for equity markets. Equities tumbled amidst escalated US-China trade tension, rising treasury yields, disappointment over apple suppliers’ profits and UK’s introduction of digital tax. The International Monetary Fund (IMF) cut 2018/2019 global growth to 3.7% (previously 3.9%), the first downgrade since July 2016. IMF highlighted that risks to global outlook have risen due to the trade tensions and sharper interest rate hikes. 10-year US treasury yield surged to 3.234%, the highest in seven years in early October before moderating to 3.144% by month end. The October correction sent Dow Jones, S&P and Nasdaq down month-on-month (MoM) by 5.1%, 6.9% and 9.2% respectively, erasing most of the gains in 2018. While China’s 3Q GDP growth came in within expectation at 6.5%, October manufacturing Purchasing Manager’s Index (PMI) dropped to 50.2 from 50.8 in September, the slowest in 2 years. Weighed by domestic slowdown and trade tension, the Shanghai and Shenzhen Index plunged 7.8% and 10.2% respectively. To counter the slowdown, China cut banks reserve requirement for the 4th time for the year to support lending to corporates and small and medium enterprises. In addition, Chinese regulators also voiced support measures for the financial markets as holdings of many listed companies are pledged for collateral loans. The Chinese Yuan depreciated 1.56% against US dollar to close at 6.98 by the end of October.
Locally, the FBM-KLCI was not spared by the respite in October. The FBM-KLCI slipped 4.7% MoM to 1709.27 points on the back of foreign selling and worries over introduction of new taxes which may dent capital markets. Officials reiterated that the upcoming 2019 budget would be difficult and require sacrifices, adding jittery into investors’ sentiment. The FBM Small Cap Index corrected a sharper 11.4% due to risk-off sentiment. While the termination of Mass Rapid Transit 2 underground works was later avoided with main contractor Gamuda-MMC JV offering a bigger cost cut, the drama threw the entire construction sector into doldrums.
Malaysia’s new government announced its maiden Budget 2019 in November, with the increase of casino gaming tax and introduction of new taxes which include sugar tax, digital tax and airport departure levy. The economy is expected to grow at 4.8%/4.9% in 2018/2019 driven by private sector consumption growth of 9%/9.9% in 2018/2019 respectively. Fiscal deficit is projected at 3.7% in 2018 and will narrow to 3.4% in 2019. The Budget however did not provide any boost to the market. Malaysia 3Q18 GDP rose 4.4% YoY driven largely by consumer and private sector spending. The FBM-KLCI slipped 1.7% MoM to the year’s low of 1679.86 points on the back of foreign selling and disappointing 3Q earnings.
December was a rough month for markets around the world especially the US market, with the Dow Jones Industrial Average Index, S&P 500 Index and Nasdaq Composite Index fell 8.7%, 9.2%, and 9.5% MoM respectively, the worst December since the depths of the Great Depression in 1931. The markets have been battered by the trade conflict between the United States and China, fears over rising interest rates, geopolitical snafus like Brexit and falling oil prices. FBM-KLCI managed to eke out 0.64% MoM gains in December, but ended the year with a negative return of 5.9%.
Kenanga Growth Fund Series 2 Annual Report 6
2.6 Review of the market (contd.)
Market review (contd.)
The Fed kept interests rates unchanged at 2.25%-2.50% following its first FOMC meeting in January 2019. The central bank turned more dovish indicating it will be patient in its monetary normalisation plan given moderating economic activity, muted inflation pressures and market uncertainty arising from concerns regarding trade war and global growth. In the UK, Brexit uncertainty continues as British parliament votes on rejecting Prime Minister Theresa May’s EU withdrawal agreement. This was followed by May’s administration winning a vote of no-confidence in the House of Commons by a thin margin.
MSCI Asia ex-Japan Index was up 2.05% in February as most countries posted positive returns in local currency terms. Investor sentiment generally improved as US and China appear to be making progress on trade talks despite China Caixin PMI shrinks more than expected in January.
US markets continued its positive streak with the Dow Jones Industrial Average Index, S&P 500 Index, and Nasdaq Composite Index rising 0.1%, 1.8%, and 2.6% respectively. However, the Fed Yield Curve inverted, spooking investors as such inversion normally precedes a recession. Over to the European Union, the central bank decided to keep rates at 0% and announced a new series of long-term lending operation to increase liquidity and counter the slow growing economy while the U.K. parliament rejected the EU withdrawal agreement for the third time, setting the motion for a no deal Brexit on April 12. Locally, the FBM Small Cap remained resilient with a +1.3% MoM gain, outperforming the main market. Foreigners remain net sellers in March with RM1.6 billion outflows, bringing YTD outflow to RM1.3 billion.
After a temporary inversion, the yield curve normalized during April, which alleviated recession concern. Over to Europe, the agreement between UK and EU to delay Brexit deadline by six months to 31st October 2019 averted the immediate risk of no-deal Brexit. Locally, the FBM-KLCI index edged down 0.08%, while the FBM Small Cap index gaining 7.16% during the month. The mid-to-small cap space continued its uptrend, boosted by positive sentiment following revival of mega infrastructure projects such as the East Coast Rail Line and Bandar Malaysia. During the month, the Ringgit reversed its earlier uptrend and depreciated 1.29% against USD, due to concerns over potential exclusion of Malaysia debt securities from the FTSE World Government Bond Index and reduced weighting for Malaysian equities in upcoming MSCI rebalancing.
The renewed US-China trade tension with both countries raising tariffs against each other triggered a widespread selloff in May. The selloff also spilled over into the technology sector as US companies were banned from doing business with Huawei. In response to that, China toughened its stance on the trade war in the White Paper and emphasized that a trade deal must be mutually beneficial, indicating further delay of a potential trade deal. One of the non-tariff retaliatory measures China could take is to restrict rare earth export to US as US imports up to 80% of its rare earth consumption from China. Both the Dow Jones Industrial Average index and Euro STOXX 50 tumbled 6.7% MoM in May. MSCI Asia ex-Japan fell 8.9% MoM with HSCEI (-10.0%) and HSI (-9.4%) being the worst performers, followed by Singapore (-8.3%), Korea (-7.3%) and CSI300 (-7.2%). On the domestic front, Bank Negara Malaysia cut Overnight Policy Rate by 25 bps to 3%, the first change in 8 policy meetings which is negative for Banks’ net interest margins and companies with high cash holdings. Noticeable merger and acquisition deals include the proposed Telenor-Axiata merger, YTL Cement’s acquisition on Lafarge Malaysia followed by Hong Leong Group’s privatisation of Tasek Corp.
7 Kenanga Growth Fund Series 2 Annual Report
2.6 Review of the market (contd.)
Market outlook
All eyes will be on G20 meeting in Japan scheduled on June 28-29 where both President Trump and Chairman Xi will meet to discuss on trade matters. Another key event to watch is the June 18-19 FOMC meeting as Fed is turning more dovish on the back of slowing US economy momentum. Over in Europe, Teresa May will step down as the Prime Minister of UK on June 7. While a 90-day temporary waiver is granted on Huawei sanction, disruptions in the technology supply chain could have long term implications to technology dependant countries including Korea and Taiwan. In China, more easing and stimulus measures are expected as growth has yet to truly bottom out. The Chinese government is managing expectations to prepare for RMB trading above 7 against USD in the event of more US tariffs.
In Malaysia, investors would monitor the decision on electricity tariffs before 30 June 2019 and potential power reform plans. Employers are also waiting for details on foreign worker replacement scheme that has been delayed.
strategy
Though valuations are looking more attractive following the correction in May, we remain cautiously optimistic on the market and will manage our portfolios more proactively in order to outperform amid volatile markets. We remain Overweight on ASEAN in particularly Indonesia as compared to North Asia, Neutral on Singapore and Thailand.
2.7 distributions
For the financial period under review, the Fund did not declare any income distribution.
2.8 details of any unit split exercise
The Fund did not carry out any unit split exercise during the financial period under review.
2.9 Significant changes in the state of affair of the Fund during the financial period
There were no significant changes in the state of affair of the Fund during the financial period and up until the date of the manager’s report, not otherwise disclosed in the financial statements.
2.10 Circumstances that materially affect any interests of the unit holders
During the financial period under review, there were no circumstances that materially affected any interests of the unit holders.
2.11 Rebates and soft commissions
It is the policy of the Manager to credit any rebates received into the account of the Fund. Any soft commissions received by investment manager on behalf of the Fund are in the form of research and advisory services that assist in the decision making process relating to the investment of the Fund which are of demonstrable benefit to unit holders of the Fund. Any dealing with the broker or dealer is executed on terms which are most favourable for the Fund. For the financial period under review, the Manager has received soft commissions from the stockbrokers.

Kenanga Growth Fund Series 2 Annual Report 8
2.12 Cross trade
During the financial period under review, no cross-trade transaction was undertaken by investment manager for the Fund.
9 Kenanga Growth Fund Series 2 Annual Report
3. fund PERfORMAnCE
3.1 Details of portfolio composition of the Fund for the financial period as at 31 May 2019 are as follows:
a. distribution among industry sectors and category of investments:
As at31.5.19
%
Industrial Products 25.7 Consumer Products 15.7 Energy 7.7 Technology 7.7 Constructions 5.3 Financial Services 5.2 Utilities 4.8 Trading/Services 4.3 Properties 2.2 Real Estate Investment Trust 1.1 Exchange Traded Fund 0.5 Short term deposits and cash 19.8
100.0
Note: The above mentioned percentages are based on total investment market value plus cash.
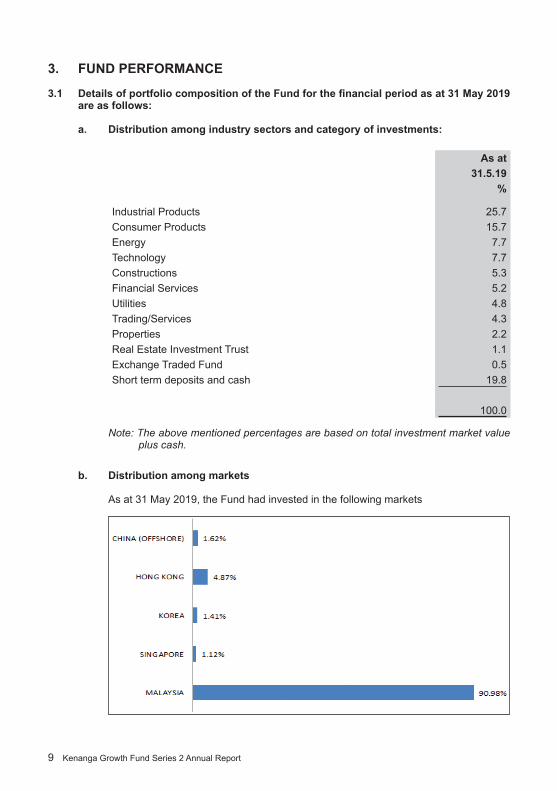
b. distribution among markets
As at 31 May 2019, the Fund had invested in the following markets
Kenanga Growth Fund Series 2 Annual Report 10
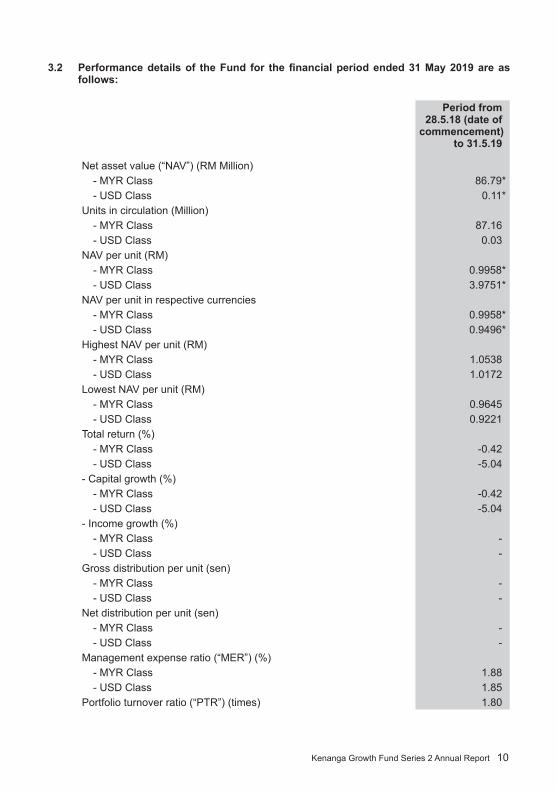
3.2 Performance details of the Fund for the financial period ended 31 May 2019 are as follows:
Period from 28.5.18 (date of
commencement) to 31.5.19
Net asset value (“NAV”) (RM Million)- MYR Class 86.79*- USD Class 0.11*
Units in circulation (Million)- MYR Class 87.16 - USD Class 0.03
NAV per unit (RM)- MYR Class 0.9958* - USD Class 3.9751*
NAV per unit in respective currencies- MYR Class 0.9958*- USD Class 0.9496*
Highest NAV per unit (RM)- MYR Class 1.0538 - USD Class 1.0172
Lowest NAV per unit (RM)- MYR Class 0.9645 - USD Class 0.9221
Total return (%)- MYR Class -0.42- USD Class -5.04
- Capital growth (%)- MYR Class -0.42- USD Class -5.04
- Income growth (%)- MYR Class - - USD Class -
Gross distribution per unit (sen)- MYR Class - - USD Class -
Net distribution per unit (sen)- MYR Class - - USD Class -
Management expense ratio (“MER”) (%)- MYR Class 1.88 - USD Class 1.85
Portfolio turnover ratio (“PTR”) (times) 1.80
11 Kenanga Growth Fund Series 2 Annual Report
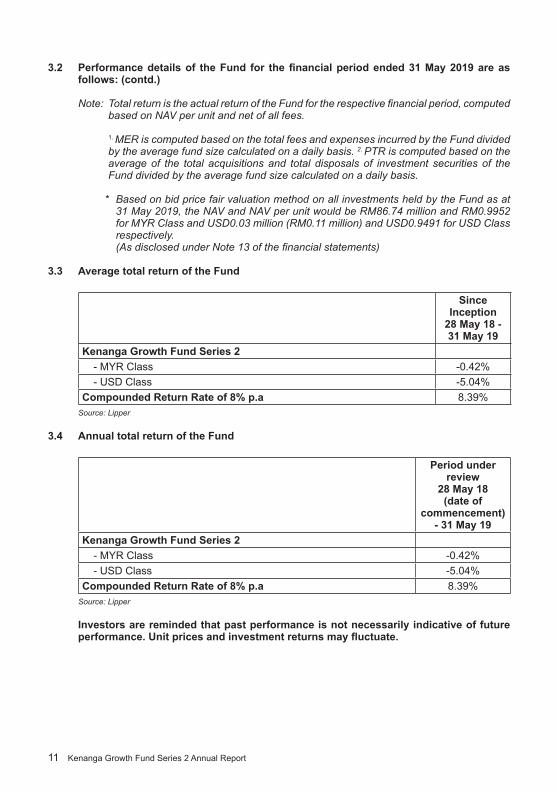
3.2 Performance details of the Fund for the financial period ended 31 May 2019 are as follows: (contd.)
Note: TotalreturnistheactualreturnoftheFundfortherespectivefinancialperiod,computedbased on NAV per unit and net of all fees.
1. MER is computed based on the total fees and expenses incurred by the Fund divided by the average fund size calculated on a daily basis. 2. PTR is computed based on the average of the total acquisitions and total disposals of investment securities of the Fund divided by the average fund size calculated on a daily basis.
* Based on bid price fair valuation method on all investments held by the Fund as at 31May2019,theNAVandNAVperunitwouldbeRM86.74millionandRM0.9952forMYRClassandUSD0.03million(RM0.11million)andUSD0.9491forUSDClassrespectively.(AsdisclosedunderNote13ofthefinancialstatements)
3.3 Average total return of the fund
since inception
28 May 18 -31 May 19
Kenanga Growth fund series 2- MYR Class -0.42%- USD Class -5.04%
Compounded Return Rate of 8% p.a 8.39%Source: Lipper
3.4 Annual total return of the fund
Period under review
28 May 18 (date of
commencement) - 31 May 19
Kenanga Growth fund series 2- MYR Class -0.42%- USD Class -5.04%
Compounded Return Rate of 8% p.a 8.39%Source: Lipper
investors are reminded that past performance is not necessarily indicative of future performance. Unit prices and investment returns may fluctuate.

Kenanga Growth Fund Series 2 Annual Report 12
4. TRusTEE’s REPORT TO ThE uniT hOldERs Of KEnAnGA GROwTh fund sERiEs 2
We, CIMB Commerce Trustee Berhad being the trustee for Kenanga Growth Fund Series 2 (“the Fund”), are of the opinion that Kenanga Investors Berhad (“the Manager”), acting in the capacity as Manager of the Fund, has fulfilled its duties in the following manner for the financial period from 28 May 2018 (date of commencement) to 31 May 2019.
a) The Fund has been managed in accordance with the limitations imposed on the investment powers of the Manager under the Deeds, the Securities Commission Malaysia’s Guidelines on Unit Trust Funds, the Capital Markets and Services Act 2007 (as amended from time to time) and other applicable laws;
b) Valuation and pricing of for Fund has been carried out in accordance with the Deeds and relevant regulatory requirements; and
c) Creation and cancellation of units have been carried out in accordance with the Deeds and relevant regulatory requirements.
For and on behalf of CIMB Commerce Trustee Berhad Lee Kooi Yoke Chief Executive Officer Kuala Lumpur, Malaysia
16 July 2019
13 Kenanga Growth Fund Series 2 Annual Report
5. indEPEndEnT AudiTORs’ REPORT TO ThE uniT hOldERs Of KEnAnGA GROwTh fund sERiEs 2
Report on the audit of the financial statements
Opinion
We have audited the financial statements of Kenanga Growth Fund Series 2 (“the Fund”), which comprise the statement of financial position as at 31 May 2019, and the statement of comprehensive income, statement of changes in net asset value and statement of cash flows of the Fund for the financial period from 28 May 2018 (date of commencement) to 31 May 2019, and notes to the financial statements, including a summary of significant accounting policies and other explanatory information, as set out on pages 17 to 55.
In our opinion, the accompanying financial statements give a true and fair view of the financial position of the Fund as at 31 May 2019 and of its financial performance and cash flows for the financial year then ended in accordance with Malaysian Financial Reporting Standards and International Financial Reporting Standards.
Basis for opinion
We conducted our audit in accordance with approved standards on auditing in Malaysia and International Standards on Auditing. Our responsibilities under those standards are further described in the Auditors’ responsibilities for the audit of the financial statements section of our report. We believe that the audit evidence we have obtained is sufficient and appropriate to provide a basis for our audit opinion.
Independence and other ethical responsibilities
We are independent of the Fund in accordance with the By-Laws (on Professional Ethics, Conduct and Practice) of the Malaysian Institute of Accountants (“By-Laws”) and the International Ethics Standards Board for Accountants’ Code of Ethics for Professional Accountants (“IESBA Code”), and we have fulfilled our other ethical responsibilities in accordance with the By-Laws and the IESBA Code.
Informationotherthanthefinancialstatementsandauditors’reportthereon
The Manager of the Fund (“the Manager”) is responsible for the other information. The other information comprises the information included in the annual report of the Fund, but does not include the financial statements of the Fund and our auditors’ report thereon.
Our opinion on the financial statements of the Fund does not cover the other information and we do not express any form of assurance conclusion thereon.
In connection with our audit of the financial statements of the Fund, our responsibility is to read the other information and, in doing so, consider whether the other information is materially inconsistent with the financial statements of the Fund or our knowledge obtained in the audit or otherwise appears to be materially misstated.
If, based on the work we have performed, we conclude that there is a material misstatement of this other information, we are required to report that fact. We have nothing to report in this regard.
Kenanga Growth Fund Series 2 Annual Report 14
5. indEPEndEnT AudiTORs’ REPORT TO ThE uniT hOldERs Of KEnAnGA GROwTh fund sERiEs 2 (COnTd.)
ResponsibilitiesoftheManagerandtheTrusteeforthefinancialstatements
The Manager is responsible for the preparation of financial statements of the Fund that give a true and fair view in accordance with Malaysian Financial Reporting Standards and International Financial Reporting Standards. The Manager is also responsible for such internal control as the Manager determines is necessary to enable the preparation of financial statements of the Fund that are free from material misstatement, whether due to fraud or error.
In preparing the financial statements of the Fund, the Manager is responsible for assessing the Fund’s ability to continue as a going concern, disclosing, as applicable, matters related to going concern and using the going concern basis of accounting unless the Manager either intends to liquidate the Fund or to cease operations, or has no realistic alternative but to do so.
The Trustee is responsible for overseeing the Fund’s financial reporting process. The Trustee is also responsible for ensuring that the Manager maintains proper accounting and other records as are necessary to enable true and fair presentation of these financial statements.
Auditors’responsibilitiesfortheauditofthefinancialstatements
Our objectives are to obtain reasonable assurance about whether the financial statements of the Fund as a whole are free from material misstatement, whether due to fraud or error, and to issue an auditors’ report that includes our opinion. Reasonable assurance is a high level of assurance, but is not a guarantee that an audit conducted in accordance with approved standards on auditing in Malaysia and International Standards on Auditing will always detect a material misstatement when it exists. Misstatements can arise from fraud or error and are considered material if, individually or in the aggregate, they could reasonably be expected to influence the economic decisions of users taken on the basis of these financial statements.
As part of an audit in accordance with approved standards on auditing in Malaysia and International Standards on Auditing, we exercise professional judgment and maintain professional skepticism throughout the audit. We also:
• Identify and assess the risks of material misstatement of the financial statements of the Fund, whether due to fraud or error, design and perform audit procedures responsive to those risks, and obtain audit evidence that is sufficient and appropriate to provide a basis for our opinion. The risk of not detecting a material misstatement resulting from fraud is higher than for one resulting from error, as fraud may involve collusion, forgery, intentional omissions, misrepresentations, or the override of internal control.
• Obtain an understanding of internal control relevant to the audit in order to design audit procedures that are appropriate in the circumstances, but not for the purpose of expressing an opinion on the effectiveness of the Fund’s internal control.
• Evaluate the appropriateness of accounting policies used and the reasonableness of accounting estimates and related disclosures made by the Manager.
15 Kenanga Growth Fund Series 2 Annual Report
5. indEPEndEnT AudiTORs’ REPORT TO ThE uniT hOldERs Of KEnAnGA GROwTh fund sERiEs 2 (COnTd.)
Auditors’responsibilitiesfortheauditofthefinancialstatements(contd.)
• Conclude on the appropriateness of the Manager’s use of the going concern basis of accounting and, based on the audit evidence obtained, whether a material uncertainty exists related to events or conditions that may cast significant doubt on the Fund’s ability to continue as a going concern. If we conclude that a material uncertainty exists, we are required to draw attention in our auditors’ report to the related disclosures in the financial statements of the Fund or, if such disclosures are inadequate, to modify our opinion. Our conclusions are based on the audit evidence obtained up to the date of our auditors’ report. However, future events or conditions may cause the Fund to cease to continue as a going concern.
• Evaluate the overall presentation, structure and content of the financial statements of the Fund, including the disclosures, and whether the financial statements of the Fund represent the underlying transactions and events in a manner that achieves fair presentation.
We communicate with the Manager regarding, among other matters, the planned scope and timing of the audit and significant audit findings, including any significant deficiencies in internal control that we identify during our audit.
Other matters
This report is made solely to the unit holders of the Fund, as a body, in accordance with the Guidelines on Unit Trust Funds issued by the Securities Commission Malaysia and for no other purpose. We do not assume responsibility to any other person for the content of this report.
Ernst & Young Ng Sue EanAF: 0039 No. 03276/07/2020 JChartered Accountants Chartered Accountant
Kuala Lumpur, Malaysia
16 July 2019
Kenanga Growth Fund Series 2 Annual Report 16
6. sTATEMEnT BY ThE MAnAGER
I, Ismitz Matthew De Alwis, being a director of Kenanga Investors Berhad, do hereby state that, in the opinion of the Manager, the accompanying statement of financial position as at 31 May 2019 and the related statement of comprehensive income, statement of changes in net asset value and statement of cash flows for the financial period from 28 May 2018 (date of commencement) to 31 May 2019 together with notes thereto, are drawn up in accordance with Malaysian Financial Reporting Standards and International Financial Reporting Standards so as to give a true and fair view of the financial position of Kenanga Growth Fund Series 2 as at 31 May 2019 and of its financial performance and cash flows for the financial period from 28 May 2018 (date of commencement) to 31 May 2019 and comply with the requirements of the Deed.
For and on behalf of the Manager KENANGA INVESTORS BERHAD
ISMITZ MATTHEW DE ALWIS Executive Director/Chief Executive Officer
Kuala Lumpur, Malaysia
16 July 2019
17 Kenanga Growth Fund Series 2 Annual Report
7. finAnCiAl sTATEMEnTs
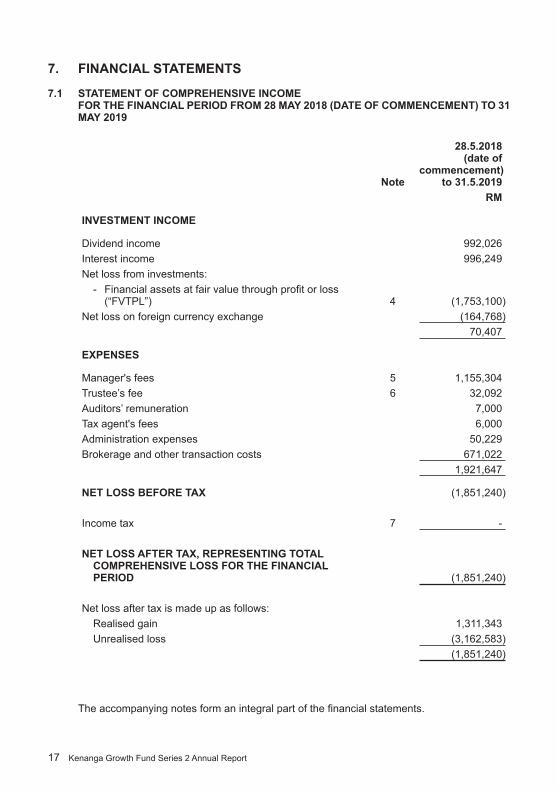
7.1 sTATEMEnT Of COMPREhEnsiVE inCOME fOR ThE finAnCiAl PERiOd fROM 28 MAY 2018 (dATE Of COMMEnCEMEnT) TO 31
MAY 2019
note
28.5.2018 (date of
commencement) to 31.5.2019
RM
inVEsTMEnT inCOME
Dividend income 992,026 Interest income 996,249 Net loss from investments:
- Financial assets at fair value through profit or loss (“FVTPL”) 4 (1,753,100)
Net loss on foreign currency exchange (164,768)70,407
EXPEnsEs
Manager's fees 5 1,155,304 Trustee’s fee 6 32,092 Auditors’ remuneration 7,000 Tax agent's fees 6,000 Administration expenses 50,229 Brokerage and other transaction costs 671,022
1,921,647
nET lOss BEfORE TAX (1,851,240)
Income tax 7 -
nET lOss AfTER TAX, REPREsEnTinG TOTAl COMPREhEnsiVE lOss fOR ThE finAnCiAl PERiOd (1,851,240)
Net loss after tax is made up as follows:Realised gain 1,311,343 Unrealised loss (3,162,583)
(1,851,240)
The accompanying notes form an integral part of the financial statements.
Kenanga Growth Fund Series 2 Annual Report 18
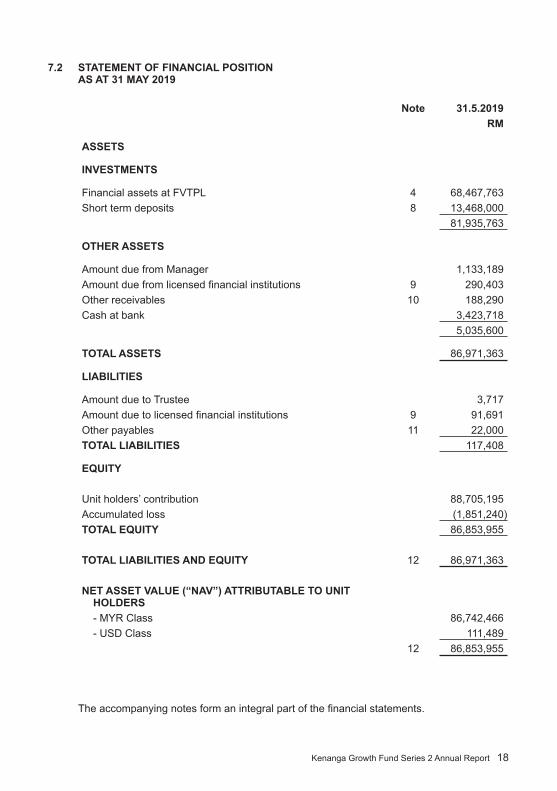
7.2 sTATEMEnT Of finAnCiAl POsiTiOn As AT 31 MAY 2019
note 31.5.2019RM
AssETs
inVEsTMEnTs
Financial assets at FVTPL 4 68,467,763Short term deposits 8 13,468,000
81,935,763
OThER AssETs
Amount due from Manager 1,133,189Amount due from licensed financial institutions 9 290,403 Other receivables 10 188,290Cash at bank 3,423,718
5,035,600
TOTAl AssETs 86,971,363
liABiliTiEs
Amount due to Trustee 3,717Amount due to licensed financial institutions 9 91,691 Other payables 11 22,000 TOTAl liABiliTiEs 117,408
EQuiTY
Unit holders’ contribution 88,705,195 Accumulated loss (1,851,240)TOTAl EQuiTY 86,853,955
TOTAl liABiliTiEs And EQuiTY 12 86,971,363
nET AssET VAluE (“nAV”) ATTRiBuTABlE TO uniT hOldERs- MYR Class 86,742,466 - USD Class 111,489
12 86,853,955
The accompanying notes form an integral part of the financial statements.
19 Kenanga Growth Fund Series 2 Annual Report
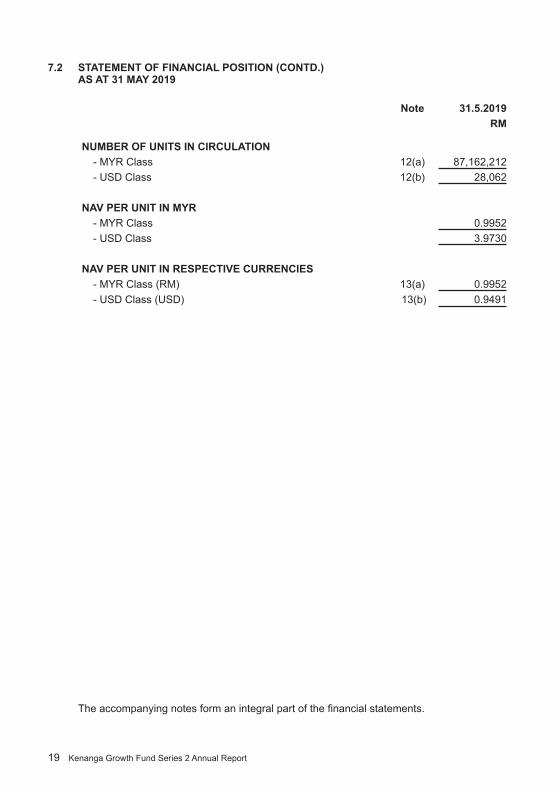
7.2 sTATEMEnT Of finAnCiAl POsiTiOn (COnTd.) As AT 31 MAY 2019
note 31.5.2019RM
nuMBER Of uniTs in CiRCulATiOn- MYR Class 12(a) 87,162,212 - USD Class 12(b) 28,062
nAV PER uniT in MYR- MYR Class 0.9952 - USD Class 3.9730
nAV PER uniT in REsPECTiVE CuRREnCiEs- MYR Class (RM) 13(a) 0.9952 - USD Class (USD) 13(b) 0.9491
The accompanying notes form an integral part of the financial statements.

Kenanga Growth Fund Series 2 Annual Report 20
7.3 sTATEMEnT Of ChAnGEs in nET AssET VAluE fOR ThE finAnCiAl PERiOd fROM 28 MAY 2018 (dATE Of COMMEnCEMEnT) TO 31
MAY 2019
noteunit holders’ contribution
Accumulated loss Total nAV
RM RM RM
28.5.2018 (date of commencement) to 31.5.2019
At date of commencement - - -Total comprehensive loss - (1,851,240) (1,851,240)Creation of units- MYR Class 12(a) 100,918,631 - 100,918,631 - USD Class 12(b) 267,632 - 267,632
Cancellation of units- MYR Class 12(a) (13,756,419) - (13,756,419)- USD Class 12(b) (150,161) - (150,161)
Distribution equalisation- MYR Class 12(a) 1,419,015 - 1,419,015 - USD Class 12(b) 6,497 - 6,497
At end of the financial period 88,705,195 (1,851,240) 86,853,955
The accompanying notes form an integral part of the financial statements.
21 Kenanga Growth Fund Series 2 Annual Report
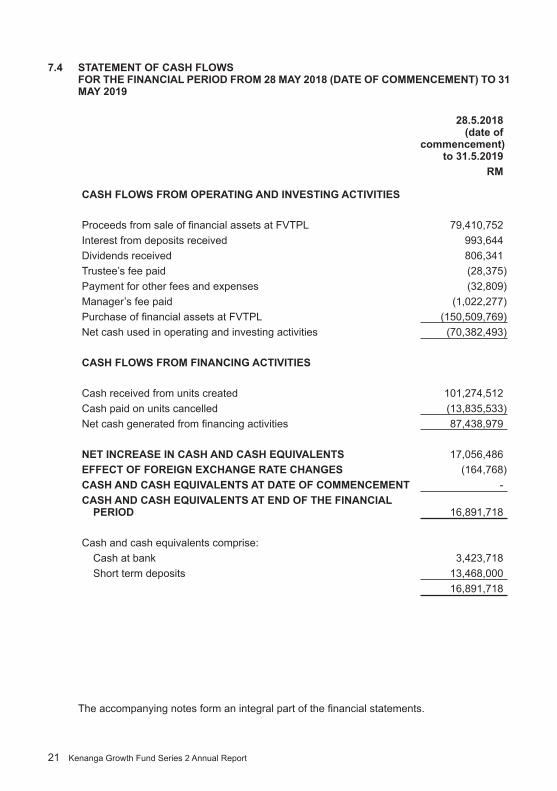
7.4 sTATEMEnT Of CAsh flOws fOR ThE finAnCiAl PERiOd fROM 28 MAY 2018 (dATE Of COMMEnCEMEnT) TO 31
MAY 2019
28.5.2018 (date of
commencement) to 31.5.2019
RM
CAsh flOws fROM OPERATinG And inVEsTinG ACTiViTiEs
Proceeds from sale of financial assets at FVTPL 79,410,752 Interest from deposits received 993,644 Dividends received 806,341 Trustee’s fee paid (28,375)Payment for other fees and expenses (32,809)Manager’s fee paid (1,022,277)Purchase of financial assets at FVTPL (150,509,769)Net cash used in operating and investing activities (70,382,493)
CAsh flOws fROM finAnCinG ACTiViTiEs
Cash received from units created 101,274,512 Cash paid on units cancelled (13,835,533)Net cash generated from financing activities 87,438,979
nET inCREAsE in CAsh And CAsh EQuiVAlEnTs 17,056,486 EffECT Of fOREiGn EXChAnGE RATE ChAnGEs (164,768)CAsh And CAsh EQuiVAlEnTs AT dATE Of COMMEnCEMEnT -CAsh And CAsh EQuiVAlEnTs AT End Of ThE finAnCiAl
PERiOd 16,891,718
Cash and cash equivalents comprise:Cash at bank 3,423,718 Short term deposits 13,468,000
16,891,718
The accompanying notes form an integral part of the financial statements.
Kenanga Growth Fund Series 2 Annual Report 22
7.5 nOTEs TO ThE finAnCiAl sTATEMEnTs fOR ThE finAnCiAl PERiOd fROM 28 MAY 2018 (dATE Of COMMEnCEMEnT) TO 31
MAY 2019
1. ThE fund, ThE MAnAGER And ThEiR PRinCiPAl ACTiViTiEs
Kenanga Growth Fund Series 2 (“the Fund”) was constituted pursuant to the executed Deed dated 30 April 2018 between the Manager, Kenanga Investors Berhad, and CIMB Commerce Trustee Berhad (“the Trustee”). The Fund commenced operations on 28 May 2018 and will continue to be in operation until terminated as as provided under Part 11 of the Deed.
Kenanga Investors Berhad is a wholly-owned subsidiary of Kenanga Investment Bank Berhad that is listed on the Main Market of Bursa Malaysia Securities Berhad. All of these companies are incorporated in Malaysia.
The principal place of business of the Manager is Level 14, Kenanga Tower, 237, Jalan Tun Razak, 50400 Kuala Lumpur.
The Fund seeks to provide unit holders with long-term capital growth. To achieve the objective of the Fund, it will invest up to 98% of the Fund’s NAV in equities and equity-related securities and up to 30% of the Fund’s NAV in foreign assets.
The financial statements were authorised for issue by the Chief Executive Officer of the Manager on 16 July 2019.
2. finAnCiAl RisK MAnAGEMEnT OBJECTiVEs And POliCiEs
The Fund is exposed to a variety of risks including market risk (which includes interest rate risk, price risk and currency risk), credit risk and liquidity risk. Whilst these are the most important types of financial risks inherent in each type of financial instruments, the Manager and the Trustee would like to highlight that this list does not purport to constitute an exhaustive list of all the risks inherent in an investment in the Fund.
The Fund has an approved set of investment guidelines and policies as well as internal controls which sets out its overall business strategies to manage these risks to optimise returns and preserve capital for the unit holders, consistent with the long term objectives of the Fund.
a. Market risk
Market risk is the risk that the fair value or future cash flows of a financial instrument will fluctuate because of changes in market prices. Market risk includes interest rate risk, price risk and currency risk.
Market risk arises when the value of the investments fluctuates in response to the activities of individual companies, general market or economic conditions. It stems from the fact that there are other economy-wide perils, which threaten all businesses. Hence, investors are exposed to market uncertainties. Fluctuation in the investments’ prices caused by uncertainties in the economy, political and social environment will affect the NAV of the Fund.
23 Kenanga Growth Fund Series 2 Annual Report
2. finAnCiAl RisK MAnAGEMEnT OBJECTiVEs And POliCiEs (COnTd.)
a. Market risk (contd.)
The Manager manages the risk of unfavourable changes in prices by cautious review of the investments and continuous monitoring of their performance and risk profiles.
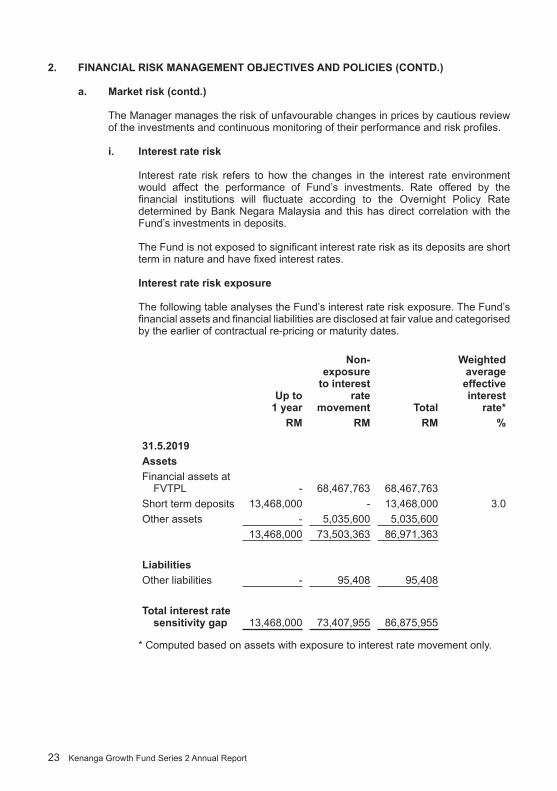
i. interest rate risk
Interest rate risk refers to how the changes in the interest rate environment would affect the performance of Fund’s investments. Rate offered by the financial institutions will fluctuate according to the Overnight Policy Rate determined by Bank Negara Malaysia and this has direct correlation with the Fund’s investments in deposits.
The Fund is not exposed to significant interest rate risk as its deposits are short term in nature and have fixed interest rates.
interest rate risk exposure
The following table analyses the Fund’s interest rate risk exposure. The Fund’s financial assets and financial liabilities are disclosed at fair value and categorised by the earlier of contractual re-pricing or maturity dates.
up to 1 year
non-exposure
to interest rate
movement Total
weighted average effective interest
rate*RM RM RM %
31.5.2019AssetsFinancial assets at
FVTPL - 68,467,763 68,467,763 Short term deposits 13,468,000 - 13,468,000 3.0Other assets - 5,035,600 5,035,600
13,468,000 73,503,363 86,971,363
liabilitiesOther liabilities - 95,408 95,408
Total interest rate sensitivity gap 13,468,000 73,407,955 86,875,955
* Computed based on assets with exposure to interest rate movement only.
Kenanga Growth Fund Series 2 Annual Report 24
2. finAnCiAl RisK MAnAGEMEnT OBJECTiVEs And POliCiEs (COnTd.)
a. Market risk (contd.)
ii. Price risk
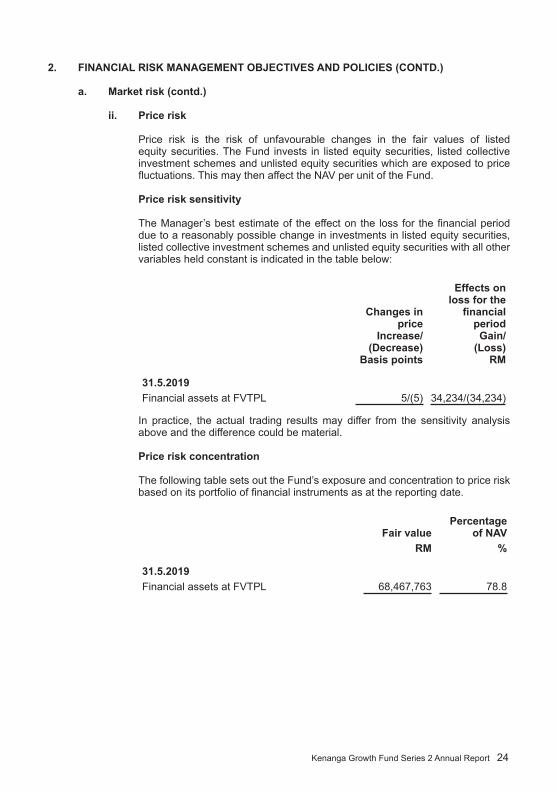
Price risk is the risk of unfavourable changes in the fair values of listed equity securities. The Fund invests in listed equity securities, listed collective investment schemes and unlisted equity securities which are exposed to price fluctuations. This may then affect the NAV per unit of the Fund.
Price risk sensitivity
The Manager’s best estimate of the effect on the loss for the financial period due to a reasonably possible change in investments in listed equity securities, listed collective investment schemes and unlisted equity securities with all other variables held constant is indicated in the table below:
Changes in price
increase/(decrease)
Basis points
Effects on loss for the
financial periodGain/
(loss)RM
31.5.2019Financial assets at FVTPL 5/(5) 34,234/(34,234)
In practice, the actual trading results may differ from the sensitivity analysis above and the difference could be material.
Price risk concentration
The following table sets out the Fund’s exposure and concentration to price risk based on its portfolio of financial instruments as at the reporting date.
fair valuePercentage
of nAVRM %
31.5.2019Financial assets at FVTPL 68,467,763 78.8
25 Kenanga Growth Fund Series 2 Annual Report
2. finAnCiAl RisK MAnAGEMEnT OBJECTiVEs And POliCiEs (COnTd.)
a. Market risk (contd.)
ii. Price risk (contd.)
Price risk concentration (contd.)
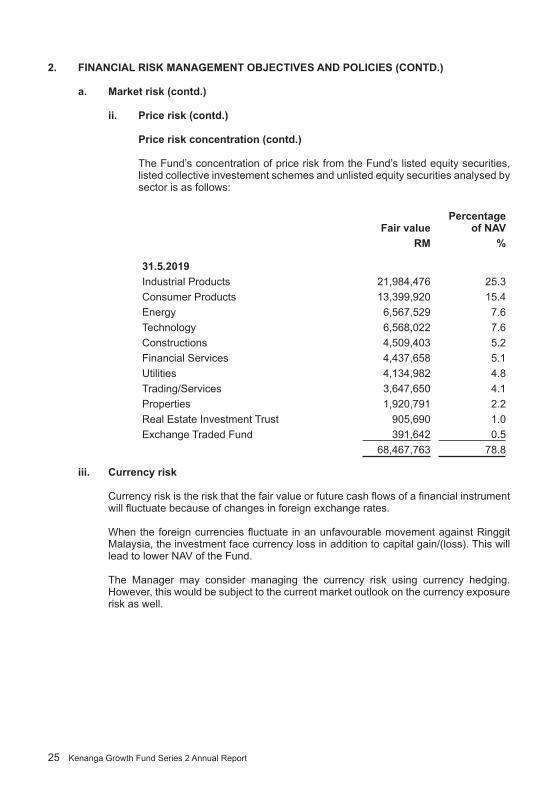
The Fund’s concentration of price risk from the Fund’s listed equity securities, listed collective investement schemes and unlisted equity securities analysed by sector is as follows:
fair valuePercentage
of nAVRM %
31.5.2019Industrial Products 21,984,476 25.3 Consumer Products 13,399,920 15.4 Energy 6,567,529 7.6 Technology 6,568,022 7.6 Constructions 4,509,403 5.2 Financial Services 4,437,658 5.1 Utilities 4,134,982 4.8 Trading/Services 3,647,650 4.1 Properties 1,920,791 2.2 Real Estate Investment Trust 905,690 1.0 Exchange Traded Fund 391,642 0.5
68,467,763 78.8
iii. Currency risk
Currency risk is the risk that the fair value or future cash flows of a financial instrument will fluctuate because of changes in foreign exchange rates.
When the foreign currencies fluctuate in an unfavourable movement against Ringgit Malaysia, the investment face currency loss in addition to capital gain/(loss). This will lead to lower NAV of the Fund.
The Manager may consider managing the currency risk using currency hedging. However, this would be subject to the current market outlook on the currency exposure risk as well.
Kenanga Growth Fund Series 2 Annual Report 26
2. finAnCiAl RisK MAnAGEMEnT OBJECTiVEs And POliCiEs (COnTd.)
a. Market risk (contd.)
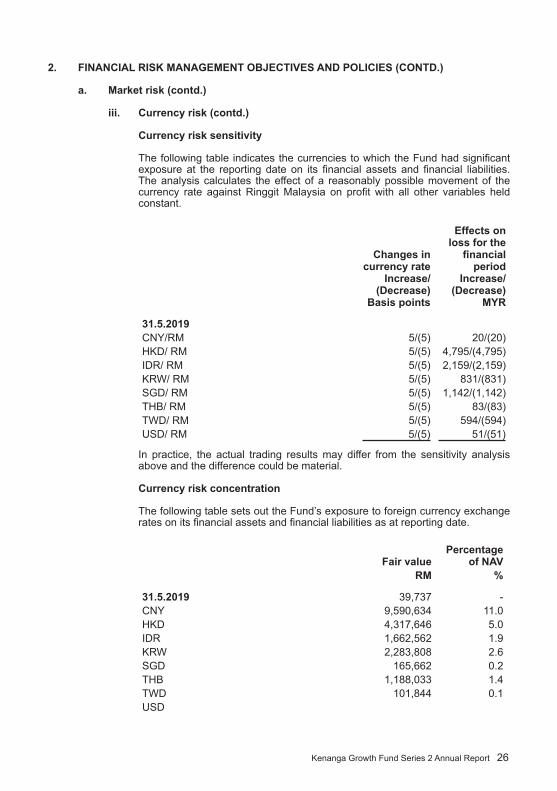
iii. Currency risk (contd.)
Currency risk sensitivity
The following table indicates the currencies to which the Fund had significant exposure at the reporting date on its financial assets and financial liabilities. The analysis calculates the effect of a reasonably possible movement of the currency rate against Ringgit Malaysia on profit with all other variables held constant.
Changes in currency rate
increase/(decrease)
Basis points
Effects on loss for the
financial period
increase/(decrease)
MYR
31.5.2019CNY/RM 5/(5) 20/(20) HKD/ RM 5/(5) 4,795/(4,795) IDR/ RM 5/(5) 2,159/(2,159) KRW/ RM 5/(5) 831/(831) SGD/ RM 5/(5) 1,142/(1,142) THB/ RM 5/(5) 83/(83) TWD/ RM 5/(5) 594/(594) USD/ RM 5/(5) 51/(51)
In practice, the actual trading results may differ from the sensitivity analysis above and the difference could be material.
Currency risk concentration
The following table sets out the Fund’s exposure to foreign currency exchange rates on its financial assets and financial liabilities as at reporting date.
fair valuePercentage
of nAVRM %
31.5.2019 39,737 - CNY 9,590,634 11.0 HKD 4,317,646 5.0 IDR 1,662,562 1.9 KRW 2,283,808 2.6 SGD 165,662 0.2 THB 1,188,033 1.4 TWD 101,844 0.1 USD
27 Kenanga Growth Fund Series 2 Annual Report
2. finAnCiAl RisK MAnAGEMEnT OBJECTiVEs And POliCiEs (COnTd.)
b. Credit risk
Credit risk is the risk that the counterparty to a financial instrument will cause a financial loss to the Fund by failing to discharge an obligation. The Manager manages the credit risk by undertaking credit evaluation to minimise such risk.
i. Credit risk exposure
As at the reporting date, the Fund’s maximum exposure to credit risk is represented by the carrying amount of each class of financial asset recognised in the statement of financial position.
ii. financial assets that are either past due or impaired
As at the reporting date, there are no financial assets that are either past due or impaired.
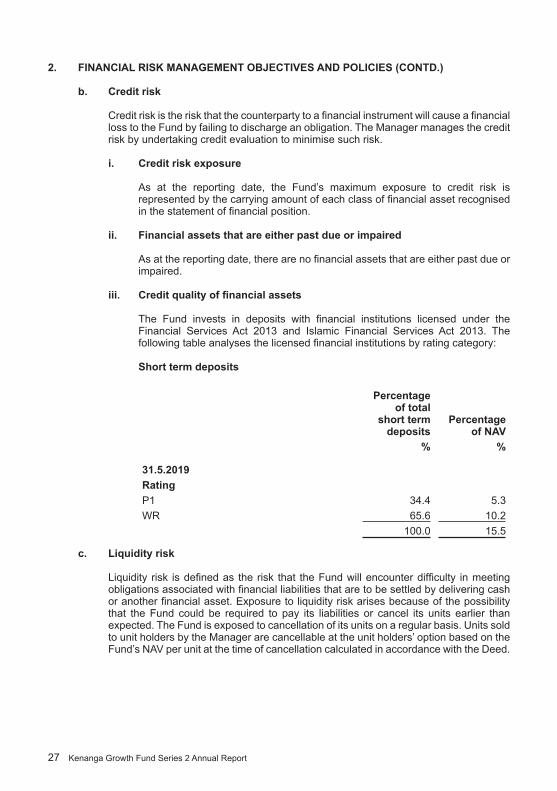
iii. Credit quality of financial assets
The Fund invests in deposits with financial institutions licensed under the Financial Services Act 2013 and Islamic Financial Services Act 2013. The following table analyses the licensed financial institutions by rating category:
short term deposits
Percentage of total
short term deposits
Percentage of nAV
% %
31.5.2019RatingP1 34.4 5.3 WR 65.6 10.2
100.0 15.5
c. liquidity risk
Liquidity risk is defined as the risk that the Fund will encounter difficulty in meeting obligations associated with financial liabilities that are to be settled by delivering cash or another financial asset. Exposure to liquidity risk arises because of the possibility that the Fund could be required to pay its liabilities or cancel its units earlier than expected. The Fund is exposed to cancellation of its units on a regular basis. Units sold to unit holders by the Manager are cancellable at the unit holders’ option based on the Fund’s NAV per unit at the time of cancellation calculated in accordance with the Deed.
Kenanga Growth Fund Series 2 Annual Report 28
2. finAnCiAl RisK MAnAGEMEnT OBJECTiVEs And POliCiEs (COnTd.)
c. liquidity risk (contd.)
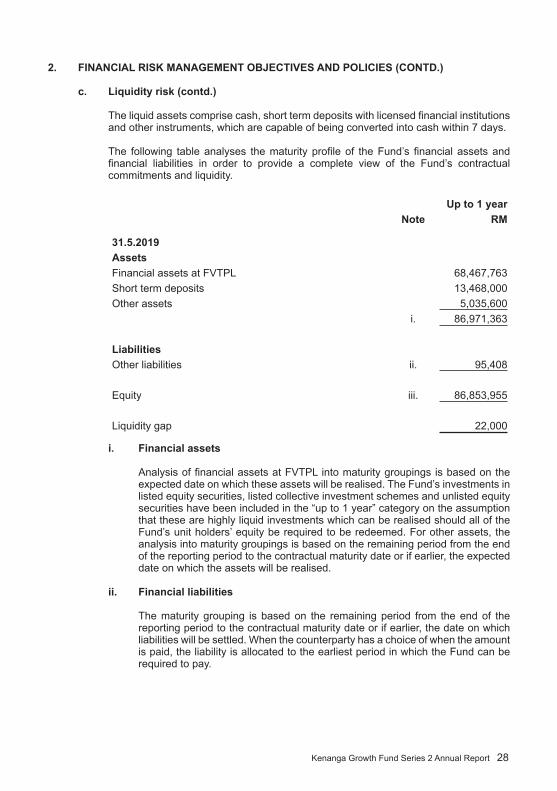
The liquid assets comprise cash, short term deposits with licensed financial institutions and other instruments, which are capable of being converted into cash within 7 days.
The following table analyses the maturity profile of the Fund’s financial assets and financial liabilities in order to provide a complete view of the Fund’s contractual commitments and liquidity.
up to 1 yearnote RM
31.5.2019AssetsFinancial assets at FVTPL 68,467,763 Short term deposits 13,468,000 Other assets 5,035,600
i. 86,971,363
liabilitiesOther liabilities ii. 95,408
Equity iii. 86,853,955
Liquidity gap 22,000
i. financial assets
Analysis of financial assets at FVTPL into maturity groupings is based on the expected date on which these assets will be realised. The Fund’s investments in listed equity securities, listed collective investment schemes and unlisted equity securities have been included in the “up to 1 year” category on the assumption that these are highly liquid investments which can be realised should all of the Fund’s unit holders’ equity be required to be redeemed. For other assets, the analysis into maturity groupings is based on the remaining period from the end of the reporting period to the contractual maturity date or if earlier, the expected date on which the assets will be realised.
ii. financial liabilities
The maturity grouping is based on the remaining period from the end of the reporting period to the contractual maturity date or if earlier, the date on which liabilities will be settled. When the counterparty has a choice of when the amount is paid, the liability is allocated to the earliest period in which the Fund can be required to pay.
29 Kenanga Growth Fund Series 2 Annual Report
2. finAnCiAl RisK MAnAGEMEnT OBJECTiVEs And POliCiEs (COnTd.)
c. liquidity risk (contd.)
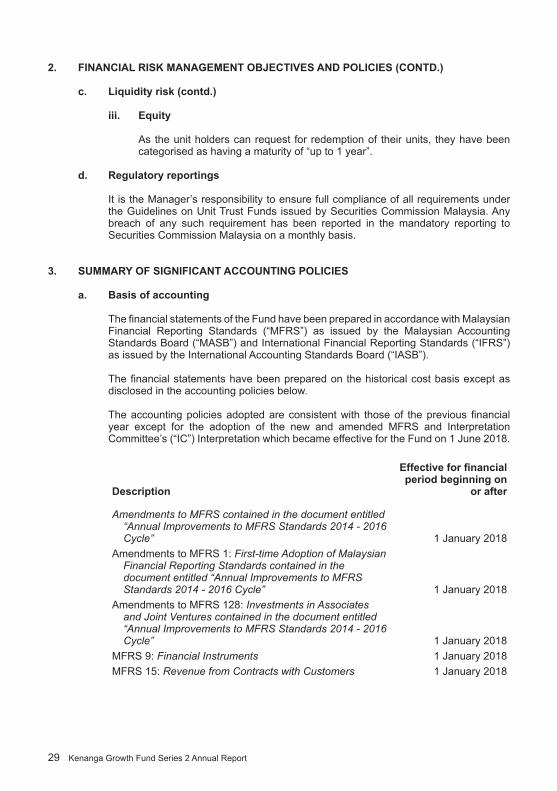
iii. Equity
As the unit holders can request for redemption of their units, they have been categorised as having a maturity of “up to 1 year”.
d. Regulatory reportings
It is the Manager’s responsibility to ensure full compliance of all requirements under the Guidelines on Unit Trust Funds issued by Securities Commission Malaysia. Any breach of any such requirement has been reported in the mandatory reporting to Securities Commission Malaysia on a monthly basis.
3. suMMARY Of siGnifiCAnT ACCOunTinG POliCiEs
a. Basis of accounting
The financial statements of the Fund have been prepared in accordance with Malaysian Financial Reporting Standards (“MFRS”) as issued by the Malaysian Accounting Standards Board (“MASB”) and International Financial Reporting Standards (“IFRS”) as issued by the International Accounting Standards Board (“IASB”).
The financial statements have been prepared on the historical cost basis except as disclosed in the accounting policies below.
The accounting policies adopted are consistent with those of the previous financial year except for the adoption of the new and amended MFRS and Interpretation Committee’s (“IC”) Interpretation which became effective for the Fund on 1 June 2018.
description
Effective for financial period beginning on
or after
Amendments to MFRS contained in the document entitled “AnnualImprovementstoMFRSStandards2014-2016Cycle” 1 January 2018
Amendments to MFRS 1:First-timeAdoptionofMalaysianFinancial Reporting Standards contained in the document entitled “Annual Improvements to MFRS Standards2014-2016Cycle” 1 January 2018
Amendments to MFRS 128: Investments in Associates and Joint Ventures contained in the document entitled “AnnualImprovementstoMFRSStandards2014-2016Cycle” 1 January 2018
MFRS 9: Financial Instruments 1 January 2018MFRS 15:RevenuefromContractswithCustomers 1 January 2018
Kenanga Growth Fund Series 2 Annual Report 30
3. suMMARY Of siGnifiCAnT ACCOunTinG POliCiEs (COnTd.)
a. Basis of accounting (contd.)
description
Effective for financial period beginning on
or after
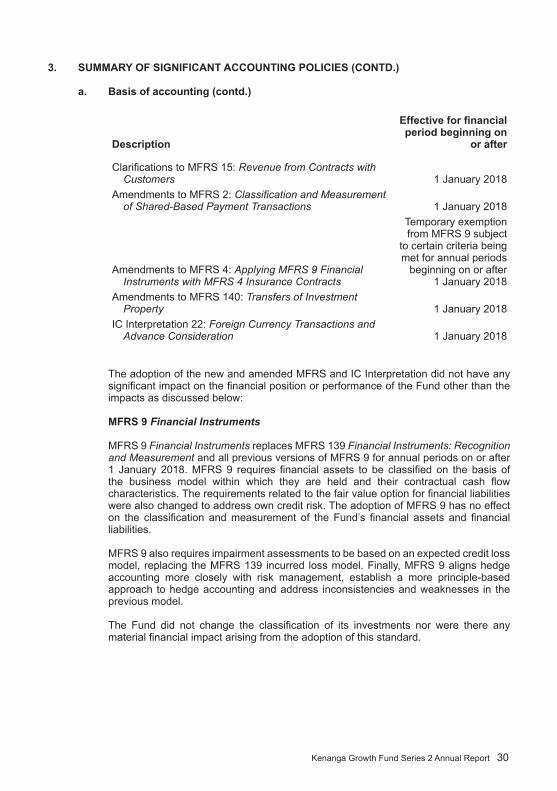
Clarifications to MFRS 15:RevenuefromContractswithCustomers 1 January 2018
Amendments to MFRS 2: ClassificationandMeasurementofShared-BasedPaymentTransactions 1 January 2018
Amendments to MFRS 4: Applying MFRS 9 Financial InstrumentswithMFRS4InsuranceContracts
Temporary exemption from MFRS 9 subject
to certain criteria being met for annual periods
beginning on or after1 January 2018
Amendments to MFRS 140: Transfers of Investment Property 1 January 2018
IC Interpretation 22: Foreign Currency Transactions and Advance Consideration 1 January 2018
The adoption of the new and amended MFRS and IC Interpretation did not have any
significant impact on the financial position or performance of the Fund other than the impacts as discussed below:
MfRs 9 Financial Instruments
MFRS 9 Financial Instruments replaces MFRS 139 Financial Instruments: Recognition and Measurement and all previous versions of MFRS 9 for annual periods on or after 1 January 2018. MFRS 9 requires financial assets to be classified on the basis of the business model within which they are held and their contractual cash flow characteristics. The requirements related to the fair value option for financial liabilities were also changed to address own credit risk. The adoption of MFRS 9 has no effect on the classification and measurement of the Fund’s financial assets and financial liabilities.
MFRS 9 also requires impairment assessments to be based on an expected credit loss model, replacing the MFRS 139 incurred loss model. Finally, MFRS 9 aligns hedge accounting more closely with risk management, establish a more principle-based approach to hedge accounting and address inconsistencies and weaknesses in the previous model.
The Fund did not change the classification of its investments nor were there any material financial impact arising from the adoption of this standard.
31 Kenanga Growth Fund Series 2 Annual Report
3. suMMARY Of siGnifiCAnT ACCOunTinG POliCiEs (COnTd.)
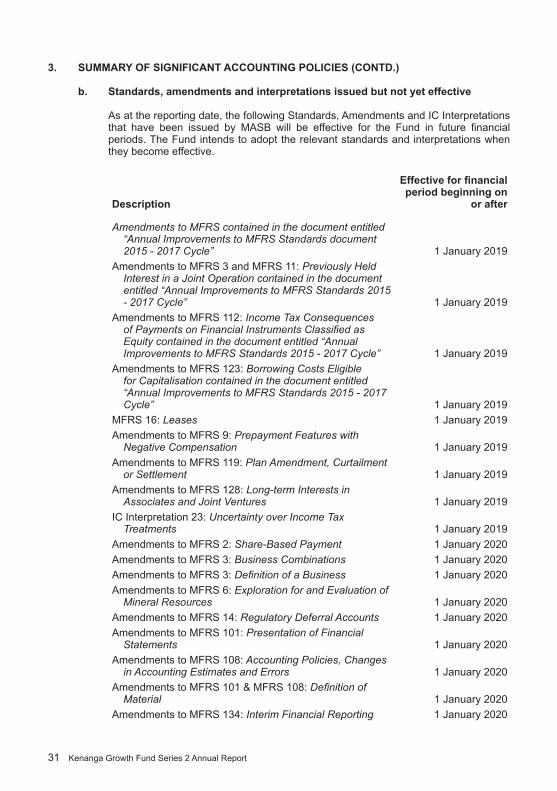
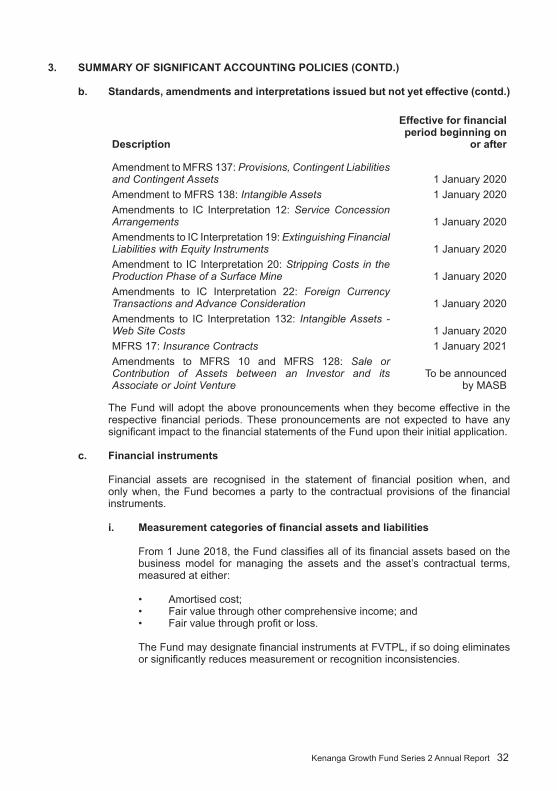
b. standards, amendments and interpretations issued but not yet effective
As at the reporting date, the following Standards, Amendments and IC Interpretations that have been issued by MASB will be effective for the Fund in future financial periods. The Fund intends to adopt the relevant standards and interpretations when they become effective.
description
Effective for financial period beginning on
or after
Amendments to MFRS contained in the document entitled “Annual Improvements to MFRS Standards document 2015-2017Cycle” 1 January 2019
Amendments to MFRS 3 and MFRS 11: Previously Held Interest in a Joint Operation contained in the document entitled“AnnualImprovementstoMFRSStandards2015-2017Cycle” 1 January 2019
Amendments to MFRS 112: Income Tax Consequences ofPaymentsonFinancialInstrumentsClassifiedasEquity contained in the document entitled “Annual ImprovementstoMFRSStandards2015-2017Cycle” 1 January 2019
Amendments to MFRS 123:BorrowingCostsEligiblefor Capitalisation contained in the document entitled “AnnualImprovementstoMFRSStandards2015-2017Cycle” 1 January 2019
MFRS 16: Leases 1 January 2019Amendments to MFRS 9:PrepaymentFeatureswith
Negative Compensation 1 January 2019Amendments to MFRS 119:PlanAmendment,Curtailment
or Settlement 1 January 2019Amendments to MFRS 128:Long-termInterestsin
Associates and Joint Ventures 1 January 2019IC Interpretation 23: Uncertainty over Income Tax
Treatments 1 January 2019Amendments to MFRS 2:Share-BasedPayment 1 January 2020Amendments to MFRS 3: Business Combinations 1 January 2020Amendments to MFRS 3:DefinitionofaBusiness 1 January 2020Amendments to MFRS 6: Exploration for and Evaluation of
Mineral Resources 1 January 2020Amendments to MFRS 14: Regulatory Deferral Accounts 1 January 2020Amendments to MFRS 101: Presentation of Financial
Statements 1 January 2020Amendments to MFRS 108:AccountingPolicies,Changes
in Accounting Estimates and Errors 1 January 2020Amendments to MFRS 101 & MFRS 108:Definitionof
Material 1 January 2020Amendments to MFRS 134: Interim Financial Reporting 1 January 2020
Kenanga Growth Fund Series 2 Annual Report 32
3. suMMARY Of siGnifiCAnT ACCOunTinG POliCiEs (COnTd.)
b. standards, amendments and interpretations issued but not yet effective (contd.)
description
Effective for financial period beginning on
or after
Amendment to MFRS 137: Provisions,ContingentLiabilitiesand Contingent Assets 1 January 2020Amendment to MFRS 138: Intangible Assets 1 January 2020Amendments to IC Interpretation 12: Service Concession Arrangements 1 January 2020Amendments to IC Interpretation 19: Extinguishing Financial LiabilitieswithEquityInstruments 1 January 2020Amendment to IC Interpretation 20: Stripping Costs in the Production Phase of a Surface Mine 1 January 2020Amendments to IC Interpretation 22: Foreign Currency Transactions and Advance Consideration 1 January 2020Amendments to IC Interpretation 132: IntangibleAssets -Web Site Costs 1 January 2020MFRS 17: Insurance Contracts 1 January 2021Amendments to MFRS 10 and MFRS 128: Sale or Contribution of Assets between an Investor and itsAssociate or Joint Venture
To be announcedby MASB
The Fund will adopt the above pronouncements when they become effective in the respective financial periods. These pronouncements are not expected to have any significant impact to the financial statements of the Fund upon their initial application.
c. financial instruments
Financial assets are recognised in the statement of financial position when, and only when, the Fund becomes a party to the contractual provisions of the financial instruments.
i. Measurement categories of financial assets and liabilities
From 1 June 2018, the Fund classifies all of its financial assets based on the business model for managing the assets and the asset’s contractual terms, measured at either:
• Amortised cost;• Fair value through other comprehensive income; and• Fair value through profit or loss.
The Fund may designate financial instruments at FVTPL, if so doing eliminates or significantly reduces measurement or recognition inconsistencies.

33 Kenanga Growth Fund Series 2 Annual Report
3. suMMARY Of siGnifiCAnT ACCOunTinG POliCiEs (COnTd.)
c. financial instruments (contd.)
i. Measurement categories of financial assets and liabilities (contd.)
The Fund’s other financial assets include cash and bank balances, short term deposits and other receivables. Prior to 1 June 2018, the Fund classified its other financial assets as receivables (amortised cost), as explained in Note 3(c)(iii).
Financial liabilities are classified according to the substance of the contractual arrangements entered into and the definitions of a financial liability. Financial liabilities are classified as either financial liabilities at FVTPL or other financial liabilities.
The Fund’s other financial liabilities include trade payables and other payables.
Other financial liabilities are recognised initially at fair value plus directly attributable transaction costs and subsequently measured at amortised cost using the effective interest rate. Gains or losses are recognised in profit or loss when the liabilities are derecognised, and through the amortisation process.
ii. initial recognition and subsequent measurement
The classification of financial assets at initial recognition depends on their contractual terms and the business model for managing the instruments, as described in Note 3(c)(iii). Financial assets are initially measured at their fair value, except in the case of financial assets recorded at FVTPL, transaction costs are added to, or subtracted from, this amount. Trade receivables are measured at the transaction price. When the fair value of financial instruments at initial recognition differs from the transaction price, the Fund accounts for the Day 1 profit or loss, as described below.
After initial measurement, debt instruments are measured at amortised cost, using the effective interest rate (“EIR”) method, less allowance for impairment. Amortised cost is calculated by taking into account any discount or premium on acquisition and fee or costs that are an integral part of the EIR. Expected credit losses (“ECLs”) are recognised in the statement of comprehensive income when the investments are impaired.
Financial assets at FVTPL are recorded in the statement of financial position at fair value. Changes in fair value are recorded in profit or loss.
iii. due from banks, short term deposits, trade and other receivables at amortised cost
Prior to 1 June 2018, included in the financial assets are cash and bank balances, short term deposits and other receivables including receivables which are those non–derivative financial assets with fixed or determinable payments that were not quoted in an active market.
Kenanga Growth Fund Series 2 Annual Report 34
3. suMMARY Of siGnifiCAnT ACCOunTinG POliCiEs (COnTd.)
c. financial instruments (contd.)
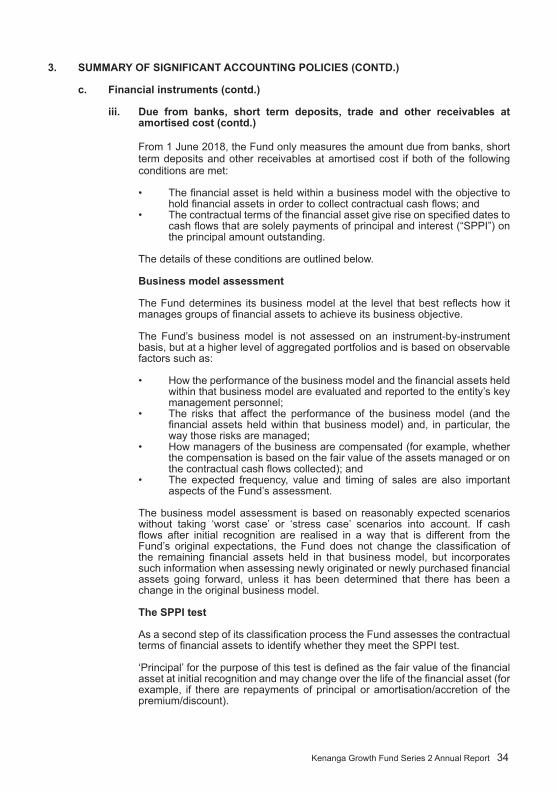
iii. due from banks, short term deposits, trade and other receivables at amortised cost (contd.)
From 1 June 2018, the Fund only measures the amount due from banks, short term deposits and other receivables at amortised cost if both of the following conditions are met:
• The financial asset is held within a business model with the objective to hold financial assets in order to collect contractual cash flows; and
• The contractual terms of the financial asset give rise on specified dates to cash flows that are solely payments of principal and interest (“SPPI”) on the principal amount outstanding.
The details of these conditions are outlined below.
Business model assessment
The Fund determines its business model at the level that best reflects how it manages groups of financial assets to achieve its business objective.
The Fund’s business model is not assessed on an instrument-by-instrument basis, but at a higher level of aggregated portfolios and is based on observable factors such as:
• How the performance of the business model and the financial assets held within that business model are evaluated and reported to the entity’s key management personnel;
• The risks that affect the performance of the business model (and the financial assets held within that business model) and, in particular, the way those risks are managed;
• How managers of the business are compensated (for example, whether the compensation is based on the fair value of the assets managed or on the contractual cash flows collected); and
• The expected frequency, value and timing of sales are also important aspects of the Fund’s assessment.
The business model assessment is based on reasonably expected scenarios without taking ‘worst case’ or ‘stress case’ scenarios into account. If cash flows after initial recognition are realised in a way that is different from the Fund’s original expectations, the Fund does not change the classification of the remaining financial assets held in that business model, but incorporates such information when assessing newly originated or newly purchased financial assets going forward, unless it has been determined that there has been a change in the original business model.
The sPPi test
As a second step of its classification process the Fund assesses the contractual terms of financial assets to identify whether they meet the SPPI test.
‘Principal’ for the purpose of this test is defined as the fair value of the financial asset at initial recognition and may change over the life of the financial asset (for example, if there are repayments of principal or amortisation/accretion of the premium/discount).
35 Kenanga Growth Fund Series 2 Annual Report
3. suMMARY Of siGnifiCAnT ACCOunTinG POliCiEs (COnTd.)
c. financial instruments (contd.)
iii. due from banks, short term deposits, trade and other receivables at amortised cost (contd.)
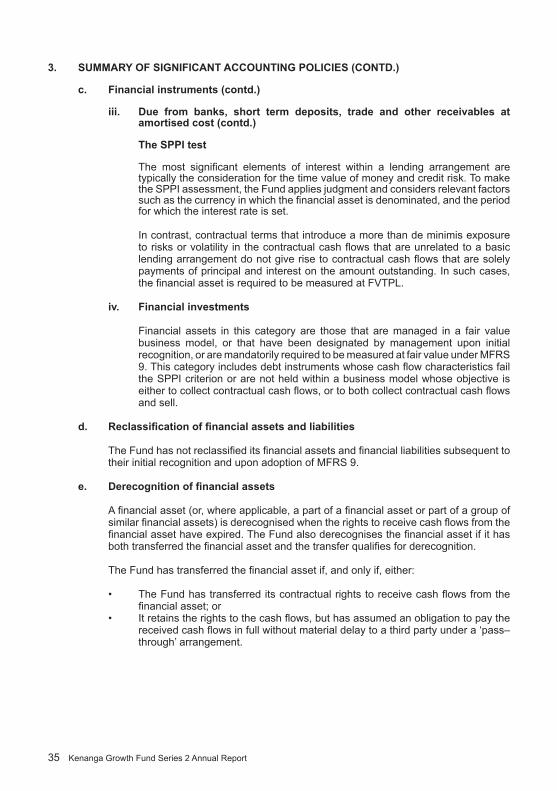
The sPPi test
The most significant elements of interest within a lending arrangement are typically the consideration for the time value of money and credit risk. To make the SPPI assessment, the Fund applies judgment and considers relevant factors such as the currency in which the financial asset is denominated, and the period for which the interest rate is set.
In contrast, contractual terms that introduce a more than de minimis exposure to risks or volatility in the contractual cash flows that are unrelated to a basic lending arrangement do not give rise to contractual cash flows that are solely payments of principal and interest on the amount outstanding. In such cases, the financial asset is required to be measured at FVTPL.
iv. financial investments
Financial assets in this category are those that are managed in a fair value business model, or that have been designated by management upon initial recognition, or are mandatorily required to be measured at fair value under MFRS 9. This category includes debt instruments whose cash flow characteristics fail the SPPI criterion or are not held within a business model whose objective is either to collect contractual cash flows, or to both collect contractual cash flows and sell.
d. Reclassification of financial assets and liabilities
The Fund has not reclassified its financial assets and financial liabilities subsequent to their initial recognition and upon adoption of MFRS 9.
e. Derecognition of financial assets
A financial asset (or, where applicable, a part of a financial asset or part of a group of similar financial assets) is derecognised when the rights to receive cash flows from the financial asset have expired. The Fund also derecognises the financial asset if it has both transferred the financial asset and the transfer qualifies for derecognition.
The Fund has transferred the financial asset if, and only if, either:
• The Fund has transferred its contractual rights to receive cash flows from the financial asset; or
• It retains the rights to the cash flows, but has assumed an obligation to pay the received cash flows in full without material delay to a third party under a ‘pass–through’ arrangement.
Kenanga Growth Fund Series 2 Annual Report 36
3. suMMARY Of siGnifiCAnT ACCOunTinG POliCiEs (COnTd.)
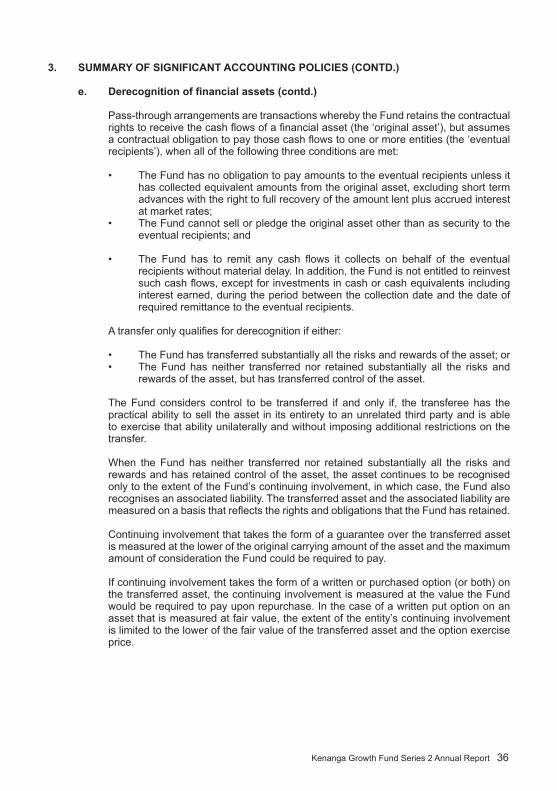
e. Derecognition of financial assets (contd.)
Pass-through arrangements are transactions whereby the Fund retains the contractual rights to receive the cash flows of a financial asset (the ‘original asset’), but assumes a contractual obligation to pay those cash flows to one or more entities (the ‘eventual recipients’), when all of the following three conditions are met:
• The Fund has no obligation to pay amounts to the eventual recipients unless it has collected equivalent amounts from the original asset, excluding short term advances with the right to full recovery of the amount lent plus accrued interest at market rates;
• The Fund cannot sell or pledge the original asset other than as security to the eventual recipients; and
• The Fund has to remit any cash flows it collects on behalf of the eventual recipients without material delay. In addition, the Fund is not entitled to reinvest such cash flows, except for investments in cash or cash equivalents including interest earned, during the period between the collection date and the date of required remittance to the eventual recipients.
A transfer only qualifies for derecognition if either:
• The Fund has transferred substantially all the risks and rewards of the asset; or• The Fund has neither transferred nor retained substantially all the risks and
rewards of the asset, but has transferred control of the asset.
The Fund considers control to be transferred if and only if, the transferee has the practical ability to sell the asset in its entirety to an unrelated third party and is able to exercise that ability unilaterally and without imposing additional restrictions on the transfer.
When the Fund has neither transferred nor retained substantially all the risks and rewards and has retained control of the asset, the asset continues to be recognised only to the extent of the Fund’s continuing involvement, in which case, the Fund also recognises an associated liability. The transferred asset and the associated liability are measured on a basis that reflects the rights and obligations that the Fund has retained.
Continuing involvement that takes the form of a guarantee over the transferred asset is measured at the lower of the original carrying amount of the asset and the maximum amount of consideration the Fund could be required to pay.
If continuing involvement takes the form of a written or purchased option (or both) on the transferred asset, the continuing involvement is measured at the value the Fund would be required to pay upon repurchase. In the case of a written put option on an asset that is measured at fair value, the extent of the entity’s continuing involvement is limited to the lower of the fair value of the transferred asset and the option exercise price.
37 Kenanga Growth Fund Series 2 Annual Report
3. suMMARY Of siGnifiCAnT ACCOunTinG POliCiEs (COnTd.)
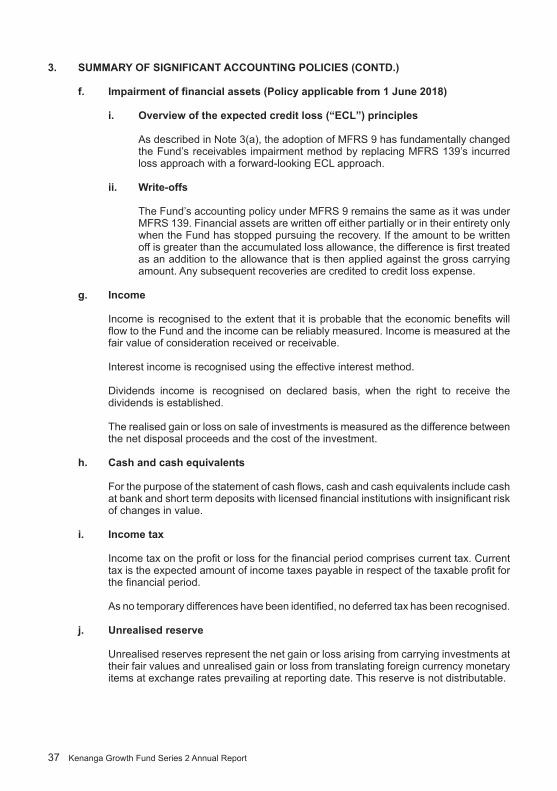
f. Impairment of financial assets (Policy applicable from 1 June 2018)
i. Overview of the expected credit loss (“ECl”) principles
As described in Note 3(a), the adoption of MFRS 9 has fundamentally changed the Fund’s receivables impairment method by replacing MFRS 139’s incurred loss approach with a forward-looking ECL approach.
ii. write-offs
The Fund’s accounting policy under MFRS 9 remains the same as it was under MFRS 139. Financial assets are written off either partially or in their entirety only when the Fund has stopped pursuing the recovery. If the amount to be written off is greater than the accumulated loss allowance, the difference is first treated as an addition to the allowance that is then applied against the gross carrying amount. Any subsequent recoveries are credited to credit loss expense.
g. income
Income is recognised to the extent that it is probable that the economic benefits will flow to the Fund and the income can be reliably measured. Income is measured at the fair value of consideration received or receivable.
Interest income is recognised using the effective interest method.
Dividends income is recognised on declared basis, when the right to receive the dividends is established.
The realised gain or loss on sale of investments is measured as the difference between the net disposal proceeds and the cost of the investment.
h. Cash and cash equivalents
For the purpose of the statement of cash flows, cash and cash equivalents include cash at bank and short term deposits with licensed financial institutions with insignificant risk of changes in value.
i. income tax
Income tax on the profit or loss for the financial period comprises current tax. Current tax is the expected amount of income taxes payable in respect of the taxable profit for the financial period.
As no temporary differences have been identified, no deferred tax has been recognised.
j. unrealised reserve
Unrealised reserves represent the net gain or loss arising from carrying investments at their fair values and unrealised gain or loss from translating foreign currency monetary items at exchange rates prevailing at reporting date. This reserve is not distributable.
Kenanga Growth Fund Series 2 Annual Report 38
3. suMMARY Of siGnifiCAnT ACCOunTinG POliCiEs (COnTd.)
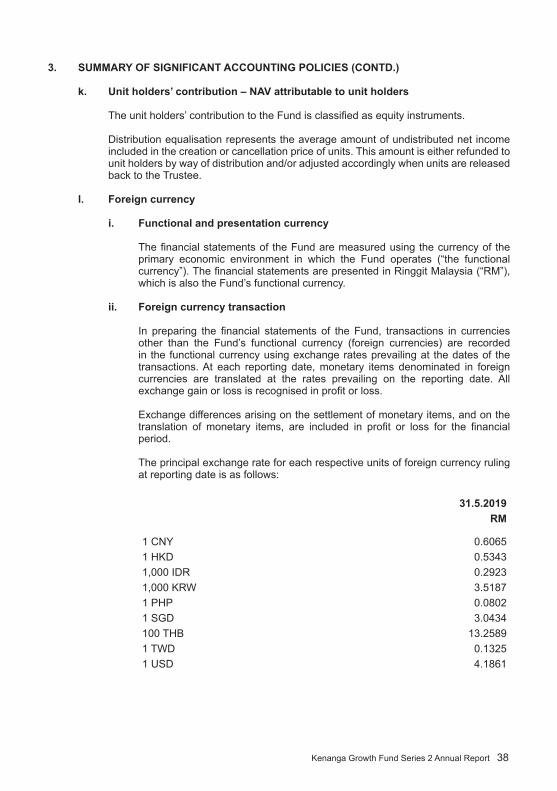
k. unit holders’ contribution – nAV attributable to unit holders
The unit holders’ contribution to the Fund is classified as equity instruments.
Distribution equalisation represents the average amount of undistributed net income included in the creation or cancellation price of units. This amount is either refunded to unit holders by way of distribution and/or adjusted accordingly when units are released back to the Trustee.
l. foreign currency
i. functional and presentation currency
The financial statements of the Fund are measured using the currency of the primary economic environment in which the Fund operates (“the functional currency”). The financial statements are presented in Ringgit Malaysia (“RM”), which is also the Fund’s functional currency.
ii. foreign currency transaction
In preparing the financial statements of the Fund, transactions in currencies other than the Fund’s functional currency (foreign currencies) are recorded in the functional currency using exchange rates prevailing at the dates of the transactions. At each reporting date, monetary items denominated in foreign currencies are translated at the rates prevailing on the reporting date. All exchange gain or loss is recognised in profit or loss.
Exchange differences arising on the settlement of monetary items, and on the translation of monetary items, are included in profit or loss for the financial period.
The principal exchange rate for each respective units of foreign currency ruling at reporting date is as follows:
31.5.2019RM
1 CNY 0.60651 HKD 0.53431,000 IDR 0.29231,000 KRW 3.51871 PHP 0.08021 SGD 3.0434100 THB 13.25891 TWD 0.13251 USD 4.1861
39 Kenanga Growth Fund Series 2 Annual Report
3. suMMARY Of siGnifiCAnT ACCOunTinG POliCiEs (COnTd.)
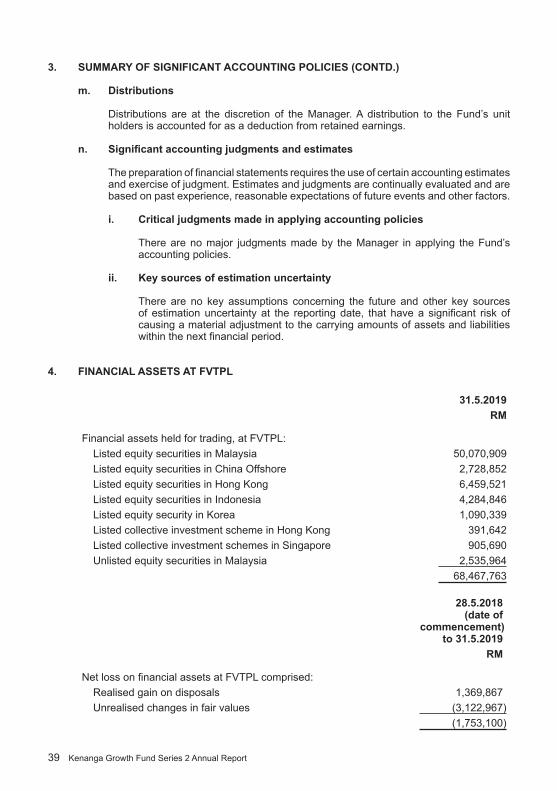
m. distributions
Distributions are at the discretion of the Manager. A distribution to the Fund’s unit holders is accounted for as a deduction from retained earnings.
n. Significant accounting judgments and estimates
The preparation of financial statements requires the use of certain accounting estimates and exercise of judgment. Estimates and judgments are continually evaluated and are based on past experience, reasonable expectations of future events and other factors.
i. Critical judgments made in applying accounting policies
There are no major judgments made by the Manager in applying the Fund’s accounting policies.
ii. Key sources of estimation uncertainty
There are no key assumptions concerning the future and other key sources of estimation uncertainty at the reporting date, that have a significant risk of causing a material adjustment to the carrying amounts of assets and liabilities within the next financial period.
4. finAnCiAl AssETs AT fVTPl
31.5.2019RM
Financial assets held for trading, at FVTPL:Listed equity securities in Malaysia 50,070,909 Listed equity securities in China Offshore 2,728,852 Listed equity securities in Hong Kong 6,459,521 Listed equity securities in Indonesia 4,284,846 Listed equity security in Korea 1,090,339 Listed collective investment scheme in Hong Kong 391,642 Listed collective investment schemes in Singapore 905,690 Unlisted equity securities in Malaysia 2,535,964
68,467,763
28.5.2018 (date of
commencement) to 31.5.2019
RM
Net loss on financial assets at FVTPL comprised:Realised gain on disposals 1,369,867 Unrealised changes in fair values (3,122,967)
(1,753,100)
Kenanga Growth Fund Series 2 Annual Report 40
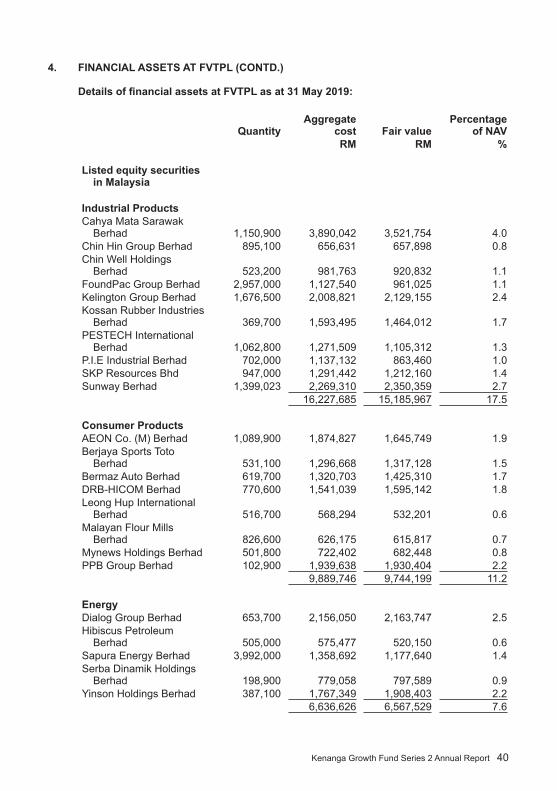
4. finAnCiAl AssETs AT fVTPl (COnTd.)
Details of financial assets at FVTPL as at 31 May 2019:
Quantity Aggregate
cost fair value Percentage
of nAVRM RM %
listed equity securities
in Malaysia industrial ProductsCahya Mata Sarawak
Berhad 1,150,900 3,890,042 3,521,754 4.0 Chin Hin Group Berhad 895,100 656,631 657,898 0.8 Chin Well Holdings
Berhad 523,200 981,763 920,832 1.1 FoundPac Group Berhad 2,957,000 1,127,540 961,025 1.1 Kelington Group Berhad 1,676,500 2,008,821 2,129,155 2.4 Kossan Rubber Industries
Berhad 369,700 1,593,495 1,464,012 1.7 PESTECH International
Berhad 1,062,800 1,271,509 1,105,312 1.3 P.I.E Industrial Berhad 702,000 1,137,132 863,460 1.0 SKP Resources Bhd 947,000 1,291,442 1,212,160 1.4 Sunway Berhad 1,399,023 2,269,310 2,350,359 2.7
16,227,685 15,185,967 17.5
Consumer ProductsAEON Co. (M) Berhad 1,089,900 1,874,827 1,645,749 1.9 Berjaya Sports Toto
Berhad 531,100 1,296,668 1,317,128 1.5 Bermaz Auto Berhad 619,700 1,320,703 1,425,310 1.7 DRB-HICOM Berhad 770,600 1,541,039 1,595,142 1.8 Leong Hup International
Berhad 516,700 568,294 532,201 0.6 Malayan Flour Mills
Berhad 826,600 626,175 615,817 0.7 Mynews Holdings Berhad 501,800 722,402 682,448 0.8 PPB Group Berhad 102,900 1,939,638 1,930,404 2.2
9,889,746 9,744,199 11.2
EnergyDialog Group Berhad 653,700 2,156,050 2,163,747 2.5 Hibiscus Petroleum
Berhad 505,000 575,477 520,150 0.6 Sapura Energy Berhad 3,992,000 1,358,692 1,177,640 1.4 Serba Dinamik Holdings
Berhad 198,900 779,058 797,589 0.9 Yinson Holdings Berhad 387,100 1,767,349 1,908,403 2.2
6,636,626 6,567,529 7.6
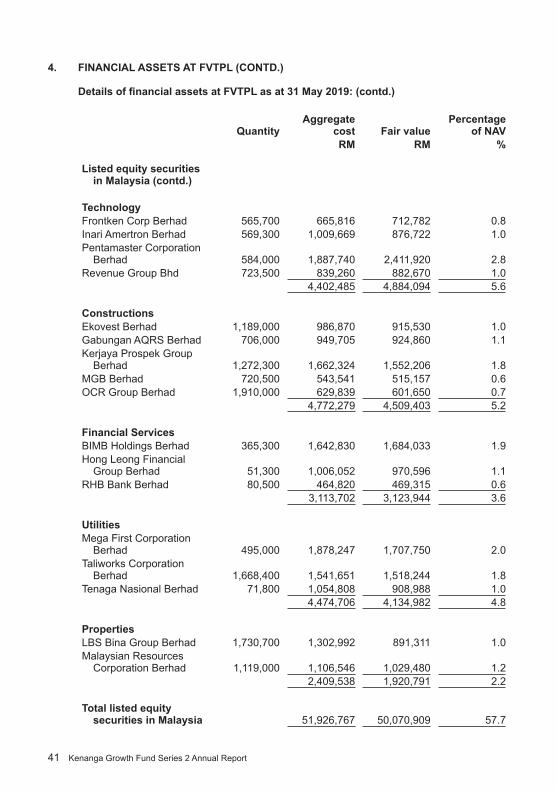
41 Kenanga Growth Fund Series 2 Annual Report
4. finAnCiAl AssETs AT fVTPl (COnTd.)
Details of financial assets at FVTPL as at 31 May 2019: (contd.)
Quantity Aggregate
cost fair value Percentage
of nAV RM RM %
listed equity securities
in Malaysia (contd.) TechnologyFrontken Corp Berhad 565,700 665,816 712,782 0.8 Inari Amertron Berhad 569,300 1,009,669 876,722 1.0 Pentamaster Corporation
Berhad 584,000 1,887,740 2,411,920 2.8 Revenue Group Bhd 723,500 839,260 882,670 1.0
4,402,485 4,884,094 5.6
ConstructionsEkovest Berhad 1,189,000 986,870 915,530 1.0 Gabungan AQRS Berhad 706,000 949,705 924,860 1.1 Kerjaya Prospek Group
Berhad 1,272,300 1,662,324 1,552,206 1.8 MGB Berhad 720,500 543,541 515,157 0.6 OCR Group Berhad 1,910,000 629,839 601,650 0.7
4,772,279 4,509,403 5.2
financial servicesBIMB Holdings Berhad 365,300 1,642,830 1,684,033 1.9 Hong Leong Financial
Group Berhad 51,300 1,006,052 970,596 1.1 RHB Bank Berhad 80,500 464,820 469,315 0.6
3,113,702 3,123,944 3.6
utilitiesMega First Corporation
Berhad 495,000 1,878,247 1,707,750 2.0Taliworks Corporation
Berhad 1,668,400 1,541,651 1,518,244 1.8Tenaga Nasional Berhad 71,800 1,054,808 908,988 1.0
4,474,706 4,134,982 4.8
PropertiesLBS Bina Group Berhad 1,730,700 1,302,992 891,311 1.0 Malaysian Resources
Corporation Berhad 1,119,000 1,106,546 1,029,480 1.2 2,409,538 1,920,791 2.2
Total listed equity securities in Malaysia 51,926,767 50,070,909 57.7
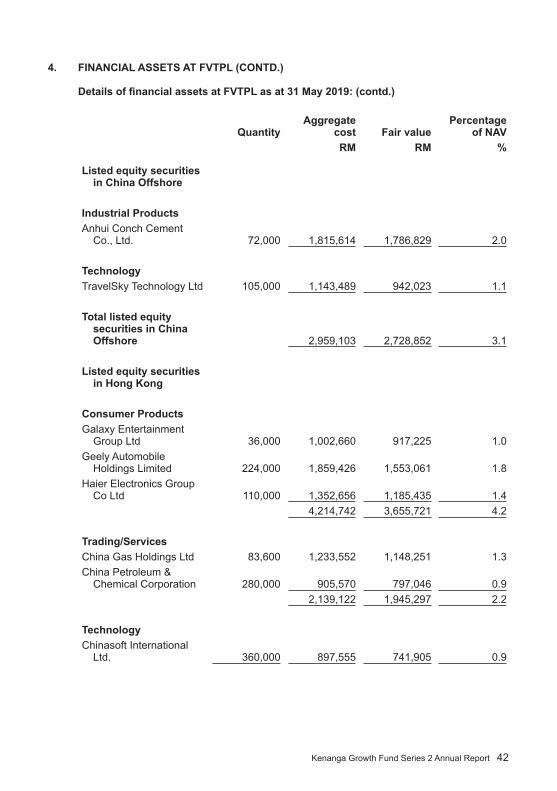
Kenanga Growth Fund Series 2 Annual Report 42
4. finAnCiAl AssETs AT fVTPl (COnTd.)
Details of financial assets at FVTPL as at 31 May 2019: (contd.)
Quantity Aggregate
cost fair value Percentage
of nAVRM RM %
listed equity securities in China Offshore
industrial ProductsAnhui Conch Cement
Co., Ltd. 72,000 1,815,614 1,786,829 2.0
TechnologyTravelSky Technology Ltd 105,000 1,143,489 942,023 1.1
Total listed equity securities in China Offshore 2,959,103 2,728,852 3.1
listed equity securities in hong Kong
Consumer ProductsGalaxy Entertainment
Group Ltd 36,000 1,002,660 917,225 1.0 Geely Automobile
Holdings Limited 224,000 1,859,426 1,553,061 1.8 Haier Electronics Group
Co Ltd 110,000 1,352,656 1,185,435 1.4 4,214,742 3,655,721 4.2
Trading/servicesChina Gas Holdings Ltd 83,600 1,233,552 1,148,251 1.3 China Petroleum &
Chemical Corporation 280,000 905,570 797,046 0.9 2,139,122 1,945,297 2.2
TechnologyChinasoft International
Ltd. 360,000 897,555 741,905 0.9
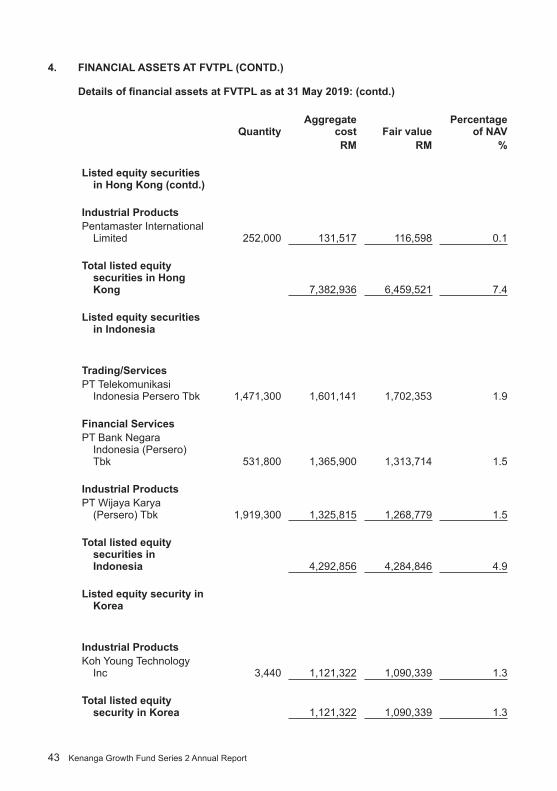
43 Kenanga Growth Fund Series 2 Annual Report
4. finAnCiAl AssETs AT fVTPl (COnTd.)
Details of financial assets at FVTPL as at 31 May 2019: (contd.)
Quantity Aggregate
cost fair value Percentage
of nAV RM RM %
listed equity securities
in hong Kong (contd.) industrial ProductsPentamaster International
Limited 252,000 131,517 116,598 0.1
Total listed equity securities in hong Kong 7,382,936 6,459,521 7.4
listed equity securities in indonesia
Trading/servicesPT Telekomunikasi
Indonesia Persero Tbk 1,471,300 1,601,141 1,702,353 1.9
financial servicesPT Bank Negara
Indonesia (Persero) Tbk 531,800 1,365,900 1,313,714 1.5
industrial ProductsPT Wijaya Karya
(Persero) Tbk 1,919,300 1,325,815 1,268,779 1.5
Total listed equity securities in indonesia 4,292,856 4,284,846 4.9
listed equity security in Korea
industrial ProductsKoh Young Technology
Inc 3,440 1,121,322 1,090,339 1.3
Total listed equity security in Korea 1,121,322 1,090,339 1.3
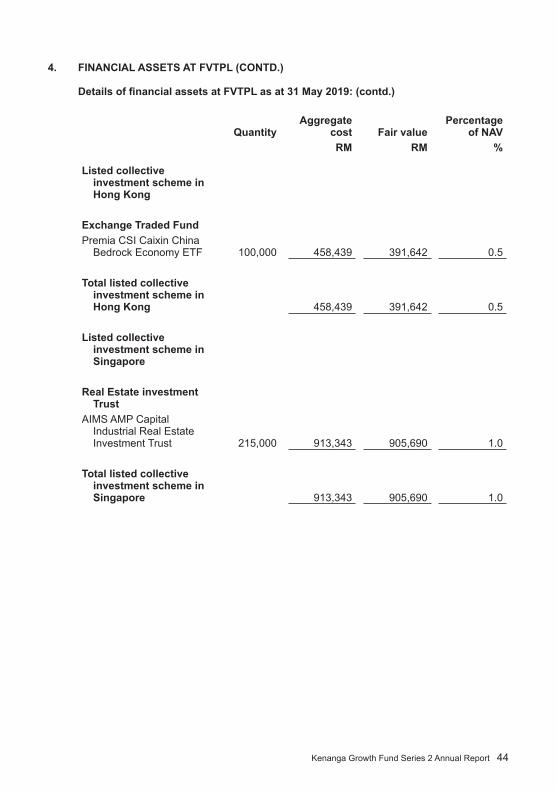
Kenanga Growth Fund Series 2 Annual Report 44
4. finAnCiAl AssETs AT fVTPl (COnTd.)
Details of financial assets at FVTPL as at 31 May 2019: (contd.)
Quantity Aggregate
cost fair value Percentage
of nAV RM RM %
listed collective
investment scheme in hong Kong
Exchange Traded fundPremia CSI Caixin China
Bedrock Economy ETF 100,000 458,439 391,642 0.5
Total listed collective investment scheme in hong Kong 458,439 391,642 0.5
listed collective investment scheme in singapore
Real Estate investment Trust
AIMS AMP Capital Industrial Real Estate Investment Trust 215,000 913,343 905,690 1.0
Total listed collective investment scheme in singapore 913,343 905,690 1.0
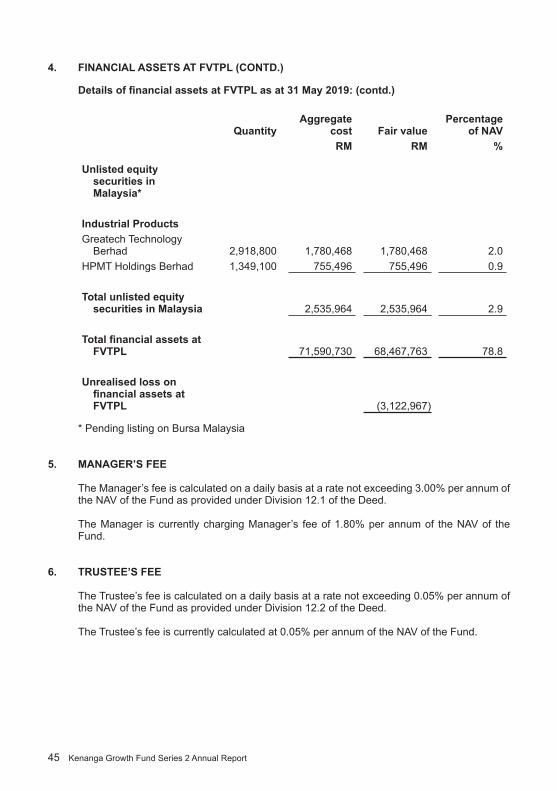
45 Kenanga Growth Fund Series 2 Annual Report
4. finAnCiAl AssETs AT fVTPl (COnTd.)
Details of financial assets at FVTPL as at 31 May 2019: (contd.)
Quantity Aggregate
cost fair value Percentage
of nAV RM RM %
unlisted equity securities in Malaysia*
industrial ProductsGreatech Technology
Berhad 2,918,800 1,780,468 1,780,468 2.0 HPMT Holdings Berhad 1,349,100 755,496 755,496 0.9
Total unlisted equity securities in Malaysia 2,535,964 2,535,964 2.9
Total financial assets at fVTPl 71,590,730 68,467,763 78.8
unrealised loss on financial assets at fVTPl (3,122,967)
* Pending listing on Bursa Malaysia
5. MAnAGER’s fEE
The Manager’s fee is calculated on a daily basis at a rate not exceeding 3.00% per annum of the NAV of the Fund as provided under Division 12.1 of the Deed.
The Manager is currently charging Manager’s fee of 1.80% per annum of the NAV of the Fund.
6. TRusTEE’s fEE
The Trustee’s fee is calculated on a daily basis at a rate not exceeding 0.05% per annum of the NAV of the Fund as provided under Division 12.2 of the Deed.
The Trustee’s fee is currently calculated at 0.05% per annum of the NAV of the Fund.
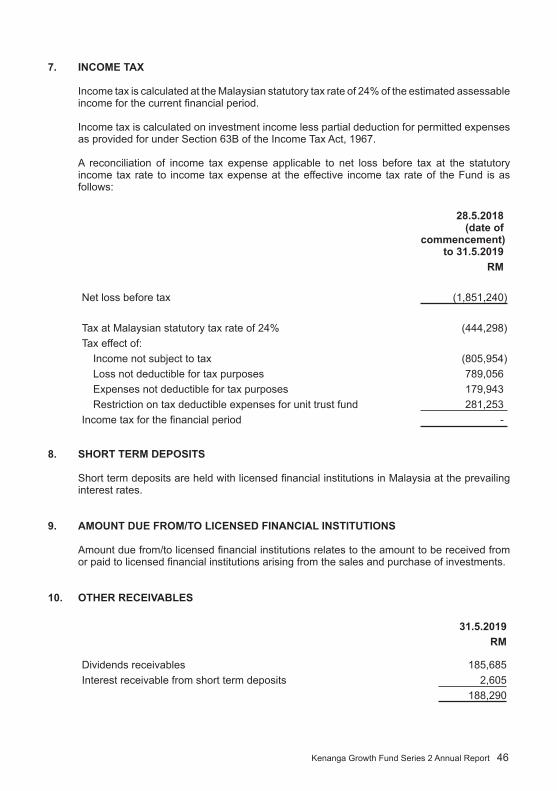
Kenanga Growth Fund Series 2 Annual Report 46
7. inCOME TAX
Income tax is calculated at the Malaysian statutory tax rate of 24% of the estimated assessable income for the current financial period.
Income tax is calculated on investment income less partial deduction for permitted expenses as provided for under Section 63B of the Income Tax Act, 1967.
A reconciliation of income tax expense applicable to net loss before tax at the statutory income tax rate to income tax expense at the effective income tax rate of the Fund is as follows:
28.5.2018 (date of
commencement) to 31.5.2019
RM
Net loss before tax (1,851,240)
Tax at Malaysian statutory tax rate of 24% (444,298)Tax effect of:
Income not subject to tax (805,954)Loss not deductible for tax purposes 789,056 Expenses not deductible for tax purposes 179,943 Restriction on tax deductible expenses for unit trust fund 281,253
Income tax for the financial period -
8. shORT TERM dEPOsiTs
Short term deposits are held with licensed financial institutions in Malaysia at the prevailing interest rates.
9. AMOunT duE fROM/TO liCEnsEd finAnCiAl insTiTuTiOns
Amount due from/to licensed financial institutions relates to the amount to be received from or paid to licensed financial institutions arising from the sales and purchase of investments.
10. OThER RECEiVABlEs
31.5.2019RM
Dividends receivables 185,685Interest receivable from short term deposits 2,605
188,290

47 Kenanga Growth Fund Series 2 Annual Report
11. OThER PAYABlEs
31.5.2019RM
Accrual for auditors’ remuneration 7,000Accrual for tax agent’s fees 6,000Provision for printing and other expenses 9,000
22,000
12. nET AssET VAluE ATTRiBuTABlE TO uniT hOldERs
NAV attributed to unit holders is represented by:
note 31.5.2019RM
Unit holders’ contribution- MYR Class (a) 88,581,227 - USD Class (b) 123,968
88,705,195
Accumulated loss:Realised reserves 1,311,343 Unrealised reserves (3,162,583)
(1,851,240)
86,853,955
(a) unit holders’ contribution – MYR Class
28.5.2018 (date of commencement) to
31.5.2019no. of units RM
At date of commencement - -Add: Creation of units 100,918,631 100,918,631 Less: Cancellation of units (13,756,419) (13,756,419)Distribution equalisation - 1,419,015 At end of the financial period 87,162,212 88,581,227
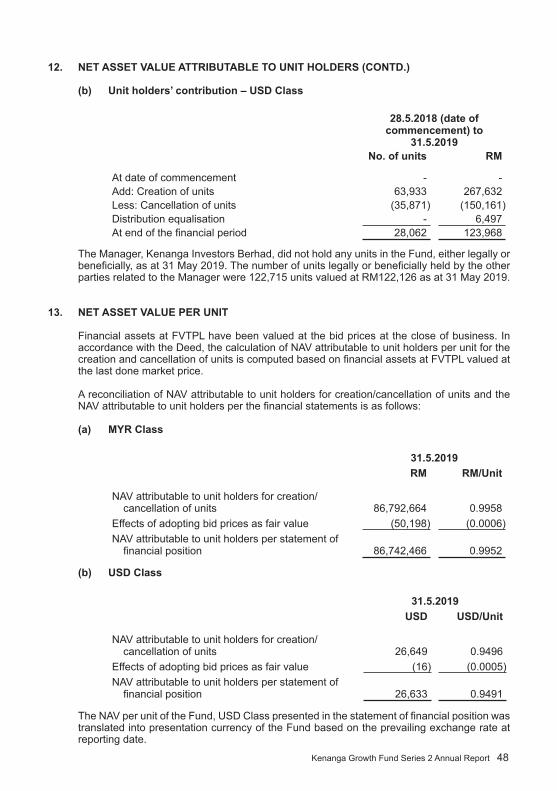
Kenanga Growth Fund Series 2 Annual Report 48
12. nET AssET VAluE ATTRiBuTABlE TO uniT hOldERs (COnTd.)
(b) unit holders’ contribution – usd Class
28.5.2018 (date of commencement) to
31.5.2019no. of units RM
At date of commencement - -Add: Creation of units 63,933 267,632 Less: Cancellation of units (35,871) (150,161)Distribution equalisation - 6,497 At end of the financial period 28,062 123,968
The Manager, Kenanga Investors Berhad, did not hold any units in the Fund, either legally or beneficially, as at 31 May 2019. The number of units legally or beneficially held by the other parties related to the Manager were 122,715 units valued at RM122,126 as at 31 May 2019.
13. nET AssET VAluE PER uniT
Financial assets at FVTPL have been valued at the bid prices at the close of business. In accordance with the Deed, the calculation of NAV attributable to unit holders per unit for the creation and cancellation of units is computed based on financial assets at FVTPL valued at the last done market price.
A reconciliation of NAV attributable to unit holders for creation/cancellation of units and the NAV attributable to unit holders per the financial statements is as follows:
(a) MYR Class
31.5.2019RM RM/unit
NAV attributable to unit holders for creation/cancellation of units 86,792,664 0.9958
Effects of adopting bid prices as fair value (50,198) (0.0006)NAV attributable to unit holders per statement of
financial position 86,742,466 0.9952
(b) usd Class
31.5.2019usd usd/unit
NAV attributable to unit holders for creation/cancellation of units 26,649 0.9496
Effects of adopting bid prices as fair value (16) (0.0005)NAV attributable to unit holders per statement of
financial position 26,633 0.9491
The NAV per unit of the Fund, USD Class presented in the statement of financial position was translated into presentation currency of the Fund based on the prevailing exchange rate at reporting date.
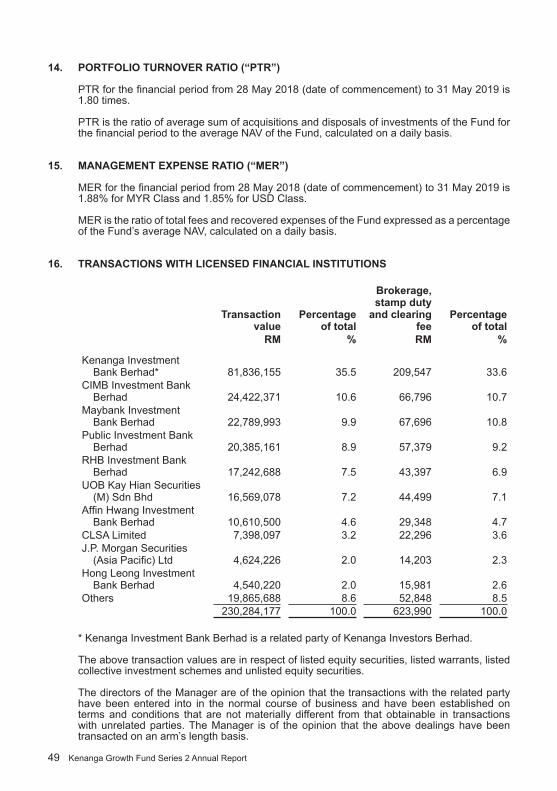
49 Kenanga Growth Fund Series 2 Annual Report
14. PORTfOliO TuRnOVER RATiO (“PTR”)
PTR for the financial period from 28 May 2018 (date of commencement) to 31 May 2019 is 1.80 times.
PTR is the ratio of average sum of acquisitions and disposals of investments of the Fund for the financial period to the average NAV of the Fund, calculated on a daily basis.
15. MAnAGEMEnT EXPEnsE RATiO (“MER”)
MER for the financial period from 28 May 2018 (date of commencement) to 31 May 2019 is 1.88% for MYR Class and 1.85% for USD Class.
MER is the ratio of total fees and recovered expenses of the Fund expressed as a percentage of the Fund’s average NAV, calculated on a daily basis.
16. TRAnsACTiOns wiTh liCEnsEd finAnCiAl insTiTuTiOns
Transaction value
Percentage of total
Brokerage, stamp duty
and clearing fee
Percentage of total
RM % RM %
Kenanga Investment Bank Berhad* 81,836,155 35.5 209,547 33.6
CIMB Investment Bank Berhad 24,422,371 10.6 66,796 10.7
Maybank Investment Bank Berhad 22,789,993 9.9 67,696 10.8
Public Investment Bank Berhad 20,385,161 8.9 57,379 9.2
RHB Investment Bank Berhad 17,242,688 7.5 43,397 6.9
UOB Kay Hian Securities (M) Sdn Bhd 16,569,078 7.2 44,499 7.1
Affin Hwang Investment Bank Berhad 10,610,500 4.6 29,348 4.7
CLSA Limited 7,398,097 3.2 22,296 3.6 J.P. Morgan Securities
(Asia Pacific) Ltd 4,624,226 2.0 14,203 2.3 Hong Leong Investment
Bank Berhad 4,540,220 2.0 15,981 2.6 Others 19,865,688 8.6 52,848 8.5
230,284,177 100.0 623,990 100.0
* Kenanga Investment Bank Berhad is a related party of Kenanga Investors Berhad.
The above transaction values are in respect of listed equity securities, listed warrants, listed collective investment schemes and unlisted equity securities.
The directors of the Manager are of the opinion that the transactions with the related party have been entered into in the normal course of business and have been established on terms and conditions that are not materially different from that obtainable in transactions with unrelated parties. The Manager is of the opinion that the above dealings have been transacted on an arm’s length basis.

K
enan
ga G
row
th F
und
Ser
ies
2 A
nnua
l Rep
ort
50
17.
sEG
MEn
TAl
REP
OR
Tin
G
a.
Bus
ines
s se
gmen
ts
In
acc
orda
nce
with
the
obje
ctiv
e of
the
Fund
, the
Fun
d ca
n in
vest
up
to 9
8% in
list
ed in
vest
men
t sec
uriti
es. T
he fo
llow
ing
tabl
e pr
ovid
es a
n an
alys
is o
f the
Fun
d’s
reve
nue,
resu
lts, a
sset
s an
d lia
bilit
ies
by b
usin
ess
segm
ents
:
list
ed in
vest
men
t se
curit
ies
unl
iste
d in
vest
men
t s
ecur
ities
Oth
er in
vest
men
tsTo
tal
RM
R
M
RM
RM
28.5
.201
8 (d
ate
of c
omm
ence
men
t) to
31.
5.20
19R
even
ueS
egm
ent (
loss
)/inc
ome
(761
,074
)-
996,
249
Seg
men
t exp
ense
s(6
63,0
14)
(8,0
08)
-N
et s
egm
ent (
loss
)/inc
ome
repr
esen
ting
segm
ent r
esul
ts(1
,424
,088
)(8
,008
)99
6,24
9 (4
35,8
47)
Una
lloca
ted
loss
on
fore
ign
curr
ency
exc
hang
e(1
64,7
68)
(600
,615
)U
nallo
cate
d ex
pend
iture
(1,2
50,6
25)
Loss
bef
ore
tax
(1,8
51,2
40)
Inco
me
tax
-N
et lo
ss a
fter t
ax(1
,851
,240
)
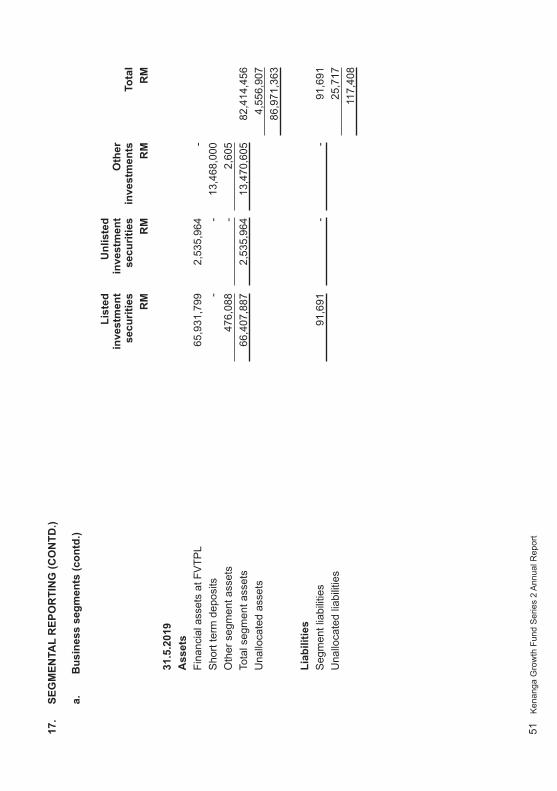
51
Ken
anga
Gro
wth
Fun
d S
erie
s 2
Ann
ual R
epor
t
17.
sEG
MEn
TAl
REP
OR
Tin
G (C
On
Td.)
a.
Bus
ines
s se
gmen
ts (c
ontd
.)
list
ed
inve
stm
ent
secu
ritie
s
unl
iste
d in
vest
men
t se
curit
ies
Oth
er
inve
stm
ents
Tota
lR
M
RM
R
MR
M
31.5
.201
9A
sset
sFi
nanc
ial a
sset
s at
FV
TPL
65,9
31,7
99
2,53
5,96
4 -
Sho
rt te
rm d
epos
its-
-13
,468
,000
O
ther
seg
men
t ass
ets
476,
088
-2,
605
Tota
l seg
men
t ass
ets
66,4
07,8
87
2,53
5,96
4 13
,470
,605
82
,414
,456
U
nallo
cate
d as
sets
4,55
6,90
7 86
,971
,363
liab
ilitie
sS
egm
ent l
iabi
litie
s91
,691
-
-91
,691
U
nallo
cate
d lia
bilit
ies
25,7
17
117,
408
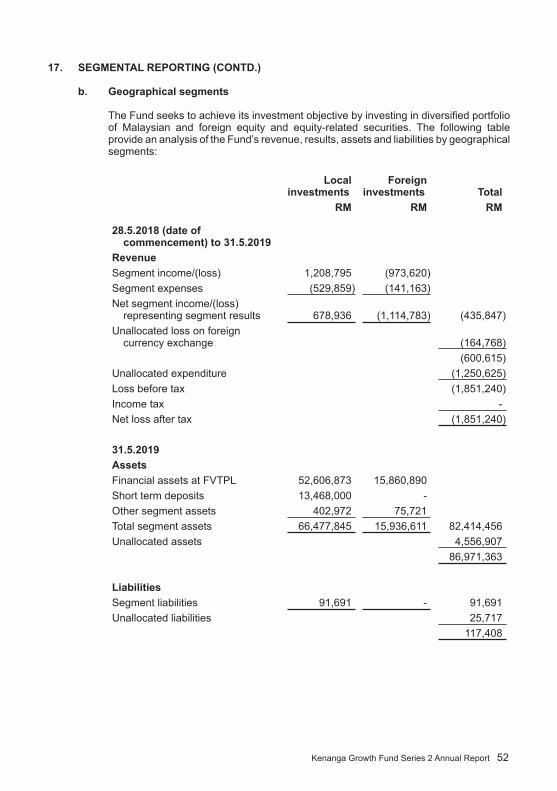
Kenanga Growth Fund Series 2 Annual Report 52
17. sEGMEnTAl REPORTinG (COnTd.)
b. Geographical segments
The Fund seeks to achieve its investment objective by investing in diversified portfolio of Malaysian and foreign equity and equity-related securities. The following table provide an analysis of the Fund’s revenue, results, assets and liabilities by geographical segments:
local investments
foreign investments Total
RM RM RM
28.5.2018 (date of commencement) to 31.5.2019
RevenueSegment income/(loss) 1,208,795 (973,620)Segment expenses (529,859) (141,163)Net segment income/(loss)
representing segment results 678,936 (1,114,783) (435,847)Unallocated loss on foreign
currency exchange (164,768)(600,615)
Unallocated expenditure (1,250,625)Loss before tax (1,851,240)Income tax -Net loss after tax (1,851,240)
31.5.2019AssetsFinancial assets at FVTPL 52,606,873 15,860,890 Short term deposits 13,468,000 -Other segment assets 402,972 75,721 Total segment assets 66,477,845 15,936,611 82,414,456 Unallocated assets 4,556,907
86,971,363
liabilitiesSegment liabilities 91,691 - 91,691 Unallocated liabilities 25,717
117,408
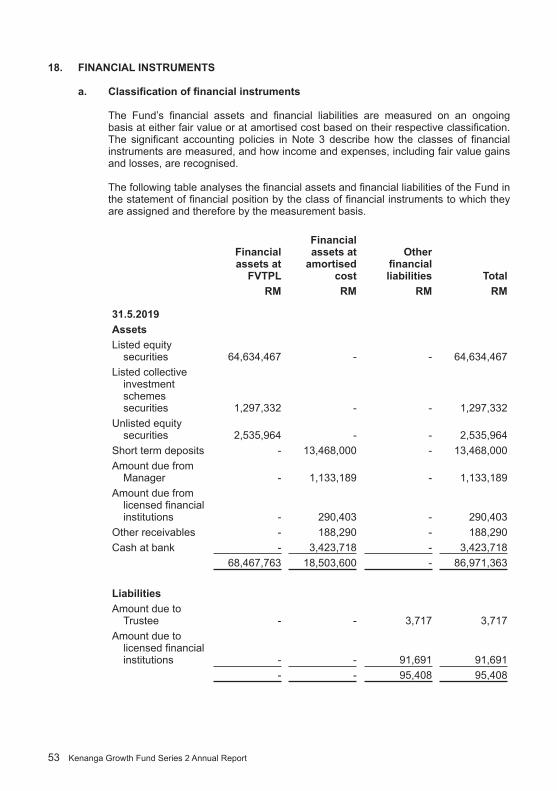
53 Kenanga Growth Fund Series 2 Annual Report
18. finAnCiAl insTRuMEnTs
a. Classification of financial instruments
The Fund’s financial assets and financial liabilities are measured on an ongoing basis at either fair value or at amortised cost based on their respective classification. The significant accounting policies in Note 3 describe how the classes of financial instruments are measured, and how income and expenses, including fair value gains and losses, are recognised.
The following table analyses the financial assets and financial liabilities of the Fund in the statement of financial position by the class of financial instruments to which they are assigned and therefore by the measurement basis.
financial assets at
fVTPl
financial assets at
amortised cost
Other financial liabilities Total
RM RM RM RM
31.5.2019AssetsListed equity
securities 64,634,467 - - 64,634,467 Listed collective
investment schemes securities 1,297,332 - - 1,297,332
Unlisted equity securities 2,535,964 - - 2,535,964
Short term deposits - 13,468,000 - 13,468,000 Amount due from
Manager - 1,133,189 - 1,133,189 Amount due from
licensed financial institutions - 290,403 - 290,403
Other receivables - 188,290 - 188,290 Cash at bank - 3,423,718 - 3,423,718
68,467,763 18,503,600 - 86,971,363
liabilitiesAmount due to
Trustee - - 3,717 3,717 Amount due to
licensed financial institutions - - 91,691 91,691
- - 95,408 95,408
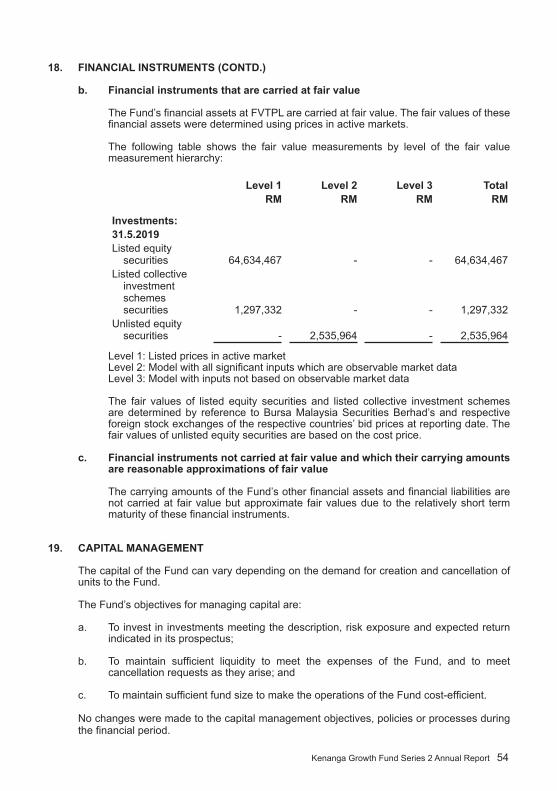
Kenanga Growth Fund Series 2 Annual Report 54
18. finAnCiAl insTRuMEnTs (COnTd.)
b. financial instruments that are carried at fair value
The Fund’s financial assets at FVTPL are carried at fair value. The fair values of these financial assets were determined using prices in active markets.
The following table shows the fair value measurements by level of the fair value measurement hierarchy:
level 1 level 2 level 3 TotalRM RM RM RM
investments:31.5.2019Listed equity
securities 64,634,467 - - 64,634,467 Listed collective
investment schemes securities 1,297,332 - - 1,297,332
Unlisted equity securities - 2,535,964 - 2,535,964
Level 1: Listed prices in active marketLevel 2: Model with all significant inputs which are observable market dataLevel 3: Model with inputs not based on observable market data
The fair values of listed equity securities and listed collective investment schemes are determined by reference to Bursa Malaysia Securities Berhad’s and respective foreign stock exchanges of the respective countries’ bid prices at reporting date. The fair values of unlisted equity securities are based on the cost price.
c. financial instruments not carried at fair value and which their carrying amounts are reasonable approximations of fair value
The carrying amounts of the Fund’s other financial assets and financial liabilities are not carried at fair value but approximate fair values due to the relatively short term maturity of these financial instruments.
19. CAPiTAl MAnAGEMEnT
The capital of the Fund can vary depending on the demand for creation and cancellation of units to the Fund.
The Fund’s objectives for managing capital are:
a. To invest in investments meeting the description, risk exposure and expected return indicated in its prospectus;
b. To maintain sufficient liquidity to meet the expenses of the Fund, and to meet cancellation requests as they arise; and
c. To maintain sufficient fund size to make the operations of the Fund cost-efficient.
No changes were made to the capital management objectives, policies or processes during the financial period.

55 Kenanga Growth Fund Series 2 Annual Report
20. COMPARATiVEs
There are no comparative amounts presented as this is the Fund’s first set of financial statements since its commencement date.

This page has been intentionally left blank

This page has been intentionally left blank


investor services CenterToll Free Line: 1 800 88 3737Fax: +603 2172 3133Email: [email protected]
Head Office, Kuala LumpurLevel 14, Kenanga Tower, 237 Jalan Tun Razak, 50400 Kuala Lumpur, Malaysia.Tel: 03-2172 3000 Fax: 03-2172 3080