kenanga growth fund - ifastcapital.com.my · no. 25-1, jalan kota laksamana 2/17 taman kota...
TRANSCRIPT

INTERIM REPORT
For the Financial Period from 1 June 2018 to 30 November 2018
KENANGA GROWTH FUND


KENANGA GROWTH FUND
Contents Page
Corporate Directory ii
Directory of Manager’s Offi ces iii
Fund Information 1
Manager’s Report 2 - 6
Fund Performance 7 - 9
Trustee’s Report 10
Statement by the Manager 11
Financial Statements 12 - 42
ii Kenanga Growth Fund Interim Report
CORPORATE DIRECTORY
Manager: Kenanga Investors Berhad (Company No. 353563-P)
Registered Offi ce Business Offi ceLevel 17, Kenanga Tower Level 14, Kenanga Tower237, Jalan Tun Razak 237, Jalan Tun Razak50400 Kuala Lumpur, Malaysia 50400 Kuala Lumpur, MalaysiaTel: 03-2172 2888 Tel: 03-2172 3000Fax: 03-2172 2999 Tel: 03-2172 3080 E-mail: [email protected] Website: www.KenangaInvestors.com.my
Board of Directors Investment CommitteeDatuk Syed Ahmad Alwee Alsree (Chairman) Syed Zafi len Syed Alwee (IndependentSyed Zafi len Syed Alwee (Independent Member) Director) Peter John Rayner (IndependentPeter John Rayner (Independent Member) Director) Imran Devindran bin Abdullah (IndependentImran Devindran bin Abdullah (Independent Member) Director) Ismitz Matthew De AlwisIsmitz Matthew De Alwis
Company Secretary: Norliza Abd Samad (MAICSA 7011089)
Level 17, Kenanga Tower, 237, Jalan Tun Razak, 50400 Kuala Lumpur, Malaysia.
Trustee: CIMB Commerce Trustee Berhad (Company No. 313031-A)
Registered Offi ce Business Offi ce Level 13, Menara CIMB Level 13, Menara CIMBJalan Stesen Sentral 2 Jalan Stesen Sentral 2Kuala Lumpur Sentral Kuala Lumpur Sentral50490 Kuala Lumpur 50490 Kuala LumpurTel: 03-2261 8888 Tel: 03-2261 8888Fax: 03-2261 0099 Fax: 03-2261 9889Website: www.cimb.com
Auditor: Ernst & Young (AF: 0039)
Level 23A, Menara Milenium, Jalan Damanlela, Pusat Bandar Damansara, 50490 Kuala Lumpur.Tel: 03-7495 8000 Fax: 03-2095 5332
Tax Adviser: Ernst & Young Tax Consultants Sdn Bhd (Company No. 179793-K)
Level 23A, Menara Milenium, Jalan Damanlela, Pusat Bandar Damansara, 50490 Kuala Lumpur.Tel: 03-7495 8000 Fax: 03-2095 5332
Membership: Federation of Investment Managers Malaysia (FIMM)
19-06-1, 6th Floor, Wisma Tune, 19, Lorong Dungun, Damansara Heights, 50490 Kuala Lumpur, Malaysia.Tel: 03-2093 2600 Fax: 03-2093 2700 Website: www.fi mm.com.my

iiiKenanga Growth Fund Interim Report
REGIONAL BRANCH OFFICES:
Kuala LumpurLevel 13, Kenanga Tower237, Jalan Tun Razak50400 Kuala Lumpur, MalaysiaTel : 03-2172 3123 Fax : 03-2172 3133
MelakaNo. 25-1, Jalan Kota Laksamana 2/17Taman Kota Laksamana, Seksyen 275200 MelakaTel : 06-281 8913 / 06-282 0518Fax : 06-281 4286
KlangNo. 12, Jalan Batai Laut 3Taman Intan, 41300 KlangSelangor Darul EhsanTel : 03-3341 8818 / 03-3348 7889 Fax : 03-3341 8816
Penang5.04, 5th Floor, Menara Boustead Penang No. 39, Jalan Sultan Ahmad Shah 10050 PenangTel : 04-210 6628Fax : 04-210 6644
Miri 2nd Floor, Lot 1264Centre Point Commercial CentreJalan Melayu98000 Miri, Sarawak Tel : 085-416 866 Fax : 085-322 340
Seremban 2nd Floor, No. 1D-2, Jalan Tuanku Munawir 70000 Seremban, Negeri Sembilan Tel : 06-761 5678 Fax : 06-761 2242
Johor BahruLot 11.03, 11th Floor, Menara MSC CyberportNo. 5, Jalan Bukit Meldrum80300 Johor Bahru, JohorTel : 07-223 7505 / 4798 Fax : 07-223 4802
Kuching1st Floor, No 71Lot 10900, Jalan Tun Jugah93350 Kuching, SarawakTel : 082-572 228 Fax : 082-572 229
KuantanGround Floor Shop,No. B8, Jalan Tun Ismail 1,25000 Kuantan, Pahang.Tel : 09-514 3688Fax : 09-514 3838
IpohSuite 1, 2nd Floor,No. 63, Persiaran Greenhill30450 Ipoh, Perak, MalaysiaTel : 05-254 7573 / 7570 / 7575Fax : 05-254 7606
Kota KinabaluLevel 8, Wisma Great EasternNo. 68, Jalan Gaya88000 Kota Kinabalu, SabahTel : 088-203 063 Fax : 088-203 062
Petaling Jaya44B, Jalan SS21/35, Damansara Utama47400 Petaling Jaya, Selangor Tel : 03-7710 8828 Fax : 03-7710 8830
DIRECTORY OF MANAGER’S OFFICES
1 Kenanga Growth Fund Interim Report
1. FUND INFORMATION
1.1 Fund Name
Kenanga Growth Fund (KGF or the Fund)
1.2 Fund Category / Type
Equity / Growth
1.3 Investment Objective
The Fund aims to provide unit holders with long-term capital growth.
1.4 Investment Strategy
The Fund’s assets are actively invested in a diversifi ed portfolio of Malaysian equity and equity-related securities of companies with sustainable business model that is trading at discount to its intrinsic value.
1.5 Duration
The Fund was launched on 17 January 2000 and shall exist as long as it appears to the Manager and the Trustee that it is in the interests of the unit holders for it to continue.
1.6 Performance Benchmark
FTSE-Bursa Malaysia Kuala Lumpur Composite Index (FBM-KLCI).
1.7 Distribution Policy
Income distribution is incidental, if any.
1.8 Breakdown of unit holdings of KGF as at 30 November 2018
Size of holdings No. of unit holders No. of units held 5,000 and below 8,507 20,292,908 5,001 - 10,000 5,500 41,005,312 10,001-50,000 12,211 284,204,063 50,001-500,000 4,101 444,838,525 500,001 and above 98 571,331,969 Total 30,417 1,361,672,777
2Kenanga Growth Fund Interim Report
2. MANAGER’S REPORT
2.1 Explanation on whether the Fund has achieved its investment objective
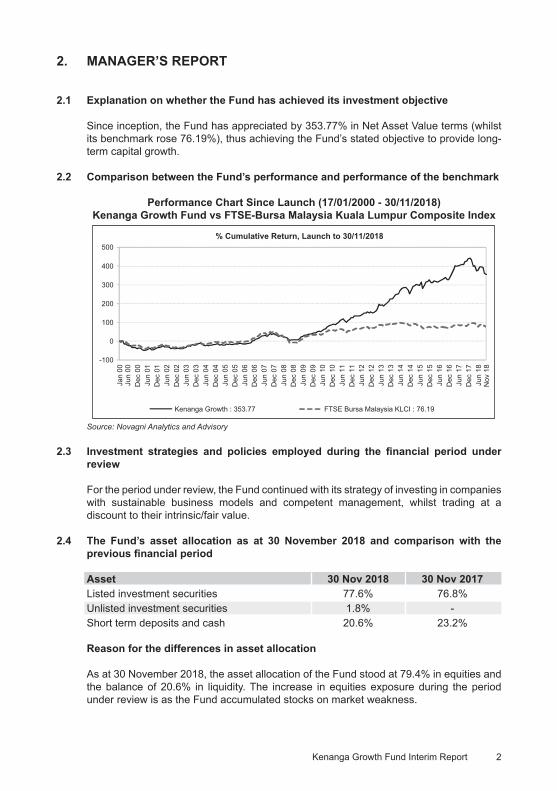
Since inception, the Fund has appreciated by 353.77% in Net Asset Value terms (whilst its benchmark rose 76.19%), thus achieving the Fund’s stated objective to provide long-term capital growth.
2.2 Comparison between the Fund’s performance and performance of the benchmark
Performance Chart Since Launch (17/01/2000 - 30/11/2018)Kenanga Growth Fund vs FTSE-Bursa Malaysia Kuala Lumpur Composite Index
Source: Novagni Analytics and Advisory
2.3 Investment strategies and policies employed during the fi nancial period under review
For the period under review, the Fund continued with its strategy of investing in companies with sustainable business models and competent management, whilst trading at a discount to their intrinsic/fair value.
2.4 The Fund’s asset allocation as at 30 November 2018 and comparison with the previous fi nancial period
Asset 30 Nov 2018 30 Nov 2017Listed investment securities 77.6% 76.8%Unlisted investment securities 1.8% -Short term deposits and cash 20.6% 23.2%
Reason for the differences in asset allocation
As at 30 November 2018, the asset allocation of the Fund stood at 79.4% in equities and the balance of 20.6% in liquidity. The increase in equities exposure during the period under review is as the Fund accumulated stocks on market weakness.
-100
0
100
200
300
400
500
Jan
00Ju
n 00
Dec
00
Jun
01D
ec 0
1Ju
n 02
Dec
02
Jun
03D
ec 0
3Ju
n 04
Dec
04
Jun
05D
ec 0
5Ju
n 06
Dec
06
Jun
07D
ec 0
7Ju
n 08
Dec
08
Jun
09D
ec 0
9Ju
n 10
Dec
10
Jun
11D
ec 1
1Ju
n 12
Dec
12
Jun
13D
ec 1
3Ju
n 14
Dec
14
Jun
15D
ec 1
5Ju
n 16
Dec
16
Jun
17D
ec 1
7Ju
n 18
Nov
18
% Cumulative Return, Launch to 30/11/2018
Kenanga Growth : 353.77 FTSE Bursa Malaysia KLCI : 76.19

3 Kenanga Growth Fund Interim Report
2.5 Fund performance analysis based on NAV per unit (adjusted for income distribution; if any) since last review period
Period under review Kenanga Growth Fund -4.43% FTSE-Bursa Malaysia Kuala Lumpur Composite Index (FBM-KLCI) -3.49% Source: Lipper
For the period under review, the Fund underperformed the FBM-KLCI by 0.94%. The underperformance was mainly due to stock selection.
2.6 Review of the market
Market review
FBMKLCI declined 3.5% for the interim period under review. US Federal Reserve raised rate raised rate in June and September, effectively lifting US rates to 2.25% and kept guidance of total 4 hikes for 2018. US-China trade tensions escalated with the imposition of tariff from both sides. On the local front, market sentiment turned bearish in September, after strong performance in the previous two months due to implementation of Sales and Services Tax (SST) and the announcement of minimum wage hike. FBMKLCI recorded biggest single day fall in fi ve months after Finance Minister Lim Guan Eng’s address that Budget 2019 will require “sacrifi ces” during an investor conference.
The FBMKLCI started the month positive during the fi rst week of June. However, the positive momentum failed to sustain as foreigners continue to sell the market. The initial decline was dragged by fi nance related stocks which brought the index lower on 11 June; bucking regional trend which closed in the green on optimism that the U.S-North Korea summit in Singapore may lead to the denuclearization of the Korean peninsula. The downtrend for the index continued, in line with regional markets on trade-war fears after Donald Trump threatened to have additional tariffs on another USD200 billion of Chinese imports.
US stock indices ended positively in August led by solid US corporate earnings, despite the intra-month volatility caused by the on-going trade negotiations between the US and international trade partners. U.S. consumer spending increased a solid 0.4% in July, the sixth straight month of healthy gains, suggesting strong economic growth early in the 3Q18, while a measure of underlying infl ation hit the US Federal Reserve’s 2% target for the third time this year. Elsewhere, investors were focused on emerging markets, including Turkey and Argentina, which are both embroiled in currency crises that Wall Street fears could have knock-on effects across the globe.
On the local front, 2Q18 GDP growth of 4.5% year-on-year (YoY) was reported in August, which was below market expectations. This was the slowest pace since 4Q16 as the country’s mining and agriculture sectors contracted at 2.2% and 2.5% respectively. Nevertheless, the underlying data are better than the headline implies. The domestic demand growth accelerated to 5.6% YoY from 4.1% YoY in 1Q18 driven by consumption. The SST was reintroduced on 1 September with proposed sales tax at 5% and 10%, while service tax at fi xed rate of 6%. The government is drawing up new directions for the 11th Malaysia Plan which will be tabled in the Parliament in October.
4Kenanga Growth Fund Interim Report
2.6 Review of the market (contd.)
Market review (contd.)
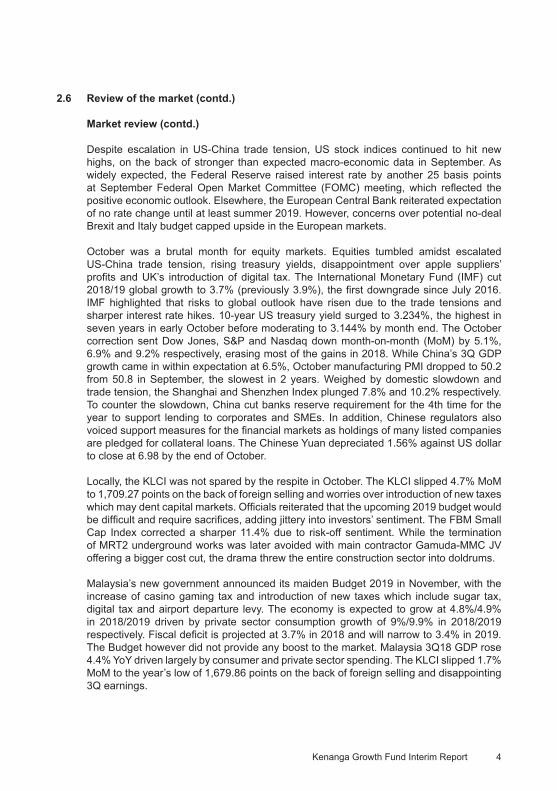
Despite escalation in US-China trade tension, US stock indices continued to hit new highs, on the back of stronger than expected macro-economic data in September. As widely expected, the Federal Reserve raised interest rate by another 25 basis points at September Federal Open Market Committee (FOMC) meeting, which refl ected the positive economic outlook. Elsewhere, the European Central Bank reiterated expectation of no rate change until at least summer 2019. However, concerns over potential no-deal Brexit and Italy budget capped upside in the European markets.
October was a brutal month for equity markets. Equities tumbled amidst escalated US-China trade tension, rising treasury yields, disappointment over apple suppliers’ profi ts and UK’s introduction of digital tax. The International Monetary Fund (IMF) cut 2018/19 global growth to 3.7% (previously 3.9%), the fi rst downgrade since July 2016. IMF highlighted that risks to global outlook have risen due to the trade tensions and sharper interest rate hikes. 10-year US treasury yield surged to 3.234%, the highest in seven years in early October before moderating to 3.144% by month end. The October correction sent Dow Jones, S&P and Nasdaq down month-on-month (MoM) by 5.1%, 6.9% and 9.2% respectively, erasing most of the gains in 2018. While China’s 3Q GDP growth came in within expectation at 6.5%, October manufacturing PMI dropped to 50.2 from 50.8 in September, the slowest in 2 years. Weighed by domestic slowdown and trade tension, the Shanghai and Shenzhen Index plunged 7.8% and 10.2% respectively. To counter the slowdown, China cut banks reserve requirement for the 4th time for the year to support lending to corporates and SMEs. In addition, Chinese regulators also voiced support measures for the fi nancial markets as holdings of many listed companies are pledged for collateral loans. The Chinese Yuan depreciated 1.56% against US dollar to close at 6.98 by the end of October.
Locally, the KLCI was not spared by the respite in October. The KLCI slipped 4.7% MoM to 1,709.27 points on the back of foreign selling and worries over introduction of new taxes which may dent capital markets. Offi cials reiterated that the upcoming 2019 budget would be diffi cult and require sacrifi ces, adding jittery into investors’ sentiment. The FBM Small Cap Index corrected a sharper 11.4% due to risk-off sentiment. While the termination of MRT2 underground works was later avoided with main contractor Gamuda-MMC JV offering a bigger cost cut, the drama threw the entire construction sector into doldrums.
Malaysia’s new government announced its maiden Budget 2019 in November, with the increase of casino gaming tax and introduction of new taxes which include sugar tax, digital tax and airport departure levy. The economy is expected to grow at 4.8%/4.9% in 2018/2019 driven by private sector consumption growth of 9%/9.9% in 2018/2019 respectively. Fiscal defi cit is projected at 3.7% in 2018 and will narrow to 3.4% in 2019. The Budget however did not provide any boost to the market. Malaysia 3Q18 GDP rose 4.4% YoY driven largely by consumer and private sector spending. The KLCI slipped 1.7% MoM to the year’s low of 1,679.86 points on the back of foreign selling and disappointing 3Q earnings.
5 Kenanga Growth Fund Interim Report
2.6 Review of the market (contd.)
Market outlook
A broad set of concerns remained, including a grim manufacturing report out of China, slowing global economic growth, rising U.S. interest rates and volatile oil prices. While China and the US agreed to a 90-day trade war truce window, there are uncertainties over whether they can bridge massive differences over commercial practices and intellectual property rights. The Southeast Asian economy could be seen benefi ting from the US-China trade war as companies look to establish operations in the country to avoid the tariff crossfi re.
Investors will be watching out for the impact of higher minimum wage, which came into effect on 1 January 2019, on consumer spending and operating costs of businesses. Also in focus will be the BNM Monetary Policy Statement and FOMC meeting on 29-30 January 2019.
Strategy
We remain defensive overall, while focusing on stock picking for outperformance. We continue to focus on stocks with sustained earnings growth, strong balance sheet and consistent dividend payment. We also see value opportunities in stocks which were sold down excessively in sectors such as technology, oil and gas and construction.
2.7 Distribution
For the fi nancial period under review, the Fund did not declare any income distribution.
2.8 Details of any unit split exercise
The Fund did not carry out any unit split exercise during the fi nancial period under review.
2.9 Signifi cant changes in the state of affair of the Fund during the fi nancial period
There were no signifi cant changes in the state of affair of the Fund during the fi nancial period and up until the date of the manager’s report, not otherwise disclosed in the fi nancial statements.
2.10 Circumstances that materially affect any interests of the unit holders
During the fi nancial period under review, there were no circumstances that materially affected any interests of the unit holders.
2.11 Cross trade
During the fi nancial period under review, no cross-trade transaction was undertaken by investment manager for the Fund.
6Kenanga Growth Fund Interim Report
2.12 Rebates & Soft commissions
It is the policy of the Manager to credit any rebates received into the account of the Fund. Any soft commissions received by investment manager on behalf of the Fund are in the form of research and advisory services that assist in the decision making process relating to the investment of the Fund which are of demonstrable benefi t to unit holders of the Fund. For the fi nancial period under review, the Manager has received soft commissions from the stockbrokers.
7 Kenanga Growth Fund Interim Report
3. FUND PERFORMANCE
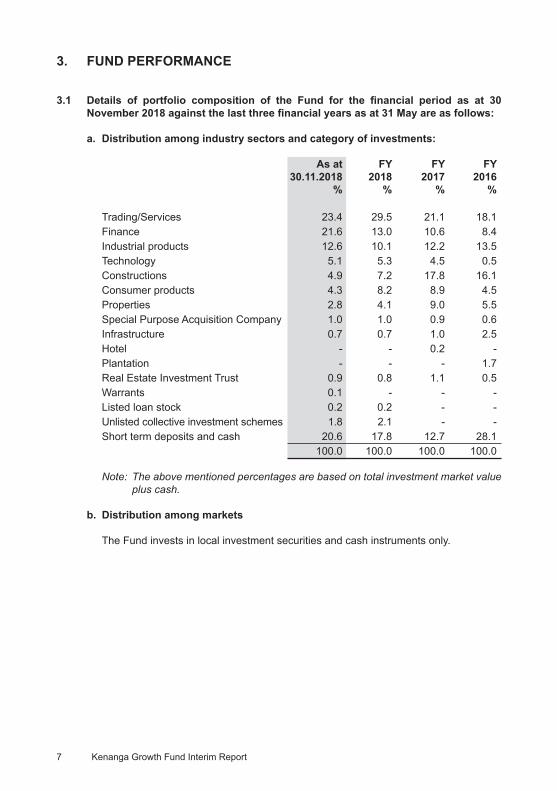
3.1 Details of portfolio composition of the Fund for the fi nancial period as at 30 November 2018 against the last three fi nancial years as at 31 May are as follows:
a. Distribution among industry sectors and category of investments:
As at FY FY FY 30.11.2018 2018 2017 2016 % % % %
Trading/Services 23.4 29.5 21.1 18.1Finance 21.6 13.0 10.6 8.4Industrial products 12.6 10.1 12.2 13.5Technology 5.1 5.3 4.5 0.5Constructions 4.9 7.2 17.8 16.1Consumer products 4.3 8.2 8.9 4.5Properties 2.8 4.1 9.0 5.5Special Purpose Acquisition Company 1.0 1.0 0.9 0.6Infrastructure 0.7 0.7 1.0 2.5Hotel - - 0.2 -Plantation - - - 1.7Real Estate Investment Trust 0.9 0.8 1.1 0.5Warrants 0.1 - - -Listed loan stock 0.2 0.2 - -Unlisted collective investment schemes 1.8 2.1 - -Short term deposits and cash 20.6 17.8 12.7 28.1 100.0 100.0 100.0 100.0
Note: The above mentioned percentages are based on total investment market value plus cash.
b. Distribution among markets
The Fund invests in local investment securities and cash instruments only.

8Kenanga Growth Fund Interim Report
3.2 Performance details of the Fund for the fi nancial period ended 30 November 2018 against the last three fi nancial years ended 31 May are as follows:
Period from 1.6.2018 to FY FY FY 30.11.2018 2018 2017 2016
Net asset value (“NAV”) (RM Million) 1,438.64* 1,368.34 1,052.93 661.21Units in circulation (Million) 1,361.67 1,237.71 909.46 686.49NAV per unit (RM) 1.0565* 1.1055 1.1578 0.9632Highest NAV per unit (RM) 1.1644 1.2908 1.1820 1.0984Lowest NAV per unit (RM) 1.0558 1.1044 0.9573 0.9512Total return (%) -4.43 -4.52 20.20 3.30- Capital growth (%) -4.43 -4.52 20.20 -6.25- Income growth (%) - - - 9.55Gross distribution per unit (sen) - - - 9.82Net distribution per unit (sen) - - - 9.82Management expense ratio (“MER”) (%) 1 1.53 1.66 1.69 1.70Portfolio turnover ratio (“PTR”) (times) 2 0.25 0.78 0.79 0.77
Note: Total return is the actual return of the Fund for the respective fi nancial period/years, computed based on NAV per unit and net of all fees.
MER is computed based on the total fees and expenses incurred by the Fund
divided by the average fund size calculated on a daily basis. PTR is computed based on the average of the total acquisitions and total disposals of investment securities of the Fund divided by the average fund size calculated on a daily basis.
1 MER is lower against previous fi nancial year mainly due to lower recovered expenses incurred during the fi nancial period under review.
2 PTR is lower due to lower trading activities during the period under review.
* Based on bid price fair valuation method on all investments held by the Fund as at 30 November 2018, the NAV and NAV per unit would be RM1,432.43 million and RM1.0520 respectively.
(As disclosed under Note 13 of the fi nancial statements)
9 Kenanga Growth Fund Interim Report
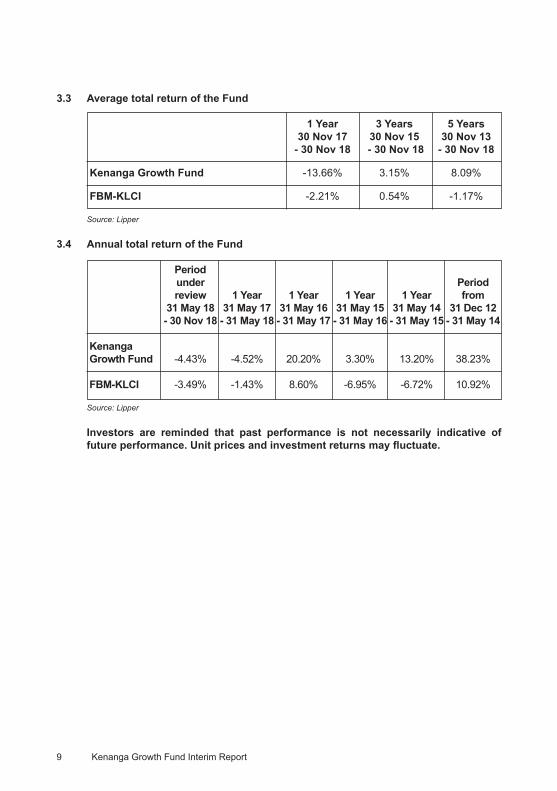
3.3 Average total return of the Fund
1 Year 3 Years 5 Years 30 Nov 17 30 Nov 15 30 Nov 13 - 30 Nov 18 - 30 Nov 18 - 30 Nov 18
Kenanga Growth Fund -13.66% 3.15% 8.09%
FBM-KLCI -2.21% 0.54% -1.17%
Source: Lipper
3.4 Annual total return of the Fund
Period under Period review 1 Year 1 Year 1 Year 1 Year from 31 May 18 31 May 17 31 May 16 31 May 15 31 May 14 31 Dec 12 - 30 Nov 18 - 31 May 18 - 31 May 17 - 31 May 16 - 31 May 15 - 31 May 14
Kenanga Growth Fund -4.43% -4.52% 20.20% 3.30% 13.20% 38.23%
FBM-KLCI -3.49% -1.43% 8.60% -6.95% -6.72% 10.92%
Source: Lipper
Investors are reminded that past performance is not necessarily indicative of future performance. Unit prices and investment returns may fl uctuate.

10Kenanga Growth Fund Interim Report
4 TRUSTEE’S REPORT TO THE UNIT HOLDERS OF KENANGA GROWTH FUND
We, CIMB Commerce Trustee Berhad being the trustee for Kenanga Growth Fund (“the Fund”), are of the opinion that Kenanga Investors Berhad (“the Manager”), acting in the capacity as Manager of the Fund, has fulfi lled its duties in the following manner for the fi nancial period from 1 June 2018 to 30 November 2018.
a) The Fund has been managed in accordance with the limitations imposed on the
investment powers of the Manager under the Deed, the Securities Commission Malaysia’s Guidelines on Unit Trust Funds, the Capital Markets and Services Act 2007 (as amended from time to time) and other applicable laws;
b) Valuation and pricing for the Fund has been carried out in accordance with the Deed and relevant regulatory requirements; and
c) Creation and cancellation of units have been carried out in accordance with the Deed
and relevant regulatory requirements.
For and on behalf of CIMB Commerce Trustee Berhad Lee Kooi Yoke Chief Operating Offi cer
Kuala Lumpur, Malaysia
15 January 2019
11 Kenanga Growth Fund Interim Report
5. STATEMENT BY THE MANAGER
I, Ismitz Matthew De Alwis, being a director of Kenanga Investors Berhad, do hereby state that, in the opinion of the Manager, the accompanying statement of fi nancial position as at 30 November 2018 and the related statement of comprehensive income, statement of changes in net asset value and statement of cash fl ows for the fi nancial period from 1 June 2018 to 30 November 2018 together with notes thereto, are drawn up in accordance with Malaysian Financial Reporting Standards and International Financial Reporting Standards so as to give a true and fair view of the fi nancial position of Kenanga Growth Fund as at 30 November 2018 and of its fi nancial performance and cash fl ows for the fi nancial period from 1 June 2018 to 30 November 2018 and comply with the requirements of the Deed.
For and on behalf of the Manager KENANGA INVESTORS BERHAD
ISMITZ MATTHEW DE ALWIS Executive Director/Chief Executive Offi cer
Kuala Lumpur, Malaysia
15 January 2019
12Kenanga Growth Fund Interim Report
The accompanying notes form an integral part of the fi nancial statements.
6. FINANCIAL STATEMENT
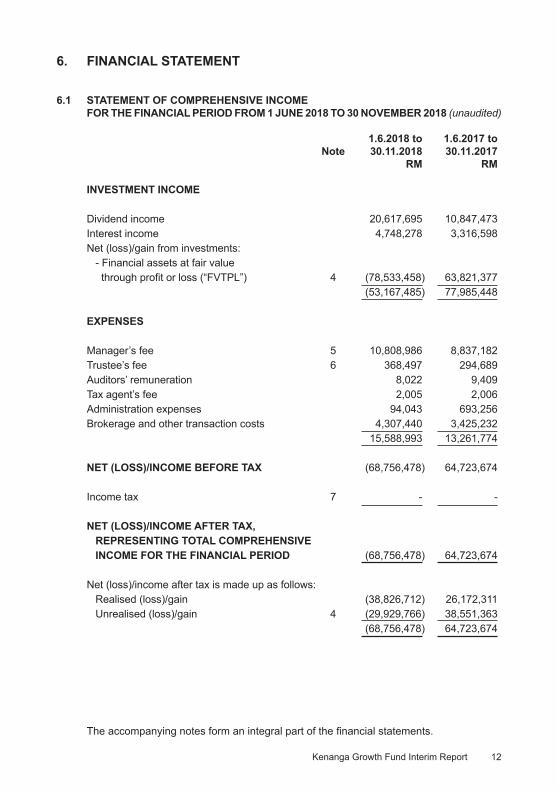
6.1 STATEMENT OF COMPREHENSIVE INCOME FOR THE FINANCIAL PERIOD FROM 1 JUNE 2018 TO 30 NOVEMBER 2018 (unaudited)
1.6.2018 to 1.6.2017 to Note 30.11.2018 30.11.2017 RM RM
INVESTMENT INCOME
Dividend income 20,617,695 10,847,473Interest income 4,748,278 3,316,598Net (loss)/gain from investments: - Financial assets at fair value through profi t or loss (“FVTPL”) 4 (78,533,458) 63,821,377 (53,167,485) 77,985,448
EXPENSES
Manager’s fee 5 10,808,986 8,837,182Trustee’s fee 6 368,497 294,689Auditors’ remuneration 8,022 9,409Tax agent’s fee 2,005 2,006Administration expenses 94,043 693,256Brokerage and other transaction costs 4,307,440 3,425,232 15,588,993 13,261,774
NET (LOSS)/INCOME BEFORE TAX (68,756,478) 64,723,674
Income tax 7 - -
NET (LOSS)/INCOME AFTER TAX, REPRESENTING TOTAL COMPREHENSIVE INCOME FOR THE FINANCIAL PERIOD (68,756,478) 64,723,674
Net (loss)/income after tax is made up as follows: Realised (loss)/gain (38,826,712) 26,172,311 Unrealised (loss)/gain 4 (29,929,766) 38,551,363 (68,756,478) 64,723,674

The accompanying notes form an integral part of the fi nancial statements.
Kenanga Growth Fund Interim Report13
6.2 STATEMENT OF FINANCIAL POSITION AS AT 30 NOVEMBER 2018 (unaudited)
Note 30.11.2018 30.11.2017 RM RM
ASSETS
INVESTMENTS
Financial assets at FVTPL 4 1,159,055,012 1,023,942,264Short term deposits 8 301,367,307 267,073,000 1,460,422,319 1,291,015,264
OTHER ASSETS
Amount due from licensed fi nancial institutions 9 1,426,602 10,057,140Other receivables 10 2,127,555 663,223Tax recoverable 16,671 16,671Cash at bank 22,407 42,696,998 3,593,235 53,434,032
TOTAL ASSETS 1,464,015,554 1,344,449,296
LIABILITIES
Amount due to licensed fi nancial institutions 9 30,745,662 28,207,364Amount due to Manager 721,104 1,190,417Amount due to Trustee 59,838 53,310Other payables 11 54,493 152,079TOTAL LIABILITIES 31,581,097 29,603,170
EQUITY
Unit holders’ contribution 1,406,074,413 1,074,174,158Retained earnings 26,360,044 240,671,968NET ASSET VALUE (“NAV”) ATTRIBUTABLE TO UNIT HOLDERS 12 1,432,434,457 1,314,846,126
TOTAL LIABILITIES AND EQUITY 1,464,015,554 1,344,449,296
NUMBER OF UNITS IN CIRCULATION 12(a) 1,361,672,777 1,080,230,647
NET ASSET VALUE PER UNIT (RM) 13 1.0520 1.2172

The accompanying notes form an integral part of the fi nancial statements.
Kenanga Growth Fund Interim Report 14
6.3 STATEMENT OF CHANGES IN NET ASSET VALUE FOR THE FINANCIAL PERIOD FROM 1 JUNE 2018 TO 30 NOVEMBER 2018 (unaudited)
Unit holders’ Retained Total Note contribution earnings NAV RM RM RM
1.6.2018 to 30.11.2018At beginning of the fi nancial period 1,266,512,664 95,116,522 1,361,629,186 Total comprehensive loss - (68,756,478) (68,756,478)Creation of units 12(a) 147,893,480 - 147,893,480 Cancellation of units 12(a) (8,590,626) - (8,590,626)Distribution equalisation 12(a) 258,895 - 258,895 At end of the fi nancial period 1,406,074,413 26,360,044 1,432,434,457
1.6.2017 to 30.11.2017At beginning of the fi nancial period 871,373,692 175,948,294 1,047,321,986 Total comprehensive income - 64,723,674 64,723,674 Creation of units 12(a) 226,588,952 - 226,588,952 Cancellation of units 12(a) (26,755,955) - (26,755,955)Distribution equalisation 12(a) 2,967,469 - 2,967,469 At end of the fi nancial period 1,074,174,158 240,671,968 1,314,846,126

15 Kenanga Growth Fund Interim Report
6.4 STATEMENT OF CASH FLOWS FOR THE FINANCIAL PERIOD FROM 1 JUNE 2018 TO 30 NOVEMBER 2018 (unaudited)
1.6.2018 to 1.6.2017 to Note 30.11.2018 30.11.2017 RM RM
CASH FLOWS FROM OPERATING AND INVESTING ACTIVITIES
Proceeds from sale of fi nancial assets at FVTPL 315,124,355 378,093,696 Proceeds from the maturity of investment 90,790,000 - Dividends received 21,577,992 11,886,777 Interest from deposits received 4,274,922 3,236,543 Auditors’ remuneration paid (16,000) (16,000)Payment for other fees and expenses (200,311) (621,462)Trustee’s fee paid (368,731) (287,733)Manager’s fee paid (10,815,997) (8,548,577)Placement of investment (202,239,307) - Purchase of fi nancial assets at FVTPL (411,354,905) (413,095,640)Net cash used in operating and investing activities (193,227,982) (29,352,396)
CASH FLOWS FROM FINANCING ACTIVITIES
Cash received from units created 149,111,732 232,336,045 Cash paid on units cancelled (8,366,768) (26,389,904)Net cash generated from fi nancing activities 140,744,964 205,946,141
NET (DECREASE)/INCREASE IN CASH AND CASH EQUIVALENTS (52,483,018) 176,593,745 CASH AND CASH EQUIVALENTS AT BEGINNING OF THE FINANCIAL PERIOD 242,423,425 133,176,253 CASH AND CASH EQUIVALENTS AT END OF THE FINANCIAL PERIOD 189,940,407 309,769,998
Cash and cash equivalents comprise: Cash at bank 22,407 42,696,998 Short term deposits 8 189,918,000 267,073,000 189,940,407 309,769,998
The accompanying notes form an integral part of the fi nancial statements.
16Kenanga Growth Fund Interim Report
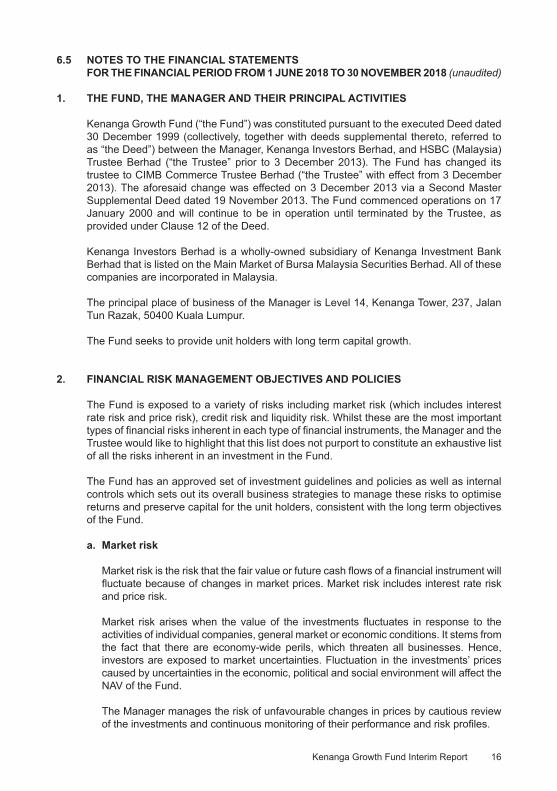
6.5 NOTES TO THE FINANCIAL STATEMENTS FOR THE FINANCIAL PERIOD FROM 1 JUNE 2018 TO 30 NOVEMBER 2018 (unaudited)
1. THE FUND, THE MANAGER AND THEIR PRINCIPAL ACTIVITIES
Kenanga Growth Fund (“the Fund”) was constituted pursuant to the executed Deed dated 30 December 1999 (collectively, together with deeds supplemental thereto, referred to as “the Deed”) between the Manager, Kenanga Investors Berhad, and HSBC (Malaysia) Trustee Berhad (“the Trustee” prior to 3 December 2013). The Fund has changed its trustee to CIMB Commerce Trustee Berhad (“the Trustee” with effect from 3 December 2013). The aforesaid change was effected on 3 December 2013 via a Second Master Supplemental Deed dated 19 November 2013. The Fund commenced operations on 17 January 2000 and will continue to be in operation until terminated by the Trustee, as provided under Clause 12 of the Deed.
Kenanga Investors Berhad is a wholly-owned subsidiary of Kenanga Investment Bank Berhad that is listed on the Main Market of Bursa Malaysia Securities Berhad. All of these companies are incorporated in Malaysia.
The principal place of business of the Manager is Level 14, Kenanga Tower, 237, Jalan Tun Razak, 50400 Kuala Lumpur.
The Fund seeks to provide unit holders with long term capital growth.
2. FINANCIAL RISK MANAGEMENT OBJECTIVES AND POLICIES
The Fund is exposed to a variety of risks including market risk (which includes interest rate risk and price risk), credit risk and liquidity risk. Whilst these are the most important types of fi nancial risks inherent in each type of fi nancial instruments, the Manager and the Trustee would like to highlight that this list does not purport to constitute an exhaustive list of all the risks inherent in an investment in the Fund.
The Fund has an approved set of investment guidelines and policies as well as internal
controls which sets out its overall business strategies to manage these risks to optimise returns and preserve capital for the unit holders, consistent with the long term objectives of the Fund.
a. Market risk
Market risk is the risk that the fair value or future cash fl ows of a fi nancial instrument will fl uctuate because of changes in market prices. Market risk includes interest rate risk and price risk.
Market risk arises when the value of the investments fl uctuates in response to the activities of individual companies, general market or economic conditions. It stems from the fact that there are economy-wide perils, which threaten all businesses. Hence, investors are exposed to market uncertainties. Fluctuation in the investments’ prices caused by uncertainties in the economic, political and social environment will affect the NAV of the Fund.
The Manager manages the risk of unfavourable changes in prices by cautious review of the investments and continuous monitoring of their performance and risk profi les.
17 Kenanga Growth Fund Interim Report
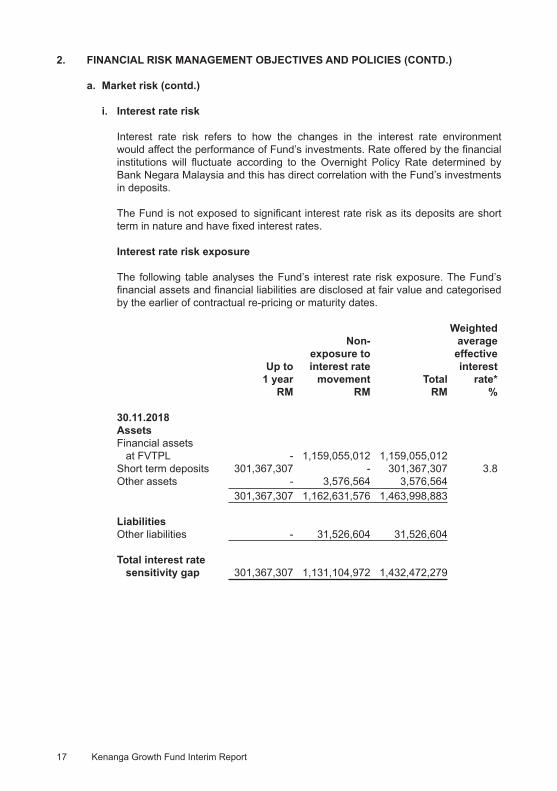
2. FINANCIAL RISK MANAGEMENT OBJECTIVES AND POLICIES (CONTD.) a. Market risk (contd.)
i. Interest rate risk
Interest rate risk refers to how the changes in the interest rate environment would affect the performance of Fund’s investments. Rate offered by the fi nancial institutions will fl uctuate according to the Overnight Policy Rate determined by Bank Negara Malaysia and this has direct correlation with the Fund’s investments in deposits.
The Fund is not exposed to signifi cant interest rate risk as its deposits are short term in nature and have fi xed interest rates.
Interest rate risk exposure
The following table analyses the Fund’s interest rate risk exposure. The Fund’s fi nancial assets and fi nancial liabilities are disclosed at fair value and categorised by the earlier of contractual re-pricing or maturity dates.
Weighted Non- average exposure to effective Up to interest rate interest 1 year movement Total rate* RM RM RM %
30.11.2018AssetsFinancial assets at FVTPL - 1,159,055,012 1,159,055,012Short term deposits 301,367,307 - 301,367,307 3.8Other assets - 3,576,564 3,576,564 301,367,307 1,162,631,576 1,463,998,883
LiabilitiesOther liabilities - 31,526,604 31,526,604
Total interest rate sensitivity gap 301,367,307 1,131,104,972 1,432,472,279

18Kenanga Growth Fund Interim Report
2. FINANCIAL RISK MANAGEMENT OBJECTIVES AND POLICIES (CONTD.) a. Market risk (contd.)
i. Interest rate risk (contd.)
Interest rate risk exposure (contd.)
Weighted Non- average exposure to effective Up to interest rate interest 1 year movement Total rate* RM RM RM %
30.11.2017AssetsFinancial assets at FVTPL - 1,023,942,264 1,023,942,264Short term deposits 267,073,000 - 267,073,000 3.3Other assets - 53,417,361 53,417,361 267,073,000 1,077,359,625 1,344,432,625
LiabilitiesOther liabilities - 29,451,091 29,451,091
Total interest rate sensitivity gap 267,073,000 1,047,908,534 1,314,981,534
* Computed based on assets with exposure to interest rate movement only.
ii. Price risk
Price risk is the risk of unfavourable changes in the fair values of listed equity securities, listed collective investment scheme, listed warrants, listed loan stock and unlisted collective investment schemes. The Fund invests in listed equity securities, listed collective investment scheme, listed warrants, listed loan stock and unlisted collective investment schemes which are exposed to price fl uctuations. This may then affect the NAV per unit of the Fund.
19 Kenanga Growth Fund Interim Report
2. FINANCIAL RISK MANAGEMENT OBJECTIVES AND POLICIES (CONTD.) ii. Price risk (contd.)
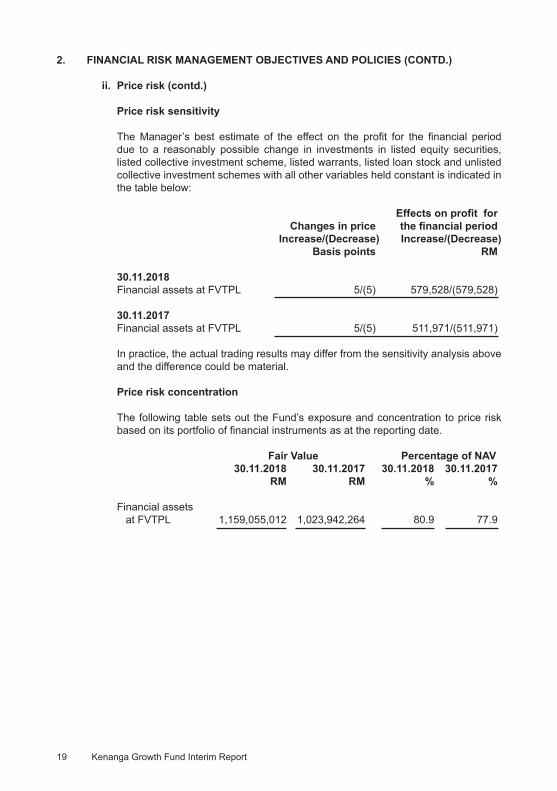
Price risk sensitivity
The Manager’s best estimate of the effect on the profi t for the fi nancial period due to a reasonably possible change in investments in listed equity securities, listed collective investment scheme, listed warrants, listed loan stock and unlisted collective investment schemes with all other variables held constant is indicated in the table below:
Effects on profi t for Changes in price the fi nancial period Increase/(Decrease) Increase/(Decrease) Basis points RM
30.11.2018 Financial assets at FVTPL 5/(5) 579,528/(579,528)
30.11.2017Financial assets at FVTPL 5/(5) 511,971/(511,971)
In practice, the actual trading results may differ from the sensitivity analysis above and the difference could be material.
Price risk concentration
The following table sets out the Fund’s exposure and concentration to price risk based on its portfolio of fi nancial instruments as at the reporting date.
Fair Value Percentage of NAV 30.11.2018 30.11.2017 30.11.2018 30.11.2017 RM RM % %
Financial assets at FVTPL 1,159,055,012 1,023,942,264 80.9 77.9
20Kenanga Growth Fund Interim Report
2. FINANCIAL RISK MANAGEMENT OBJECTIVES AND POLICIES (CONTD.) ii. Price risk (contd.)
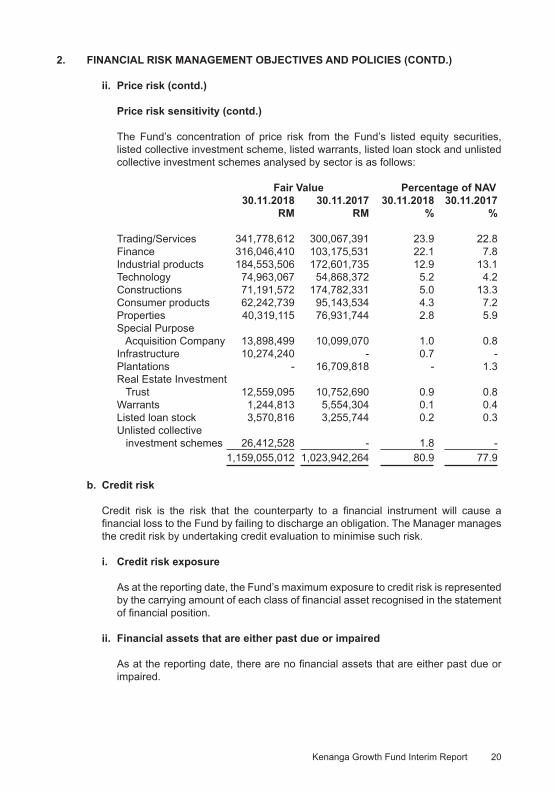
Price risk sensitivity (contd.)
The Fund’s concentration of price risk from the Fund’s listed equity securities, listed collective investment scheme, listed warrants, listed loan stock and unlisted collective investment schemes analysed by sector is as follows:
Fair Value Percentage of NAV 30.11.2018 30.11.2017 30.11.2018 30.11.2017 RM RM % %
Trading/Services 341,778,612 300,067,391 23.9 22.8Finance 316,046,410 103,175,531 22.1 7.8Industrial products 184,553,506 172,601,735 12.9 13.1Technology 74,963,067 54,868,372 5.2 4.2Constructions 71,191,572 174,782,331 5.0 13.3Consumer products 62,242,739 95,143,534 4.3 7.2Properties 40,319,115 76,931,744 2.8 5.9Special Purpose Acquisition Company 13,898,499 10,099,070 1.0 0.8Infrastructure 10,274,240 - 0.7 -Plantations - 16,709,818 - 1.3Real Estate Investment Trust 12,559,095 10,752,690 0.9 0.8Warrants 1,244,813 5,554,304 0.1 0.4Listed loan stock 3,570,816 3,255,744 0.2 0.3Unlisted collective investment schemes 26,412,528 - 1.8 - 1,159,055,012 1,023,942,264 80.9 77.9
b. Credit risk
Credit risk is the risk that the counterparty to a fi nancial instrument will cause a fi nancial loss to the Fund by failing to discharge an obligation. The Manager manages the credit risk by undertaking credit evaluation to minimise such risk.
i. Credit risk exposure
As at the reporting date, the Fund’s maximum exposure to credit risk is represented by the carrying amount of each class of fi nancial asset recognised in the statement of fi nancial position.
ii. Financial assets that are either past due or impaired
As at the reporting date, there are no fi nancial assets that are either past due or impaired.
21 Kenanga Growth Fund Interim Report
2. FINANCIAL RISK MANAGEMENT OBJECTIVES AND POLICIES (CONTD.) b. Credit risk (contd.)
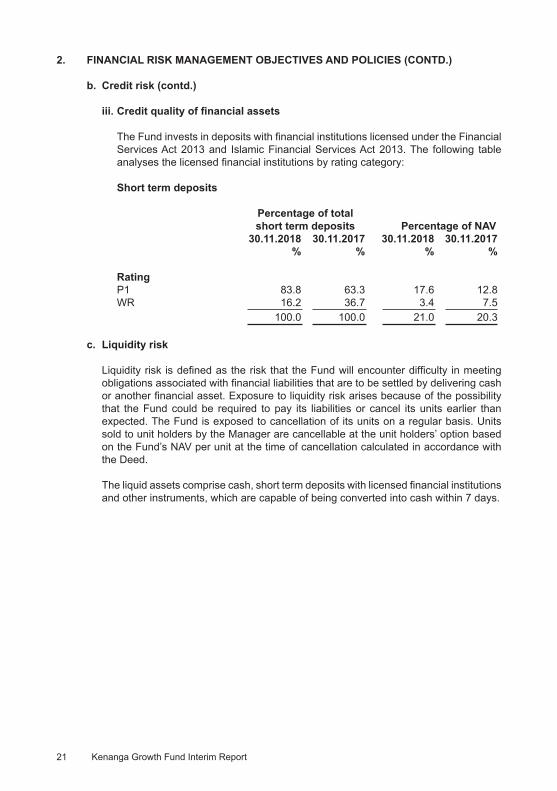
iii. Credit quality of fi nancial assets
The Fund invests in deposits with fi nancial institutions licensed under the Financial Services Act 2013 and Islamic Financial Services Act 2013. The following table analyses the licensed fi nancial institutions by rating category:
Short term deposits
Percentage of total short term deposits Percentage of NAV 30.11.2018 30.11.2017 30.11.2018 30.11.2017 % % % %
RatingP1 83.8 63.3 17.6 12.8 WR 16.2 36.7 3.4 7.5 100.0 100.0 21.0 20.3
c. Liquidity risk
Liquidity risk is defi ned as the risk that the Fund will encounter diffi culty in meeting obligations associated with fi nancial liabilities that are to be settled by delivering cash or another fi nancial asset. Exposure to liquidity risk arises because of the possibility that the Fund could be required to pay its liabilities or cancel its units earlier than expected. The Fund is exposed to cancellation of its units on a regular basis. Units sold to unit holders by the Manager are cancellable at the unit holders’ option based on the Fund’s NAV per unit at the time of cancellation calculated in accordance with the Deed.
The liquid assets comprise cash, short term deposits with licensed fi nancial institutions and other instruments, which are capable of being converted into cash within 7 days.
22Kenanga Growth Fund Interim Report
2. FINANCIAL RISK MANAGEMENT OBJECTIVES AND POLICIES (CONTD.) c. Liquidity risk (contd.)
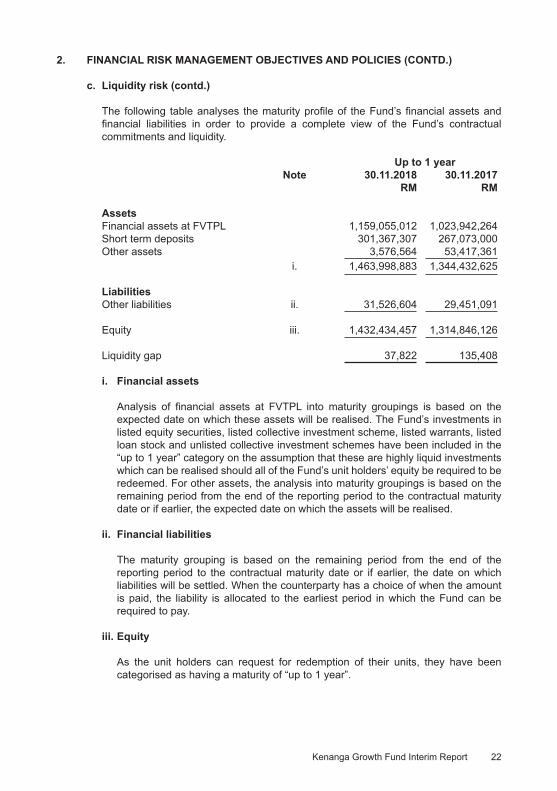
The following table analyses the maturity profi le of the Fund’s fi nancial assets and fi nancial liabilities in order to provide a complete view of the Fund’s contractual commitments and liquidity.
Up to 1 year Note 30.11.2018 30.11.2017 RM RM
AssetsFinancial assets at FVTPL 1,159,055,012 1,023,942,264 Short term deposits 301,367,307 267,073,000 Other assets 3,576,564 53,417,361 i. 1,463,998,883 1,344,432,625
LiabilitiesOther liabilities ii. 31,526,604 29,451,091
Equity iii. 1,432,434,457 1,314,846,126
Liquidity gap 37,822 135,408
i. Financial assets
Analysis of fi nancial assets at FVTPL into maturity groupings is based on the expected date on which these assets will be realised. The Fund’s investments in listed equity securities, listed collective investment scheme, listed warrants, listed loan stock and unlisted collective investment schemes have been included in the “up to 1 year” category on the assumption that these are highly liquid investments which can be realised should all of the Fund’s unit holders’ equity be required to be redeemed. For other assets, the analysis into maturity groupings is based on the remaining period from the end of the reporting period to the contractual maturity date or if earlier, the expected date on which the assets will be realised.
ii. Financial liabilities
The maturity grouping is based on the remaining period from the end of the reporting period to the contractual maturity date or if earlier, the date on which liabilities will be settled. When the counterparty has a choice of when the amount is paid, the liability is allocated to the earliest period in which the Fund can be required to pay.
iii. Equity
As the unit holders can request for redemption of their units, they have been categorised as having a maturity of “up to 1 year”.

23 Kenanga Growth Fund Interim Report
2. FINANCIAL RISK MANAGEMENT OBJECTIVES AND POLICIES (CONTD.) d. Regulatory reportings
It is the Manager’s responsibility to ensure full compliance of all requirements under the Guidelines on Unit Trust Funds issued by Securities Commission Malaysia. Any breach of any such requirement has been reported in the mandatory reporting to Securities Commission Malaysia on a monthly basis.
3. SUMMARY OF SIGNIFICANT ACCOUNTING POLICIES
a. Basis of accounting
The fi nancial statements of the Fund have been prepared in accordance with Malaysian Financial Reporting Standards (“MFRS”) as issued by the Malaysian Accounting Standards Board (“MASB”) and International Financial Reporting Standards (“IFRS”) as issued by the International Accounting Standards Board (“IASB”).
The accounting policies adopted are consistent with those of the previous fi nancial period except for the adoption of the new and amended MFRS which became effective for the Fund on 1 June 2018. The adoption of the new and amended MFRS did not have any signifi cant impact on the fi nancial position or performance of the Fund.
The fi nancial statements have been prepared on the historical cost basis except as disclosed in the accounting policies below.
b. Standards, amendments and interpretations issued but not yet effective
As at the reporting date, the following Standards, Amendments and Interpretation Committee’s (“IC”) Interpretations that have been issued by MASB will be effective for the Fund in future fi nancial periods. The Fund intends to adopt the relevant standards when they become effective.
Effective for fi nancial period beginning onDescription or after
Amendments to MFRS contained in the document entitled “Annual Improvements to MFRS Standards 2014 - 2016 Cycle” 1 January 2018Amendments to MFRS 1: First-time Adoption of Malaysian Financial Reporting Standards contained in the document entitled “Annual Improvements to MFRS Standards 2014 - 2016 Cycle” 1 January 2018Amendments to MFRS 128: Investments in Associates and Joint Ventures contained in the document entitled “Annual Improvements to MFRS Standards 2014 - 2016 Cycle” 1 January 2018MFRS 9: Financial Instruments 1 January 2018MFRS 15: Revenue from Contracts with Customers 1 January 2018Clarifi cations to MFRS 15: Revenue from Contracts with Customers 1 January 2018Amendments to MFRS 2: Classifi cation and Measurement of Shared-Based Payment Transactions 1 January 2018

24Kenanga Growth Fund Interim Report
3. SUMMARY OF SIGNIFICANT ACCOUNTING POLICIES
b. Standards, amendments and interpretations issued but not yet effective (contd.)
Effective for fi nancial period beginning onDescription or after
Temporary exemption from MFRS 9 subject to certain criteria being met for annual periods beginningAmendments to MFRS 4: Applying MFRS 9 Financial on or after Instruments with MFRS 4 Insurance Contracts 1 January 2018Amendments to MFRS 140: Transfers of Investment Property 1 January 2018IC Interpretation 22: Foreign Currency Transactions and Advance Consideration 1 January 2018Amendments to MFRS contained in the document entitled “Annual Improvements to MFRS Standards 2015 - 2017 Cycle” 1 January 2019Amendments to MFRS 3 and MFRS 11: Previously Held Interest in a Joint Operation contained in the document entitled “Annual Improvements to MFRS Standards 2015 - 2017 Cycle” 1 January 2019Amendments to MFRS 112: Income Tax Consequences of Payments on Financial Instruments Classifi ed as Equity contained in the document entitled “Annual Improvements to MFRS Standards 2015 - 2017 Cycle” 1 January 2019Amendments to MFRS 123: Borrowing Costs Eligible for Capitalisation contained in the document entitled “Annual Improvements to MFRS Standards 2015 - 2017 Cycle” 1 January 2019MFRS 16: Leases 1 January 2019Amendments to MFRS 9: Prepayment Features with Negative Compensation 1 January 2019Amendments to MFRS 119: Plan Amendment, Curtailment or Settlement 1 January 2019Amendments to MFRS 128: Long-term Interests in Associates and Joint Ventures 1 January 2019IC Interpretation 23: Uncertainty over Income Tax Treatments 1 January 2019Amendments to MFRS 2: Share-Based Payment 1 January 2020Amendments to MFRS 3: Business Combinations 1 January 2020Amendments to MFRS 6: Exploration for and Evaluation of Mineral Resources 1 January 2020Amendments to MFRS 14: Regulatory Deferral Accounts 1 January 2020Amendments to MFRS 101: Presentation of Financial Statements 1 January 2020Amendments to MFRS 108: Accounting Policies, Changes in Accounting Estimates and Errors 1 January 2020Amendments to MFRS 134: Interim Financial Reporting 1 January 2020Amendment to MFRS 137: Provisions, Contingent Liabilities and Contingent Assets 1 January 2020Amendment to MFRS 138: Intangible Assets 1 January 2020
25 Kenanga Growth Fund Interim Report
3. SUMMARY OF SIGNIFICANT ACCOUNTING POLICIES (CONTD.)
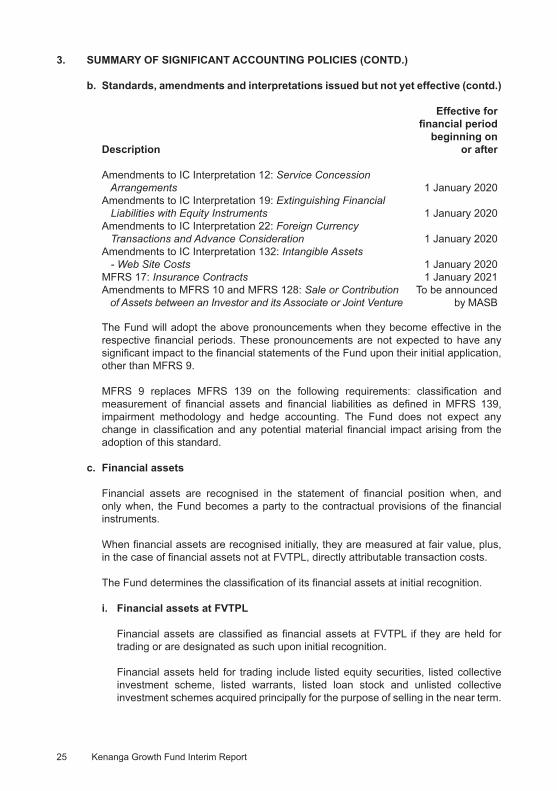
b. Standards, amendments and interpretations issued but not yet effective (contd.)
Effective for fi nancial period beginning onDescription or after
Amendments to IC Interpretation 12: Service Concession Arrangements 1 January 2020Amendments to IC Interpretation 19: Extinguishing Financial Liabilities with Equity Instruments 1 January 2020Amendments to IC Interpretation 22: Foreign Currency Transactions and Advance Consideration 1 January 2020Amendments to IC Interpretation 132: Intangible Assets - Web Site Costs 1 January 2020MFRS 17: Insurance Contracts 1 January 2021Amendments to MFRS 10 and MFRS 128: Sale or Contribution To be announced of Assets between an Investor and its Associate or Joint Venture by MASB
The Fund will adopt the above pronouncements when they become effective in the respective fi nancial periods. These pronouncements are not expected to have any signifi cant impact to the fi nancial statements of the Fund upon their initial application, other than MFRS 9.
MFRS 9 replaces MFRS 139 on the following requirements: classifi cation and measurement of fi nancial assets and fi nancial liabilities as defi ned in MFRS 139, impairment methodology and hedge accounting. The Fund does not expect any change in classifi cation and any potential material fi nancial impact arising from the adoption of this standard.
c. Financial assets
Financial assets are recognised in the statement of fi nancial position when, and only when, the Fund becomes a party to the contractual provisions of the fi nancial instruments.
When fi nancial assets are recognised initially, they are measured at fair value, plus, in the case of fi nancial assets not at FVTPL, directly attributable transaction costs.
The Fund determines the classifi cation of its fi nancial assets at initial recognition.
i. Financial assets at FVTPL
Financial assets are classifi ed as fi nancial assets at FVTPL if they are held for trading or are designated as such upon initial recognition.
Financial assets held for trading include listed equity securities, listed collective investment scheme, listed warrants, listed loan stock and unlisted collective investment schemes acquired principally for the purpose of selling in the near term.

26Kenanga Growth Fund Interim Report
3. SUMMARY OF SIGNIFICANT ACCOUNTING POLICIES (CONTD.)
c. Financial assets (contd.)
i. Financial assets at FVTPL (contd.)
Subsequent to initial recognition, fi nancial assets at FVTPL are measured at fair value. Changes in the fair value of those fi nancial instruments are recorded in profi t or loss.
Interest earned and dividend revenue elements of such instruments are recorded separately in “interest income” and “dividend income”, respectively.
ii. Receivables
Financial assets with fi xed or determinable payments that are not quoted in an active market are classifi ed as receivables.
Subsequent to initial recognition, receivables are measured at amortised cost using the effective interest method. Gain or loss is recognised in profi t or loss when the receivable is derecognised or impaired, and through the amortisation process.
A fi nancial asset is derecognised when the contractual right to receive cash fl ows from the asset has expired. On derecognition of a fi nancial asset, the difference between the carrying amount and the sum of the consideration received is recognised in profi t or loss.
d. Impairment of fi nancial assets
The Fund assesses at each reporting date whether there is any objective evidence that a fi nancial asset is impaired.
To determine whether there is objective evidence that an impairment loss on fi nancial assets has been incurred, the Fund considers factors such as the probability of insolvency or signifi cant fi nancial diffi culties of the debtor and default or signifi cant delay in payments.
If any such evidence exists, the amount of impairment loss is measured as the difference between the asset’s carrying amount and the present value of estimated future cash fl ows discounted at the fi nancial asset’s original effective interest rate. The impairment loss is recognised in profi t or loss.
The carrying amount of the fi nancial asset is reduced by the impairment loss directly for all fi nancial assets, with the exception of receivables, where the carrying amount is reduced through the use of an allowance account. When a receivable becomes uncollectible, it is written off against the allowance account.
If, in a subsequent fi nancial period, the amount of the impairment loss decreases and the decrease can be related objectively to an event occurring after the impairment was recognised, the previously recognised impairment loss is reversed to the extent that the carrying amount of the assets does not exceed its amortised cost at the reversal date. The amount of reversal is recognised in profi t or loss.
27 Kenanga Growth Fund Interim Report
3. SUMMARY OF SIGNIFICANT ACCOUNTING POLICIES (CONTD.)
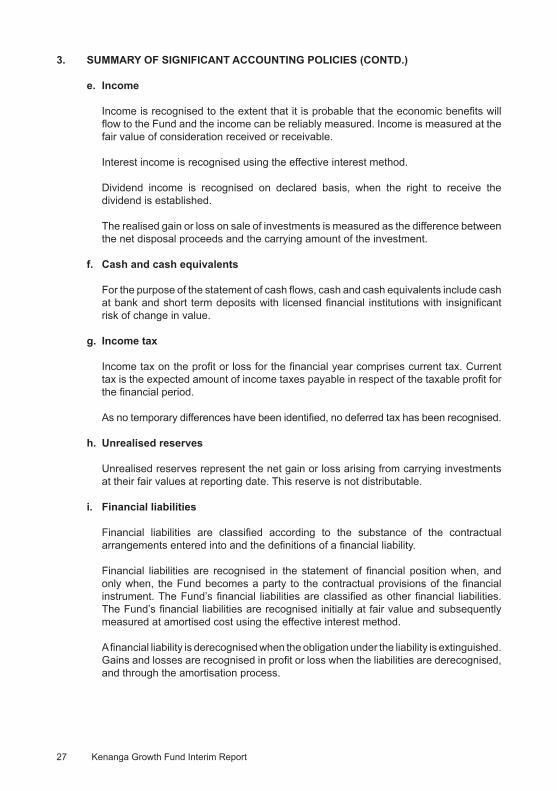
e. Income
Income is recognised to the extent that it is probable that the economic benefi ts will fl ow to the Fund and the income can be reliably measured. Income is measured at the fair value of consideration received or receivable.
Interest income is recognised using the effective interest method.
Dividend income is recognised on declared basis, when the right to receive the dividend is established.
The realised gain or loss on sale of investments is measured as the difference between the net disposal proceeds and the carrying amount of the investment.
f. Cash and cash equivalents
For the purpose of the statement of cash fl ows, cash and cash equivalents include cash at bank and short term deposits with licensed fi nancial institutions with insignifi cant risk of change in value.
g. Income tax
Income tax on the profi t or loss for the fi nancial year comprises current tax. Current tax is the expected amount of income taxes payable in respect of the taxable profi t for the fi nancial period.
As no temporary differences have been identifi ed, no deferred tax has been recognised.
h. Unrealised reserves
Unrealised reserves represent the net gain or loss arising from carrying investments at their fair values at reporting date. This reserve is not distributable.
i. Financial liabilities
Financial liabilities are classifi ed according to the substance of the contractual arrangements entered into and the defi nitions of a fi nancial liability.
Financial liabilities are recognised in the statement of fi nancial position when, and only when, the Fund becomes a party to the contractual provisions of the fi nancial instrument. The Fund’s fi nancial liabilities are classifi ed as other fi nancial liabilities. The Fund’s fi nancial liabilities are recognised initially at fair value and subsequently measured at amortised cost using the effective interest method.
A fi nancial liability is derecognised when the obligation under the liability is extinguished. Gains and losses are recognised in profi t or loss when the liabilities are derecognised, and through the amortisation process.
28Kenanga Growth Fund Interim Report
3. SUMMARY OF SIGNIFICANT ACCOUNTING POLICIES (CONTD.)
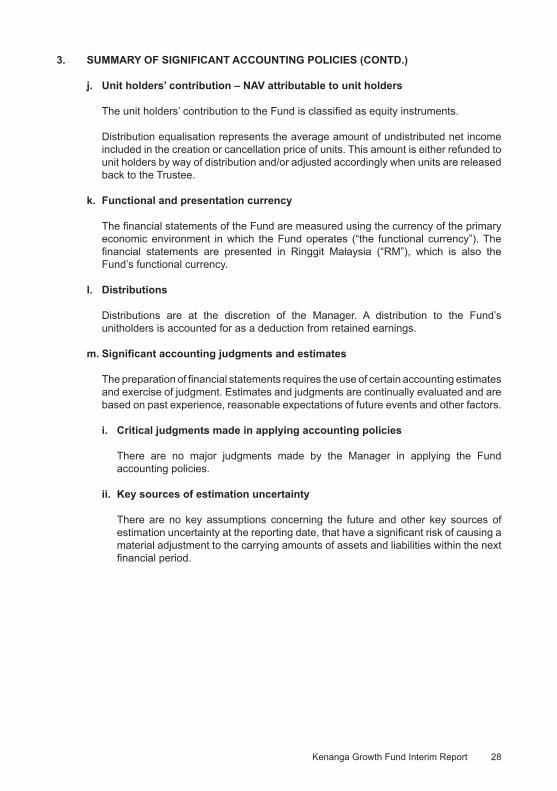
j. Unit holders’ contribution – NAV attributable to unit holders
The unit holders’ contribution to the Fund is classifi ed as equity instruments. Distribution equalisation represents the average amount of undistributed net income
included in the creation or cancellation price of units. This amount is either refunded to unit holders by way of distribution and/or adjusted accordingly when units are released back to the Trustee.
k. Functional and presentation currency
The fi nancial statements of the Fund are measured using the currency of the primary economic environment in which the Fund operates (“the functional currency”). The fi nancial statements are presented in Ringgit Malaysia (“RM”), which is also the Fund’s functional currency.
l. Distributions
Distributions are at the discretion of the Manager. A distribution to the Fund’s unitholders is accounted for as a deduction from retained earnings.
m. Signifi cant accounting judgments and estimates
The preparation of fi nancial statements requires the use of certain accounting estimates and exercise of judgment. Estimates and judgments are continually evaluated and are based on past experience, reasonable expectations of future events and other factors.
i. Critical judgments made in applying accounting policies
There are no major judgments made by the Manager in applying the Fund accounting policies.
ii. Key sources of estimation uncertainty
There are no key assumptions concerning the future and other key sources of estimation uncertainty at the reporting date, that have a signifi cant risk of causing a material adjustment to the carrying amounts of assets and liabilities within the next fi nancial period.
29 Kenanga Growth Fund Interim Report
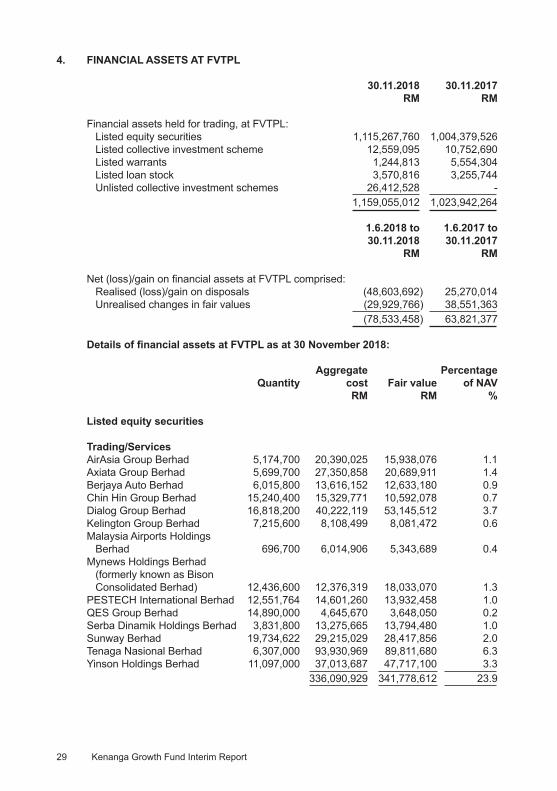
4. FINANCIAL ASSETS AT FVTPL
30.11.2018 30.11.2017 RM RM
Financial assets held for trading, at FVTPL: Listed equity securities 1,115,267,760 1,004,379,526 Listed collective investment scheme 12,559,095 10,752,690 Listed warrants 1,244,813 5,554,304 Listed loan stock 3,570,816 3,255,744 Unlisted collective investment schemes 26,412,528 - 1,159,055,012 1,023,942,264
1.6.2018 to 1.6.2017 to 30.11.2018 30.11.2017 RM RM
Net (loss)/gain on fi nancial assets at FVTPL comprised: Realised (loss)/gain on disposals (48,603,692) 25,270,014 Unrealised changes in fair values (29,929,766) 38,551,363 (78,533,458) 63,821,377
Details of fi nancial assets at FVTPL as at 30 November 2018:
Aggregate Percentage Quantity cost Fair value of NAV RM RM %
Listed equity securities
Trading/ServicesAirAsia Group Berhad 5,174,700 20,390,025 15,938,076 1.1 Axiata Group Berhad 5,699,700 27,350,858 20,689,911 1.4 Berjaya Auto Berhad 6,015,800 13,616,152 12,633,180 0.9 Chin Hin Group Berhad 15,240,400 15,329,771 10,592,078 0.7 Dialog Group Berhad 16,818,200 40,222,119 53,145,512 3.7 Kelington Group Berhad 7,215,600 8,108,499 8,081,472 0.6 Malaysia Airports Holdings Berhad 696,700 6,014,906 5,343,689 0.4 Mynews Holdings Berhad (formerly known as Bison Consolidated Berhad) 12,436,600 12,376,319 18,033,070 1.3 PESTECH International Berhad 12,551,764 14,601,260 13,932,458 1.0 QES Group Berhad 14,890,000 4,645,670 3,648,050 0.2 Serba Dinamik Holdings Berhad 3,831,800 13,275,665 13,794,480 1.0 Sunway Berhad 19,734,622 29,215,029 28,417,856 2.0 Tenaga Nasional Berhad 6,307,000 93,930,969 89,811,680 6.3 Yinson Holdings Berhad 11,097,000 37,013,687 47,717,100 3.3 336,090,929 341,778,612 23.9

30Kenanga Growth Fund Interim Report
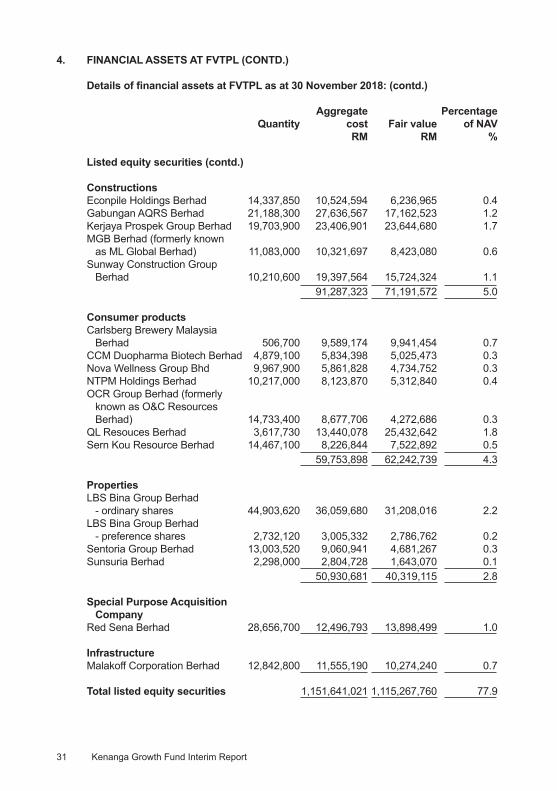
4. FINANCIAL ASSETS AT FVTPL (CONTD.)
Details of fi nancial assets at FVTPL as at 30 November 2018: (contd.)
Aggregate Percentage Quantity cost Fair value of NAV RM RM %
Listed equity securities (contd.)
FinanceAEON Credit Service (M) Berhad 920,700 11,299,924 13,994,640 1.0 Alliance Bank Malaysia Berhad (formerly known as Alliance Financial Group Berhad) 2,385,300 9,579,103 9,755,877 0.7 BIMB Holdings Berhad 1,881,800 7,738,638 7,132,022 0.5 Bursa Malaysia Berhad 4,116,800 32,377,644 28,776,432 2.0 CIMB Group Holdings Berhad 6,321,270 40,079,538 36,410,515 2.5 Hong Leong Bank Berhad 999,600 20,491,800 20,371,848 1.4 Hong Leong Financial Group Berhad 3,033,600 53,348,742 58,487,808 4.1 Malayan Banking Berhad 8,624,368 84,617,403 80,982,816 5.7 Public Bank Berhad 2,413,100 55,691,996 60,134,452 4.2 315,224,788 316,046,410 22.1
Industrial productsDRB-HICOM Berhad 9,499,900 21,321,468 17,574,815 1.2 Hibiscus Petroleum Berhad 34,671,600 32,970,522 34,671,600 2.4 Hil Industries Berhad 5,581,800 4,465,440 3,069,990 0.2 Pecca Group Berhad 4,198,500 6,764,703 3,274,830 0.2 Pentamaster Corporation Berhad 6,033,800 17,401,251 18,463,428 1.3 PETRONAS Chemicals Group Berhad 5,212,300 44,721,057 47,901,037 3.4 Press Metal Aluminium Holdings Berhad (formerly known as Press Metal Berhad) 2,363,600 11,457,416 11,250,736 0.8 Rohas Tecnic Berhad (formerly known as Tecnic Group Berhad) 13,962,500 19,658,354 11,658,688 0.8 SKP Resources Bhd 7,383,000 9,040,535 8,342,790 0.6 Top Glove Corporation Berhad 3,196,600 16,612,266 19,051,736 1.3 V. S. Industry Berhad 5,957,600 9,504,907 9,293,856 0.7 193,917,919 184,553,506 12.9
TechnologyD & O Green Technologies Berhad 4,395,300 3,854,937 3,450,311 0.2 Frontken Corporation Berhad 17,940,500 15,225,429 14,442,102 1.0 Globetronics Technology Bhd. 15,091,433 38,705,860 31,088,352 2.2 Inari Amertron Berhad 15,746,850 22,597,274 25,982,302 1.8 80,383,500 74,963,067 5.2
31 Kenanga Growth Fund Interim Report
4. FINANCIAL ASSETS AT FVTPL (CONTD.)
Details of fi nancial assets at FVTPL as at 30 November 2018: (contd.)
Aggregate Percentage Quantity cost Fair value of NAV RM RM %
Listed equity securities (contd.)
ConstructionsEconpile Holdings Berhad 14,337,850 10,524,594 6,236,965 0.4 Gabungan AQRS Berhad 21,188,300 27,636,567 17,162,523 1.2 Kerjaya Prospek Group Berhad 19,703,900 23,406,901 23,644,680 1.7 MGB Berhad (formerly known as ML Global Berhad) 11,083,000 10,321,697 8,423,080 0.6 Sunway Construction Group Berhad 10,210,600 19,397,564 15,724,324 1.1 91,287,323 71,191,572 5.0
Consumer productsCarlsberg Brewery Malaysia Berhad 506,700 9,589,174 9,941,454 0.7 CCM Duopharma Biotech Berhad 4,879,100 5,834,398 5,025,473 0.3 Nova Wellness Group Bhd 9,967,900 5,861,828 4,734,752 0.3 NTPM Holdings Berhad 10,217,000 8,123,870 5,312,840 0.4 OCR Group Berhad (formerly known as O&C Resources Berhad) 14,733,400 8,677,706 4,272,686 0.3 QL Resouces Berhad 3,617,730 13,440,078 25,432,642 1.8 Sern Kou Resource Berhad 14,467,100 8,226,844 7,522,892 0.5 59,753,898 62,242,739 4.3
PropertiesLBS Bina Group Berhad - ordinary shares 44,903,620 36,059,680 31,208,016 2.2 LBS Bina Group Berhad - preference shares 2,732,120 3,005,332 2,786,762 0.2 Sentoria Group Berhad 13,003,520 9,060,941 4,681,267 0.3 Sunsuria Berhad 2,298,000 2,804,728 1,643,070 0.1 50,930,681 40,319,115 2.8
Special Purpose Acquisition CompanyRed Sena Berhad 28,656,700 12,496,793 13,898,499 1.0
InfrastructureMalakoff Corporation Berhad 12,842,800 11,555,190 10,274,240 0.7
Total listed equity securities 1,151,641,021 1,115,267,760 77.9
32Kenanga Growth Fund Interim Report
4. FINANCIAL ASSETS AT FVTPL (CONTD.)
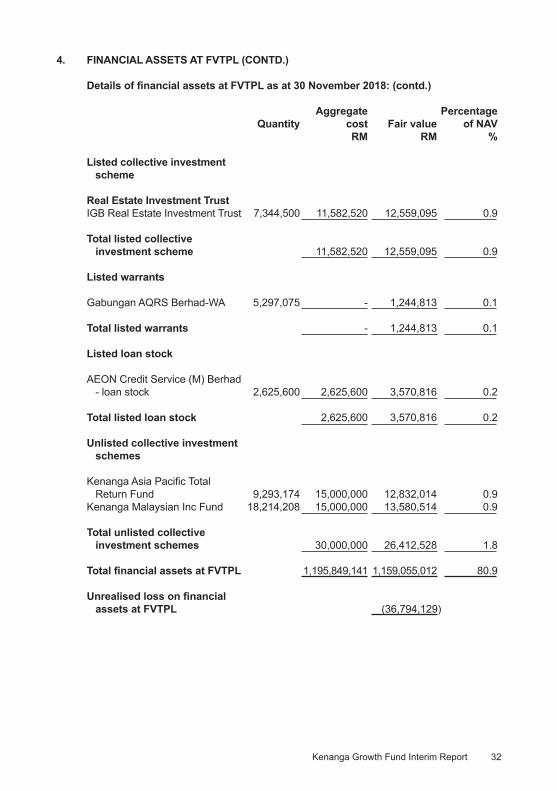
Details of fi nancial assets at FVTPL as at 30 November 2018: (contd.)
Aggregate Percentage Quantity cost Fair value of NAV RM RM %
Listed collective investment scheme
Real Estate Investment TrustIGB Real Estate Investment Trust 7,344,500 11,582,520 12,559,095 0.9
Total listed collective investment scheme 11,582,520 12,559,095 0.9
Listed warrants
Gabungan AQRS Berhad-WA 5,297,075 - 1,244,813 0.1
Total listed warrants - 1,244,813 0.1
Listed loan stock
AEON Credit Service (M) Berhad - loan stock 2,625,600 2,625,600 3,570,816 0.2
Total listed loan stock 2,625,600 3,570,816 0.2
Unlisted collective investment schemes
Kenanga Asia Pacifi c Total Return Fund 9,293,174 15,000,000 12,832,014 0.9 Kenanga Malaysian Inc Fund 18,214,208 15,000,000 13,580,514 0.9
Total unlisted collective investment schemes 30,000,000 26,412,528 1.8
Total fi nancial assets at FVTPL 1,195,849,141 1,159,055,012 80.9
Unrealised loss on fi nancial assets at FVTPL (36,794,129)

33 Kenanga Growth Fund Interim Report
5. MANAGER’S FEE
The Manager’s fee is calculated on a daily basis at a rate not exceeding 1.50% per annum of the NAV of the Fund as provided under Clause 13.1 of the Deed.
The Manager is currently charging Manager’s fee of 1.50% per annum of the NAV of the Fund (fi nancial period from 1 June 2017 to 30 November 2017: 1.50% per annum).
6. TRUSTEE’S FEE
Pursuant to the Third Master Supplemental Deed dated 25 July 2014, the Trustee’s fee is calculated at a rate not exceeding 0.05% per annum of the NAV of the Fund effective from 1 August 2014.
The Trustee’s fee is currently calculated at 0.05% per annum (fi nancial period from 1 June 2017 to 30 November 2017: 0.05% per annum) of the NAV of the Fund.
7. INCOME TAX
Income tax is calculated at the Malaysian statutory tax rate of 24% of the estimated assessable income for the current and previous fi nancial periods.
Income tax is calculated on investment income less partial deduction for permitted expenses as provided for under Section 63B of the Income Tax Act, 1967.
A reconciliation of income tax expense applicable to net (loss)/income before tax at the statutory income tax rate to income tax expense at the effective income tax rate of the Fund is as follows:
1.6.2018 to 1.6.2017 to 30.11.2018 30.11.2017 RM RM
Net (loss)/income before tax (68,756,478) 64,723,674
Tax at Malaysian statutory tax rate of 24% (fi nancial period from 1 June 2017 to 30 November 2017: 24%) (16,501,555) 15,533,682 Tax effect of: Income not subject to tax (6,087,834) (18,716,508) Loss not deductible for tax purposes 19,475,090 - Expenses not deductible for tax purposes 437,742 1,047,611 Restriction on tax deductible expenses for unit trust fund 2,676,557 2,135,215 Income tax for the fi nancial period - -
34Kenanga Growth Fund Interim Report
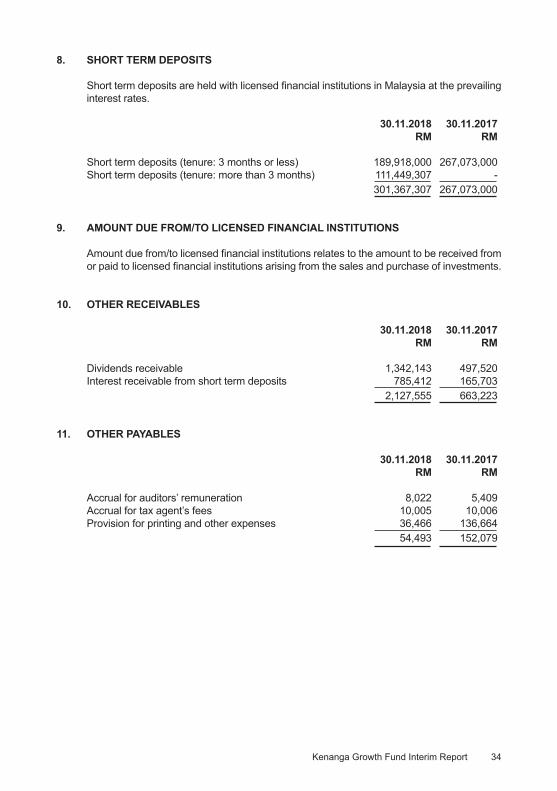
8. SHORT TERM DEPOSITS
Short term deposits are held with licensed fi nancial institutions in Malaysia at the prevailing interest rates.
30.11.2018 30.11.2017 RM RM
Short term deposits (tenure: 3 months or less) 189,918,000 267,073,000Short term deposits (tenure: more than 3 months) 111,449,307 - 301,367,307 267,073,000
9. AMOUNT DUE FROM/TO LICENSED FINANCIAL INSTITUTIONS
Amount due from/to licensed fi nancial institutions relates to the amount to be received from or paid to licensed fi nancial institutions arising from the sales and purchase of investments.
10. OTHER RECEIVABLES
30.11.2018 30.11.2017 RM RM
Dividends receivable 1,342,143 497,520 Interest receivable from short term deposits 785,412 165,703 2,127,555 663,223
11. OTHER PAYABLES
30.11.2018 30.11.2017 RM RM
Accrual for auditors’ remuneration 8,022 5,409 Accrual for tax agent’s fees 10,005 10,006 Provision for printing and other expenses 36,466 136,664 54,493 152,079

35 Kenanga Growth Fund Interim Report
12. NET ASSET VALUE ATTRIBUTABLE TO UNIT HOLDERS
NAV attributed to unit holders is represented by:
Note 30.11.2018 30.11.2017 RM RM
Unit holders’ contribution (a) 1,406,074,413 1,074,174,158
Retained earnings: Realised reserve 63,154,173 60,627,638 Unrealised reserve (36,794,129) 180,044,330 26,360,044 240,671,968
1,432,434,457 1,314,846,126
(a) Unit holders’ contribution
1.6.2018 to 30.11.2018 1.6.2017 to 30.11.2017 No. of units RM No. of units RM
At beginning of the fi nancial period 1,237,707,962 1,266,512,664 909,460,410 871,373,692Add: Creation of units 131,767,554 147,893,480 193,571,412 226,588,952Less: Cancellation of units (7,802,739) (8,590,626) (22,801,175) (26,755,955)Distribution equalisation - 258,895 - 2,967,469At end of the fi nancial period 1,361,672,777 1,406,074,413 1,080,230,647 1,074,174,158
The number of units legally or benefi cially held by the Manager, Kenanga Investors Berhad and parties related to the Manager as at 30 November 2018 were nil (30 November 2017: nil).

36Kenanga Growth Fund Interim Report
13. NET ASSET VALUE PER UNIT
In line with the adoption of MFRS 139, fi nancial assets at FVTPL have been valued at the bid prices at the close of business. In accordance with the Deed, the calculation of NAV attributable to unit holders per unit for the creation and cancellation of units is computed based on fi nancial assets at FVTPL valued at the last done market price.
A reconciliation of NAV attributable to unit holders for creation/cancellation of units and the NAV attributable to unit holders per the fi nancial statements is as follows:
30.11.2018 30.11.2017 RM RM/Unit RM RM/Unit
NAV attributable to unit holders for creation/cancellation of units 1,438,642,493 1.0565 1,321,796,910 1.2236Effects of adopting bid prices as fair value (6,208,036) (0.0045) (6,950,784) (0.0064)NAV attributable to unit holders per statement of fi nancial position 1,432,434,457 1.0520 1,314,846,126 1.2172
14. PORTFOLIO TURNOVER RATIO (“PTR”)
PTR for the fi nancial period from 1 June 2018 to 30 November 2018 is 0.25 times (fi nancial period from 1 June 2017 to 30 November 2017: 0.28 times).
PTR is the ratio of average sum of acquisitions and disposals of investments of the Fund for the fi nancial period to the average NAV of the Fund, calculated on a daily basis.
15. MANAGEMENT EXPENSE RATIO (“MER”)
MER for the fi nancial period from 1 June 2018 to 30 November 2018 is 1.53% per annum (fi nancial period from 1 June 2017 to 30 November 2017: 1.61% per annum).
MER is the ratio of total fees and recovered expenses of the Fund expressed as a percentage of the Fund’s average NAV, calculated on a daily basis.
37 Kenanga Growth Fund Interim Report
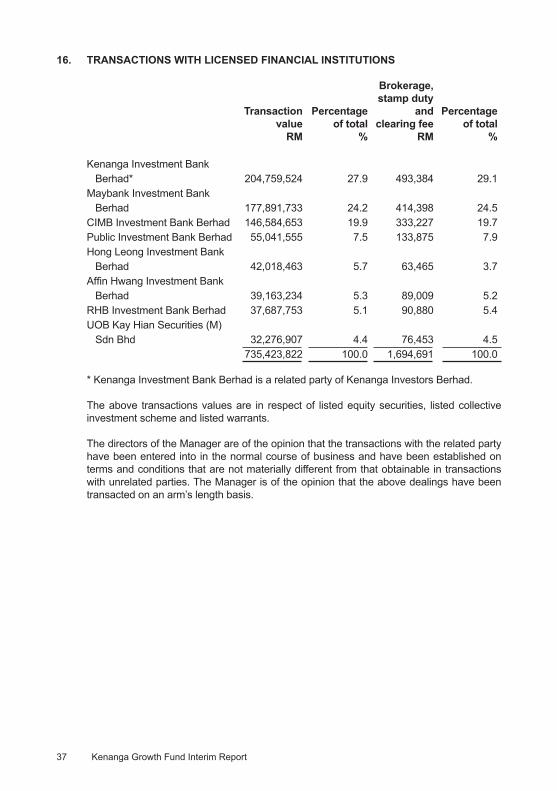
16. TRANSACTIONS WITH LICENSED FINANCIAL INSTITUTIONS
Brokerage, stamp duty Transaction Percentage and Percentage value of total clearing fee of total RM % RM %
Kenanga Investment Bank Berhad* 204,759,524 27.9 493,384 29.1Maybank Investment Bank Berhad 177,891,733 24.2 414,398 24.5CIMB Investment Bank Berhad 146,584,653 19.9 333,227 19.7Public Investment Bank Berhad 55,041,555 7.5 133,875 7.9Hong Leong Investment Bank Berhad 42,018,463 5.7 63,465 3.7Affi n Hwang Investment Bank Berhad 39,163,234 5.3 89,009 5.2RHB Investment Bank Berhad 37,687,753 5.1 90,880 5.4UOB Kay Hian Securities (M) Sdn Bhd 32,276,907 4.4 76,453 4.5 735,423,822 100.0 1,694,691 100.0
* Kenanga Investment Bank Berhad is a related party of Kenanga Investors Berhad.
The above transactions values are in respect of listed equity securities, listed collective investment scheme and listed warrants.
The directors of the Manager are of the opinion that the transactions with the related party have been entered into in the normal course of business and have been established on terms and conditions that are not materially different from that obtainable in transactions with unrelated parties. The Manager is of the opinion that the above dealings have been transacted on an arm’s length basis.

38Kenanga Growth Fund Interim Report
17. SEGMENTAL REPORTING
a. Business segments
In accordance with the objective of the Fund, the Fund can invest 75% to 95% in listed Malaysian investment securities. The following table provides an analysis of the Fund’s revenue, results, assets and liabilities by business segments:
Listed investment Other securities investments Total RM RM RM
1.6.2018 to 30.11.2018RevenueSegment (loss)/income (57,915,763) 4,748,278 Segment expenses (4,307,440) - Net segment (loss)/income representing segment results (62,223,203) 4,748,278 (57,474,925)Unallocated expenditure (11,281,553)Loss before tax (68,756,478)Income tax -Net loss after tax (68,756,478)
30.11.2018AssetsFinancial assets at FVTPL 1,159,055,012 -Short term deposits - 301,367,307Other segment assets 2,768,745 785,412Total segment assets 1,161,823,757 302,152,719 1,463,976,476 Unallocated assets 39,078 1,464,015,554
LiabilitiesSegment liabilities 30,745,662 - 30,745,662 Unallocated liabilities 835,435 31,581,097

39 Kenanga Growth Fund Interim Report
17. SEGMENTAL REPORTING (CONTD.)
a. Business segments (contd.)
Listed investment Other securities investments Total RM RM RM
1.6.2017 to 30.11.2017RevenueSegment income 74,668,850 3,316,598Segment expenses (3,425,232) -Net segment income representing segment results 71,243,618 3,316,598 74,560,216 Unallocated expenditure (9,836,542)Income before tax 64,723,674 Income tax - Net income after tax 64,723,674
30.11.2017AssetsFinancial assets at FVTPL 1,023,942,264 -Short term deposits - 267,073,000Other segment assets 10,554,660 165,703Total segment assets 1,034,496,924 267,238,703 1,301,735,627 Unallocated assets 42,713,669 1,344,449,296
LiabilitiesSegment liabilities 28,207,364 - 28,207,364 Unallocated liabilities 1,395,806 29,603,170
b. Geographical segments
As all of the Fund’s investments are located in Malaysia, disclosure by geographical segments is not relevant.

40Kenanga Growth Fund Interim Report
18. FINANCIAL INSTRUMENTS
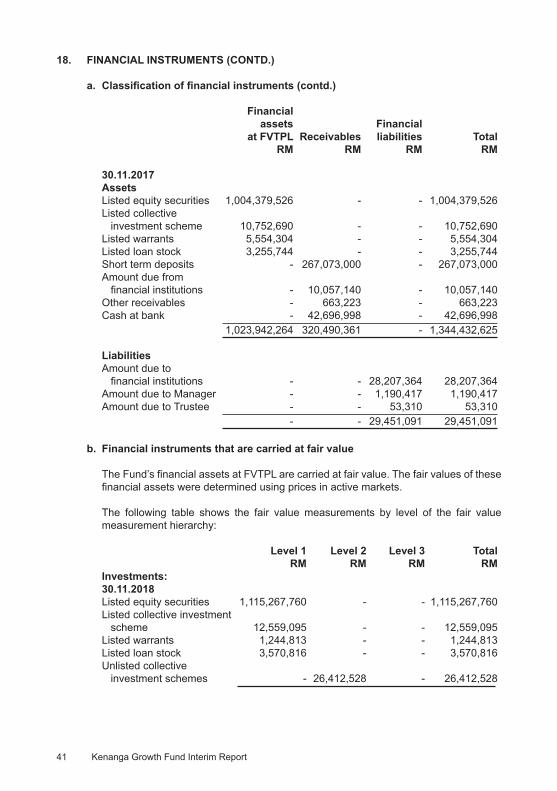
a. Classifi cation of fi nancial instruments
The Fund’s fi nancial assets and fi nancial liabilities are measured on an ongoing basis at either fair value or at amortised cost based on their respective classifi cation. The signifi cant accounting policies in Note 3 describe how the classes of fi nancial instruments are measured, and how income and expenses, including fair value gains and losses, are recognised.
The following table analyses the fi nancial assets and fi nancial liabilities of the Fund in the statement of fi nancial position by the class of fi nancial instruments to which they are assigned and therefore by the measurement basis.
Financial assets Financial at FVTPL Receivables liabilities Total RM RM RM RM
30.11.2018AssetsListed equity securities 1,115,267,760 - - 1,115,267,760 Listed collective investment scheme 12,559,095 - - 12,559,095 Listed warrants 1,244,813 - - 1,244,813 Listed loan stock 3,570,816 - - 3,570,816 Unlisted collective investment schemes 26,412,528 - - 26,412,528 Short term deposits - 301,367,307 - 301,367,307 Amount due from fi nancial institutions - 1,426,602 - 1,426,602 Other receivables - 2,127,555 - 2,127,555 Cash at bank - 22,407 - 22,406 1,159,055,012 304,943,871 - 1,463,998,883 Liabilities Amount due to fi nancial institutions - - 30,745,662 30,745,662 Amount due to Manager - - 721,104 721,104 Amount due to Trustee - - 59,838 59,838 - - 31,526,604 31,526,604
41 Kenanga Growth Fund Interim Report
18. FINANCIAL INSTRUMENTS (CONTD.)
a. Classifi cation of fi nancial instruments (contd.)
Financial assets Financial at FVTPL Receivables liabilities Total RM RM RM RM
30.11.2017AssetsListed equity securities 1,004,379,526 - - 1,004,379,526 Listed collective investment scheme 10,752,690 - - 10,752,690 Listed warrants 5,554,304 - - 5,554,304 Listed loan stock 3,255,744 - - 3,255,744 Short term deposits - 267,073,000 - 267,073,000 Amount due from fi nancial institutions - 10,057,140 - 10,057,140 Other receivables - 663,223 - 663,223 Cash at bank - 42,696,998 - 42,696,998 1,023,942,264 320,490,361 - 1,344,432,625
LiabilitiesAmount due to fi nancial institutions - - 28,207,364 28,207,364 Amount due to Manager - - 1,190,417 1,190,417 Amount due to Trustee - - 53,310 53,310 - - 29,451,091 29,451,091
b. Financial instruments that are carried at fair value
The Fund’s fi nancial assets at FVTPL are carried at fair value. The fair values of these fi nancial assets were determined using prices in active markets.
The following table shows the fair value measurements by level of the fair value measurement hierarchy:
Level 1 Level 2 Level 3 Total RM RM RM RMInvestments:30.11.2018Listed equity securities 1,115,267,760 - - 1,115,267,760 Listed collective investment scheme 12,559,095 - - 12,559,095 Listed warrants 1,244,813 - - 1,244,813 Listed loan stock 3,570,816 - - 3,570,816 Unlisted collective investment schemes - 26,412,528 - 26,412,528
42Kenanga Growth Fund Interim Report
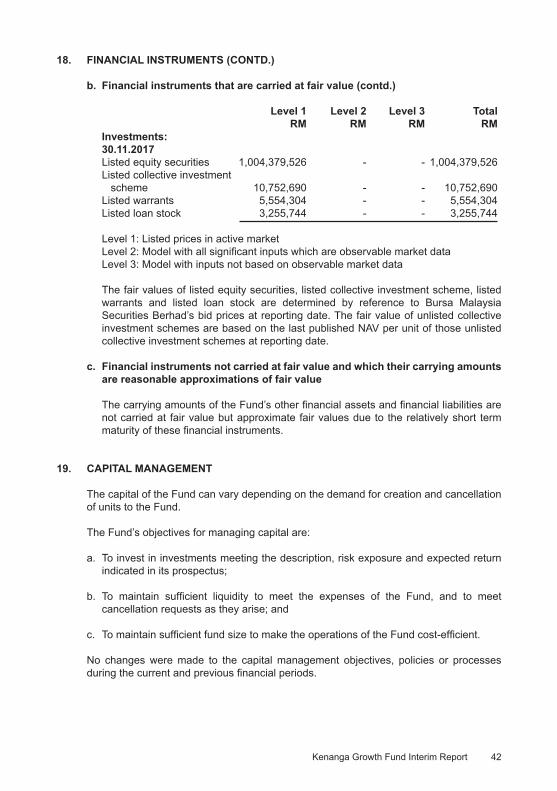
18. FINANCIAL INSTRUMENTS (CONTD.)
b. Financial instruments that are carried at fair value (contd.)
Level 1 Level 2 Level 3 Total RM RM RM RMInvestments:30.11.2017Listed equity securities 1,004,379,526 - - 1,004,379,526 Listed collective investment scheme 10,752,690 - - 10,752,690 Listed warrants 5,554,304 - - 5,554,304 Listed loan stock 3,255,744 - - 3,255,744
Level 1: Listed prices in active marketLevel 2: Model with all signifi cant inputs which are observable market dataLevel 3: Model with inputs not based on observable market data
The fair values of listed equity securities, listed collective investment scheme, listed warrants and listed loan stock are determined by reference to Bursa Malaysia Securities Berhad’s bid prices at reporting date. The fair value of unlisted collective investment schemes are based on the last published NAV per unit of those unlisted collective investment schemes at reporting date.
c. Financial instruments not carried at fair value and which their carrying amounts are reasonable approximations of fair value
The carrying amounts of the Fund’s other fi nancial assets and fi nancial liabilities are not carried at fair value but approximate fair values due to the relatively short term maturity of these fi nancial instruments.
19. CAPITAL MANAGEMENT
The capital of the Fund can vary depending on the demand for creation and cancellation of units to the Fund.
The Fund’s objectives for managing capital are:
a. To invest in investments meeting the description, risk exposure and expected return indicated in its prospectus;
b. To maintain suffi cient liquidity to meet the expenses of the Fund, and to meet cancellation requests as they arise; and
c. To maintain suffi cient fund size to make the operations of the Fund cost-effi cient.
No changes were made to the capital management objectives, policies or processes during the current and previous fi nancial periods.

This page has been intentionally left blank

This page has been intentionally left blank

This page has been intentionally left blank


Investor Services Center Head Offi ce, Kuala LumpurToll Free Line: 1 800 88 3737 Level 14, Kenanga Tower, 237, Jalan Tun RazakFax: +603 2172 3133 50400 Kuala Lumpur, MalaysiaEmail: [email protected] Tel: 03-2172 3000 Fax: 03-2172 3080