katrina hindcast - scenario a1: maximum surge elevation in ... · maximum a1 katrina hindcast -...
TRANSCRIPT

Maximum A1
Katrina Hindcast - Scenario A1: Maximum surge elevation in and around St. Bernard Parish
Figure 17
Case 1:05-cv-01119-SGB Document 241-5 Filed 11/12/13 Page 1 of 91

Maximum A1
Katrina Hindcast - Scenario A1: Maximum surge elevation in western St. Bernard Polder
Figure 18
Case 1:05-cv-01119-SGB Document 241-5 Filed 11/12/13 Page 2 of 91

• The A1 Scenario modeling results in and around St. Bernard Polder and at each Trial Property location closely match the high water mark (HWM) data and other forensic evidence collected in the aftermath of Hurricane Katrina.
• The HWM data throughout the region are used as the indicators of the maximum “still-water levels” and do not include the active motion of wind waves but do include the effects of wave setup. The HWM data is obtained from three data sets: USACE; URS/FEMA; Fitzgerald (Ebersole et al., 2007; URS 2006; Bunya et al., 2010; Fitzgerald, 2013).
• As shown in the following series of slides (Figures 19a-zzk), the ADCIRC modeling in and around St. Bernard Polder shows an average absolute difference between data and model of 0.59 ft, a standard deviation of 0.75 ft; and a 95% confidence interval of 1.50 ft.
Katrina Hindcast - Scenario A1: HWM comparison of model to data Case 1:05-cv-01119-SGB Document 241-5 Filed 11/12/13 Page 3 of 91
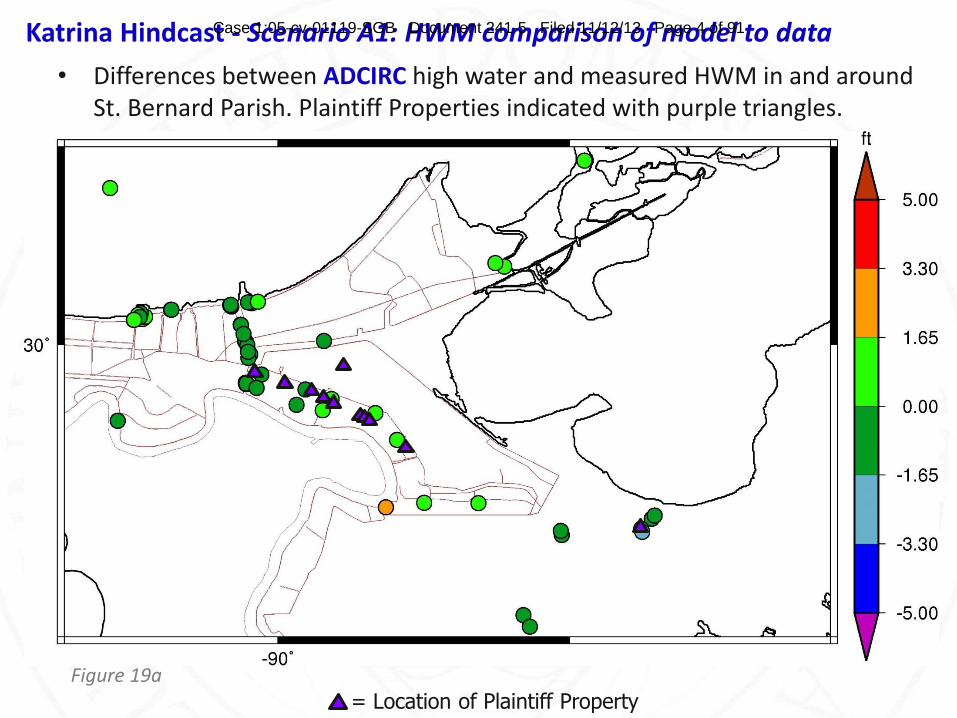
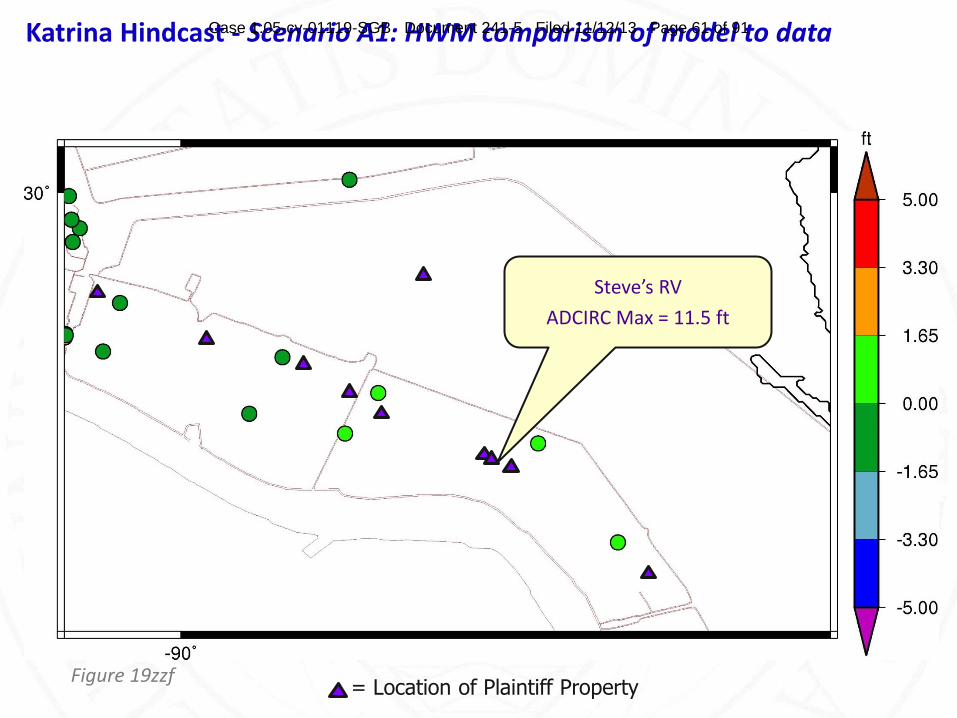
• Differences between ADCIRC high water and measured HWM in and around St. Bernard Parish. Plaintiff Properties indicated with purple triangles.
= Location of Plaintiff Property
Katrina Hindcast - Scenario A1: HWM comparison of model to data
Figure 19a
Case 1:05-cv-01119-SGB Document 241-5 Filed 11/12/13 Page 4 of 91

= Location of Plaintiff Property
Measured HWM = 16.4 ft
ADCIRC Max = 16.1 ft Difference = -0.3 ft
Katrina Hindcast - Scenario A1: HWM comparison of model to data
Figure 19b
Case 1:05-cv-01119-SGB Document 241-5 Filed 11/12/13 Page 5 of 91

= Location of Plaintiff Property
Measured HWM = 16.5 ft
ADCIRC Max = 15.9 ft Difference = -0.6 ft
Katrina Hindcast - Scenario A1: HWM comparison of model to data
Figure 19c
Case 1:05-cv-01119-SGB Document 241-5 Filed 11/12/13 Page 6 of 91

= Location of Plaintiff Property
Measured HWM = 17.1 ft
ADCIRC Max = 16.5 ft Difference = -0.6 ft
Katrina Hindcast - Scenario A1: HWM comparison of model to data
Figure 19d
Case 1:05-cv-01119-SGB Document 241-5 Filed 11/12/13 Page 7 of 91

= Location of Plaintiff Property
Measured HWM = 17.1 ft
ADCIRC Max = 16.5 ft Difference = -0.6 ft
Katrina Hindcast - Scenario A1: HWM comparison of model to data
Figure 19e
Case 1:05-cv-01119-SGB Document 241-5 Filed 11/12/13 Page 8 of 91

= Location of Plaintiff Property
Measured HWM = 19.2 ft ADCIRC Max = 17.3 ft
Difference = -1.9 ft
Katrina Hindcast - Scenario A1: HWM comparison of model to data
Figure 19f
Case 1:05-cv-01119-SGB Document 241-5 Filed 11/12/13 Page 9 of 91

= Location of Plaintiff Property
Measured HWM = 17.7 ft ADCIRC Max = 17.3 ft
Difference = -0.4 ft
Katrina Hindcast - Scenario A1: HWM comparison of model to data
Figure 19g
Case 1:05-cv-01119-SGB Document 241-5 Filed 11/12/13 Page 10 of 91
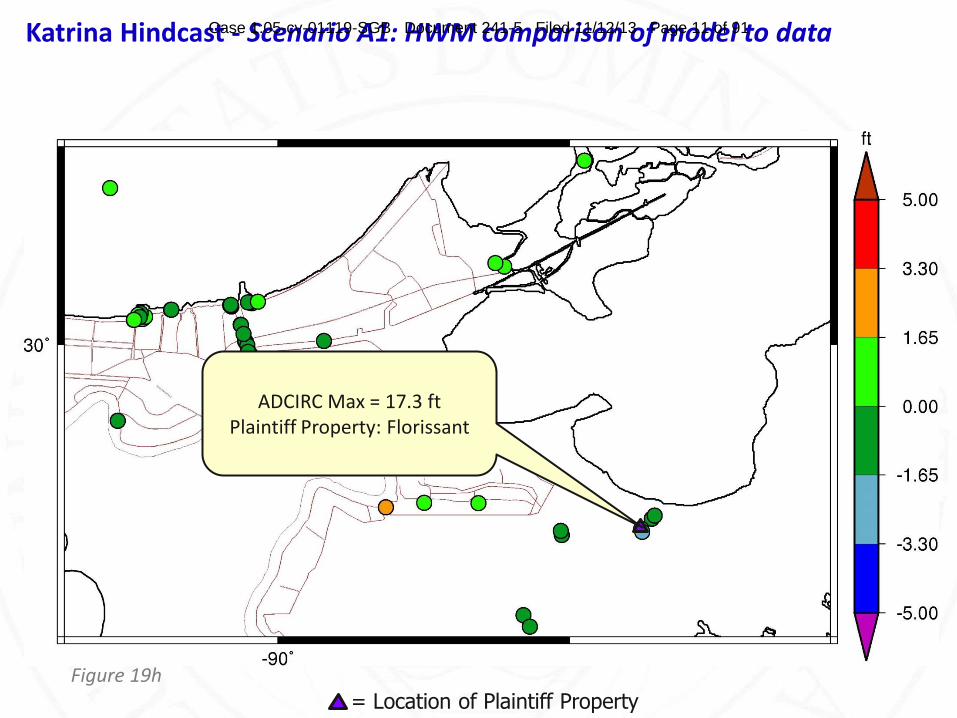
= Location of Plaintiff Property
ADCIRC Max = 17.3 ft Plaintiff Property: Florissant
Katrina Hindcast - Scenario A1: HWM comparison of model to data
Figure 19h
Case 1:05-cv-01119-SGB Document 241-5 Filed 11/12/13 Page 11 of 91

= Location of Plaintiff Property
Measured HWM = 18.1 ft
ADCIRC Max = 17.2 ft
Difference = -0.9 ft
Katrina Hindcast - Scenario A1: HWM comparison of model to data
Figure 19i
Case 1:05-cv-01119-SGB Document 241-5 Filed 11/12/13 Page 12 of 91

= Location of Plaintiff Property
Measured HWM = 18.7 ft
ADCIRC Max = 17.1 ft
Difference = -1.6 ft
Katrina Hindcast - Scenario A1: HWM comparison of model to data
Figure 19j
Case 1:05-cv-01119-SGB Document 241-5 Filed 11/12/13 Page 13 of 91

= Location of Plaintiff Property
Measured HWM = 11.0 ft
ADCIRC Max = 13.3 ft
Difference = 2.3 ft
Katrina Hindcast - Scenario A1: HWM comparison of model to data
Figure 19k
Case 1:05-cv-01119-SGB Document 241-5 Filed 11/12/13 Page 14 of 91
= Location of Plaintiff Property
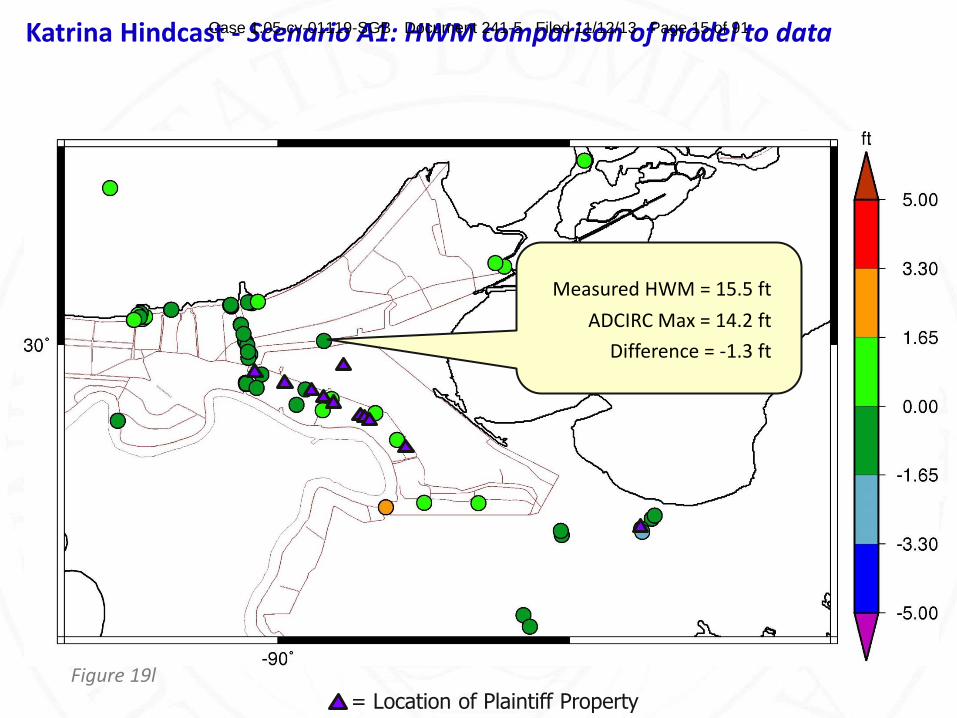
Katrina Hindcast - Scenario A1: HWM comparison of model to data
Measured HWM = 15.5 ft
ADCIRC Max = 14.2 ft
Difference = -1.3 ft
Figure 19l
Case 1:05-cv-01119-SGB Document 241-5 Filed 11/12/13 Page 15 of 91

= Location of Plaintiff Property
Measured HWM = 15.8 ft
ADCIRC Max = 16.1 ft
Difference = 0.3 ft
Katrina Hindcast - Scenario A1: HWM comparison of model to data
Figure 19m
Case 1:05-cv-01119-SGB Document 241-5 Filed 11/12/13 Page 16 of 91

= Location of Plaintiff Property
Measured HWM = 15.7 ft
ADCIRC Max = 16.3 ft
Difference = 0.6 ft
Katrina Hindcast - Scenario A1: HWM comparison of model to data
Figure 19n
Case 1:05-cv-01119-SGB Document 241-5 Filed 11/12/13 Page 17 of 91

= Location of Plaintiff Property
Measured HWM = 16.8 ft
ADCIRC Max = 17.3 ft
Difference = 0.5 ft
Katrina Hindcast - Scenario A1: HWM comparison of model to data
Figure 19o
Case 1:05-cv-01119-SGB Document 241-5 Filed 11/12/13 Page 18 of 91

= Location of Plaintiff Property
Measured HWM = 6.8 ft
ADCIRC Max = 8.2 ft
Difference = 1.4 ft
Katrina Hindcast - Scenario A1: HWM comparison of model to data
Figure 19p
Case 1:05-cv-01119-SGB Document 241-5 Filed 11/12/13 Page 19 of 91

= Location of Plaintiff Property
Measured HWM = 10.8 ft
ADCIRC Max = 11.3 ft
Difference = 0.5 ft
Katrina Hindcast - Scenario A1: HWM comparison of model to data
Figure 19q
Case 1:05-cv-01119-SGB Document 241-5 Filed 11/12/13 Page 20 of 91

= Location of Plaintiff Property
Measured HWM = 10.9 ft
ADCIRC Max = 11.3 ft
Difference = 0.4 ft
Katrina Hindcast - Scenario A1: HWM comparison of model to data
Figure 19r
Case 1:05-cv-01119-SGB Document 241-5 Filed 11/12/13 Page 21 of 91

= Location of Plaintiff Property
Measured HWM = 11.0 ft
ADCIRC Max = 11.3 ft
Difference = 0.3 ft
Katrina Hindcast - Scenario A1: HWM comparison of model to data
Figure 19s
Case 1:05-cv-01119-SGB Document 241-5 Filed 11/12/13 Page 22 of 91

= Location of Plaintiff Property
Measured HWM = 10.2 ft
ADCIRC Max = 11.3 ft
Difference = 1.1 ft
Katrina Hindcast - Scenario A1: HWM comparison of model to data
Figure 19t
Case 1:05-cv-01119-SGB Document 241-5 Filed 11/12/13 Page 23 of 91

= Location of Plaintiff Property
Measured HWM = 10.8 ft
ADCIRC Max = 11.3 ft
Difference = 0.5 ft
Katrina Hindcast - Scenario A1: HWM comparison of model to data
Figure 19u
Case 1:05-cv-01119-SGB Document 241-5 Filed 11/12/13 Page 24 of 91

= Location of Plaintiff Property
Measured HWM = 11.2 ft
ADCIRC Max = 11.2 ft
Difference = 0.0 ft
Katrina Hindcast - Scenario A1: HWM comparison of model to data
Figure 19v
Case 1:05-cv-01119-SGB Document 241-5 Filed 11/12/13 Page 25 of 91

= Location of Plaintiff Property
Measured HWM = 11.8 ft
ADCIRC Max = 11.2 ft
Difference = -0.6 ft
Katrina Hindcast - Scenario A1: HWM comparison of model to data
Figure 19w
Case 1:05-cv-01119-SGB Document 241-5 Filed 11/12/13 Page 26 of 91

= Location of Plaintiff Property
Measured HWM = 11.0 ft
ADCIRC Max = 11.1 ft
Difference = 0.1 ft
Katrina Hindcast - Scenario A1: HWM comparison of model to data
Figure 19x
Case 1:05-cv-01119-SGB Document 241-5 Filed 11/12/13 Page 27 of 91

= Location of Plaintiff Property
Measured HWM = 11.4 ft
ADCIRC Max = 11.0 ft
Difference = -0.4 ft
Katrina Hindcast - Scenario A1: HWM comparison of model to data
Figure 19y
Case 1:05-cv-01119-SGB Document 241-5 Filed 11/12/13 Page 28 of 91

= Location of Plaintiff Property
Measured HWM = 11.8 ft
ADCIRC Max = 10.9 ft
Difference = -0.9 ft
Katrina Hindcast - Scenario A1: HWM comparison of model to data
Figure 19z
Case 1:05-cv-01119-SGB Document 241-5 Filed 11/12/13 Page 29 of 91

= Location of Plaintiff Property
Measured HWM = 11.8 ft
ADCIRC Max = 10.9 ft
Difference = -0.9 ft
Katrina Hindcast - Scenario A1: HWM comparison of model to data
Figure 19za
Case 1:05-cv-01119-SGB Document 241-5 Filed 11/12/13 Page 30 of 91

= Location of Plaintiff Property
Measured HWM = 11.8 ft
ADCIRC Max = 11.2 ft
Difference = -0.6 ft
Katrina Hindcast - Scenario A1: HWM comparison of model to data
Figure 19zb
Case 1:05-cv-01119-SGB Document 241-5 Filed 11/12/13 Page 31 of 91

= Location of Plaintiff Property
Measured HWM = 11.4 ft
ADCIRC Max = 11.3 ft
Difference = -0.1 ft
Katrina Hindcast - Scenario A1: HWM comparison of model to data
Figure 19zc
Case 1:05-cv-01119-SGB Document 241-5 Filed 11/12/13 Page 32 of 91

= Location of Plaintiff Property
Measured HWM = 11.4 ft
ADCIRC Max = 11.8 ft
Difference = 0.4 ft
Katrina Hindcast - Scenario A1: HWM comparison of model to data
Figure 19zd
Case 1:05-cv-01119-SGB Document 241-5 Filed 11/12/13 Page 33 of 91

= Location of Plaintiff Property
Measured HWM = 11.7 ft
ADCIRC Max = 11.8 ft
Difference = 0.1 ft
Katrina Hindcast - Scenario A1: HWM comparison of model to data
Figure 19ze
Case 1:05-cv-01119-SGB Document 241-5 Filed 11/12/13 Page 34 of 91

= Location of Plaintiff Property
Measured HWM = 12.1 ft
ADCIRC Max = 11.7 ft
Difference = -0.4 ft
Katrina Hindcast - Scenario A1: HWM comparison of model to data
Figure 19zf
Case 1:05-cv-01119-SGB Document 241-5 Filed 11/12/13 Page 35 of 91

= Location of Plaintiff Property
Measured HWM = 11.8 ft
ADCIRC Max = 11.7 ft
Difference = -0.1 ft
Katrina Hindcast - Scenario A1: HWM comparison of model to data
Figure 19zg
Case 1:05-cv-01119-SGB Document 241-5 Filed 11/12/13 Page 36 of 91

= Location of Plaintiff Property
Measured HWM = 12.6 ft
ADCIRC Max = 12.3 ft
Difference = -0.3 ft
Katrina Hindcast - Scenario A1: HWM comparison of model to data
Figure 19zh
Case 1:05-cv-01119-SGB Document 241-5 Filed 11/12/13 Page 37 of 91
= Location of Plaintiff Property
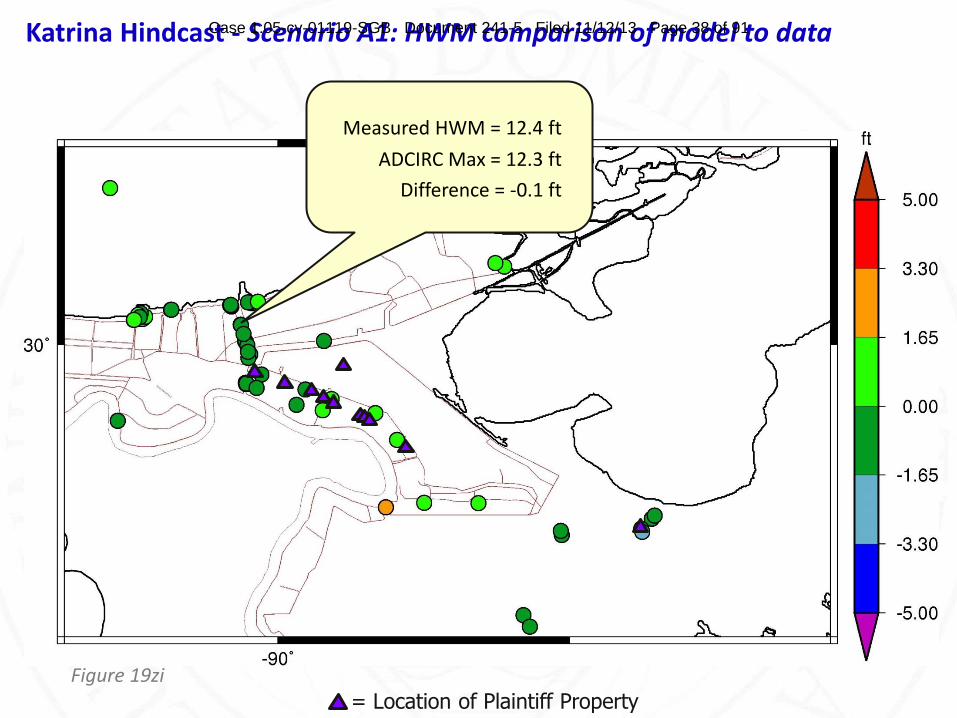
Measured HWM = 12.4 ft
ADCIRC Max = 12.3 ft
Difference = -0.1 ft
Katrina Hindcast - Scenario A1: HWM comparison of model to data
Figure 19zi
Case 1:05-cv-01119-SGB Document 241-5 Filed 11/12/13 Page 38 of 91

= Location of Plaintiff Property
Measured HWM = 12.8 ft
ADCIRC Max = 12.6 ft
Difference = -0.2 ft
Katrina Hindcast - Scenario A1: HWM comparison of model to data
Figure 19zj
Case 1:05-cv-01119-SGB Document 241-5 Filed 11/12/13 Page 39 of 91

= Location of Plaintiff Property
Measured HWM = 14.2 ft
ADCIRC Max = 13.0 ft
Difference = -1.2 ft
Katrina Hindcast - Scenario A1: HWM comparison of model to data
Figure 19zk
Case 1:05-cv-01119-SGB Document 241-5 Filed 11/12/13 Page 40 of 91

= Location of Plaintiff Property
Measured HWM = 14.1 ft
ADCIRC Max = 13.4 ft
Difference = -0.7 ft
Katrina Hindcast - Scenario A1: HWM comparison of model to data
Figure 19zl
Case 1:05-cv-01119-SGB Document 241-5 Filed 11/12/13 Page 41 of 91

= Location of Plaintiff Property
Measured HWM = 14.3 ft
ADCIRC Max = 13.5 ft
Difference = -0.8 ft
Katrina Hindcast - Scenario A1: HWM comparison of model to data
Figure 19zm
Case 1:05-cv-01119-SGB Document 241-5 Filed 11/12/13 Page 42 of 91

= Location of Plaintiff Property
Measured HWM = 14.0 ft
ADCIRC Max = 13.6 ft
Difference = -0.4 ft
Katrina Hindcast - Scenario A1: HWM comparison of model to data
Figure 19zn
Case 1:05-cv-01119-SGB Document 241-5 Filed 11/12/13 Page 43 of 91

= Location of Plaintiff Property
Measured HWM = 13.7 ft
ADCIRC Max = 13.5 ft
Difference = -0.2 ft
Katrina Hindcast - Scenario A1: HWM comparison of model to data
Figure 19zo
Case 1:05-cv-01119-SGB Document 241-5 Filed 11/12/13 Page 44 of 91

= Location of Plaintiff Property
Measured HWM = 13.7 ft
ADCIRC Max = 13.5 ft
Difference = -0.2 ft
Katrina Hindcast - Scenario A1: HWM comparison of model to data
Figure 19zp
Case 1:05-cv-01119-SGB Document 241-5 Filed 11/12/13 Page 45 of 91

= Location of Plaintiff Property
Measured HWM = 13.8 ft
ADCIRC Max = 13.5 ft
Difference = -0.3 ft
Katrina Hindcast - Scenario A1: HWM comparison of model to data
Figure 19zq
Case 1:05-cv-01119-SGB Document 241-5 Filed 11/12/13 Page 46 of 91

= Location of Plaintiff Property
Adams
ADCIRC Max = 10.5 ft
Katrina Hindcast - Scenario A1: HWM comparison of model to data
Figure 19zr
Case 1:05-cv-01119-SGB Document 241-5 Filed 11/12/13 Page 47 of 91

= Location of Plaintiff Property
Measured HWM = 11.0 ft
ADCIRC Max = 10.6 ft
Difference = -0.4 ft
Katrina Hindcast - Scenario A1: HWM comparison of model to data
Figure 19zs
Case 1:05-cv-01119-SGB Document 241-5 Filed 11/12/13 Page 48 of 91

= Location of Plaintiff Property
Measured HWM = 11.0 ft
ADCIRC Max = 10.6 ft
Difference = -0.4 ft
Katrina Hindcast - Scenario A1: HWM comparison of model to data
Figure 19zt
Case 1:05-cv-01119-SGB Document 241-5 Filed 11/12/13 Page 49 of 91

= Location of Plaintiff Property
StBP #1
ADCIRC Max = 10.7 ft
Katrina Hindcast - Scenario A1: HWM comparison of model to data
Figure 19zu
Case 1:05-cv-01119-SGB Document 241-5 Filed 11/12/13 Page 50 of 91

= Location of Plaintiff Property
Measured HWM = 12.3 ft
ADCIRC Max = 10.8 ft
Difference = -1.5 ft
Katrina Hindcast - Scenario A1: HWM comparison of model to data
Figure 19zv
Case 1:05-cv-01119-SGB Document 241-5 Filed 11/12/13 Page 51 of 91

= Location of Plaintiff Property
StBP#2
ADCIRC Max = 10.8 ft
Katrina Hindcast - Scenario A1: HWM comparison of model to data
Figure 19zw
Case 1:05-cv-01119-SGB Document 241-5 Filed 11/12/13 Page 52 of 91

= Location of Plaintiff Property
Measured HWM = 11.9 ft
ADCIRC Max = 10.8 ft
Difference = -1.1 ft
Katrina Hindcast - Scenario A1: HWM comparison of model to data
Figure 19zx
Case 1:05-cv-01119-SGB Document 241-5 Filed 11/12/13 Page 53 of 91

= Location of Plaintiff Property
Tommaseo
ADCIRC Max = 11.0 ft
Katrina Hindcast - Scenario A1: HWM comparison of model to data
Figure 19zy
Case 1:05-cv-01119-SGB Document 241-5 Filed 11/12/13 Page 54 of 91

= Location of Plaintiff Property
PSSI
ADCIRC Max = 11.7 ft
Katrina Hindcast - Scenario A1: HWM comparison of model to data
Figure 19zz
Case 1:05-cv-01119-SGB Document 241-5 Filed 11/12/13 Page 55 of 91

= Location of Plaintiff Property
Measured HWM = 11.0 ft
ADCIRC Max = 11.4 ft
Difference = 0.4 ft
Katrina Hindcast - Scenario A1: HWM comparison of model to data
Figure 19zza
Case 1:05-cv-01119-SGB Document 241-5 Filed 11/12/13 Page 56 of 91

= Location of Plaintiff Property
StBP#3
ADCIRC Max = 11.3 ft
Katrina Hindcast - Scenario A1: HWM comparison of model to data
Figure 19zzb
Case 1:05-cv-01119-SGB Document 241-5 Filed 11/12/13 Page 57 of 91

= Location of Plaintiff Property
Measured HWM = 11.0 ft
ADCIRC Max = 11.2 ft
Difference = 0.2 ft
Katrina Hindcast - Scenario A1: HWM comparison of model to data
Figure 19zzc
Case 1:05-cv-01119-SGB Document 241-5 Filed 11/12/13 Page 58 of 91

= Location of Plaintiff Property
Measured HWM = 11.5 ft
ADCIRC Max = 11.6 ft
Difference = 0.1 ft
Katrina Hindcast - Scenario A1: HWM comparison of model to data
Figure 19zzd
Case 1:05-cv-01119-SGB Document 241-5 Filed 11/12/13 Page 59 of 91

= Location of Plaintiff Property
StBP#4
ADCIRC Max = 11.5 ft
Katrina Hindcast - Scenario A1: HWM comparison of model to data
Figure 19zze
Case 1:05-cv-01119-SGB Document 241-5 Filed 11/12/13 Page 60 of 91
= Location of Plaintiff Property
Steve’s RV
ADCIRC Max = 11.5 ft
Katrina Hindcast - Scenario A1: HWM comparison of model to data
Figure 19zzf
Case 1:05-cv-01119-SGB Document 241-5 Filed 11/12/13 Page 61 of 91

= Location of Plaintiff Property
StBP#5
ADCIRC Max = 11.5 ft
Katrina Hindcast - Scenario A1: HWM comparison of model to data
Figure 19zzg
Case 1:05-cv-01119-SGB Document 241-5 Filed 11/12/13 Page 62 of 91

= Location of Plaintiff Property
Measured HWM = 11.5 ft
ADCIRC Max = 11.6 ft
Difference = 0.1 ft
Katrina Hindcast - Scenario A1: HWM comparison of model to data
Figure 19zzh
Case 1:05-cv-01119-SGB Document 241-5 Filed 11/12/13 Page 63 of 91

= Location of Plaintiff Property
Bordelon
ADCIRC Max = 11.6 ft
Katrina Hindcast - Scenario A1: HWM comparison of model to data
Figure 19zzi
Case 1:05-cv-01119-SGB Document 241-5 Filed 11/12/13 Page 64 of 91

= Location of Plaintiff Property
Measured HWM = 10.8 ft
ADCIRC Max = 11.0 ft
Difference = 0.2 ft
Katrina Hindcast - Scenario A1: HWM comparison of model to data
Figure 19zzj
Case 1:05-cv-01119-SGB Document 241-5 Filed 11/12/13 Page 65 of 91

= Location of Plaintiff Property
Measured HWM = 10.8 ft
ADCIRC Max = 11.3 ft
Difference = 0.5 ft
Katrina Hindcast - Scenario A1: HWM comparison of model to data
Figure 19zzk
Case 1:05-cv-01119-SGB Document 241-5 Filed 11/12/13 Page 66 of 91

• The A1 Scenario results also closely match water surface elevation time history data collected at exterior locations surrounding St. Bernard Polder.
• The time series hydrographs shown in the next series of slides (Figures 20, 21a-d) show the A1 Scenario ADCIRC results plotted against tidal gauges at four exterior locations: Little Irish Bayou, Lake Pontchartrain Midlake Causeway, the 17th Street Canal, and the IHNC Lock.
• In each instance, the ADCIRC model results closely match the shapes of the hydrographs depicting the exterior gauge data, matching both the rise and fall of Hurricane Katrina’s storm surge as it was recorded in real time.
Katrina Hindcast - Scenario A1: Water surface elevation time history data Case 1:05-cv-01119-SGB Document 241-5 Filed 11/12/13 Page 67 of 91

Pontchartrain Causeway
17th Street Canal
Irish Bayou
IHNC Lock
Katrina Hindcast - Scenario A1: Water surface elevation time history data
• Location Map of Available time series data near St. Bernard Parish
= Gauge Location
= St. Bernard HWM & Stop-Clock Locations
= Plaintiff Property
Figure 20
Case 1:05-cv-01119-SGB Document 241-5 Filed 11/12/13 Page 68 of 91

Time-Series Data from Gauge @ I-10 Drainage at Irish Bayou (USGS)
Katrina Hindcast - Scenario A1: Water surface elevation time history data
Figure 21a
Case 1:05-cv-01119-SGB Document 241-5 Filed 11/12/13 Page 69 of 91

Time-Series Data from Gauge @ Lake Pontchartrain Causeway (NOAA)
Katrina Hindcast - Scenario A1: Water surface elevation time history data
Figure 21b
Case 1:05-cv-01119-SGB Document 241-5 Filed 11/12/13 Page 70 of 91

Time-Series Data from Gauge @ the 17th Street Canal
Katrina Hindcast - Scenario A1: Water surface elevation time history data
Figure 21c
Case 1:05-cv-01119-SGB Document 241-5 Filed 11/12/13 Page 71 of 91

Time-Series Data from Gauge @ the IHNC Lock
Katrina Hindcast - Scenario A1: Interior flooding and Trial Property results
Figure 21d
Case 1:05-cv-01119-SGB Document 241-5 Filed 11/12/13 Page 72 of 91

• The next series of slides (Figures 22a-q) features hydrographs that show the flooding and timing of the flooding interior to St. Bernard Polder and on each Trial Property.
• Specifically, I have plotted hydrographs for the Scenario A1 modeling results at several additional non-Plaintiff Properties located in close proximity to the Plaintiff Properties.
– The non-Plaintiff interior hydrographs are plotted against historic high water level data or stopped-clock data collected at each of these locations.
– The Scenario A1 ADCIRC modeling accurately depicts flooding at each of these locations, closely matching both the elevations and timing of the high water data recorded during Hurricane Katrina.
– These results further validate the ADCIRC modeling inside St. Bernard Polder, and confirm the accuracy of the results reached at each of the Plaintiff Properties.
Katrina Hindcast - Scenario A1: Interior flooding and Trial Property results Case 1:05-cv-01119-SGB Document 241-5 Filed 11/12/13 Page 73 of 91
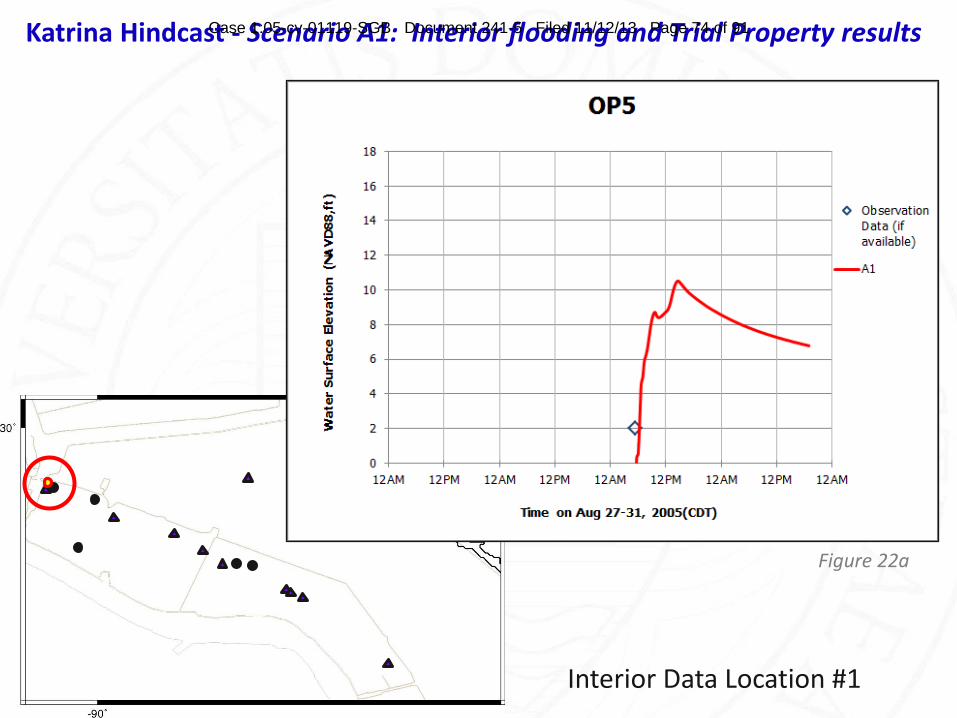
Interior Data Location #1
Katrina Hindcast - Scenario A1: Interior flooding and Trial Property results
Figure 22a
Case 1:05-cv-01119-SGB Document 241-5 Filed 11/12/13 Page 74 of 91

Plaintiff Property “Adams”
Katrina Hindcast - Scenario A1: Interior flooding and Trial Property results
Figure 22b
Case 1:05-cv-01119-SGB Document 241-5 Filed 11/12/13 Page 75 of 91

Interior Data Location #2
Katrina Hindcast - Scenario A1: Interior flooding and Trial Property results
Figure 22c
Case 1:05-cv-01119-SGB Document 241-5 Filed 11/12/13 Page 76 of 91

Interior Data Location #3
Katrina Hindcast - Scenario A1: Interior flooding and Trial Property results
Figure 22d
Case 1:05-cv-01119-SGB Document 241-5 Filed 11/12/13 Page 77 of 91

Interior Data Location #4
Katrina Hindcast - Scenario A1: Interior flooding and Trial Property results
Figure 22e
Case 1:05-cv-01119-SGB Document 241-5 Filed 11/12/13 Page 78 of 91

Plaintiff Location “StBP#1”
Katrina Hindcast - Scenario A1: Interior flooding and Trial Property results
Figure 22f
Case 1:05-cv-01119-SGB Document 241-5 Filed 11/12/13 Page 79 of 91

Plaintiff Location “StBP#2”
Katrina Hindcast - Scenario A1: Interior flooding and Trial Property results
Figure 22g
Case 1:05-cv-01119-SGB Document 241-5 Filed 11/12/13 Page 80 of 91

Plaintiff Location “Tommaseo”
Katrina Hindcast - Scenario A1: Interior flooding and Trial Property results
Figure 22h
Case 1:05-cv-01119-SGB Document 241-5 Filed 11/12/13 Page 81 of 91

Plaintiff Location “StBP#3”
Katrina Hindcast - Scenario A1: Interior flooding and Trial Property results
Figure 22i
Case 1:05-cv-01119-SGB Document 241-5 Filed 11/12/13 Page 82 of 91

Interior Data Location #5
Katrina Hindcast - Scenario A1: Interior flooding and Trial Property results
Figure 22j
Case 1:05-cv-01119-SGB Document 241-5 Filed 11/12/13 Page 83 of 91

Interior Data Location #6
Katrina Hindcast - Scenario A1: Interior flooding and Trial Property results
Figure 22k
Case 1:05-cv-01119-SGB Document 241-5 Filed 11/12/13 Page 84 of 91

Plaintiff Location “StBP#4”
Katrina Hindcast - Scenario A1: Interior flooding and Trial Property results
Figure 22l
Case 1:05-cv-01119-SGB Document 241-5 Filed 11/12/13 Page 85 of 91

Plaintiff Location “Steve’s RV”
Katrina Hindcast - Scenario A1: Interior flooding and Trial Property results
Figure 22m
Case 1:05-cv-01119-SGB Document 241-5 Filed 11/12/13 Page 86 of 91

Plaintiff Location “StBP#5”
Katrina Hindcast - Scenario A1: Interior flooding and Trial Property results
Figure 22n
Case 1:05-cv-01119-SGB Document 241-5 Filed 11/12/13 Page 87 of 91

Plaintiff Location “Bordelon”
Katrina Hindcast - Scenario A1: Interior flooding and Trial Property results
Figure 22o
Case 1:05-cv-01119-SGB Document 241-5 Filed 11/12/13 Page 88 of 91

Plaintiff Location “PSSI”
Katrina Hindcast - Scenario A1: Interior flooding and Trial Property results
Figure 22p
Case 1:05-cv-01119-SGB Document 241-5 Filed 11/12/13 Page 89 of 91

Plaintiff Location “Florissant”
Katrina Hindcast - Scenario A1: Interior flooding and Trial Property results
Figure 22q
Case 1:05-cv-01119-SGB Document 241-5 Filed 11/12/13 Page 90 of 91

• The maximum water surface elevations (in ft) on the Plaintiff Properties during the actual Hurricane Katrina event are summarized in the table below.
Katrina Hindcast - Scenario A1: Flooding conclusions for Plaintiff Properties
Location Scenario
A1
Adams 10.5
SBP #1 10.7
SBP #2 10.8
Tommaseo 11.0
SBP #3 11.3
SBP #4 11.5
Steve’s RV 11.5
SBP #5 11.5
Bordelon 11.6
PSSI 11.7
Florissant 17.3
Table 4
Case 1:05-cv-01119-SGB Document 241-5 Filed 11/12/13 Page 91 of 91