katherine beck, program effectiveness supervisor, ela cotesol 2015 convention 11/6/15 helping...
DESCRIPTION
PURPOSE This interactive workshop illustrates how the Denver Public Schools prepares its teachers and administrators to use ACCESS Status, Trajectory, and Growth data.TRANSCRIPT

Katherine Beck, Program Effectiveness Supervisor, ELACoTESOL 2015 Convention
11/6/15
Helping teachers evaluate EL progress to English language acquisition using
WIDA ACCESS for ELLs


PURPOSE
This interactive workshop illustrates how the Denver Public Schools prepares its teachers and administrators to use ACCESS Status, Trajectory,
and Growth data.

GOAL 1
Participants understand ACCESS achievement (Status) data and ACCESS MGPs, and are introduced to the DPS ACCESS Trajectory.
GOAL 2
Participants practice interpreting that data for students with different English proficiency levels in different domains of language.

ROLES
I will facilitate our 45 minutes together.I will modify my delivery to your needs.
You will participate and practice.You will ask questions!

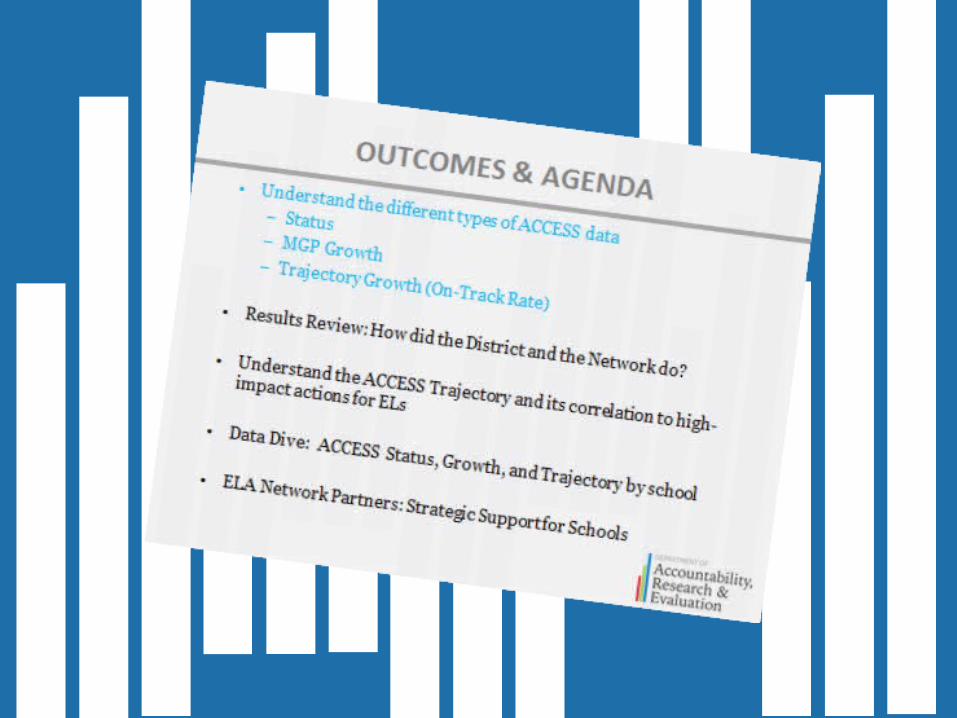
AGENDA
5 minutes – Welcome!15 minutes – Status, Growth, and Trajectory
20 minutes – Student data practice5 minutes – Wrap Up

PERSONAL OUTCOMES

INSIGHTS, IDEAS, APPLICATION

WIDA ACCESS FOR ELLS(ASSESSING COMPREHENSION AND COMMUNICATION IN ENGLISH STATE-TO-STATE FOR ENGLISH LANGUAGE
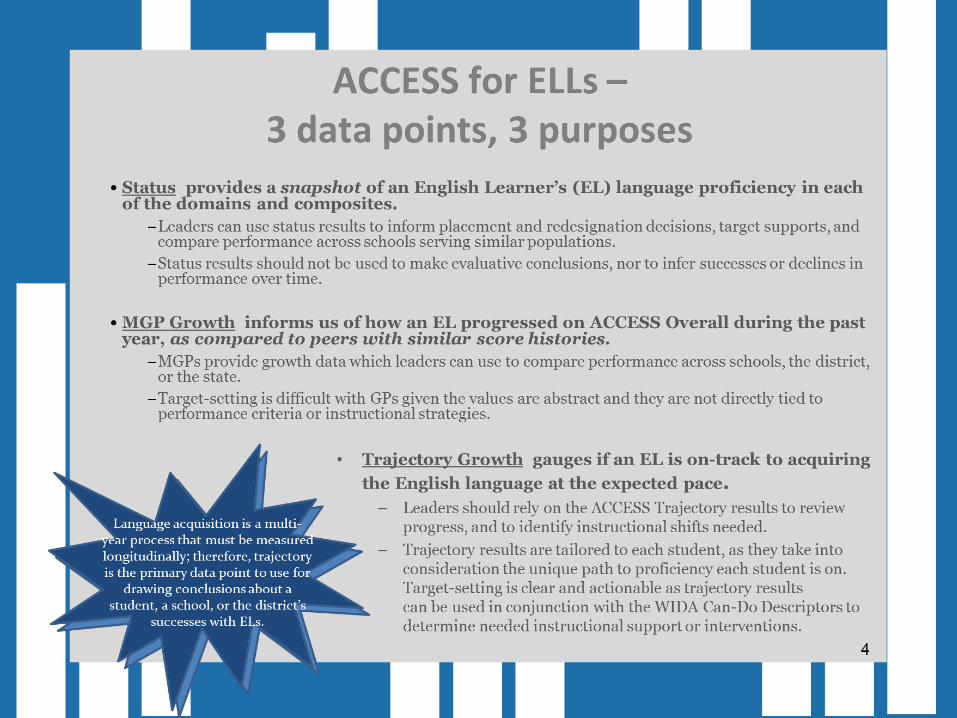
LEARNERS) • Primary source of information used for monitoring a student’s
progress in acquiring academic English.
• ACCESS data are used by teachers at DPS in three ways: – ACCESS Status, MGPs, and DPS ACCESS Trajectory
• Current year and Prior year histories
10

ACCESS TRAININGS AT DPS
• To facilitate the use of ACCESS Status, MGPs, and DPS ACCESS Trajectory, and to help schools make better decisions based on these data, the English Language Acquisition department developed guidance and an interactive training program for teachers and schools.
• To better understand their results, schools were offered:– Webinars– One-on-one data-dives– Reflection guides– Walkthrough opportunities.
11

GOAL 1
Participants understand ACCESS achievement (Status) data and ACCESS MGPs, and are introduced to the DPS ACCESS Trajectory.


DRAWING CONCLUSIONS AND NEXT STEPS FROM THE DATA
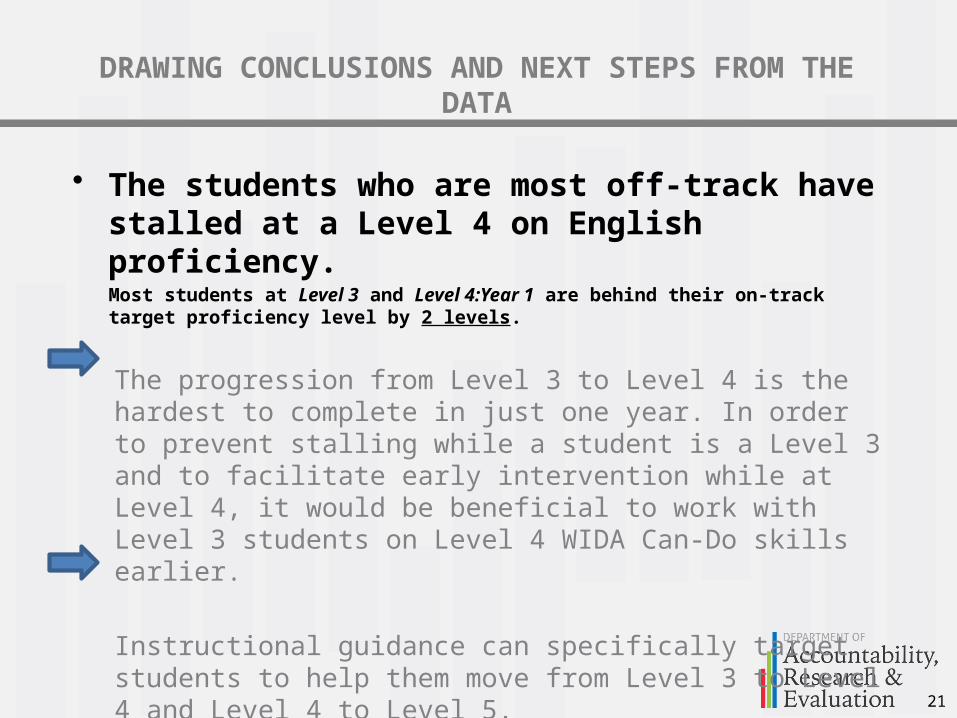
• The students who are most off-track have stalled at a Level 4 on English proficiency. Most students at Level 3 and Level 4:Year 1 are behind their on-track target proficiency level by 2 levels.
The progression from Level 3 to Level 4 is the hardest to complete in just one year. In order to prevent stalling while a student is a Level 3 and to facilitate early intervention while at Level 4, it would be beneficial to work with Level 3 students on Level 4 WIDA Can-Do skills earlier.
Instructional guidance can specifically target students to help them move from Level 3 to Level 4 and Level 4 to Level 5.
21
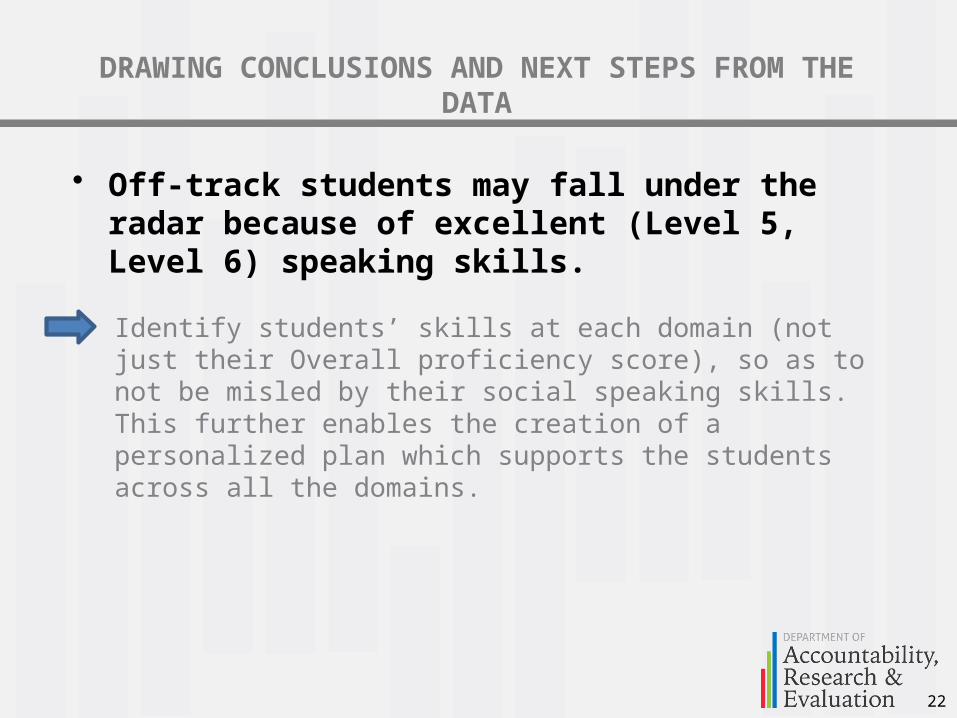
• Off-track students may fall under the radar because of excellent (Level 5, Level 6) speaking skills.
Identify students’ skills at each domain (not just their Overall proficiency score), so as to not be misled by their social speaking skills. This further enables the creation of a personalized plan which supports the students across all the domains.
22
DRAWING CONCLUSIONS AND NEXT STEPS FROM THE DATA
GOAL 2
Participants practice interpreting data for students with different English proficiency levels in different domains of language.
STUDENT AND SCHOOL DATA DIVE
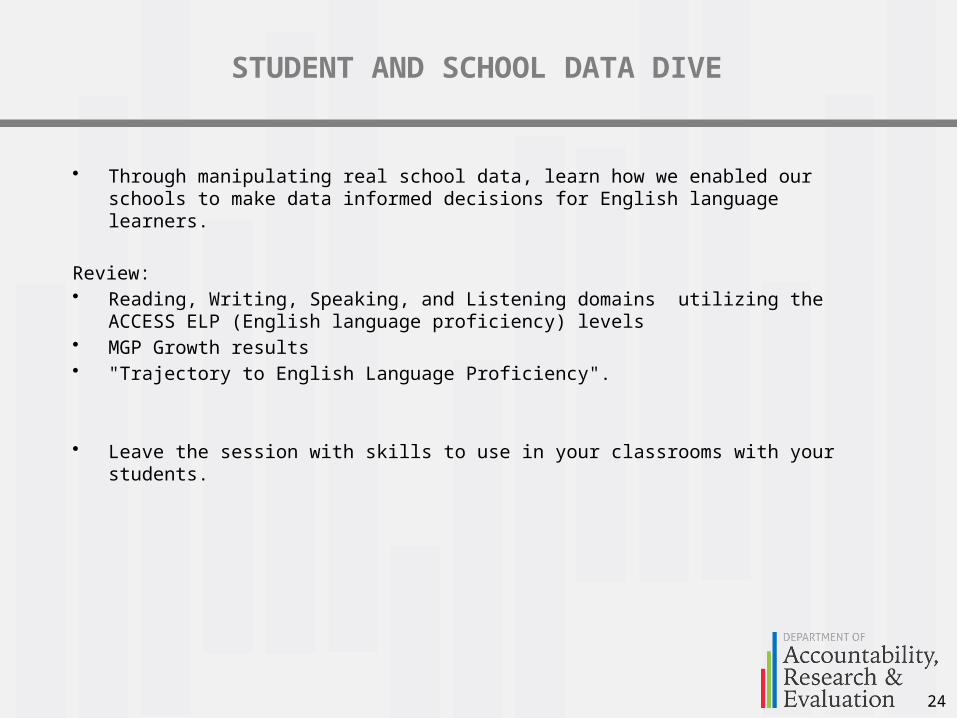
• Through manipulating real school data, learn how we enabled our schools to make data informed decisions for English language learners.
Review: • Reading, Writing, Speaking, and Listening domains utilizing the ACCESS ELP
(English language proficiency) levels• MGP Growth results• "Trajectory to English Language Proficiency".
• Leave the session with skills to use in your classrooms with your students.
24

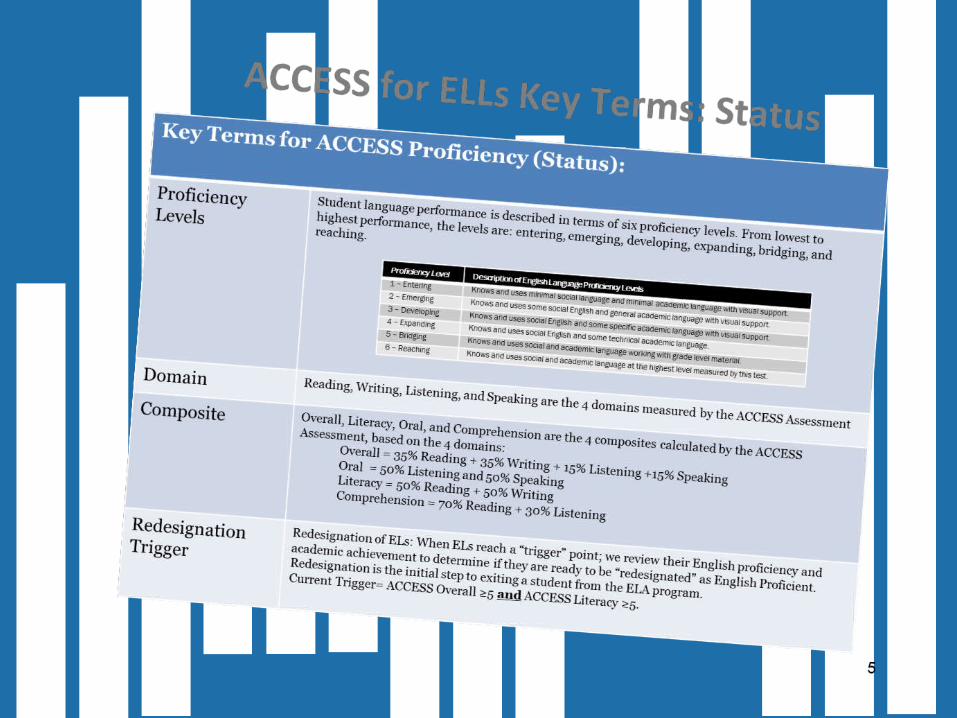
ACCESS FOR ELLS REPORT(STATUS RESULTS)
• Overall Reporting Levels:– School and District/Region
• Results by – School– Measure Codes– Grades– Subgroup
25

WHAT DO YOU SEE?
26
• Results by School
Config
ELL* FRL* SPED* Minority* Enrollment* ELA Designation N
No Score (NS)
Entering (1) Emerging (2) Developing (3) Expanding (4) Bridging (5) Reaching (6) Bridging & Reaching (5+)
High 33 % 95 % 12 % 94 % 1477 TNLI 554 6% 3% 15% 22% 19% 18% 16% 34%
Click here for Tested Student List
WHAT DO YOU SEE?
27
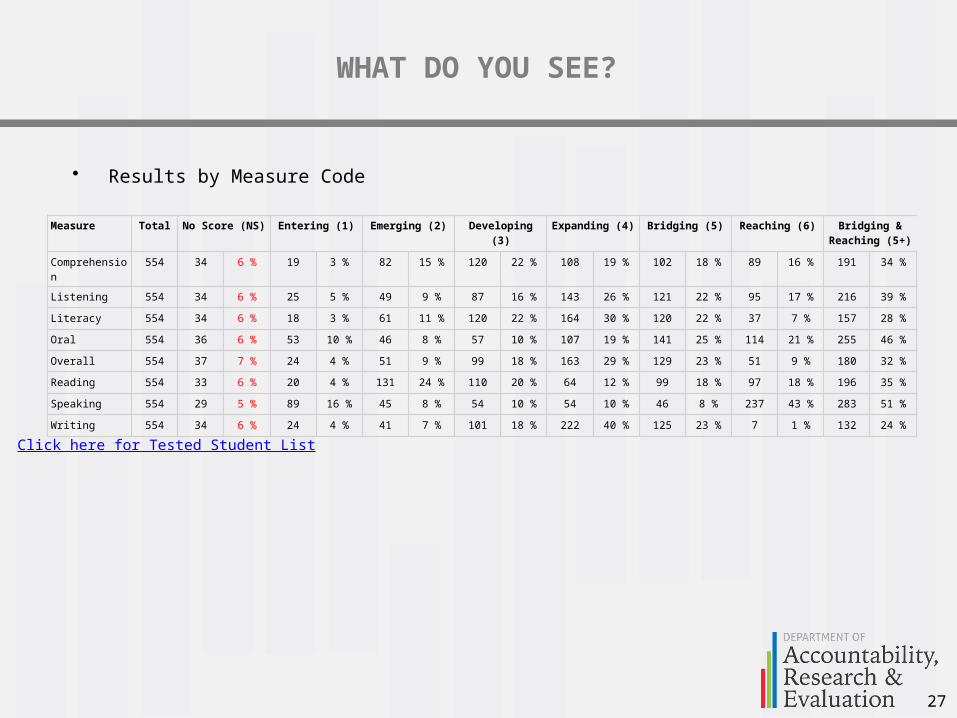
• Results by Measure Code
Measure Total No Score (NS) Entering (1) Emerging (2) Developing (3) Expanding (4) Bridging (5) Reaching (6) Bridging & Reaching (5+)
Comprehension 554 34 6 % 19 3 % 82 15 % 120 22 % 108 19 % 102 18 % 89 16 % 191 34 %
Listening 554 34 6 % 25 5 % 49 9 % 87 16 % 143 26 % 121 22 % 95 17 % 216 39 %
Literacy 554 34 6 % 18 3 % 61 11 % 120 22 % 164 30 % 120 22 % 37 7 % 157 28 %
Oral 554 36 6 % 53 10 % 46 8 % 57 10 % 107 19 % 141 25 % 114 21 % 255 46 %
Overall 554 37 7 % 24 4 % 51 9 % 99 18 % 163 29 % 129 23 % 51 9 % 180 32 %
Reading 554 33 6 % 20 4 % 131 24 % 110 20 % 64 12 % 99 18 % 97 18 % 196 35 %
Speaking 554 29 5 % 89 16 % 45 8 % 54 10 % 54 10 % 46 8 % 237 43 % 283 51 %
Writing 554 34 6 % 24 4 % 41 7 % 101 18 % 222 40 % 125 23 % 7 1 % 132 24 %
Click here for Tested Student List

WHAT DO YOU SEE?
28
• Results by Grade
Grade Total No Score (NS) Entering (1) Emerging (2) Developing (3) Expanding (4) Bridging (5) Reaching (6) Bridging & Reaching (5+)
09 227 10 4 % 7 3 % 19 8 % 27 12 % 59 26 % 72 32 % 33 15 % 105 46 %
10 131 13 10 % 8 6 % 11 8 % 19 15 % 46 35 % 26 20 % 8 6 % 34 26 %
11 106 6 6 % 6 6 % 16 15 % 23 22 % 28 26 % 20 19 % 7 7 % 27 25 %
12 90 8 9 % 3 3 % 5 6 % 30 33 % 30 33 % 11 12 % 3 3 % 14 16 %
Click here for Tested Student List

WHAT DO YOU SEE?
29
• Results by Subgroup
Gender Total No Score (NS) Entering (1) Emerging (2) Developing (3) Expanding (4) Bridging (5) Reaching (6) Bridging & Reaching (5+)
F 246 16 7% 10 4% 24 10% 52 21% 66 27% 60 24% 18 7% 78 32%
M 308 21 7% 14 5% 27 9% 47 15% 97 31% 69 22% 33 11% 102 33%
FRL
Eligible 534 34 6% 24 4% 47 9% 98 18% 157 29% 127 24% 47 9% 174 33%
Not Eligible 20 3 15% 0 0% 4 20% 1 5% 6 30% 2 10% 4 20% 6 30%
SPED
No 507 35 7% 24 5% 44 9% 84 17% 144 28% 125 25% 51 10% 176 35%
Yes 47 2 4% 0 0% 7 15% 15 32% 19 40% 4 9% 0 0% 4 9%
Spanish Lang BG
No 42 2 5% 2 5% 10 24% 8 19% 10 24% 6 14% 4 10% 10 24%
Yes 512 35 7% 22 4% 41 8% 91 18% 153 30% 123 24% 47 9% 170 33%
Click here for Tested Student List
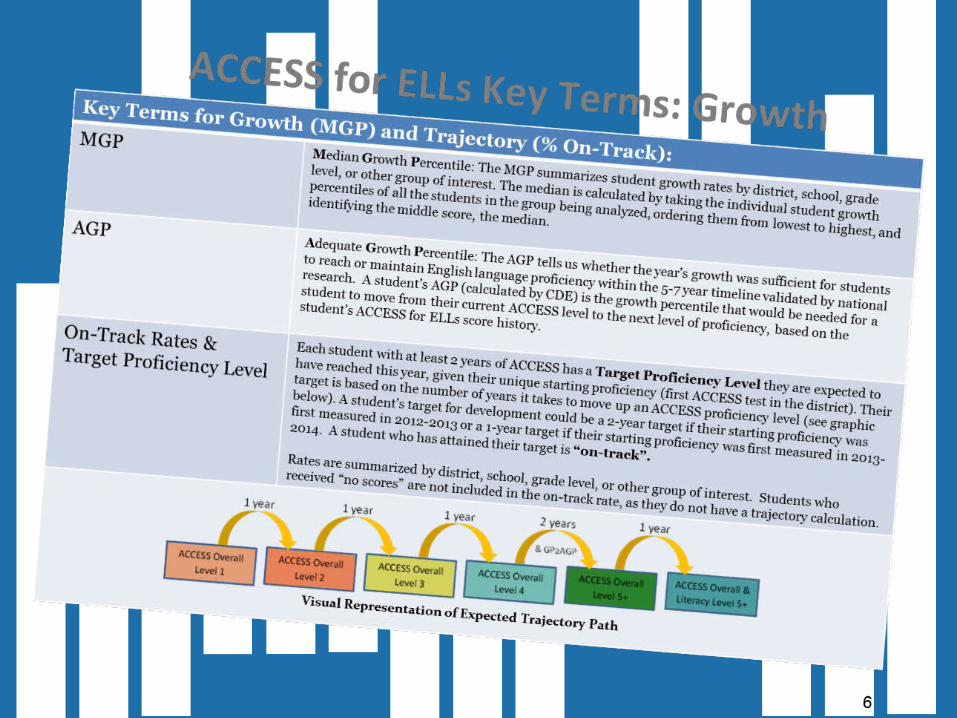
ACCESS MEDIAN GROWTH PERCENTILES REPORT(MGP GROWTH RESULTS)
• Overall Reporting Levels:– School and District/Region
• Results by – Year
30

WHAT DO YOU SEE?
31
• Results by Year x GradeSchool Overall
CELA ACCESS CELA-ACCESS ACCESS ACCESS ACCESS ACCESS
Grade 2012 2013 12-13 Change 2014 13-14 Change 2015 14-15 Change
9 58 57.5 -0.5 60 2.5 54 -610 47 67 20 63 -4 48.5 -14.511 45 61.5 16.5 51 -10.5 55 412 45 49.5 4.5 47.5 -2 52 4.5All 52 58 6 57 -1 53 -4
District Overall1 49 46 -3 55 9 60 52 54 53 -1 60 7 51 -93 51 51 0 67 16 66 -14 54 55 1 60 5 57 -35 57 56 -1 62 6 55 -76 57 54 -3 55 1 50 -57 56 53 -3 53 0 51 -28 54 51 -3 53 2 54 19 52 55.5 3.5 62 6.5 57 -5
10 47 57.5 10.5 61 3.5 51 -1011 42 58.5 16.5 57 -1.5 55 -212 41 56 15 56 0 54 -2
* Median growth percentiles based on fewer than 20 students have been suppressed due to the potential for inaccurate conclusions. Scores for individual students are available in district online applications.
ACCESS PROFICIENCY LEVEL CHANGE REPORT(STATUS RESULTS)
• Overall Reporting Levels:– School and District/Region
• Results by – Measure Code
32
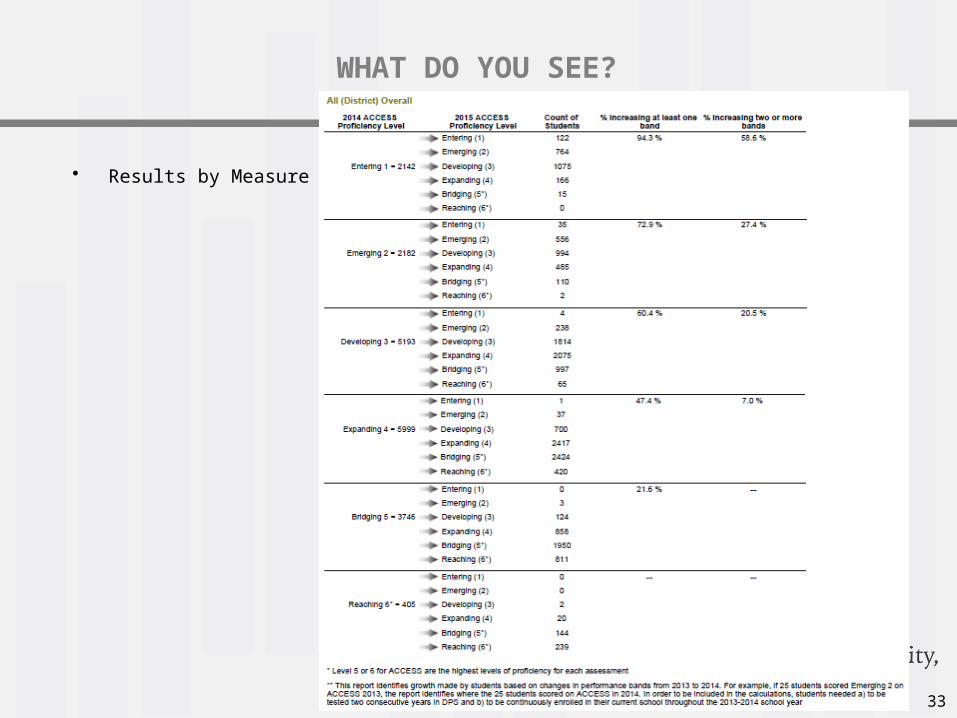
WHAT DO YOU SEE?
33
• Results by Measure Code

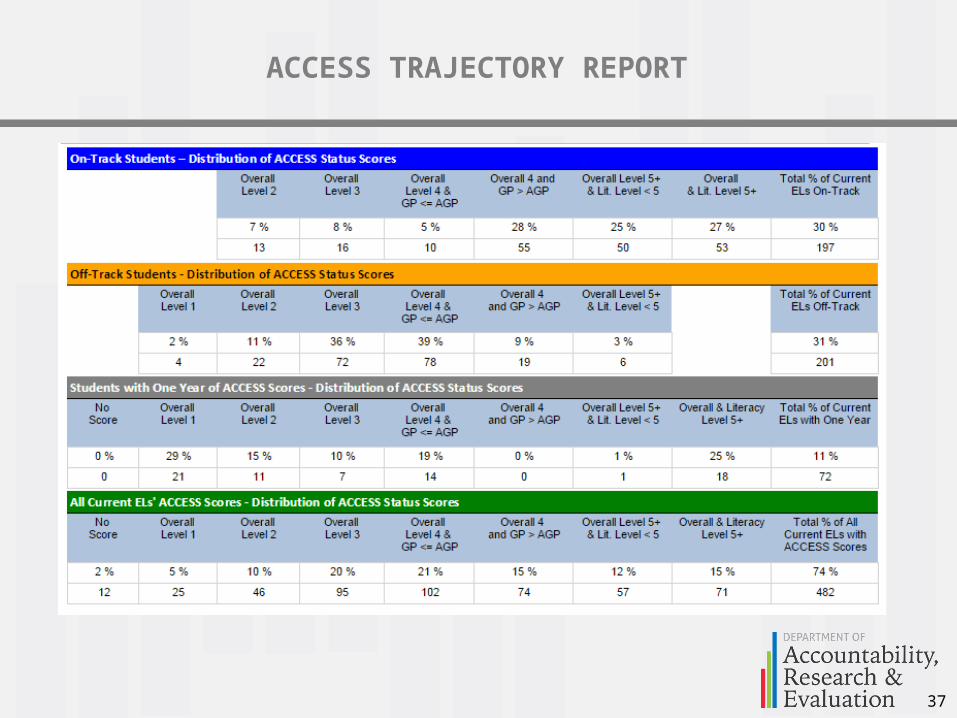
ACCESS TRAJECTORY REPORT(TRAJECTORY GROWTH RESULTS)
• Overall Reporting Levels:– District– School
34

ACCESS TRAJECTORY REPORT
36
ACCESS TRAJECTORY REPORT
37

WHAT DO YOU SEE? - GUIDE
38
Questions to help you enhance your supports for ELs:
How are your ELs doing? • What is the on-track rate at your school? • How does your school on-track rate compare to the district’s rate? • How does your school’s on-track rate compare to other schools in
my network or similar schools?

WHAT DO YOU SEE?
Data Trends:• At which proficiency bands/levels do students have higher on-track rates? • At which proficiency bands/levels do students have lower on-track rates?• What trends do you notice among your on-track students?
– Did they tend to score at specific proficiency bands/levels?– Do you notice any other trends among these students?– What factors might have influenced the performance of these students?
Consider programming and services last year, ELD enrollment, etc. – How might you build on this knowledge to further support students?
• What trends do you notice among your off-track students?– Did they tend to score at specific proficiency bands/levels?– What factors might have influenced the performance of these students?
Consider programming and services last year, ELD enrollment, etc.– How many levels away from their Trajectory Target ACCESS level do these
students tend to be? SL o Do you notice any other trends among these students?
– How might you build on this knowledge to further support students?
39
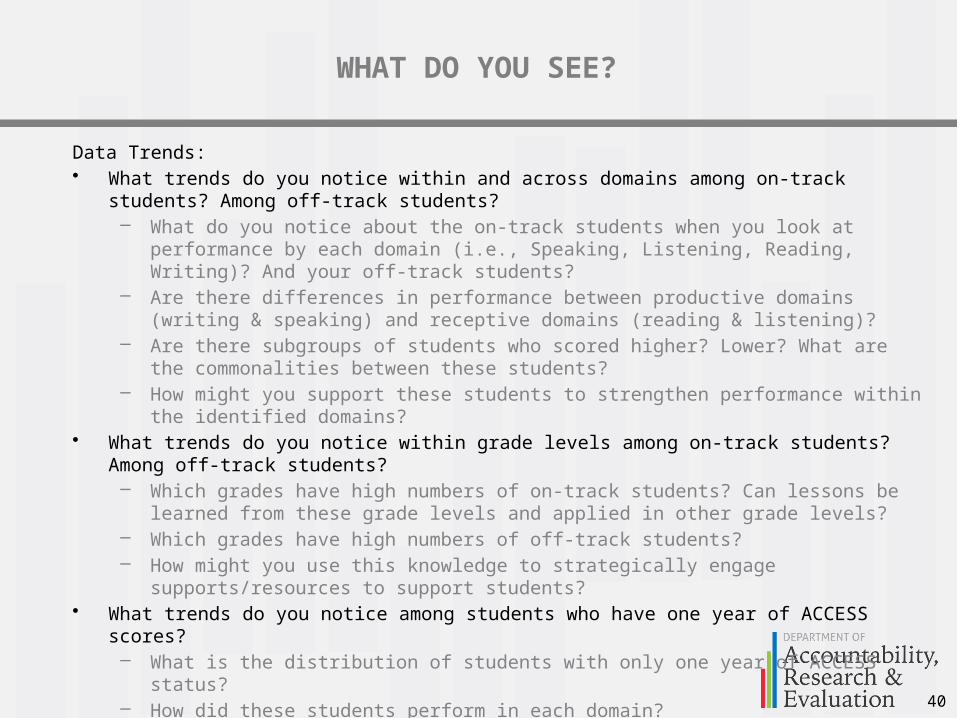
WHAT DO YOU SEE?
Data Trends:• What trends do you notice within and across domains among on-track students?
Among off-track students? – What do you notice about the on-track students when you look at performance by
each domain (i.e., Speaking, Listening, Reading, Writing)? And your off-track students?
– Are there differences in performance between productive domains (writing & speaking) and receptive domains (reading & listening)?
– Are there subgroups of students who scored higher? Lower? What are the commonalities between these students?
– How might you support these students to strengthen performance within the identified domains?
• What trends do you notice within grade levels among on-track students? Among off-track students? – Which grades have high numbers of on-track students? Can lessons be learned
from these grade levels and applied in other grade levels?– Which grades have high numbers of off-track students?– How might you use this knowledge to strategically engage supports/resources to
support students?• What trends do you notice among students who have one year of ACCESS scores?
– What is the distribution of students with only one year of ACCESS status?– How did these students perform in each domain? – Do you notice any other trends among these students?– How might you build on this knowledge to further support students?
40
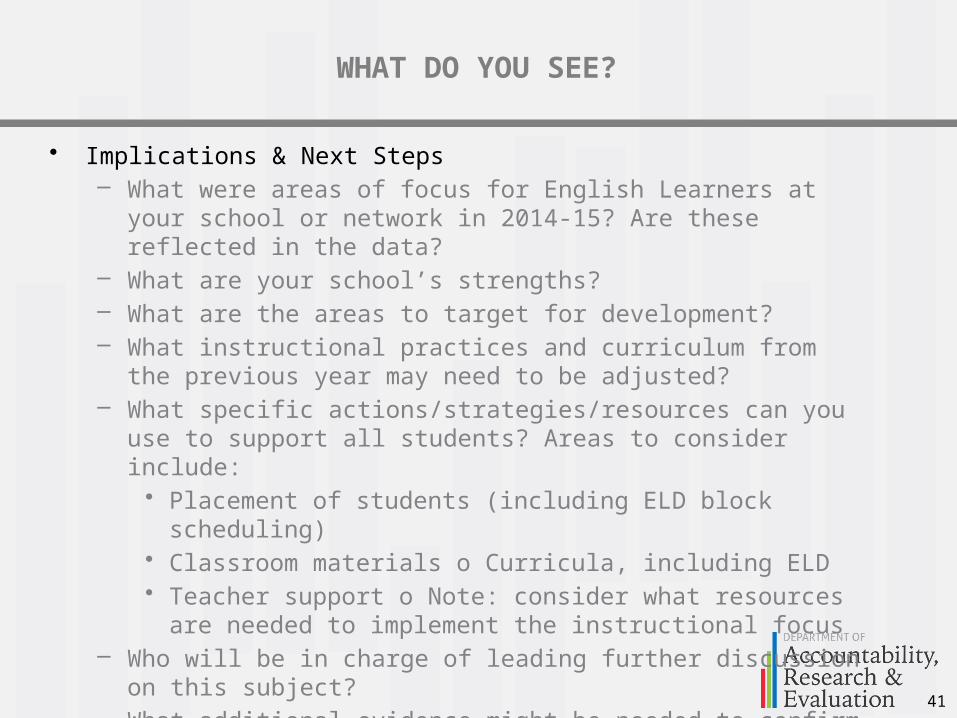
WHAT DO YOU SEE?
• Implications & Next Steps– What were areas of focus for English Learners at your school
or network in 2014-15? Are these reflected in the data?– What are your school’s strengths?– What are the areas to target for development?– What instructional practices and curriculum from the
previous year may need to be adjusted? – What specific actions/strategies/resources can you use to
support all students? Areas to consider include: • Placement of students (including ELD block scheduling)• Classroom materials o Curricula, including ELD• Teacher support o Note: consider what resources are
needed to implement the instructional focus– Who will be in charge of leading further discussion on this
subject?– What additional evidence might be needed to confirm or
support these findings?41
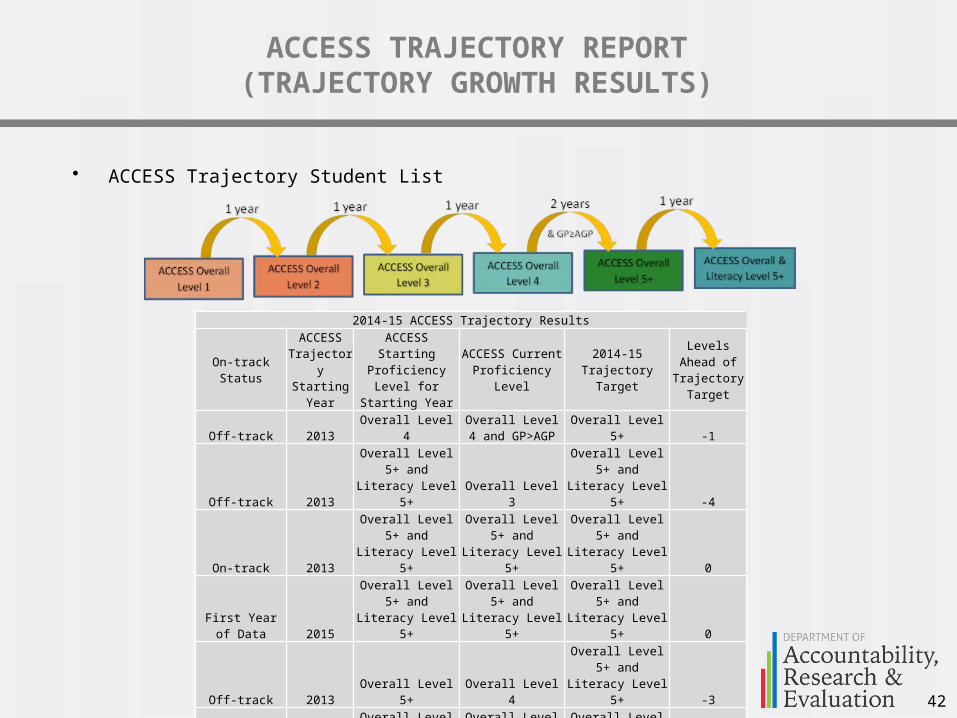
ACCESS TRAJECTORY REPORT(TRAJECTORY GROWTH RESULTS)
• ACCESS Trajectory Student List
42
2014-15 ACCESS Trajectory Results
On-track Status
ACCESS Trajectory Starting
Year
ACCESS Starting Proficiency Level for Starting Year
ACCESS Current Proficiency Level
2014-15 Trajectory Target
Levels Ahead of Trajectory
Target
Off-track 2013 Overall Level 4Overall Level 4 and GP>AGP Overall Level 5+ -1
Off-track 2013
Overall Level 5+ and Literacy
Level 5+ Overall Level 3
Overall Level 5+ and Literacy
Level 5+ -4
On-track 2013
Overall Level 5+ and Literacy
Level 5+
Overall Level 5+ and Literacy
Level 5+
Overall Level 5+ and Literacy
Level 5+ 0
First Year of Data 2015
Overall Level 5+ and Literacy
Level 5+
Overall Level 5+ and Literacy
Level 5+
Overall Level 5+ and Literacy
Level 5+ 0
Off-track 2013 Overall Level 5+ Overall Level 4
Overall Level 5+ and Literacy
Level 5+ -3
Off-track 2013 Overall Level 4Overall Level 4 and GP>AGP Overall Level 5+ -1
Off-track 2013 Overall Level 4 Overall Level 4 Overall Level 5+ -2Off-track 2013 Overall Level 4 Overall Level 4 Overall Level 5+ -2
On-track 2013 Overall Level 4
Overall Level 5+ and Literacy
Level 5+ Overall Level 5+ 1
Off-track 2013 Overall Level 4Overall Level 4 and GP>AGP Overall Level 5+ -1
On-track 2014
Overall Level 5+ and Literacy
Level 5+
Overall Level 5+ and Literacy
Level 5+
Overall Level 5+ and Literacy
Level 5+ 0

ACCESS TRAJECTORY REPORT(TRAJECTORY GROWTH RESULTS)
43
Current School NameThe school and network where the student is currently enrolled (as of the run-date for the report).Current School Number
Current School NetworkTested School Name
The school and network where the student took the 2015 ACCESS test.Tested School NumberTested School Network
Current Grade The student's current 2015-16 grade.Current EL Status Students included in the report: In-service ELs (also includes Provisional Els); Redesignated/Exited ELs; Non-ELs (this may
not have been status at time of test)
Current Program PlacementThe type of ELA services in which the student is enrolled; this is based on the teacher's designation (for Elementary) or course designation in which the student is enrolled (for Secondary). Possibilities: ELA-E, ELA-S, Dual Language, Mainstream.
Current PPF Selection Parent Permission Form: The parent preference for type of ELA services the student recieves. Possibilities: PPF1 (Spanish-instruction); PPF2 (English-instruction); PPF3 (opt-out of ELA Services); Null (no PPF on file).
Background Language This represents the student's "home" or native language, and is based on the student's Home Language Questionaire (HLQ).
Current Special Ed Status Whether or not the student recieves Special Ed services.Long-term English Learner
(LTEL) StatusWhether or not the student is a Long-term English Learner. The Research Brief on LTEL gives background info and guidance on how to support these students. Click on "2015-2016 Research Briefs" for more.
On-track StatusWhether or not the student is on-track to ACCESS proficiency. Possibilities: On-track; Off-track; First Year of Data (student needs 2 or more years of ACCESS scores in DPS to have a Trajectory calculation); Cannot determine (not enough information to calculate on-track status, due to having a No Score (NS) or not having a Growth Score).
ACCESS Trajectory Starting Year The year that the student first received an overall ACCESS score in DPS (cannot be a No Score).
ACCESS Starting Proficiency Level for
Starting YearThe overall ACCESS proficiency level for the student's Starting Year.
ACCESS Current Proficiency Level The overall ACCESS proficiency level for the student's most recent ACCESS score.
2014-15 Trajectory Target The overall ACCESS proficiency level the student needs to be at or above to be on-track. This is calculated based on the student's first ACCESS score.
Levels Ahead of Trajectory Target
The number of proficiency levels the student is currently above (or below) where they need to be to be on-track on the ACCESS Trajectory. A positive number means the student is ahead. A negative number means the student is behind. A zero means the student is exactly where they should be, as per the Trajectory.
ACCESS Domains ACCESS domain and composite scores are given for 2014-15, 2013-14, 2012-13. The values will be populated for only the years that the student received ACCESS results in DPS.
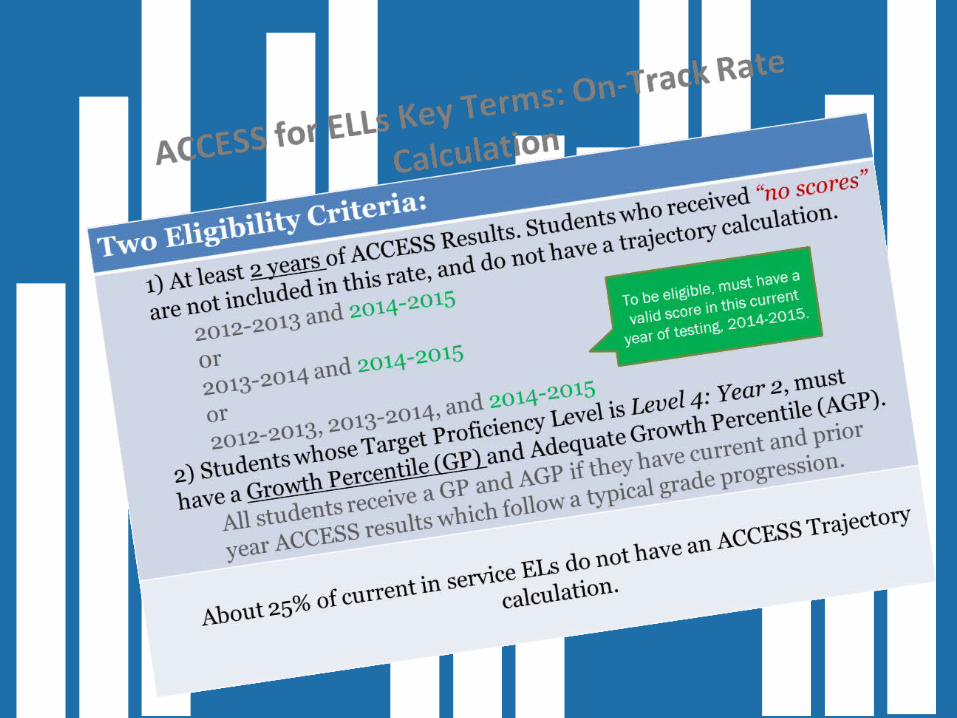
Growth Percentile The Growth Percentile shows how an EL progressed on ACCESS Overall during the past year, as compared to peers with similar score histories. It is calculated by the Colorado Department of Education. This field is populated if the student has a 2014-15 Trajectory Target of "ACCESS Overall 4 and GP>AGP".
Adequate Growth Percentile
The Adequate Growth Percentile tells us whether the year’s growth was sufficient for students to reach or maintain English language proficiency in the expected time frame. It is calculated by the Colorado Department of Education. This field is only filled out if the student has a 2014-15 Trajectory Target of "ACCESS Overall 4 and GP>AGP".
GP>AGP Whether or not the Growth Percentile exceeds the Adequate Growth Percentile. If the student has a 2014-15 Trajectory Target of "ACCESS Overall 4 and GP>AGP", ACCESS growth scores are given for 2014-15. For this level, the student will be on-track if the GP>AGP, and off-track if the GP<AGP.

PERSONAL OUTCOMES

INSIGHTS, IDEAS, APPLICATION