karan singh, cfa, frmstatic-news.moneycontrol.com/static-mcnews/2018/01/oct-2017-bank... ·...
TRANSCRIPT

JM Financial Institutional Securities Limited
JM Financial Research is also available on: Bloomberg - JMFR <GO>,
Thomson Publisher & Reuters S&P Capital IQ and FactSet Please see Appendix I at the end of this report for Important Disclosures and Disclaimers and Research Analyst Certification.
NBFC
The recently announced PSU Banks (PSBs) recap should lead to faster resolution of NPAs and
provide some amount of growth capital, which could lead to higher competitive intensity in
segments such as mortgages, LAP, SME and infra (while staying away from transactional
intensive and low ticket products). However, PSBs suffer from structural issues such as i) poor
underwriting, technology infrastructure and collection capabilities, ii) poor compensation
structure and iii) directed lending by the Govt. for social welfare schemes, making PSBs
inefficient. The agile nature of NBFCs ensures that they are able to navigate such competition
due to i) focus on profitability over growth, ii) focus on niche customer segments and
customised product offering, iii) faster turnaround time, iv) superior collections abilities and v)
use of data analytics and technology for better underwriting and cross-selling. We believe 1)
rural focused NBFCs such as MMFS will not be significantly impacted given a) different
customer segments vs. PSBs, b) relationship with various OEMs c) significant investment in
the distribution network (doubling of branches over the last 5 years from nearly 600 in FY12
to 1180 currently; 2) NBFCs with large Infra exposure such as LTFH would benefit from the
increase in the down selling opportunities; 3) diversified and well-managed NBFCs such as
Bajaj Finance are well placed to navigate the increasing competition in the LAP segment and
should continue to outperform its peers; and 4) competition in home loan(HL) and LAP
segments could increase. We prefer HFCs with a balanced product mix – HDFC Ltd and PNB
Housing Finance.
Structural advantages of NBFCs to lead to better growth prospects: In the last 5 years, the
market share of NBFCs has increased by more than 100bps to 15% in the overall system
credit. We believe NBFCs have structural competitive strengths that are difficult to
replicate, such as 1) superior underwriting capabilities, 2) customised product offerings, 3)
faster turnaround times, 4) strategic presence in lending segments as well as geographies,
5) extensive use of technology and analytics to improve their underwriting skills and 6)
management compensation and incentives, which help attract significantly better talent.
Some of the benefits that could accrue due to PSBs recap are as follows: i) Opportunities
for sell down of infra/mortgage loans by NBFCs to PSBs would increase, thereby boosting
fee income and growth opportunities; ii) Credit availability for NBFCs from PSBs will go up
which will benefit NBFCs; iii) Resolution of NPAs could led to better economic growth
prospects, thereby boosting lending opportunities for the entire sector.
PSBs unlikely to challenge NBFCs due to inherent structural issues: While PSBs recap will
help them resolve NPAs by taking hair-cuts and start competing for loans, we believe PSBs
would be constrained by their structural issues which are as follows: 1) focus on growth
over profitability; 2) poor underwriting and collection capabilities; 3) rigid appraisal
processes and higher turnaround times; 4) poor technology infrastructure, risk
infrastructure and monitoring mechanisms and 5) poor management compensation and
incentive structure and absence of ESOPs– the average salary for MD/CEO of top
NBFCs/private banks is 20-30x of PSBs.
However, we expect competitive intensity to increase in segments such as Home Loans,
LAP, LRD (Lease rental discounting) and auto loans: We expect PSBs to focus on larger
ticket size infrastructure loan, refinancing opportunities in corporate segment; MSME
loans, LAP/LRD and home/auto loans post this recap. At the peak of the last credit cycle,
PSBs retail portfolio comprised primarily of mortgage and car segments which constituted
40-55% and 10% of the overall book. We do not believe PSBs have the skill set to focus
on segments such as consumer durables, used vehicle, developer financing etc.
Housing Finance – High ticket LAP, LRD and home loans to witness increase in
competitive intensity, prefer HFCs with balanced product mix: We expect competitive
intensity to increase in Home Loans (HL) and LAP. Home Loan: Despite strong competitive
intensity, HFCs have gained/maintained market share due to faster turnaround times,
better service levels and their ability to raise money at competitive rates. However, given
that the current spread of home loans rates over MCLR is only 15-35 bps vs 60 bps
earlier, we believe there is limited room to cut home loan rates. We forecast pressure on
Karan Singh, CFA, FRM [email protected] | Tel: (91 22) 66303082
Nikhil Walecha [email protected] | Tel: (91 22) 66303027
Bunny Babjee [email protected] | (+91 22) 6630 3263
Sameer Bhise [email protected] | Tel: (91 22) 66303489
Jayant Kharote [email protected] | Tel: (91 22) 66303099
S Parameswaran [email protected] | +91 22 66303075
Exhibit 1. Valuation (INR)
NBFC Target
Multiple (FY20E)
Multiple
based value
Subs
Value
Target
Price
HDFC Ltd 2.8x 10¹⁵ 875 1,890
LICHF 2.0x 700 - 700
REPCO 2.5x 725 - 725
BAF 5.1x 2,050 - 2,050
CIFC 2.6x 1,170 - 1,170
MMFS 2.4x 448 52 500
PNB Housing 3.3x 1,680 - 1,680
L&T Finance 3.4x 235 - 235
SHTF 1.9x 1,300 - 1,300
SCUF 2.3x 2,400 - 2,400
Source: Company, JM Financial
Exhibit 2. Earnings table
NBFC EPS CAGR (%) ROA (%) ROE (%)
FY17-20e FY19e FY20e FY19e FY20e
HDFC 16.0% 2.2% 2.2% 19.3% 20.0%
LICHF 13.8% 1.3% 1.3% 17.7% 17.8%
REPCO 16.4% 2.2% 2.2% 17.2% 17.2%
BAF 32.8% 3.6% 3.6% 19.6% 21.8%
CIFC 19.0% 2.6% 2.6% 18.7% 18.9%
MMFS 54.5% 2.2% 2.4% 13.2% 14.9%
PNB Housing 39.1% 1.5% 1.5% 16.1% 18.1%
L&T Finance 37.2% 2.0% 2.1% 18.8% 20.9%
SHTF 22.7% 2.2% 2.3% 14.5% 15.4%
SCUF 21.1% 2.6% 2.6% 13.7% 15.0%
Source: Company, JM Financial
30 October 2017 India | NBFC | Sector Report
Structurally on a strong footing

NBFC 30 October 2017
JM Financial Institutional Securities Limited Page 2
home loan yields for HFCs under over coverage. LAP: We expect competition to intensify
further in this segment as PSBs reduce rates and offer higher LTVs to become more
competitive. NBFCs were already seeing increasing competitive intensity and well-
managed NBFCs started to focus on lower ticket size LAPs and changed their distribution
strategy to reduce their dependence on DSAs. We expect PSBs to target DSA-led higher
ticket size LAP/LRD as this would help PSBs deploy their capital faster. However, NBFCs
could also benefit from increased opportunities of assignments transaction in LAP
segment and increased credit flow from PSBs to NBFCs. We favour HFCs with a balanced
product mix such as HDFC (HL: 69%, Corporate: 30%, others: 1.5%) and PNB Housing
(HL: 59%, LAP: 16.5%, CF: 12%, others: 13%); these will be able to withstand this
increasing competitive intensity and deliver strong return ratios. Other HFCs such as
Repco which is primarily present in rural/semi-urban market, focuses on lower ticket
home loans will be less impacted as PSBs are unlikely to target such segment. Companies
like LICHF, which have a very high share of retail home loans (of which most are salaried
customers), would be most impacted. We conservatively forecast a margin decline for
HFCs under our coverage.
Rural/Niche NBFCs would continue to maintain an edge: In the past 5 years, auto
financiers have increased their market share from 43% in FY12 to 47% as NBFCs that
operated in this segment focused on niche segments and have developed a deep
understanding of the market, customer profiles and products, and developed expertise in
valuation and credit appraisal. We expect market share gains to continue for NBFCs
present in i) Used vehicles – Given the expertise required and transaction intensive nature
of this business, especially with respect to collection, we do not expect significant
competition from PSB in both used and New CV segments ii) Two-wheelers - PSBs do not
participate in two-wheeler loans in a focused manner due to the transactional intensive
nature of this business due to the small ticket size of the product, lack of collection ability
and scalability issues. iii) Given the difference in customer profile, Rural-NBFCs such as
MMFS would continue to maintain their market share due to significant investment in
distribution network, faster turnaround times, different customer segments vs. PSBs and
existing relationships with OEMs. Credit assessment of farm cash flows requires a lot of
expertise and collection capabilities, which PSBs do not possess.
Diversified financiers - Bajaj Finance best positioned: BAF has the most diversified loan
book with a full suite of lending products (LAP, Small business loans, consumer durables,
digital financing, lifestyle financing, rural financing, 2/3 wheelers and vendor financing)
which coupled with superior underwriting skill, best in class technology and focus on
cross-selling should enable it to navigate increasing competitive intensity in LAP segment.
In fact, in order to mitigate risks in the LAP portfolio, BAF has been consolidating this
book for the past three years through direct sourcing and has curtailed its exposure in the
high ticket LAP segment with ticket size of INR 9-10mn (vs. 2.25mn in FY15). We believe
Bajaj Finance, with diversified loan book, strong risk management practices and top class
management at the helm, is best positioned to deliver sustainable profitable growth
ahead.
Infra financiers – LTFH best placed to capture down selling opportunities: Given the larger
ticket size of infra loans and Govt. focus towards infra, we believe PSBs would focus on
this segment after the recap. However, we expect NBFCs such as LTFH that have excellent
structuring capabilities and superior underwriting skills to benefit given a) opportunities
for sell downs to increase and will boost their fee income and b) increased availability of
banks’ credit.
MSME financiers In the MSME segment, formal channel accounts for only 15-20% of the
credit requirement of the MSMEs. We do not expect any meaningful decline in market
share for NBFCs in this segment due to i) greater market penetration and better operating
efficiency; ii) Niche focus and customised product offerings; and iii) shorter turnaround
times. We believe there would be minimal impact on players such as Shriram City Union
Finance, which deal with micro SMEs.
Top picks - Bajaj Finance, MMFS, and LTFH: Our top picks are Bajaj Finance/MMFS/LTFH
and preferred picks in HFC space are HDFC Ltd. and PNB Housing. For our top picks (Bajaj
Finance/MMFS/LTFH) we expect earnings CAGR of 33%/55%/37% respectively over
FY17-FY20E with healthy ROE of 22%/15%/21% by FY20E.

NBFC 30 October 2017
JM Financial Institutional Securities Limited Page 3
NBFCs share in systemic credit is growing steadily… Exhibit 1.
Source: CRISIL
…while maintaining lower NPLs than PSBs Exhibit 2.
0%
5%
10%
15%
20%
25%
Mar-13 Mar-14 Mar-15 Mar-16 Mar-17
PSBs - GNPA NBFC - GNPA
Source: RBI
PSBs have historically focused on mortgage and auto loans Exhibit 3.
0%
10%
20%
30%
40%
50%
60%
70%
80%
90%
100%
SBI PNB BOB SBI PNB BOB
Home loans Auto loans Education loans Mortgages Others
FY 2012 FY 2017
Source: Company data, Others includes CC, personal loans, # Mortgages data not available for FY12
Avg. salary for MD/CEO of top NBFCs/Pvt Bank is 20-30x of Exhibit 4.PSBs
FY 2017 Salary -
MD & CEO (INR mn)
Employee shareholding
in the company (%)
PSU
SBI 2.9
PNB 3.0
BOB 3.1
Canara Bank 3.0
Private banks
ICICI Bank 55.4 3.42%
HDFC Bank 100.6 3.47%
IndusInd Bank 63.2 1.92%
YES 68.7 3.61%
NBFCs
BAF 69.7 1.43%
PNB Housing 17.7 1.91%
L&T Finance 47.3 1.27%
Mahindra Finance 38.1 1.20%
Source: Company data
Housing Finance – Stable Market share trends Exhibit 5.
Source: CRISIL
Stable asset quality trends Exhibit 6.
1.30%1.20%1.18%
1.08%
0.00%
0.20%
0.40%
0.60%
0.80%
1.00%
1.20%
1.40%
FY14 FY15
PSBs Individual Housing HFCs
Source: RBI
NBFCs have higher Market share in LAP Exhibit 7.
12%
24%27%
31%
0%
5%
10%
15%
20%
25%
30%
35%
Public SectorBanks
Private Banks NBFC HFC
Dec'16 market share (%)
Source: CIBIL
NPLs trends in LAP Exhibit 8.
7.67%
4.57%
1.45% 1.23%
0.00%
2.00%
4.00%
6.00%
8.00%
10.00%
Public SectorBanks
NBFC HFC Private Banks
90DPD (%)
Source: CIBIL
69% 65% 65%
14% 14% 15%
17% 18% 20%
0%
20%
40%
60%
80%
100%
FY 2012 FY 2014 FY 2016
Capital market borrowing and ECB NBFCs credit Bank Credit
61% 61% 60% 60% 60%
39% 39% 40% 40% 40%
0%
20%
40%
60%
80%
100%
FY13 FY14 FY15 FY16 FY17
Banks NBFCs

NBFC 30 October 2017
JM Financial Institutional Securities Limited Page 4
Spreads between HL and MCLR have narrowed implying Exhibit 9.little room for further rate cuts
As of Oct-17 SBI PNB BOB ICICI
Home Loan rates (Min) 8.35% 8.35% 8.35% 8.35%
MCLR 8.00% 8.15% 8.30% 8.20%
HL spread over MCLR 35bps 20bps 5bps 15bps
Source: Company, JM Financial
We prefer HFCs with balanced product mix Exhibit 10.
73%59%
84% 80%
17%
13% 20%
12% 11%
4%15% 13%
0%
20%
40%
60%
80%
100%
HDFC PNB Housing LIC Housing Repco
Individuals LAP Construction Finance Others
Source: Company, JM Financial
LTFH – Infra has gained market share in Infra segment Exhibit 11.
27% 26% 31% 31% 35% 35% 33%
42.4% 41.9% 35.9% 36.2% 31.7% 32.9% 32.3%
13% 14% 15% 15% 16% 17% 17%
10.9% 11.0% 11.7% 11.9% 12.9% 14.0% 14.5%
1.0% 1.2% 1.4% 1.4% 1.6% 1.9% 2.4%
0%
20%
40%
60%
80%
100%
FY11 FY12 FY13 FY14 FY15 FY16 FY17
Top 5 PSBs Other SCBs PFC REC LTFH - Infra Finance
Source: Company, RBI, JM Financial
While maintaining lower stressed assets Exhibit 12.
Source: Company, RBI, JM Financial
NBFCs have just 5% share in MSME financing Exhibit 13.
Source: CRISIL
* MSME comprises of Manufacturing companies with less than INR 100mn and Services companies with less than INR 50mn turnover
Gross NPL among NBFCs and SCBs (MSME) Exhibit 14.
Source: Company data
18.3%
32.9%
11.6% 11.9%
0%
5%
10%
15%
20%
25%
30%
35%
SCBs PFC REC LTIF
FY15 FY16 FY17
72% 71% 71% 70% 67%
20% 22% 23% 23% 25%
4% 4% 3% 3% 2%2.1% 2.9% 3.3% 4.0% 5.3%
0%
20%
40%
60%
80%
100%
2011-12 2012-13 2013-14 2014-15 2015-16
Public Sector Banks Private Sector Banks Foreign Banks NBFCs
4.5-5.0%
6.0-6.5%
NBFC Banks
NBFC Banks

NBFC 26 October 2017
JM Financial Institutional Securities Limited Page 5
Sector wise impact of PSB recap Exhibit 15.
Segment Competitive
intensity Rationale
Car Loans/UVs Moderate
Rural focused NBFCs such as MMFS would continue to maintain their market share led by faster disbursements, collection abilities and existing
relationship with OEMs.
However, we expect competitive intensity to increase in urban areas as PSBs would focus on salaried customers in this segment
Consumer Finance Low
We see negligible impact on consumer durable financing which are low ticket items as both the customer acquisitions and credit underwriting
requires lot of expertise. It is the most difficult segment to target given large investment in technology infrastructure, lending expertise which player
like Bajaj Finance have taken years to build. Further, given lower duration and small ticket size, PSBs would stay away from it.
CV Low
In New CVs, Banks largely lend to large fleet operators whereas NBFCs lend to customers with a weaker credit profile such as small road transport
operators, and first time users. Auto finance NBFCs that operate in this segment have developed a deep understanding of the market, customer
profile, product and developed expertise in valuation, credit appraisal and efficient management of operations and have, thus, have been able to
maintain asset quality. Continuous monitoring of the disbursed loans by field officers who had originated the loans through frequent visits to the
borrower helps keep delinquencies under control. Given the expertise required and transaction intensive nature of this business, especially with
respect to collection, we do not expect significant competition from PSBs in both used and new CV segments.
Developer Loans Low We believe PSBs do not possess adequate underwriting skills and structuring capabilities to do developer loans. Consequent, we do not expect
significant increase in competitive intensity in this segment.
Gold Financing Low This segment is dominated by private banks and NBFCs. We believe NBFCs would continue to have an edge due to faster turnaround time, adequate
risk assessment and niche focus on gold financing loans over the past 3 decades.
Home Loans High
We expect competitive intensity to further intensify in the highly competitive Housing Finance space. We expect PSBs could only compete on rates;
however, there is limited room for further rate cuts due to compression in HL spreads over MCLR (which is currently at 30-35bps). We believe HFCs
would be able to maintain steady loan growth driven by competitive rates and faster turnaround time.
Infra Loans High
Given larger ticket size of the Infra segment and Govt. focus towards Infra, we believe PSBs would focus on this segment post recap. However, we
expect NBFCs like LTFH which have excellent structuring capability and superior underwriting skills to benefit given a) opportunities for sell downs will
increase and will boost their fee income and b) increased availability of Banks’ credit.
PSBs could also become aggressive when it comes to refinancing of Infra assets/projects. Therefore competition in refinancing opportunities could
increase.
LAP/LRD High
- LAP/LRD segment could witness an increase in competitive intensity post PSB recap. We expect PSBs to focus on larger ticket size LAP and they
would try and gain market share through following measures a) by charging lower interest rates to customers b) offering higher LTVs.
- Well managed NBFCs started focusing on lower ticket size LAP, changed their distribution strategy to reduce their dependence on DSAs. We expect
PSBs to target DSA led higher ticket size LAP/LRD as this would help PSBs deploy their capital faster
- Some customer still prefer NBFCs over Banks for LAP on self-occupied properties as Banks processes makes it difficult to release its property even
after full repayment if the customer has more than one loan arrangement with the Bank.
MFI Low PSB focus on SHGs model. Therefore there is no impact on JLG focused MFI business. On the other hand, Bank loans to MFI may get cheaper as
availability of bank finance increases
SME Moderate
- PSBs held the dominant share in the MSME lending space, funding almost two-thirds of the total MSME loan outstanding. However, their share has
contracted over the past four to five years as private banks and NBFCs have increased their presence in tier II and smaller regions. PSBs are losing out
due to their stricter appraisal process and higher turnaround time. We do not expect any meaningful decline in market share for NBFCs in this
segment due to i) Greater market penetration and better operating efficiency; ii) Niche focus and customised product offerings; and iii) Shorter
turnaround time.
Two Wheelers Low
This segment is also transaction intensive which requires significant efforts due to lower ticket size. PSBs don't participate much in two-wheelers
finance business in a focused manner due to lack of collection ability and scalability issues. Further, it requires active involvement with the
OEMs/dealers to generate business which makes it difficult segment to operate for the PSBs.
Tractors Low
- Given the difference in customer profile, Rural-NBFCs would continue to maintain their market share led by faster disbursements, collection abilities
and existing relationship with OEMs.
- We see limited on tractor financing business as PSBs would continue to focus on crop loans which are backed by land collateral. Credit assessment
of farm cash flows requires lot of expertise and collection capabilities which PSBs do not possess.
Source: Company, JM Financial

NBFC 26 October 2017
JM Financial Institutional Securities Limited Page 6
Feedback from Management Exhibit 16.
Company Feedback
Bajaj Finance
- PSBs would focus on growth than profitability and would stay away from unsecured business. Their primary target will be i) Mortgages – Higher focus on
LAP and LRD than Home loans and ii) Project Financing which would help them to deploy their capital faster.
- LAP/SME: Here, PSBs would focus on higher ticket LAP (INR 20mn to 50mn) though currently they are also doing business of INR 5mn to 10mn. There could
be some yield pressure on the SME side as PSBs may give additional exposure to its existing customers who have CASA relationship with them resulting in
higher LTV.
- NBFCs could also benefit from increased assignments transaction in LAP segment and increased credit flow from PSBs to NBFCs.
Capital First - NBFCS will continue with their current growth rate due to different pocketing of financing. NBFCs that are specialized in financing particular segments like
tractor, CV, SME, gold financing will continue to maintain their niche and it’s not easy to replicate the skill sets required to finance at micro level. Therefore
these NBFCs will continue to grow at 15-20% because there are very unique pockets for them which they have developed over the last 15-30 years.
Cholamandalam PSBs will prefer to do chunkier loans as they don’t have Infrastructure, manpower and inclination to do lower ticket retail loans which requires lot of collection
efforts. They will i) focus on chunkier SME working capital loans and ii) LAP loans (with ticket size of more than INR 10mn)
Edelweiss
- While the competition for credit will increase because both the private banks and NBFCs did not face as much competition from the PSBs up till now,
however economic recovery will also help in expanding the overall credit pool in the economy. Therefore, NBFCs, especially housing finance companies, and
the private sector banks will face some pressure on yields.
- Company believes that the housing finance companies will get aggressive, however PSBs like SBI and Bank of Baroda has always been aggressive and their
capital adequacy has remained healthy. PNB and Canara Bank on the other hand have their own housing finance companies; therefore, large PSU players
were already aggressive in the housing finance space up till now.
- Company expects higher competition in the auto loans and rural finance but not in consumer durable financing, personal loan, credit card loans, structured
credit and distressed credit.
LTFH
Currently, PSUs are present in the same market where NBFCs operates. However, niche NBFCs have maintained their dominance over PSBs due to their
nimbleness, reach and niche customer profile. Company believes that NBFCs will continue to maintain their superiority in most of the categories. As per
company, NBFC could face competition in three segments including i) Working capital loans ii) Infrastructure financing and iii) Housing loans. In the other
segments, PSBs cannot operate in a focused manner.
- In the Infra space, LTFH has clearly benefited from lower competition intensity of PSBs. However, as witnessed in the recent NPL cycle, PSBs do not have
adequate skills to assess Infra loans. This would create more opportunities for LTFH aided by its strong credit assessment and loan syndication skills. Therefore,
LTFH would benefit from increase in down selling opportunities. NBFCs can also expect better terms from PSBs on lending rates as they look to expand their
loan books.
- Similar to the Infra loans, PSBs do not have skills to assess developer loans. LTFH structure developer loans based on sales velocity and stage of construction
cycle. PSBs also fall behind in terms of sophisticated product structuring and underwriting skills of Developer loans compared to NBFCs.
- In the Housing Finance, company expects competition intensity to increase both for the salaried and self-employed customers. Therefore, competitive
intensity is expected to increase leading to the decline in lending rates and possible increase in LTVs. In the case of LAP, PSBs would become aggressive by
increasing LTVs.
Magma Sector that would see more credit disbursements in the coming months were government infrastructure projects, affordable housing and the MSME segment.
NBFCs may face some competition in the MSME segment. But with formal channels accounting for only 15-20% of the credit requirement of the MSMEs, the
MSMEs business of NBFCs is unlikely to be affected.
MMFS Company expects PSBs would focus on Corporates/Infra loans/Home Loans and LAP once they are adequately capitalized. Rural financing customer segments
are different and given PSBs do not have larger on the ground collection team; MMFS does not expect significant competition in this segment.
Repco
- Company expects positive impact for its SME customers due to the increase in Bank credit which would help its customers operating in stressed sectors such
as textile. Additionally, interest rates which are at its lows have a very limited room for further reduction.
- Repco which primarily operates in the rural/semi-urban areas does not see increase in competition in low ticket size home loans. Additionally, Branch
managers of PSBs do not possess enough skills required and authority to assess and sanction Home loans.
- In the LAP segment, company expects PSBs to focus on higher ticket LAP (ticket size of INR 10mn and above). However, company is incrementally focusing
on lower ticket LAP (less than INR 5mn) and would not be much impacted.
Source: Company, JM Financial
NBFC 26 October 2017
JM Financial Institutional Securities Limited Page 7
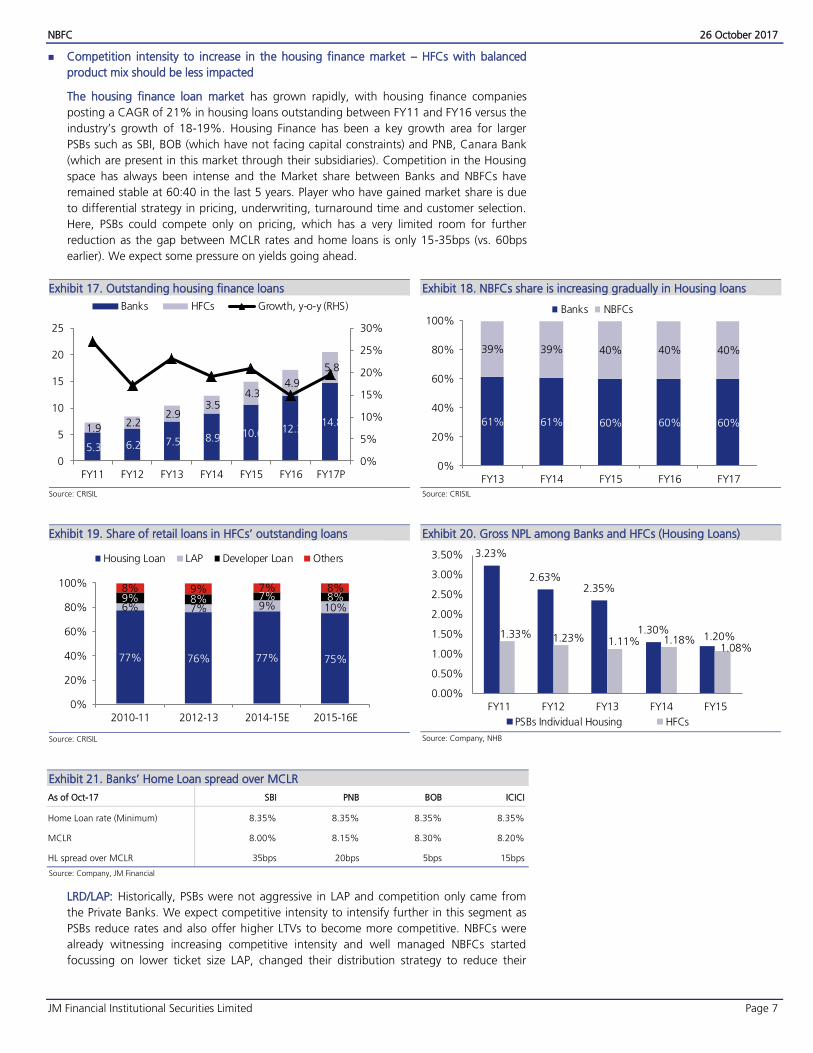
Competition intensity to increase in the housing finance market – HFCs with balanced
product mix should be less impacted
The housing finance loan market has grown rapidly, with housing finance companies
posting a CAGR of 21% in housing loans outstanding between FY11 and FY16 versus the
industry’s growth of 18-19%. Housing Finance has been a key growth area for larger
PSBs such as SBI, BOB (which have not facing capital constraints) and PNB, Canara Bank
(which are present in this market through their subsidiaries). Competition in the Housing
space has always been intense and the Market share between Banks and NBFCs have
remained stable at 60:40 in the last 5 years. Player who have gained market share is due
to differential strategy in pricing, underwriting, turnaround time and customer selection.
Here, PSBs could compete only on pricing, which has a very limited room for further
reduction as the gap between MCLR rates and home loans is only 15-35bps (vs. 60bps
earlier). We expect some pressure on yields going ahead.
Outstanding housing finance loans Exhibit 17.
Source: CRISIL
NBFCs share is increasing gradually in Housing loans Exhibit 18.
Source: CRISIL
Share of retail loans in HFCs’ outstanding loans Exhibit 19.
Source: CRISIL
Gross NPL among Banks and HFCs (Housing Loans) Exhibit 20.
3.23%
2.63%2.35%
1.30%1.20%1.33% 1.23% 1.11% 1.18%
1.08%
0.00%
0.50%
1.00%
1.50%
2.00%
2.50%
3.00%
3.50%
FY11 FY12 FY13 FY14 FY15
PSBs Individual Housing HFCs
Source: Company, NHB
Banks’ Home Loan spread over MCLR Exhibit 21.
As of Oct-17 SBI PNB BOB ICICI
Home Loan rate (Minimum) 8.35% 8.35% 8.35% 8.35%
MCLR 8.00% 8.15% 8.30% 8.20%
HL spread over MCLR 35bps 20bps 5bps 15bps
Source: Company, JM Financial
LRD/LAP: Historically, PSBs were not aggressive in LAP and competition only came from
the Private Banks. We expect competitive intensity to intensify further in this segment as
PSBs reduce rates and also offer higher LTVs to become more competitive. NBFCs were
already witnessing increasing competitive intensity and well managed NBFCs started
focussing on lower ticket size LAP, changed their distribution strategy to reduce their
5.3 6.2 7.5 8.9 10.6 12.3 14.8
1.9 2.2
2.9 3.5
4.3 4.9
5.8
0%
5%
10%
15%
20%
25%
30%
0
5
10
15
20
25
FY11 FY12 FY13 FY14 FY15 FY16 FY17P
Banks HFCs Growth, y-o-y (RHS)
61% 61% 60% 60% 60%
39% 39% 40% 40% 40%
0%
20%
40%
60%
80%
100%
FY13 FY14 FY15 FY16 FY17
Banks NBFCs
77% 76% 77% 75%
6% 7% 9% 10%9% 8% 7% 8%8% 9% 7% 8%
0%
20%
40%
60%
80%
100%
2010-11 2012-13 2014-15E 2015-16E
Housing Loan LAP Developer Loan Others

NBFC 26 October 2017
JM Financial Institutional Securities Limited Page 8
dependence on DSAs. We expect PSBs to target DSA led higher ticket size LAP/LRD as this
would help PSBs deploy their capital faster.
NBFCs have higher market share in LAP Exhibit 22.
Source: ICRA
Gross NPL among NBFCs and Banks (LAP) Exhibit 23.
7.67%
4.57%
1.45% 1.23%
0.00%
2.00%
4.00%
6.00%
8.00%
10.00%
Public SectorBanks
NBFC HFC (includesIBHFL)
Private Banks
90DPD (%)
Source: CIBIL
Developer Loan: Recently, NBFCs become aggressive in providing developer loans and the
share of developer loans in the overall portfolio increased to 7.5% in FY16 (vs. 6.7% in
FY15). We believe PSBs does not possess adequate underwriting skills and structuring
capabilities to do developer loans. Consequent, we do not expect significant increase in
competitive intensity in this segment.
We favour HFCs with balanced product mix such as HDFC and PNB Housing which would
be less impacted. Other HFCs such as Repco which is primarily present in rural/semi-urban
market, focuses on lower ticket home loans and some of its customers do not have
proper documents. With PSBs unlikely to target such segment, company would face very
less competition from the PSBs. Companies like LICHF, which have a very high share of
retail home loans (of which most are salaried customers), would be most impacted.
12%
24%27%
31%
0%
5%
10%
15%
20%
25%
30%
35%
Public SectorBanks
Private Banks NBFC HFC
Dec'16 market share (%)

NBFC 26 October 2017
JM Financial Institutional Securities Limited Page 9
Rural/Niche NBFC will continue to maintain their market share
NBFCs have increased their market share in the auto finance from about 43% in FY12 to
47% in FY17 due to factors such as i) wider and effective reach, ii) strong risk
management capabilities, iii) better understanding of their customers and iv) controlled
operating cost. Further, stress on the books of PSBs has helped NBFCs to gain share in the
auto finance market. The latent credit demand allowed NBFCs to fill the gap, especially
where PSBs do not have the appetite for risk and capabilities to serve.
NBFCs have gained share by catering to customers with a relatively weaker credit profile,
focusing on used vehicle financing (PSBs have a very limited presence in this space) and
ensuring faster processing, lower documentation and greater flexibility in borrower
appraisal.
NBFC’s share in auto-finance market Exhibit 24.
Source: CRISIL
Competition in Auto-finance Segment Exhibit 25.
27%
16%
11%10%
7%
7%
6%
16%
Shriram Transport Finance Mahindra Finance
Cholamandalam Finance Kotak Mahindra Bank
Magma Fincorp TMF
Sundaram Finance Others Source: CRISIL
In commercial vehicles, NBFCs have a significant presence in the CVs which accounts for
almost half of NBFCs’ total auto finance outstanding while cars and UVs account for over
a third of the total portfolio. Used-vehicle financing constitutes almost two-thirds of
NBFCs’ total CV finance outstanding. NBFCs that operate in this segment are focused on
niche segments and have developed a deep understanding of the market, customer
profile, product and developed expertise in valuation, credit appraisal and efficient
management of operations and have, thus, have been able to maintain asset quality. They
have capitalised on the enormous opportunity offered by the segment through
investment in processes and manpower. NBFCs also accept payments in cash, given that a
large part of their customer segment earns in cash. Continuous monitoring of the
disbursed loans by field officers who had originated the loans through frequent visits to
the borrower helps keep delinquencies under control. NBFCs dominate the used CV
disbursement market with around 80% share. Given the high risk associated with the
used CV segment, PSBs have had minimal exposure to the segment. Therefore players like
SHTF would face no competition from the PSBs.
43% 46% 48% 47% 47%
57% 54% 52% 53% 53%
0%
10%
20%
30%
40%
50%
60%
70%
80%
90%
100%
2012-13 2013-14 2014-15 2015-16 2016-17P
NBFCs Banks
NBFC 26 October 2017
JM Financial Institutional Securities Limited Page 10
NBFCs account for bulk of the used CV disbursements Exhibit 26.
Source: CRISIL
Finance Penetration for two-wheeler finance market Exhibit 27.
Source: CRISIL
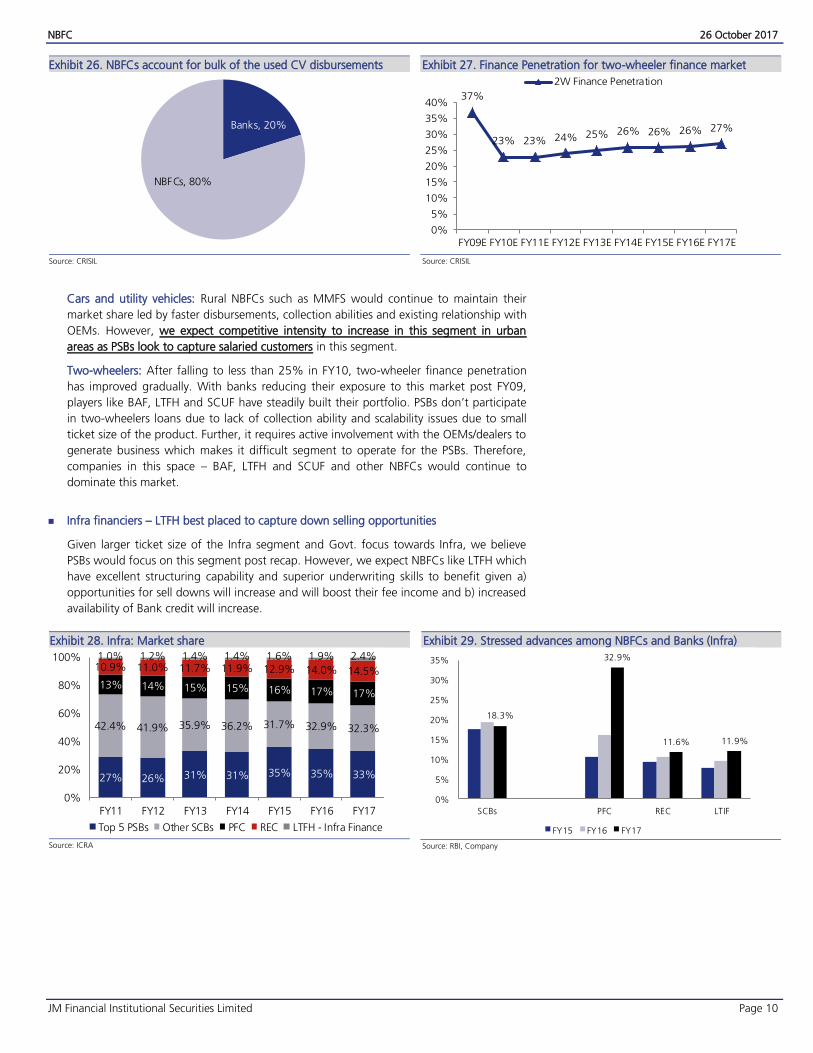
Cars and utility vehicles: Rural NBFCs such as MMFS would continue to maintain their
market share led by faster disbursements, collection abilities and existing relationship with
OEMs. However, we expect competitive intensity to increase in this segment in urban
areas as PSBs look to capture salaried customers in this segment.
Two-wheelers: After falling to less than 25% in FY10, two-wheeler finance penetration
has improved gradually. With banks reducing their exposure to this market post FY09,
players like BAF, LTFH and SCUF have steadily built their portfolio. PSBs don’t participate
in two-wheelers loans due to lack of collection ability and scalability issues due to small
ticket size of the product. Further, it requires active involvement with the OEMs/dealers to
generate business which makes it difficult segment to operate for the PSBs. Therefore,
companies in this space – BAF, LTFH and SCUF and other NBFCs would continue to
dominate this market.
Infra financiers – LTFH best placed to capture down selling opportunities
Given larger ticket size of the Infra segment and Govt. focus towards Infra, we believe
PSBs would focus on this segment post recap. However, we expect NBFCs like LTFH which
have excellent structuring capability and superior underwriting skills to benefit given a)
opportunities for sell downs will increase and will boost their fee income and b) increased
availability of Bank credit will increase.
Infra: Market share Exhibit 28.
27% 26% 31% 31% 35% 35% 33%
42.4% 41.9% 35.9% 36.2% 31.7% 32.9% 32.3%
13% 14% 15% 15% 16% 17% 17%
10.9% 11.0% 11.7% 11.9% 12.9% 14.0% 14.5%
1.0% 1.2% 1.4% 1.4% 1.6% 1.9% 2.4%
0%
20%
40%
60%
80%
100%
FY11 FY12 FY13 FY14 FY15 FY16 FY17
Top 5 PSBs Other SCBs PFC REC LTFH - Infra Finance
Source: ICRA
Stressed advances among NBFCs and Banks (Infra) Exhibit 29.
Source: RBI, Company
Banks, 20%
NBFCs, 80%
37%
23% 23% 24% 25% 26% 26% 26% 27%
0%
5%
10%
15%
20%
25%
30%
35%
40%
FY09E FY10E FY11E FY12E FY13E FY14E FY15E FY16E FY17E
2W Finance Penetration
18.3%
32.9%
11.6% 11.9%
0%
5%
10%
15%
20%
25%
30%
35%
SCBs PFC REC LTIF
FY15 FY16 FY17
NBFC 26 October 2017
JM Financial Institutional Securities Limited Page 11
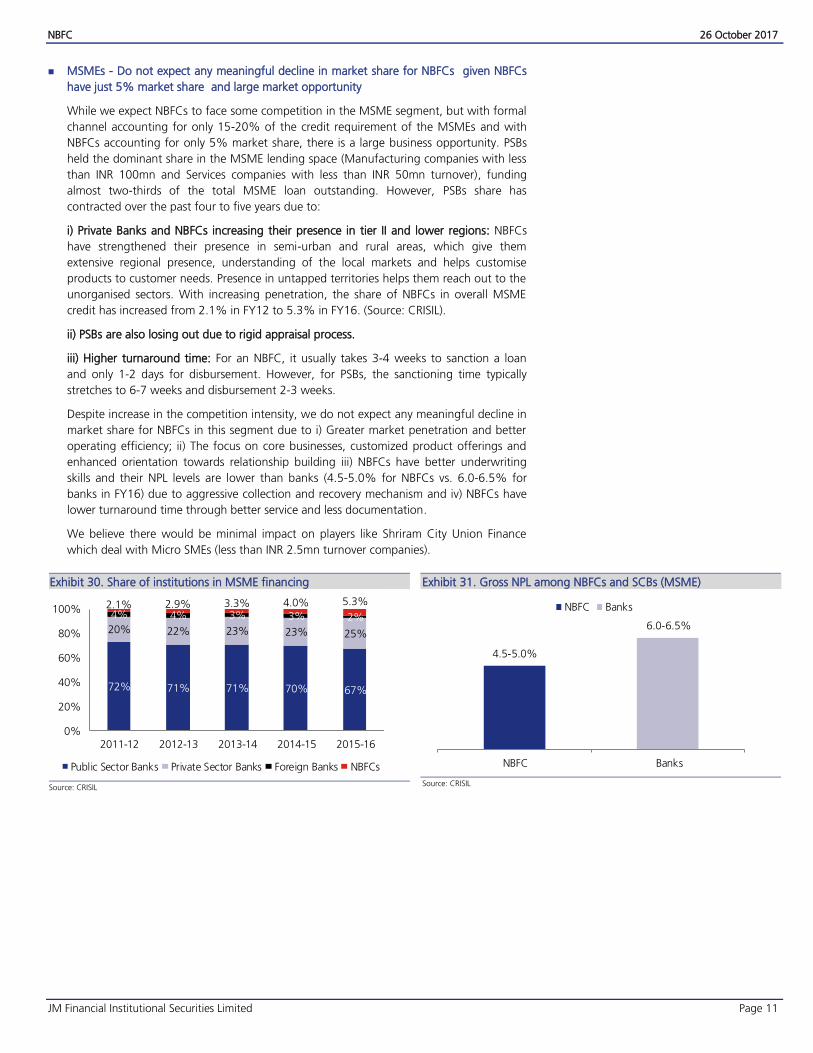
MSMEs - Do not expect any meaningful decline in market share for NBFCs given NBFCs
have just 5% market share and large market opportunity
While we expect NBFCs to face some competition in the MSME segment, but with formal
channel accounting for only 15-20% of the credit requirement of the MSMEs and with
NBFCs accounting for only 5% market share, there is a large business opportunity. PSBs
held the dominant share in the MSME lending space (Manufacturing companies with less
than INR 100mn and Services companies with less than INR 50mn turnover), funding
almost two-thirds of the total MSME loan outstanding. However, PSBs share has
contracted over the past four to five years due to:
i) Private Banks and NBFCs increasing their presence in tier II and lower regions: NBFCs
have strengthened their presence in semi-urban and rural areas, which give them
extensive regional presence, understanding of the local markets and helps customise
products to customer needs. Presence in untapped territories helps them reach out to the
unorganised sectors. With increasing penetration, the share of NBFCs in overall MSME
credit has increased from 2.1% in FY12 to 5.3% in FY16. (Source: CRISIL).
ii) PSBs are also losing out due to rigid appraisal process.
iii) Higher turnaround time: For an NBFC, it usually takes 3-4 weeks to sanction a loan
and only 1-2 days for disbursement. However, for PSBs, the sanctioning time typically
stretches to 6-7 weeks and disbursement 2-3 weeks.
Despite increase in the competition intensity, we do not expect any meaningful decline in
market share for NBFCs in this segment due to i) Greater market penetration and better
operating efficiency; ii) The focus on core businesses, customized product offerings and
enhanced orientation towards relationship building iii) NBFCs have better underwriting
skills and their NPL levels are lower than banks (4.5-5.0% for NBFCs vs. 6.0-6.5% for
banks in FY16) due to aggressive collection and recovery mechanism and iv) NBFCs have
lower turnaround time through better service and less documentation.
We believe there would be minimal impact on players like Shriram City Union Finance
which deal with Micro SMEs (less than INR 2.5mn turnover companies).
Share of institutions in MSME financing Exhibit 30.
Source: CRISIL
Gross NPL among NBFCs and SCBs (MSME) Exhibit 31.
Source: CRISIL
72% 71% 71% 70% 67%
20% 22% 23% 23% 25%
4% 4% 3% 3% 2%2.1% 2.9% 3.3% 4.0% 5.3%
0%
20%
40%
60%
80%
100%
2011-12 2012-13 2013-14 2014-15 2015-16
Public Sector Banks Private Sector Banks Foreign Banks NBFCs
4.5-5.0%
6.0-6.5%
NBFC Banks
NBFC Banks

NBFC 26 October 2017
JM Financial Institutional Securities Limited Page 12
Top picks – Bajaj Finance, Mahindra Finance, L&T Finance
Bajaj Finance – Superior growth with improving profitability
Bajaj Finance has the most diversified loan book with a full suite of lending products (LAP,
Small business loans, consumer durables, digital financing, lifestyle financing, rural
financing, 2/3 wheelers and vendor financing) which coupled with superior underwriting
skill, best in class technology and focus on cross-selling should enable it to navigate
increasing competitive intensity in LAP segment. In fact, in order to mitigate risks in the
LAP portfolio, BAF has been consolidating this book for the past three years through
direct sourcing and has curtailed its exposure in the high ticket LAP segment with ticket
size of INR 9-10mn (vs. 2.25mn in FY15). We believe Bajaj Finance, with diversified loan
book, strong risk management practices and top class management at the helm, is best
positioned to deliver sustainable profitable growth ahead. We expect earnings CAGR of
33% over FY17–FY20E, driven by robust AUM growth (33% CAGR). We expect healthy
return ratios with RoA/RoE of 3.6%/22% by FY20E; we value BAF at 5.1x Mar’20E book,
implying a Mar’19 TP of INR 2,050.
L&T Finance – Getting better with strong execution
Execution under the leadership of Mr. Dinanath Dubhashi continues to gather steam with
2QFY18 witnessing 47% YoY growth in PAT – this has seen continuous improvement
over the last 6 quarters. Profitability over the last 6 quarters has improved with reported
ROE improving from 9.7% in 1Q17 to 15.2% despite company providing for voluntary
provisioning of INR 8.9bn and accelerated provisioning of Rs 5.3bn. We believe LTFH on
track to achieve top quartile (18%+) ROE by FY19E driven by i) increasing share of
focused profitable business ii) improving capital allocation by exiting/partial sell down of
its non-core assets/unprofitable businesses and redeploying it to RoE accretive businesses;
iii) focus on fee income through sell down and DCM operations iv) focus on cost
efficiencies by streamlining businesses and digitizing operations and increase in
profitability contribution by investment management business. v) Given excellent
structuring capabilities and superior underwriting skills, we expect LTFH to benefit from
PSBs recap given increase in sell downs opportunities which will boost their fee income
and increased availability of banks’ credit. We forecast earnings CAGR of 37% over FY17-
20E with RoA/RoE improving from 1.35%/12% in FY17 to 2.1%/21% in FY20E. We
value LTFH at 3.4x Mar’20, implying Mar’19 TP of Rs 235.
Mahindra Finance – Asset quality improvement to boost RoA going forward
We expect RoA to improve going ahead due to 1) Improved crop outlook, increased
budget allocation and good monsoon for two consecutive years will boost farm income
and accelerate recoveries for MMFS; 2) With incremental NPLs coming down and
migration to 90DPD already completed, we factor credit costs of 230/200bps in FY18-19E
(vs. 306bps in FY17); 3) Management expects RoA to improve to 2% at end-FY18 (vs.
1.1% in FY17) on a like-to-like basis (120DPD); 4) Management expects the housing
subsidiary to continue its growth momentum of 40-50% and its book size to increase to
INR 100bn (vs. INR 48bn) by FY20; 5) Given the difference in customer profile, Rural-
NBFCs such as MMFS would continue to maintain their market share due to significant
investment in distribution network, faster turnaround times, different customer segments
vs. PSBs and existing relationships with OEMs. Credit assessment of farm cash flows
requires a lot of expertise and collection capabilities, which PSBs do not possess. We
expect earnings CAGR of c.60% (on a lower base) over FY17–20E and with RoA
improving to 2.4% and RoE of 15% by FY20E. We are factoring in a dilution of 9.4% in
FY18E. We value MMFS standalone at 2.4x Mar’20 BV, implying value of INR 448. We
value MRHF at INR 34 per share, while MIBL at INR 22 per share, implying Mar’19 TP of
Rs500.

NBFC 26 October 2017
JM Financial Institutional Securities Limited Page 13
Valuation charts
BAF P/B Exhibit 32.
0.00
1.00
2.00
3.00
4.00
5.00
6.00
7.00
Oct
-10
Oct
-11
Oct
-12
Oct
-13
Oct
-14
Oct
-15
Oct
-16
Oct
-17
BAF Fwd. P/BV (x) SD+1 SD-1 Average
Source: Company, JM Financial
BAF P/E Exhibit 33.
0
5
10
15
20
25
30
35
40
Oct
-10
Oct
-11
Oct
-12
Oct
-13
Oct
-14
Oct
-15
Oct
-16
Oct
-17
BAF Fwd. P/E (x) SD+1 SD-1 Average
Source: Company, JM Financial
HDFC P/B Exhibit 34.
1.0
1.5
2.0
2.5
3.0
3.5
4.0
4.5
Oct
-05
Oct
-06
Oct
-07
Oct
-08
Oct
-09
Oct
-10
Oct
-11
Oct
-12
Oct
-13
Oct
-14
Oct
-15
Oct
-16
Oct
-17
HDFC Fwd. Adj P/BV (x) SD+1 SD-1 Average
Source: Company, JM Financial
HDFC P/E Exhibit 35.
6
11
16
21
26
Oct
-05
Oct
-06
Oct
-07
Oct
-08
Oct
-09
Oct
-10
Oct
-11
Oct
-12
Oct
-13
Oct
-14
Oct
-15
Oct
-16
Oct
-17
HDFC Fwd. Adj P/E (x) SD+1 SD-1 Average
Source: Company, JM Financial
MMFS P/B Exhibit 36.
0.00
1.00
2.00
3.00
4.00
Oct
-07
Oct
-08
Oct
-09
Oct
-10
Oct
-11
Oct
-12
Oct
-13
Oct
-14
Oct
-15
Oct
-16
Oct
-17
MMFS Fwd. P/BV (x) SD+1 SD-1 Average
Source: Company, JM Financial
MMFS P/E Exhibit 37.
0
10
20
30
40
50
Oct
-07
Oct
-08
Oct
-09
Oct
-10
Oct
-11
Oct
-12
Oct
-13
Oct
-14
Oct
-15
Oct
-16
Oct
-17
MMFS Fwd. P/E (x) SD+1 SD-1 Average
Source: Company, JM Financial

NBFC 26 October 2017
JM Financial Institutional Securities Limited Page 14
L&T Finance P/B Exhibit 38.
1.0x
1.5x
2.0x
2.5x
3.0x
3.5x
4.0x
4.5x
Oct
-12
Feb-1
3
Jun-1
3
Oct
-13
Feb-1
4
Jun-1
4
Oct
-14
Feb-1
5
Jun-1
5
Oct
-15
Feb-1
6
Jun-1
6
Oct
-16
Feb-1
7
Jun-1
7
Oct
-17
LTFH Fwd. P/BV (x) SD+1 SD-1 Average
Source: Company, JM Financial
L&T Finance P/E Exhibit 39.
0
5
10
15
20
25
30
35
Oct
-12
Feb-1
3
Jun-1
3
Oct
-13
Feb-1
4
Jun-1
4
Oct
-14
Feb-1
5
Jun-1
5
Oct
-15
Feb-1
6
Jun-1
6
Oct
-16
Feb-1
7
Jun-1
7
Oct
-17
LTFH Fwd. P/E (x) SD+1 SD-1 Average
Source: Company, JM Financial
PNB Housing P/B Exhibit 40.
0.00
1.00
2.00
3.00
4.00
5.00
Nov-
16
Dec
-16
Jan-1
7
Jan-1
7
Feb-1
7
Mar-
17
Mar-
17
Apr-
17
May-
17
May-
17
Jun-1
7
Jul-17
Jul-17
Aug-1
7
Sep-1
7
Oct
-17
Oct
-17
PNB HousingFwd. P/BV (x) SD+1 SD-1 Average
Source: Company, JM Financial
PNB Housing P/E Exhibit 41.
0
5
10
15
20
25
30
35
Nov-
16
Dec
-16
Jan-1
7
Jan-1
7
Feb-1
7
Mar-
17
Mar-
17
Apr-
17
May-
17
May-
17
Jun-1
7
Jul-17
Jul-17
Aug-1
7
Sep-1
7
Oct
-17
Oct
-17
PNB Housing Fwd. P/E (x) SD+1 SD-1 Average
Source: Company, JM Financial
LIC Housing P/B Exhibit 42.
0.00
0.50
1.00
1.50
2.00
2.50
3.00
3.50
Oct
-05
Oct
-06
Oct
-07
Oct
-08
Oct
-09
Oct
-10
Oct
-11
Oct
-12
Oct
-13
Oct
-14
Oct
-15
Oct
-16
Oct
-17
LICHF Fwd. P/BV (x) SD+1 SD-1 Average
Source: Company, JM Financial
LIC Housing P/E Exhibit 43.
0
5
10
15
20
Oct
-05
Oct
-06
Oct
-07
Oct
-08
Oct
-09
Oct
-10
Oct
-11
Oct
-12
Oct
-13
Oct
-14
Oct
-15
Oct
-16
Oct
-17
LICHF Fwd. P/E (x) SD+1 SD-1 Average
Source: Company, JM Financial

NBFC 26 October 2017
JM Financial Institutional Securities Limited Page 15
SCUF P/B Exhibit 44.
0.00
0.50
1.00
1.50
2.00
2.50
3.00
3.50O
ct-0
5
Oct
-06
Oct
-07
Oct
-08
Oct
-09
Oct
-10
Oct
-11
Oct
-12
Oct
-13
Oct
-14
Oct
-15
Oct
-16
Oct
-17
SCUF Fwd. P/BV (x) SD+1 SD-1 Average
Source: Company, JM Financial
SCUF P/E Exhibit 45.
0
5
10
15
20
25
30
Oct
-05
Oct
-06
Oct
-07
Oct
-08
Oct
-09
Oct
-10
Oct
-11
Oct
-12
Oct
-13
Oct
-14
Oct
-15
Oct
-16
Oct
-17
SCUF Fwd. P/E (x) SD+1 SD-1 Average
Source: Company, JM Financial
SHTF P/B Exhibit 46.
0.0x
1.0x
2.0x
3.0x
4.0x
5.0x
Oct
-05
Oct
-06
Oct
-07
Oct
-08
Oct
-09
Oct
-10
Oct
-11
Oct
-12
Oct
-13
Oct
-14
Oct
-15
Oct
-16
Oct
-17
SHTF Fwd. P/BV (x) SD+1 SD-1 Average
Source: Company, JM Financial
SHTF P/E Exhibit 47.
0
5
10
15
20
25
30
Oct
-05
Oct
-06
Oct
-07
Oct
-08
Oct
-09
Oct
-10
Oct
-11
Oct
-12
Oct
-13
Oct
-14
Oct
-15
Oct
-16
Oct
-17
SHTF Fwd. P/E (x) SD+1 SD-1 Average
Source: Company, JM Financial
CIFC P/B Exhibit 48.
0.00
1.00
2.00
3.00
4.00
5.00
Oct
-05
Oct
-06
Oct
-07
Oct
-08
Oct
-09
Oct
-10
Oct
-11
Oct
-12
Oct
-13
Oct
-14
Oct
-15
Oct
-16
Oct
-17
CIFC Fwd. P/BV (x) SD+1 SD-1 Average
Source: Company, JM Financial
CIFC P/E Exhibit 49.
0
10
20
30
40
50
Oct
-05
Oct
-06
Oct
-07
Oct
-08
Oct
-09
Oct
-10
Oct
-11
Oct
-12
Oct
-13
Oct
-14
Oct
-15
Oct
-16
Oct
-17
CIFC Fwd. P/E (x) SD+1 SD-1 Average
Source: Company, JM Financial
REPCO P/B Exhibit 50.
2.0x
2.5x
3.0x
3.5x
4.0x
4.5x
5.0x
Oct
-14
Dec
-14
Feb-1
5
Apr-
15
Jun-1
5
Aug-1
5
Oct
-15
Dec
-15
Feb-1
6
Apr-
16
Jun-1
6
Aug-1
6
Oct
-16
Dec
-16
Feb-1
7
Apr-
17
Jun-1
7
Aug-1
7
Oct
-17
Repco Fwd. P/BV (x) Average SD+1 SD-1
Source: JM Financial, Company
REPCO P/E Exhibit 51.
12x
16x
20x
24x
28x
32x
Oct
-14
Dec
-14
Feb-1
5
Apr-
15
Jun-1
5
Aug-1
5
Oct
-15
Dec
-15
Feb-1
6
Apr-
16
Jun-1
6
Aug-1
6
Oct
-16
Dec
-16
Feb-1
7
Apr-
17
Jun-1
7
Aug-1
7
Oct
-17
Repco Fwd. P/E (x) Average SD+1 SD-1
Source: JM Financial, Company

NBFC 26 October 2017
JM Financial Institutional Securities Limited Page 16
HDFC Ltd.
Income Statement (INR mn)
Y/E March FY16A FY17A FY18E FY19E FY20E
Net Interest Income (NII) 79,784 92,024 1,10,886 1,26,761 1,50,429
Non Interest Income 28,867 23,092 18,489 20,585 22,438
Total Income 1,08,651 1,15,116 1,29,375 1,47,346 1,72,866
Operating Expenses 7,590 8,368 9,180 10,061 11,090
Pre-provisioning Profits 1,01,061 1,06,748 1,20,195 1,37,285 1,61,776
Loan-Loss Provisions 2,555 4,366 3,727 4,313 4,904
Others Provisions 4,425 2,158 0 0 0
Total Provisions 7,150 7,000 4,228 4,914 5,555
PBT 93,911 99,748 1,15,967 1,32,371 1,56,221
Tax 27,672 30,285 34,739 40,102 47,734
PAT (Pre-Extra ordinaries) 66,240 69,464 81,228 92,269 1,08,487
Extra ordinaries (Net of Tax) 4,683 4,960 4,602 4,381 4,381
Reported Profits 70,922 74,424 85,830 96,649 1,12,868
Dividend 31,380 28,681 29,740 33,457 39,033
Retained Profits 39,543 45,742 56,091 63,192 73,835
Source: Company, JM Financial
Key Ratios
Y/E March FY16A FY17A FY18E FY19E FY20E
Growth (YoY) (%)
Borrowed funds 13.9% 17.7% 16.5% 15.8% 15.8%
Advances 13.6% 14.6% 16.0% 17.0% 17.5%
Total Assets 13.7% 16.5% 15.8% 16.5% 17.0%
NII 8.3% 15.3% 20.5% 14.3% 18.7%
Non-interest Income 92.4% -20.0% -19.9% 11.3% 9.0%
Operating Expenses 7.4% 10.3% 9.7% 9.6% 10.2%
Operating Profits 23.8% 5.6% 12.6% 14.2% 17.8%
Core Operating profit 9.6% 14.4% 20.6% 14.6% 18.3%
Provisions 333.3% -2.1% -39.6% 16.2% 13.0%
Reported PAT 18.4% 4.9% 15.3% 12.6% 16.8%
Yields / Margins (%)
Interest Spread 1.67% 1.84% 2.11% 2.03% 1.99%
NIM 2.94% 2.94% 3.05% 2.98% 3.01%
Profitability (%)
ROA 2.44% 2.22% 2.24% 2.19% 2.20%
ROE 20.4% 18.8% 19.2% 19.3% 20.0%
Cost to Income 7.0% 7.3% 7.1% 6.8% 6.4%
Asset quality (%)
Gross NPA 0.71% 0.80% 1.29% 1.18% 1.08%
LLP 0.29% 0.25% 0.13% 0.13% 0.13%
Capital Adequacy (%)
Tier I 13.20% 13.08% 13.05% 12.92% 12.77%
CAR 16.60% 15.79% 15.39% 14.93% 14.49%
Source: Company, JM Financial
Balance Sheet (INR mn)
Y/E March FY16A FY17A FY18E FY19E FY20E
Equity Capital 3,160 3,177 3,177 3,177 3,177
Reserves & Surplus 3,38,051 3,93,277 4,44,765 5,03,577 5,73,031
Stock option outstanding 0 0 0 0 0
Borrowed Funds 23,76,392 27,97,322 32,58,880 37,73,783 43,70,040
Deferred tax liabilities 0 0 0 0 0
Current Liabilities & Provisions 1,69,926 1,69,804 1,87,653 2,56,412 3,62,717
Total Liabilities 28,87,528 33,63,579 38,94,475 45,36,949 53,08,966
Net Advances 25,86,582 29,64,720 34,39,075 40,23,718 47,27,869
Investments 1,53,454 2,04,101 2,29,757 2,50,229 2,73,521
Cash & Bank Balances 54,765 64,617 76,675 91,722 1,10,137
Loans and Advances 58,198 59,294 68,782 80,474 94,557
Other Current Assets 27,883 64,423 73,443 83,725 95,446
Fixed Assets 6,645 6,423 6,745 7,082 7,436
Miscellaneous Expenditure 0 0 0 0 0
Deferred Tax Assets 0 0 0 0 0
Total Assets 28,87,528 33,63,579 38,94,475 45,36,949 53,08,966
Source: Company, JM Financial
Dupont Analysis
Y/E March FY16A FY17A FY18E FY19E FY20E
NII / Assets 2.94% 2.94% 3.06% 3.01% 3.06%
Other Income / Assets 1.06% 0.74% 0.51% 0.49% 0.46%
Total Income / Assets 4.00% 3.68% 3.57% 3.50% 3.51%
Cost / Assets 0.28% 0.27% 0.25% 0.24% 0.23%
PPP / Assets 3.72% 3.42% 3.31% 3.26% 3.29%
Provisions / Assets 0.26% 0.22% 0.12% 0.12% 0.11%
PBT / Assets 3.46% 3.19% 3.20% 3.14% 3.17%
Tax rate 29.5% 30.4% 32.0% 32.0% 32.0%
ROA 2.44% 2.22% 2.24% 2.19% 2.20%
Leverage 8.5 8.5 8.7 9.0 9.2
ROE 20.4% 18.8% 19.2% 19.3% 20.0%
Source: Company, JM Financial
Valuations
Y/E March FY16A FY17A FY18E FY19E FY20E
Shares in Issue 1,579.9 1,595.1 1,588.7 1,588.7 1,588.7
EPS (INR) 41.9 43.5 51.1 58.1 68.3
EPS (YoY) (%) 18.4% 3.9% 17.4% 13.6% 17.6%
P/E (x) 40.5 39.0 33.2 29.3 24.9
BV (INR) 216 249 282 319 363
BV (YoY) (%) 9.8% 15.1% 13.4% 13.1% 13.7%
P/BV (x) 7.87 6.84 6.03 5.33 4.68
DPS (INR) 19.9 18.0 18.7 21.1 24.6
Div. yield (%) 1.2% 1.1% 1.1% 1.2% 1.4%
Source: Company, JM Financial

NBFC 26 October 2017
JM Financial Institutional Securities Limited Page 17
LIC Housing Finance
Income Statement (INR mn)
Y/E March FY15A FY16A FY17A FY18E FY19E
Net Interest Income (NII) 22,658 29,724 36,862 40,289 45,104
Non Interest Income 2,226 2,063 1,627 2,177 2,569
Total Income 24,884 31,787 38,489 42,467 47,673
Operating Expenses 3,792 4,687 6,118 7,495 8,745
Pre-provisioning Profits 21,092 27,100 32,371 34,971 38,928
Loan-Loss Provisions 568 1,851 3,197 2,451 1,927
Others Provisions -465 -398 -572 -50 -50
Total Provisions 73 1,465 2,813 2,401 1,877
PBT 21,019 25,636 29,558 32,571 37,051
Tax 7,158 9,028 10,247 11,074 12,597
PAT (Pre-Extra ordinaries) 13,862 16,608 19,311 21,497 24,453
Extra ordinaries (Net of Tax) 0 0 0 0 0
Reported Profits 13,862 16,608 19,311 21,497 24,453
Dividend 3,028 3,333 3,759 3,869 4,402
Retained Profits 10,834 13,275 15,552 17,627 20,052
Source: Company, JM Financial
Key Ratios
Y/E March FY15A FY16A FY17A FY18E FY19E
Growth (YoY) (%)
Borrowed funds 17.7% 14.9% 13.9% 16.0% 15.2%
Advances 18.6% 15.5% 15.5% 14.1% 15.3%
Total Assets 17.5% 16.0% 15.6% 13.5% 15.2%
NII 18.3% 31.2% 24.0% 9.3% 12.0%
Non-interest Income -8.9% -7.3% -21.1% 33.9% 18.0%
Operating Expenses 21.1% 23.6% 30.5% 22.5% 16.7%
Operating Profits 14.2% 28.5% 19.4% 8.0% 11.3%
Core Operating profit 14.2% 28.5% 19.4% 8.0% 11.3%
Provisions -66.2% 1,920.0% 92.1% -14.7% -21.8%
Reported PAT 5.2% 19.8% 16.3% 11.3% 13.8%
Yields / Margins (%)
Interest Spread 0.94% 1.21% 1.34% 1.29% 1.31%
NIM 2.20% 2.46% 2.64% 2.52% 2.46%
Profitability (%)
ROA 1.33% 1.37% 1.37% 1.33% 1.33%
ROE 18.1% 19.6% 19.1% 18.0% 17.7%
Cost to Income 15.2% 14.7% 15.9% 17.7% 18.3%
Asset quality (%)
Gross NPA 0.46% 0.45% 0.43% 0.52% 0.58%
LLP 0.05% 0.08% 0.18% 0.10% 0.04%
Capital Adequacy (%)
Tier I 11.82% 12.46% 13.35% 13.41% 13.23%
CAR 15.30% 15.50% 15.64% 15.91% 15.81%
Source: Company, JM Financial
Balance Sheet (INR mn)
Y/E March FY15A FY16A FY17A FY18E FY19E
Equity Capital 1,010 1,010 1,010 1,010 1,010
Reserves & Surplus 77,174 90,450 1,09,760 1,27,387 1,47,439
Stock option outstanding 0 0 0 0 0
Borrowed Funds 9,65,319 11,09,312 12,63,371 14,65,510 16,88,267
Deferred tax liabilities 6,690 8,109 9,173 10,549 12,131
Current Liabilities & Provisions 75,258 96,097 1,25,692 1,07,877 1,24,309
Total Liabilities 11,25,451 13,04,978 15,09,006 17,12,333 19,73,156
Net Advances 10,83,607 12,51,732 14,45,340 16,48,695 19,01,251
Investments 21,408 27,748 30,249 4,946 5,704
Cash & Bank Balances 10,294 14,289 20,314 44,515 51,334
Loans and Advances 1,509 1,483 2,225 2,538 2,927
Other Current Assets 7,835 8,807 9,912 10,544 10,679
Fixed Assets 797 920 965 1,095 1,262
Miscellaneous Expenditure 0 0 0 0 0
Deferred Tax Assets 0 0 0 0 0
Total Assets 11,25,451 13,04,978 15,09,006 17,12,333 19,73,156
Source: Company, JM Financial
Dupont Analysis
Y/E March FY15A FY16A FY17A FY18E FY19E
NII / Assets 2.18% 2.45% 2.62% 2.50% 2.45%
Other Income / Assets 0.21% 0.17% 0.12% 0.14% 0.14%
Total Income / Assets 2.39% 2.62% 2.74% 2.64% 2.59%
Cost / Assets 0.36% 0.39% 0.43% 0.47% 0.47%
PPP / Assets 2.02% 2.23% 2.30% 2.17% 2.11%
Provisions / Assets 0.01% 0.12% 0.20% 0.15% 0.10%
PBT / Assets 2.02% 2.11% 2.10% 2.02% 2.01%
Tax rate 34.1% 35.2% 34.7% 34.0% 34.0%
ROA 1.33% 1.37% 1.37% 1.33% 1.33%
Leverage 14.4 14.3 13.6 13.3 13.3
ROE 18.1% 19.6% 19.1% 18.0% 17.7%
Source: Company, JM Financial
Valuations
Y/E March FY15A FY16A FY17A FY18E FY19E
Shares in Issue 505.0 505.0 505.0 505.0 505.0
EPS (INR) 27.5 32.9 38.2 42.6 48.4
EPS (YoY) (%) 5.2% 19.8% 16.3% 11.3% 13.8%
P/E (x) 22.4 18.7 16.1 14.4 12.7
BV (INR) 155 181 219 254 294
BV (YoY) (%) 3.8% 17.0% 21.1% 15.9% 15.6%
P/BV (x) 3.97 3.39 2.80 2.41 2.09
DPS (INR) 6.0 6.6 7.4 7.7 8.7
Div. yield (%) 1.0% 1.1% 1.2% 1.2% 1.4%
Source: Company, JM Financial

NBFC 26 October 2017
JM Financial Institutional Securities Limited Page 18
REPCO Home Finance
Income Statement (INR mn)
Y/E March FY16A FY17A FY18E FY19E FY20E
Net Interest Income (NII) 3,043 3,682 4,079 4,626 5,310
Non Interest Income 293 314 359 419 499
Total Income 3,336 3,996 4,438 5,045 5,809
Operating Expenses 643 676 754 862 977
Pre-provisioning Profits 2,693 3,320 3,684 4,183 4,832
Loan-Loss Provisions 388 513 588 444 473
Others Provisions 3 5 0 0 0
Total Provisions 392 518 588 444 473
PBT 2,301 2,802 3,096 3,739 4,359
Tax 800 979 1,053 1,271 1,482
PAT (Pre-Extra ordinaries) 1,501 1,823 2,043 2,467 2,877
Extra ordinaries (Net of Tax) 0 0 0 0 0
Reported Profits 1,501 1,823 2,043 2,467 2,877
Dividend 135 151 184 234 288
Retained Profits 1,365 1,672 1,859 2,233 2,589
Source: Company, JM Financial
Key Ratios
Y/E March FY16A FY17A FY18E FY19E FY20E
Growth (YoY) (%)
Borrowed funds 28.1% 15.6% 14.6% 16.0% 17.8%
Advances 27.9% 16.3% 14.5% 16.2% 17.6%
Total Assets 27.8% 16.5% 14.6% 16.2% 17.5%
NII 28.0% 21.0% 10.8% 13.4% 14.8%
Non-interest Income 24.7% 7.0% 14.3% 17.0% 18.9%
Operating Expenses 17.5% 5.1% 11.6% 14.3% 13.3%
Operating Profits 30.4% 23.3% 10.9% 13.6% 15.5%
Core Operating profit 30.4% 23.3% 10.9% 13.6% 15.5%
Provisions 92.7% 32.3% 13.4% -24.4% 6.4%
Reported PAT 22.0% 21.4% 12.1% 20.8% 16.6%
Yields / Margins (%)
Interest Spread 2.95% 2.96% 2.81% 2.75% 2.69%
NIM 4.41% 4.40% 4.23% 4.15% 4.08%
Profitability (%)
ROA 2.17% 2.17% 2.11% 2.20% 2.20%
ROE 17.0% 17.4% 16.6% 17.2% 17.2%
Cost to Income 2.2% 2.2% 2.1% 2.2% 2.2%
Asset quality (%)
Gross NPA 1.30% 2.57% 2.56% 2.23% 2.12%
LLP 0.57% 0.62% 0.61% 0.40% 0.36%
Capital Adequacy (%)
Tier I 20.77% 21.25% 20.90% 20.35% 19.60%
CAR 20.77% 21.25% 20.90% 20.35% 19.60%
Source: Company, JM Financial
Balance Sheet (INR mn)
Y/E March FY16A FY17A FY18E FY19E FY20E
Equity Capital 625 626 626 626 626
Reserves & Surplus 8,923 10,747 12,606 14,839 17,428
Stock option outstanding 0 0 0 0 0
Borrowed Funds 65,379 75,604 86,643 1,00,505 1,18,395
Deferred tax liabilities 0 0 0 0 0
Preference Shares 0 0 0 0 0
Current Liabilities & Provisions 2,705 3,457 3,730 4,456 5,096
Total Liabilities 77,632 90,433 1,03,604 1,20,426 1,41,545
Net Advances 77,049 89,578 1,02,586 1,19,175 1,40,114
Investments 124 156 179 208 244
Cash & Bank Balances 200 225 308 358 420
Loans and Advances 0 0 0 0 0
Other Current Assets 166 384 427 564 624
Fixed Assets 93 91 104 121 143
Miscellaneous Expenditure 0 0 0 0 0
Deferred Tax Assets 0 0 0 0 0
Total Assets 77,632 90,433 1,03,604 1,20,426 1,41,545
Source: Company, JM Financial
Dupont Analysis
Y/E March FY16A FY17A FY18E FY19E FY20E
NII / Assets 4.40% 4.38% 4.20% 4.13% 4.05%
Other Income / Assets 0.42% 0.37% 0.37% 0.37% 0.38%
Total Income / Assets 4.82% 4.76% 4.57% 4.50% 4.43%
Cost / Assets 0.93% 0.80% 0.78% 0.77% 0.75%
PPP / Assets 3.89% 3.95% 3.80% 3.73% 3.69%
Provisions / Assets 0.57% 0.62% 0.61% 0.40% 0.36%
PBT / Assets 3.33% 3.33% 3.19% 3.34% 3.33%
Tax rate 34.8% 34.9% 34.0% 34.0% 34.0%
ROA 2.17% 2.17% 2.11% 2.20% 2.20%
Leverage 8.1 8.0 7.8 7.8 7.8
ROE 17.0% 17.4% 16.6% 17.2% 17.2%
Source: Company, JM Financial
Valuations
Y/E March FY16A FY17A FY18E FY19E FY20E
Shares in Issue 62.5 62.6 62.6 62.6 62.6
EPS (INR) 24.0 29.1 32.7 39.4 46.0
EPS (YoY) (%) 21.6% 21.4% 12.1% 20.8% 16.6%
P/E (x) 25.0 20.6 18.4 15.2 13.0
BV (INR) 153 182 211 247 289
BV (YoY) (%) 17.2% 19.1% 16.3% 16.9% 16.7%
P/BV (x) 3.93 3.30 2.84 2.43 2.08
DPS (INR) 2.2 2.4 2.9 3.7 4.6
Div. yield (%) 0.4% 0.4% 0.5% 0.6% 0.8%
Source: Company, JM Financial

NBFC 26 October 2017
JM Financial Institutional Securities Limited Page 19
Bajaj Finance
Income Statement (INR mn)
Y/E March FY16A FY17A FY18E FY19E FY20E
Net Interest Income (NII) 38,423 52,435 74,634 98,470 1,27,755
Non Interest Income 5,826 9,440 8,796 10,956 13,549
Total Income 44,249 61,875 83,430 1,09,426 1,41,304
Operating Expenses 19,492 25,642 34,838 44,868 56,519
Pre-provisioning Profits 24,757 36,233 48,592 64,559 84,785
Loan-Loss Provisions 1,635 3,908 8,884 11,741 15,622
Others Provisions 3,476 3,908 0 0 0
Total Provisions 5,111 8,058 8,884 11,741 15,622
PBT 19,646 28,175 39,708 52,818 69,163
Tax 6,861 9,810 13,818 18,381 24,069
PAT (Pre-Extra ordinaries) 12,785 18,366 25,890 34,437 45,094
Extra ordinaries (Net of Tax) 0 0 0 0 0
Reported Profits 12,785 18,366 25,890 34,437 45,094
Dividend 1,693 2,383 5,178 6,887 9,019
Retained Profits 11,093 15,983 20,712 27,550 36,075
Source: Company, JM Financial
Key Ratios
Y/E March FY16A FY17A FY18E FY19E FY20E
Growth (YoY) (%)
Borrowed funds 38.7% 33.0% 29.5% 36.0% 32.3%
Advances 37.0% 32.9% 35.9% 32.5% 30.3%
Total Assets 41.6% 37.2% 30.0% 32.2% 29.9%
NII 36.6% 36.5% 42.3% 31.9% 29.7%
Non-interest Income 67.0% 62.0% -6.8% 24.6% 23.7%
Operating Expenses 36.5% 31.6% 35.9% 28.8% 26.0%
Operating Profits 42.8% 46.4% 34.1% 32.9% 31.3%
Core Operating profit 41.9% 44.3% 38.1% 33.4% 32.0%
Provisions 35.7% 57.7% 10.3% 32.2% 33.1%
Reported PAT 42.4% 43.6% 41.0% 33.0% 30.9%
Yields / Margins (%)
Interest Spread 8.20% 8.01% 8.75% 8.90% 8.92%
NIM 9.87% 9.76% 10.48% 10.51% 10.39%
Profitability (%)
ROA 3.23% 3.33% 3.53% 3.58% 3.58%
ROE 20.9% 21.6% 20.1% 19.6% 21.8%
Cost to Income 44.1% 41.4% 41.8% 41.0% 40.0%
Asset quality (%)
Gross NPA 1.25% 1.71% 1.99% 2.12% 2.21%
LLP 1.17% 1.37% 1.33% 1.31% 1.33%
Capital Adequacy (%)
Tier I 16.06% 14.56% 18.91% 16.75% 15.36%
CAR 19.50% 20.30% 24.21% 21.56% 19.80%
Source: Company, JM Financial
Balance Sheet (INR mn)
Y/E March FY16A FY17A FY18E FY19E FY20E
Equity Capital 536 1,094 1,147 1,147 1,147
Reserves & Surplus 73,731 94,909 1,60,568 1,88,118 2,24,193
Stock option outstanding 0 0 0 0 0
Borrowed Funds 3,70,247 4,92,497 6,37,783 8,67,385 11,47,550
Deferred tax liabilities 0 0 0 0 0
Preference Shares 0 0 0 0 0
Current Liabilities & Provisions 20,052 48,746 28,997 38,324 49,794
Total Liabilities 4,64,565 6,37,246 8,28,495 10,94,974 14,22,684
Net Advances 4,27,560 5,68,320 7,72,398 10,23,137 13,32,741
Investments 10,341 40,747 18,538 24,555 31,986
Cash & Bank Balances 13,459 3,799 6,952 9,208 11,995
Loans and Advances 5,420 5,333 8,496 11,255 14,660
Other Current Assets 2,116 11,745 13,032 15,914 18,557
Fixed Assets 2,870 3,611 4,695 5,658 6,640
Miscellaneous Expenditure 0 0 0 0 0
Deferred Tax Assets 2,800 3,691 4,384 5,247 6,106
Total Assets 4,64,565 6,37,246 8,28,495 10,94,974 14,22,684
Source: Company, JM Financial
Dupont Analysis
Y/E March FY16A FY17A FY18E FY19E FY20E
NII / Assets 9.69% 9.52% 10.18% 10.24% 10.15%
Other Income / Assets 1.47% 1.71% 1.20% 1.14% 1.08%
Total Income / Assets 11.16% 11.23% 11.38% 11.38% 11.23%
Cost / Assets 1.59% 1.69% 1.95% 1.93% 1.87%
PPP / Assets 6.25% 6.58% 6.63% 6.71% 6.74%
Provisions / Assets 1.29% 1.46% 1.21% 1.22% 1.24%
PBT / Assets 4.96% 5.11% 5.42% 5.49% 5.49%
Tax rate 34.9% 34.8% 34.8% 34.8% 34.8%
ROA 3.23% 3.33% 3.53% 3.58% 3.58%
Leverage 6.3 6.6 5.1 5.8 6.3
ROE 20.9% 21.6% 20.1% 19.6% 21.8%
Source: Company, JM Financial
Valuations
Y/E March FY16A FY17A FY18E FY19E FY20E
Shares in Issue 535.5 546.9 573.5 573.5 573.5
EPS (INR) 23.9 33.6 45.1 60.1 78.6
EPS (YoY) (%) 33.0% 40.7% 34.4% 33.0% 30.9%
P/E (x) 76.2 54.2 40.3 30.3 23.1
BV (INR) 139 176 282 330 393
BV (YoY) (%) 44.5% 26.6% 60.6% 17.0% 19.1%
P/BV (x) 13.12 10.36 6.45 5.51 4.63
DPS (INR) 3.2 4.4 9.0 12.0 15.7
Div. yield (%) 0.2% 0.2% 0.5% 0.7% 0.9%
Source: Company, JM Financial

NBFC 26 October 2017
JM Financial Institutional Securities Limited Page 20
Cholamandalam Investment and Finance Co. Ltd.
Income Statement (INR mn)
Y/E March FY15A FY16A FY17E FY18E FY19E
Net Interest Income (NII) 17,039 21,267 24,033 28,455 33,378
Non Interest Income 269 163 262 379 413
Total Income 17,308 21,429 24,295 28,834 33,791
Operating Expenses 7,489 8,449 10,133 12,454 14,599
Pre-provisioning Profits 9,819 12,980 14,162 16,380 19,192
Loan-Loss Provisions 2,174 3,492 2,515 3,392 3,703
Others Provisions 1,073 780 641 0 0
Total Provisions 3,247 4,272 3,106 3,392 3,703
PBT 6,572 8,708 11,056 12,989 15,489
Tax 2,221 3,023 3,868 4,416 5,266
PAT (Pre-Extra ordinaries) 4,352 5,685 7,187 8,572 10,223
Extra ordinaries (Net of Tax) 0 0 0 0 0
Reported Profits 4,352 5,685 7,187 8,572 10,223
Dividend 589 850 658 1,286 1,533
Retained Profits 3,763 4,835 6,529 7,287 8,689
Source: Company, JM Financial
Key Ratios
Y/E March FY15A FY16A FY17E FY18E FY19E
Growth (YoY) (%)
Borrowed funds 7.6% 15.9% 7.2% 22.0% 18.6%
Advances 14.2% 16.8% 9.7% 18.7% 18.2%
Total Assets 10.8% 16.8% 10.2% 17.2% 18.4%
NII 16.7% 24.8% 13.0% 18.4% 17.3%
Non-interest Income -13.8% -39.5% 61.2% 44.4% 8.9%
Operating Expenses 13.8% 12.8% 19.9% 22.9% 17.2%
Operating Profits 17.8% 32.2% 9.1% 15.7% 17.2%
Core Operating profit 18.9% 34.4% 8.7% 15.1% 17.3%
Provisions 14.6% 31.6% -27.3% 9.2% 9.2%
Reported PAT 19.5% 30.6% 26.4% 19.3% 19.3%
Yields / Margins (%)
Interest Spread 6.18% 6.90% 6.93% 7.39% 7.46%
NIM 7.73% 8.48% 8.54% 8.89% 8.81%
Profitability (%)
ROA 1.92% 2.20% 2.45% 2.57% 2.60%
ROE 17.5% 18.0% 18.0% 18.3% 18.7%
Cost to Income 43.3% 39.4% 41.7% 43.2% 43.2%
Asset quality (%)
Gross NPA 3.57% 3.88% 5.34% 4.71% 4.17%
LLP 0.61% 2.17% 1.31% 1.09% 1.01%
Capital Adequacy (%)
Tier I 13.02% 13.26% 13.61% 13.91% 13.89%
CAR 21.24% 19.68% 18.64% 18.70% 18.34%
Source: Company, JM Financial
Balance Sheet (INR mn)
Y/E March FY15A FY16A FY17E FY18E FY19E
Equity Capital 1,437 1,562 1,563 1,563 1,563
Reserves & Surplus 25,289 35,012 41,563 48,850 57,539
Stock option outstanding 0 0 0 0 0
Borrowed Funds 1,94,752 2,25,762 2,42,067 2,95,322 3,50,252
Deferred tax liabilities 0 0 0 0 0
Preference Shares 0 0 0 0 0
Current Liabilities & Provisions 12,253 16,547 22,018 14,406 17,056
Total Liabilities 2,33,732 2,78,883 3,07,211 3,60,141 4,26,411
Net Advances 2,21,835 2,59,101 2,84,152 3,37,230 3,98,700
Investments 675 666 2,385 2,361 2,990
Cash & Bank Balances 8,610 9,003 4,870 5,396 6,977
Loans and Advances 823 1,045 1,683 2,023 2,312
Other Current Assets 4,270 5,140 9,568 8,779 10,703
Fixed Assets 683 1,113 1,401 1,438 1,702
Miscellaneous Expenditure 0 0 0 0 0
Deferred Tax Assets 1,836 2,815 3,152 2,915 3,025
Total Assets 2,38,732 2,78,883 3,07,211 3,60,141 4,26,411
Source: Company, JM Financial
Dupont Analysis
Y/E March FY15A FY16A FY17E FY18E FY19E
NII / Assets 7.50% 8.22% 8.20% 8.53% 8.49%
Other Income / Assets 0.12% 0.06% 0.09% 0.11% 0.10%
Total Income / Assets 7.62% 8.28% 8.29% 8.64% 8.59%
Cost / Assets 0.98% 0.98% 1.37% 1.49% 1.52%
PPP / Assets 4.32% 5.02% 4.83% 4.91% 4.88%
Provisions / Assets 1.43% 1.65% 1.06% 1.02% 0.94%
PBT / Assets 2.89% 3.36% 3.77% 3.89% 3.94%
Tax rate 33.8% 34.7% 35.0% 34.0% 34.0%
ROA 1.92% 2.20% 2.45% 2.57% 2.60%
Leverage 8.9 7.6 7.1 7.1 7.2
ROE 17.5% 18.0% 18.0% 18.3% 18.7%
Source: Company, JM Financial
Valuations
Y/E March FY15A FY16A FY17E FY18E FY19E
Shares in Issue 143.7 156.2 156.3 156.3 156.3
EPS (INR) 30.3 36.4 46.0 54.8 65.4
EPS (YoY) (%) 19.1% 20.2% 26.3% 19.3% 19.3%
P/E (x) 37.1 30.9 24.4 20.5 17.2
BV (INR) 186 234 276 322 378
BV (YoY) (%) 16.1% 25.9% 17.8% 16.9% 17.2%
P/BV (x) 6.04 4.80 4.07 3.49 2.97
DPS (INR) 4.1 5.4 4.2 8.2 9.8
Div. yield (%) 0.4% 0.5% 0.4% 0.7% 0.9%
Source: Company, JM Financial

NBFC 26 October 2017
JM Financial Institutional Securities Limited Page 21
MMFS
Profit & Loss (INR mn)
Y/E March FY16A FY17A FY18E FY19E FY20E
Net Interest Income 32,246 33,299 41,492 50,261 59,353
Profit on Investments 11 10 750 130 150
Exchange Income 0 0 0 0 0
Fee & Other Income 402 492 565 650 748
Non-Interest Income 412 502 1,315 780 898
Total Income 32,658 33,801 42,808 51,041 60,250
Operating Expenses 11,781 14,509 17,064 19,557 22,375
Pre-provisioning Profits 20,877 19,292 25,744 31,484 37,875
Loan-Loss Provisions 10,495 13,091 11,588 11,639 13,244
Provisions on Investments 0 0 0 0 0
Others Provisions 0 0 0 0 0
Total Provisions 10,495 13,091 11,588 11,639 13,244
PBT 10,382 6,201 14,156 19,844 24,631
Tax 3,656 2,198 4,955 6,946 8,498
PAT (Pre-Extraordinaries) 6,726 4,002 9,201 12,899 16,134
Extra ordinaries (Net of Tax) 0 0 0 0 0
Reported Profits 6,726 4,002 9,201 12,899 16,134
Dividend paid 2,713 1,610 2,760 3,870 4,840
Retained Profits 4,013 2,392 6,441 9,029 11,293
Source: Company, JM Financial
Key Ratios
Y/E March FY16A FY17A FY18E FY19E FY20E
Growth (YoY) (%)
Deposits 0.0% 0.0% 0.0% 0.0% 0.0%
Advances 11.3% 16.0% 15.1% 16.4% 17.1%
Total Assets 12.8% 16.2% 16.0% 16.4% 17.1%
NII 5.8% 3.3% 24.6% 21.1% 18.1%
Non-interest Income 2.5% 21.7% 162.0% -40.7% 15.1%
Operating Expenses 17.0% 23.2% 17.6% 14.6% 14.4%
Operating Profits 0.3% -7.6% 33.4% 22.3% 20.3%
Core Operating profit -13.3% -39.9% 125.4% 40.2% 22.3%
Provisions 26.8% 24.7% -11.5% 0.4% 13.8%
Reported PAT -19.1% -40.5% 129.9% 40.2% 25.1%
Yields / Margins (%)
Interest Spread 6.54% 5.86% 6.38% 6.67% 6.86%
NIM 8.80% 7.95% 8.54% 8.90% 9.00%
Profitability (%)
Non-IR to Income 1.3% 1.5% 3.1% 1.5% 1.5%
Cost to Income 36.1% 42.9% 39.9% 38.3% 37.1%
ROA 1.80% 0.94% 1.85% 2.24% 2.40%
ROE 11.5% 6.4% 11.6% 13.2% 14.9%
Assets Quality (%)
Slippages 0.00% 0.00% 0.00% 0.00% 0.00%
Gross NPA 8.34% 9.27% 9.36% 8.80% 8.22%
Net NPAs 3.37% 3.76% 4.81% 4.61% 4.29%
Provision Coverage 61.7% 61.8% 51.0% 50.0% 50.0%
Specific LLP 0.00% 0.00% 0.00% 0.00% 0.00%
Net NPAs / Networth 20.4% 24.8% 25.2% 25.6% 25.1%
Capital Adequacy (%)
Tier I 14.59% 12.80% 17.14% 16.19% 15.38%
CAR 17.29% 15.20% 19.67% 18.68% 17.83%
Source: Company, JM Financial
Balance Sheet (INR mn)
Y/E March FY16A FY17A FY18E FY19E FY20E
Equity Capital 1,129 1,130 1,236 1,236 1,236
Reserves & Surplus 59,508 63,396 92,214 1,01,243 1,12,537
Deposits 0 0 0 0 0
Borrowings 2,94,523 3,46,704 3,83,455 4,52,476 5,35,958
Other Liabilities 40,391 48,376 56,098 65,274 76,417
Total Liabilities 3,95,795 4,59,852 5,33,253 6,20,486 7,26,409
Investments 14,833 18,895 24,967 29,335 34,024
Net Advances 3,66,578 4,25,234 4,89,552 5,69,613 6,67,130
Cash & Equivalents 6,221 5,781 7,343 8,544 10,007
Fixed Assets 1,135 1,120 1,299 1,511 1,769
Other Assets 0 0 0 0 0
Total Assets 3,95,795 4,59,852 5,33,253 6,20,486 7,26,409
Source: Company, JM Financial
Dupont Analysis
Y/E March FY16A FY17A FY18E FY19E FY20E
NII / Assets 8.64% 7.78% 8.36% 8.71% 8.81%
Other Income / Assets 0.11% 0.12% 0.26% 0.14% 0.13%
Total Income / Assets 8.75% 7.90% 8.62% 8.85% 8.95%
Cost / Assets 3.16% 3.39% 3.44% 3.39% 3.32%
PBP / Assets 5.59% 4.51% 5.18% 5.46% 5.62%
Provisions / Assets 2.81% 3.06% 2.33% 2.02% 1.97%
PBT / Assets 2.78% 1.45% 2.85% 3.44% 3.66%
Tax rate 35.2% 35.5% 35.0% 35.0% 34.5%
ROA 1.80% 0.94% 1.85% 2.24% 2.40%
RoRWAs 1.79% 0.90% 1.80% 2.24% 2.40%
Leverage 6.5 7.1 5.7 6.1 6.4
ROE 11.5% 6.4% 11.6% 13.2% 14.9%
Source: Company, JM Financial
Valuations
Y/E March FY16A FY17A FY18E FY19E FY20E
Shares in Issue 564.6 565.0 617.9 617.9 617.9
EPS (INR) 11.9 7.1 14.9 20.9 26.1
EPS (YoY) (%) -19.2% -40.5% 110.2% 40.2% 25.1%
PER (x) 35.3 59.4 28.3 20.2 16.1
BV (INR) 107 114 151 166 184
BV (YoY) (%) 7.2% 6.3% 32.4% 9.7% 11.0%
ABV (INR) 156 156 128 166 184
ABV (YoY) (%) 8.7% 0.0% -18.2% 29.8% 11.0%
P/BV (x) 3.92 3.69 2.78 2.54 2.29
P/ABV (x) 2.70 2.70 3.29 2.54 2.29
DPS (INR) 4.8 2.8 4.5 6.3 7.8
Div. yield (%) 1.1% 0.7% 1.1% 1.5% 1.9%
Source: Company, JM Financial

NBFC 26 October 2017
JM Financial Institutional Securities Limited Page 22
PNB Housing Finance
Income Statement (INR mn)
Y/E March FY16A FY17A FY18E FY19E FY20E
Net Interest Income (NII) 6,858 9,964 14,918 19,285 24,756
Non Interest Income 1,525 2,678 3,868 4,914 6,023
Total Income 8,384 12,642 18,787 24,199 30,779
Operating Expenses 2,521 3,573 4,601 5,737 7,028
Pre-provisioning Profits 5,863 9,069 14,185 18,462 23,751
Loan-Loss Provisions 514 686 1,380 1,601 1,941
Others Provisions 73 193 26 41 72
Total Provisions 832 1,029 1,706 2,042 2,413
PBT 5,031 8,040 12,479 16,420 21,338
Tax 1,766 2,803 4,243 5,583 7,255
PAT (Pre-Extra ordinaries) 3,265 5,237 8,236 10,837 14,083
Extra ordinaries (Net of Tax) 0 0 0 0 0
Reported Profits 3,265 5,237 8,236 10,837 14,083
Dividend 432 1,196 1,235 1,626 2,113
Retained Profits 2,833 4,041 7,001 9,211 11,971
Source: Company, JM Financial
Key Ratios
Y/E March FY16A FY17A FY18E FY19E FY20E
Growth (YoY) (%)
Borrowed funds 55.3% 36.5% 47.0% 40.2% 35.4%
Advances 61.6% 41.8% 45.1% 39.1% 35.1%
Total Assets 55.9% 44.8% 40.7% 37.5% 33.7%
NII 67.4% 45.3% 49.7% 29.3% 28.4%
Non-interest Income 44.0% 75.6% 44.4% 27.0% 22.6%
Operating Expenses 37.8% 41.7% 28.8% 24.7% 22.5%
Operating Profits 76.3% 54.7% 56.4% 30.1% 28.7%
Core Operating profit 89.3% 54.5% 52.4% 30.6% 29.7%
Provisions 118.4% 23.7% 65.7% 19.7% 18.2%
Reported PAT 68.2% 60.4% 57.3% 31.6% 30.0%
Yields / Margins (%)
Interest Spread 1.89% 1.58% 1.79% 1.78% 1.74%
NIM 2.85% 2.79% 2.93% 2.72% 2.57%
Profitability (%)
ROA 1.34% 1.44% 1.59% 1.51% 1.45%
ROE 17.5% 13.6% 13.9% 16.1% 18.1%
Cost to Income 30.1% 28.3% 24.5% 23.7% 22.8%
Asset quality (%)
Gross NPA 0.22% 0.22% 0.24% 0.31% 0.34%
LLP 0.23% 0.21% 0.29% 0.24% 0.21%
Capital Adequacy (%)
Tier I 9.02% 16.48% 13.54% 11.60% 10.37%
CAR 12.68% 21.62% 18.24% 15.78% 14.07%
Source: Company, JM Financial
Balance Sheet (INR mn)
Y/E March FY16A FY17A FY18E FY19E FY20E
Equity Capital 1,269 1,656 1,656 1,656 1,656
Reserves & Surplus 20,175 54,117 61,118 70,329 82,300
Stock option outstanding 0 0 0 0 0
Borrowed Funds 2,60,137 3,54,971 5,21,808 7,31,575 9,90,552
Deferred tax liabilities 0 0 0 0 0
Preference Shares 0 0 0 0 0
Current Liabilities & Provisions 15,144 18,851 19,950 27,422 36,669
Total Liabilities 2,96,725 4,29,596 6,04,532 8,30,983 11,11,177
Net Advances 2,71,773 3,85,310 5,58,950 7,77,761 10,50,882
Investments 16,223 32,796 32,978 38,110 42,035
Cash & Bank Balances 2,485 1,515 2,236 3,111 4,204
Loans and Advances 2,076 3,187 2,515 3,111 3,678
Other Current Assets 3,547 6,184 7,003 7,721 8,816
Fixed Assets 622 604 850 1,169 1,563
Miscellaneous Expenditure 0 0 0 0 0
Deferred Tax Assets 0 0 0 0 0
Total Assets 2,96,725 4,29,596 6,04,532 8,30,983 11,11,177
Source: Company, JM Financial
Dupont Analysis
Y/E March FY16A FY17A FY18E FY19E FY20E
NII / Assets 2.82% 2.74% 2.89% 2.69% 2.55%
Other Income / Assets 0.63% 0.74% 0.75% 0.68% 0.62%
Total Income / Assets 3.44% 3.48% 3.63% 3.37% 3.17%
Cost / Assets 1.04% 0.98% 0.89% 0.80% 0.72%
PPP / Assets 2.41% 2.50% 2.74% 2.57% 2.45%
Provisions / Assets 0.34% 0.28% 0.33% 0.28% 0.25%
PBT / Assets 2.07% 2.21% 2.41% 2.29% 2.20%
Tax rate 35.1% 34.9% 34.0% 34.0% 34.0%
ROA 1.34% 1.44% 1.59% 1.51% 1.45%
Leverage 13.8 7.7 9.6 11.5 13.2
ROE 17.5% 13.6% 13.9% 16.1% 18.1%
Source: Company, JM Financial
Valuations
Y/E March FY16A FY17A FY18E FY19E FY20E
Shares in Issue 126.9 165.6 165.6 165.6 165.6
EPS (INR) 25.7 31.6 49.7 65.4 85.0
EPS (YoY) (%) 68.2% 22.9% 57.3% 31.6% 30.0%
P/E (x) 55.1 44.8 28.5 21.7 16.7
BV (INR) 169 337 379 435 507
BV (YoY) (%) 35.8% 99.3% 12.6% 14.7% 16.6%
P/BV (x) 8.39 4.21 3.74 3.26 2.80
DPS (INR) 3.4 7.2 7.5 9.8 12.8
Div. yield (%) 0.2% 0.5% 0.5% 0.7% 0.9%
Source: Company, JM Financial
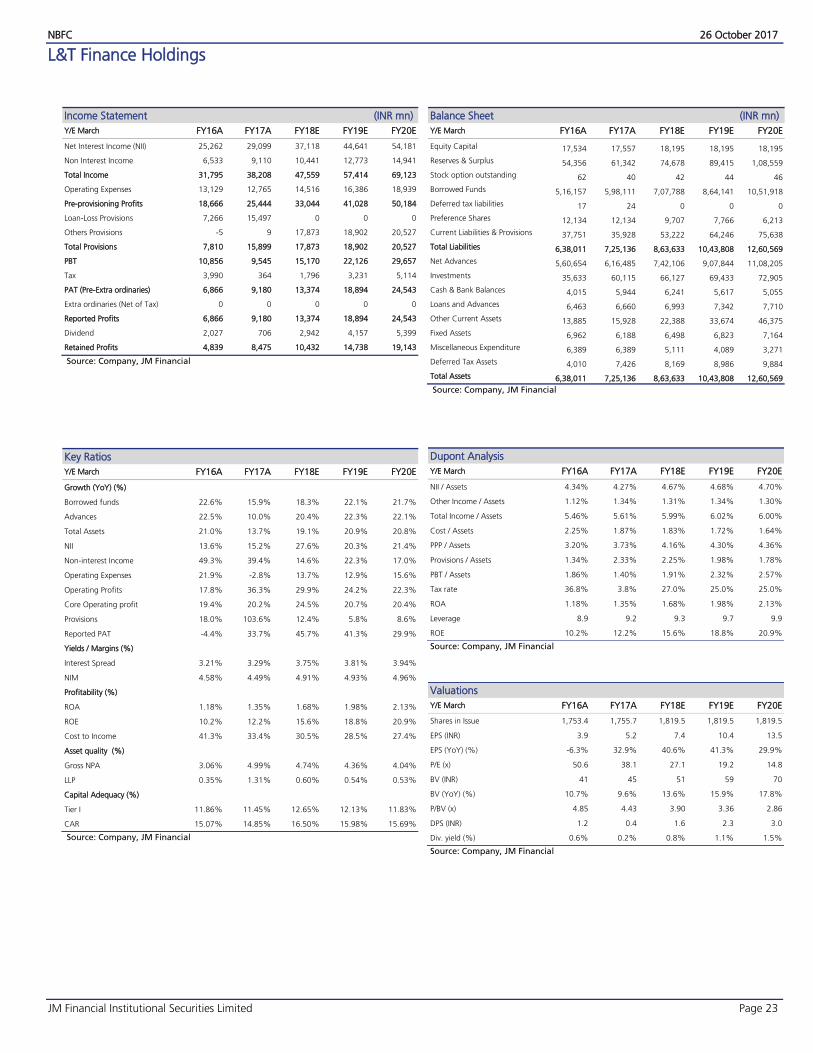
NBFC 26 October 2017
JM Financial Institutional Securities Limited Page 23
L&T Finance Holdings
Income Statement (INR mn)
Y/E March FY16A FY17A FY18E FY19E FY20E
Net Interest Income (NII) 25,262 29,099 37,118 44,641 54,181
Non Interest Income 6,533 9,110 10,441 12,773 14,941
Total Income 31,795 38,208 47,559 57,414 69,123
Operating Expenses 13,129 12,765 14,516 16,386 18,939
Pre-provisioning Profits 18,666 25,444 33,044 41,028 50,184
Loan-Loss Provisions 7,266 15,497 0 0 0
Others Provisions -5 9 17,873 18,902 20,527
Total Provisions 7,810 15,899 17,873 18,902 20,527
PBT 10,856 9,545 15,170 22,126 29,657
Tax 3,990 364 1,796 3,231 5,114
PAT (Pre-Extra ordinaries) 6,866 9,180 13,374 18,894 24,543
Extra ordinaries (Net of Tax) 0 0 0 0 0
Reported Profits 6,866 9,180 13,374 18,894 24,543
Dividend 2,027 706 2,942 4,157 5,399
Retained Profits 4,839 8,475 10,432 14,738 19,143
Source: Company, JM Financial
Key Ratios
Y/E March FY16A FY17A FY18E FY19E FY20E
Growth (YoY) (%)
Borrowed funds 22.6% 15.9% 18.3% 22.1% 21.7%
Advances 22.5% 10.0% 20.4% 22.3% 22.1%
Total Assets 21.0% 13.7% 19.1% 20.9% 20.8%
NII 13.6% 15.2% 27.6% 20.3% 21.4%
Non-interest Income 49.3% 39.4% 14.6% 22.3% 17.0%
Operating Expenses 21.9% -2.8% 13.7% 12.9% 15.6%
Operating Profits 17.8% 36.3% 29.9% 24.2% 22.3%
Core Operating profit 19.4% 20.2% 24.5% 20.7% 20.4%
Provisions 18.0% 103.6% 12.4% 5.8% 8.6%
Reported PAT -4.4% 33.7% 45.7% 41.3% 29.9%
Yields / Margins (%)
Interest Spread 3.21% 3.29% 3.75% 3.81% 3.94%
NIM 4.58% 4.49% 4.91% 4.93% 4.96%
Profitability (%)
ROA 1.18% 1.35% 1.68% 1.98% 2.13%
ROE 10.2% 12.2% 15.6% 18.8% 20.9%
Cost to Income 41.3% 33.4% 30.5% 28.5% 27.4%
Asset quality (%)
Gross NPA 3.06% 4.99% 4.74% 4.36% 4.04%
LLP 0.35% 1.31% 0.60% 0.54% 0.53%
Capital Adequacy (%)
Tier I 11.86% 11.45% 12.65% 12.13% 11.83%
CAR 15.07% 14.85% 16.50% 15.98% 15.69%
Source: Company, JM Financial
Balance Sheet (INR mn)
Y/E March FY16A FY17A FY18E FY19E FY20E
Equity Capital 17,534 17,557 18,195 18,195 18,195
Reserves & Surplus 54,356 61,342 74,678 89,415 1,08,559
Stock option outstanding 62 40 42 44 46
Borrowed Funds 5,16,157 5,98,111 7,07,788 8,64,141 10,51,918
Deferred tax liabilities 17 24 0 0 0
Preference Shares 12,134 12,134 9,707 7,766 6,213
Current Liabilities & Provisions 37,751 35,928 53,222 64,246 75,638
Total Liabilities 6,38,011 7,25,136 8,63,633 10,43,808 12,60,569
Net Advances 5,60,654 6,16,485 7,42,106 9,07,844 11,08,205
Investments 35,633 60,115 66,127 69,433 72,905
Cash & Bank Balances 4,015 5,944 6,241 5,617 5,055
Loans and Advances 6,463 6,660 6,993 7,342 7,710
Other Current Assets 13,885 15,928 22,388 33,674 46,375
Fixed Assets 6,962 6,188 6,498 6,823 7,164
Miscellaneous Expenditure 6,389 6,389 5,111 4,089 3,271
Deferred Tax Assets 4,010 7,426 8,169 8,986 9,884
Total Assets 6,38,011 7,25,136 8,63,633 10,43,808 12,60,569
Source: Company, JM Financial
Dupont Analysis
Y/E March FY16A FY17A FY18E FY19E FY20E
NII / Assets 4.34% 4.27% 4.67% 4.68% 4.70%
Other Income / Assets 1.12% 1.34% 1.31% 1.34% 1.30%
Total Income / Assets 5.46% 5.61% 5.99% 6.02% 6.00%
Cost / Assets 2.25% 1.87% 1.83% 1.72% 1.64%
PPP / Assets 3.20% 3.73% 4.16% 4.30% 4.36%
Provisions / Assets 1.34% 2.33% 2.25% 1.98% 1.78%
PBT / Assets 1.86% 1.40% 1.91% 2.32% 2.57%
Tax rate 36.8% 3.8% 27.0% 25.0% 25.0%
ROA 1.18% 1.35% 1.68% 1.98% 2.13%
Leverage 8.9 9.2 9.3 9.7 9.9
ROE 10.2% 12.2% 15.6% 18.8% 20.9%
Source: Company, JM Financial
Valuations
Y/E March FY16A FY17A FY18E FY19E FY20E
Shares in Issue 1,753.4 1,755.7 1,819.5 1,819.5 1,819.5
EPS (INR) 3.9 5.2 7.4 10.4 13.5
EPS (YoY) (%) -6.3% 32.9% 40.6% 41.3% 29.9%
P/E (x) 50.6 38.1 27.1 19.2 14.8
BV (INR) 41 45 51 59 70
BV (YoY) (%) 10.7% 9.6% 13.6% 15.9% 17.8%
P/BV (x) 4.85 4.43 3.90 3.36 2.86
DPS (INR) 1.2 0.4 1.6 2.3 3.0
Div. yield (%) 0.6% 0.2% 0.8% 1.1% 1.5%
Source: Company, JM Financial
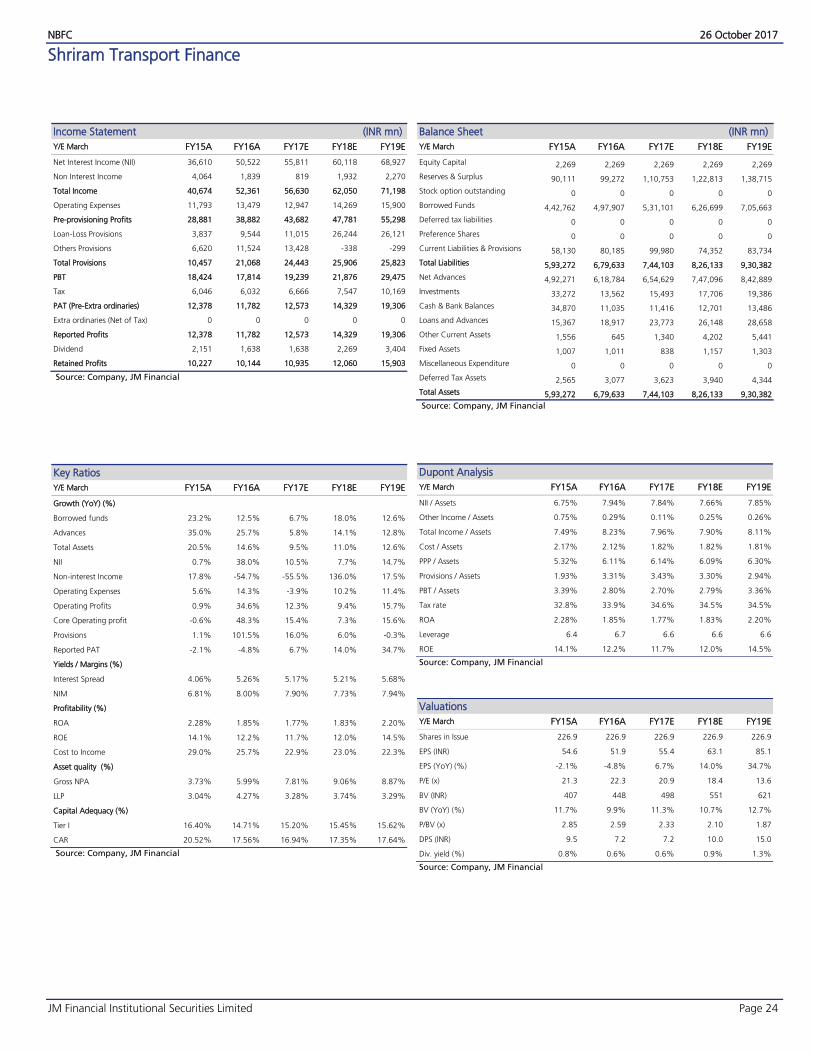
NBFC 26 October 2017
JM Financial Institutional Securities Limited Page 24
Shriram Transport Finance
Income Statement (INR mn)
Y/E March FY15A FY16A FY17E FY18E FY19E
Net Interest Income (NII) 36,610 50,522 55,811 60,118 68,927
Non Interest Income 4,064 1,839 819 1,932 2,270
Total Income 40,674 52,361 56,630 62,050 71,198
Operating Expenses 11,793 13,479 12,947 14,269 15,900
Pre-provisioning Profits 28,881 38,882 43,682 47,781 55,298
Loan-Loss Provisions 3,837 9,544 11,015 26,244 26,121
Others Provisions 6,620 11,524 13,428 -338 -299
Total Provisions 10,457 21,068 24,443 25,906 25,823
PBT 18,424 17,814 19,239 21,876 29,475
Tax 6,046 6,032 6,666 7,547 10,169
PAT (Pre-Extra ordinaries) 12,378 11,782 12,573 14,329 19,306
Extra ordinaries (Net of Tax) 0 0 0 0 0
Reported Profits 12,378 11,782 12,573 14,329 19,306
Dividend 2,151 1,638 1,638 2,269 3,404
Retained Profits 10,227 10,144 10,935 12,060 15,903
Source: Company, JM Financial
Key Ratios
Y/E March FY15A FY16A FY17E FY18E FY19E
Growth (YoY) (%)
Borrowed funds 23.2% 12.5% 6.7% 18.0% 12.6%
Advances 35.0% 25.7% 5.8% 14.1% 12.8%
Total Assets 20.5% 14.6% 9.5% 11.0% 12.6%
NII 0.7% 38.0% 10.5% 7.7% 14.7%
Non-interest Income 17.8% -54.7% -55.5% 136.0% 17.5%
Operating Expenses 5.6% 14.3% -3.9% 10.2% 11.4%
Operating Profits 0.9% 34.6% 12.3% 9.4% 15.7%
Core Operating profit -0.6% 48.3% 15.4% 7.3% 15.6%
Provisions 1.1% 101.5% 16.0% 6.0% -0.3%
Reported PAT -2.1% -4.8% 6.7% 14.0% 34.7%
Yields / Margins (%)
Interest Spread 4.06% 5.26% 5.17% 5.21% 5.68%
NIM 6.81% 8.00% 7.90% 7.73% 7.94%
Profitability (%)
ROA 2.28% 1.85% 1.77% 1.83% 2.20%
ROE 14.1% 12.2% 11.7% 12.0% 14.5%
Cost to Income 29.0% 25.7% 22.9% 23.0% 22.3%
Asset quality (%)
Gross NPA 3.73% 5.99% 7.81% 9.06% 8.87%
LLP 3.04% 4.27% 3.28% 3.74% 3.29%
Capital Adequacy (%)
Tier I 16.40% 14.71% 15.20% 15.45% 15.62%
CAR 20.52% 17.56% 16.94% 17.35% 17.64%
Source: Company, JM Financial
Balance Sheet (INR mn)
Y/E March FY15A FY16A FY17E FY18E FY19E
Equity Capital 2,269 2,269 2,269 2,269 2,269
Reserves & Surplus 90,111 99,272 1,10,753 1,22,813 1,38,715
Stock option outstanding 0 0 0 0 0
Borrowed Funds 4,42,762 4,97,907 5,31,101 6,26,699 7,05,663
Deferred tax liabilities 0 0 0 0 0
Preference Shares 0 0 0 0 0
Current Liabilities & Provisions 58,130 80,185 99,980 74,352 83,734
Total Liabilities 5,93,272 6,79,633 7,44,103 8,26,133 9,30,382
Net Advances 4,92,271 6,18,784 6,54,629 7,47,096 8,42,889
Investments 33,272 13,562 15,493 17,706 19,386
Cash & Bank Balances 34,870 11,035 11,416 12,701 13,486
Loans and Advances 15,367 18,917 23,773 26,148 28,658
Other Current Assets 1,556 645 1,340 4,202 5,441
Fixed Assets 1,007 1,011 838 1,157 1,303
Miscellaneous Expenditure 0 0 0 0 0
Deferred Tax Assets 2,565 3,077 3,623 3,940 4,344
Total Assets 5,93,272 6,79,633 7,44,103 8,26,133 9,30,382
Source: Company, JM Financial
Dupont Analysis
Y/E March FY15A FY16A FY17E FY18E FY19E
NII / Assets 6.75% 7.94% 7.84% 7.66% 7.85%
Other Income / Assets 0.75% 0.29% 0.11% 0.25% 0.26%
Total Income / Assets 7.49% 8.23% 7.96% 7.90% 8.11%
Cost / Assets 2.17% 2.12% 1.82% 1.82% 1.81%
PPP / Assets 5.32% 6.11% 6.14% 6.09% 6.30%
Provisions / Assets 1.93% 3.31% 3.43% 3.30% 2.94%
PBT / Assets 3.39% 2.80% 2.70% 2.79% 3.36%
Tax rate 32.8% 33.9% 34.6% 34.5% 34.5%
ROA 2.28% 1.85% 1.77% 1.83% 2.20%
Leverage 6.4 6.7 6.6 6.6 6.6
ROE 14.1% 12.2% 11.7% 12.0% 14.5%
Source: Company, JM Financial
Valuations
Y/E March FY15A FY16A FY17E FY18E FY19E
Shares in Issue 226.9 226.9 226.9 226.9 226.9
EPS (INR) 54.6 51.9 55.4 63.1 85.1
EPS (YoY) (%) -2.1% -4.8% 6.7% 14.0% 34.7%
P/E (x) 21.3 22.3 20.9 18.4 13.6
BV (INR) 407 448 498 551 621
BV (YoY) (%) 11.7% 9.9% 11.3% 10.7% 12.7%
P/BV (x) 2.85 2.59 2.33 2.10 1.87
DPS (INR) 9.5 7.2 7.2 10.0 15.0
Div. yield (%) 0.8% 0.6% 0.6% 0.9% 1.3%
Source: Company, JM Financial

NBFC 26 October 2017
JM Financial Institutional Securities Limited Page 25
Shriram City Union Finance Co.
Income Statement (INR mn)
Y/E March FY15A FY16A FY17E FY18E FY19E
Net Interest Income (NII) 21,431 24,080 28,568 32,243 38,546
Non Interest Income 970 682 549 853 832
Total Income 22,401 24,762 29,118 33,097 39,378
Operating Expenses 9,452 10,685 11,476 13,311 15,454
Pre-provisioning Profits 12,949 14,077 17,642 19,786 23,924
Loan-Loss Provisions 1,280 3,143 4,643 9,642 11,515
Others Provisions 3,257 2,861 4,463 0 0
Total Provisions 4,538 6,008 9,105 9,642 11,515
PBT 8,411 8,068 8,536 10,144 12,409
Tax 2,830 2,771 2,976 3,550 4,343
PAT (Pre-Extra ordinaries) 5,581 5,298 5,561 6,593 8,066
Extra ordinaries (Net of Tax) 0 0 0 0 0
Reported Profits 5,581 5,298 5,561 6,593 8,066
Dividend 1,235 1,194 1,191 1,319 1,613
Retained Profits 4,346 4,104 4,370 5,275 6,453
Source: Company, JM Financial
Key Ratios
Y/E March FY15A FY16A FY17E FY18E FY19E
Growth (YoY) (%)
Borrowed funds 2.9% 16.2% 18.3% 23.2% 23.3%
Advances 23.5% 21.0% 20.1% 16.0% 20.9%
Total Assets 10.1% 15.6% 17.7% 16.3% 20.9%
NII 14.4% 12.4% 18.6% 12.9% 19.5%
Non-interest Income 11.9% -29.7% -19.4% 55.4% -2.5%
Operating Expenses 18.8% 13.0% 7.4% 16.0% 16.1%
Operating Profits 11.2% 8.7% 25.3% 12.2% 20.9%
Core Operating profit 11.7% 11.9% 25.7% 11.5% 20.9%
Provisions 18.1% 32.4% 51.5% 5.9% 19.4%
Reported PAT 7.1% -5.1% 5.0% 18.6% 22.3%
Yields / Margins (%)
Interest Spread 9.87% 9.51% 9.82% 9.66% 10.00%
NIM 12.75% 12.56% 12.72% 12.26% 12.34%
Profitability (%)
ROA 3.24% 2.72% 2.45% 2.48% 2.56%
ROE 16.0% 12.3% 11.7% 12.5% 13.7%
Cost to Income 42.2% 43.2% 39.4% 40.2% 39.2%
Asset quality (%)
Gross NPA 3.05% 4.97% 6.41% 8.69% 7.94%
LLP 3.19% 3.54% 4.35% 3.91% 3.93%
Capital Adequacy (%)
Tier I 24.80% 23.36% 22.22% 20.83% 19.20%
CAR 29.03% 26.14% 23.88% 22.45% 20.75%
Source: Company, JM Financial
Balance Sheet (INR mn)
Y/E March FY15A FY16A FY17E FY18E FY19E
Equity Capital 659 659 659 659 659
Reserves & Surplus 40,327 44,437 49,608 54,883 61,336
Stock option outstanding 25 20 16 19 22
Borrowed Funds 1,24,021 1,44,084 1,70,420 2,09,873 2,58,773
Deferred tax liabilities 0 0 0 0 0
Preference Shares 0 0 0 0 0
Current Liabilities & Provisions 15,347 19,344 24,660 19,979 24,145
Total Liabilities 1,80,380 2,08,544 2,45,365 2,85,413 3,44,935
Net Advances 1,57,229 1,90,236 2,28,469 2,64,984 3,20,450
Investments 9,817 7,923 7,145 8,744 10,575
Cash & Bank Balances 8,714 6,539 6,491 7,950 9,453
Loans and Advances 1,674 1,170 1,145 1,060 1,282
Other Current Assets 1,814 1,455 890 1,251 1,455
Fixed Assets 823 849 782 909 1,099
Miscellaneous Expenditure 0 0 0 0 0
Deferred Tax Assets 310 372 442 514 622
Total Assets 1,80,380 2,08,544 2,45,365 2,85,413 3,44,935
Source: Company, JM Financial
Dupont Analysis
Y/E March FY15A FY16A FY17E FY18E FY19E
NII / Assets 12.45% 12.38% 12.59% 12.15% 12.23%
Other Income / Assets 0.33% 0.33% 0.24% 0.27% 0.22%
Total Income / Assets 12.78% 12.71% 12.83% 12.42% 12.45%
Cost / Assets 5.49% 5.49% 5.06% 5.02% 4.90%
PPP / Assets 7.52% 7.24% 7.77% 7.46% 7.59%
Provisions / Assets 2.64% 3.09% 4.01% 3.63% 3.65%
PBT / Assets 4.89% 4.15% 3.76% 3.82% 3.94%
Tax rate 33.6% 34.3% 34.9% 35.0% 35.0%
ROA 3.24% 2.72% 2.45% 2.48% 2.56%
Leverage 4.4 4.6 4.9 5.1 5.6
ROE 16.0% 12.3% 11.7% 12.5% 13.7%
Source: Company, JM Financial
Valuations
Y/E March FY15A FY16A FY17E FY18E FY19E
Shares in Issue 65.9 65.9 65.9 65.9 65.9
EPS (INR) 84.7 80.4 84.3 100.0 122.3
EPS (YoY) (%) -3.7% -5.1% 4.9% 18.6% 22.3%
P/E (x) 25.4 26.7 25.5 21.5 17.6
BV (INR) 622 684 762 842 940
BV (YoY) (%) 27.2% 10.0% 11.4% 10.5% 11.6%
P/BV (x) 3.45 3.14 2.82 2.55 2.28
DPS (INR) 18.7 18.1 18.1 20.0 24.5
Div. yield (%) 0.9% 0.8% 0.8% 0.9% 1.1%
Source: Company, JM Financial

NBFC 26 October 2017
JM Financial Institutional Securities Limited Page 26
APPENDIX I
JM F inancia l Inst itut ional Secur it ies Limited
Corporate Identity Number: U65192MH1995PLC092522 Member of BSE Ltd. and National Stock Exchange of India Ltd. and Metropolitan Stock Exchange of India Ltd.
SEBI Registration Nos.: BSE - INZ010012532, NSE - INZ230012536 and MSEI - INZ260012539, Research Analyst – INH000000610 Registered Office: 7th Floor, Cnergy, Appasaheb Marathe Marg, Prabhadevi, Mumbai 400 025, India.
Board: +9122 6630 3030 | Fax: +91 22 6630 3488 | Email: [email protected] | www.jmfl.com
Compliance Officer: Mr. Sunny Shah | Tel: +91 22 6630 3383 | Email: [email protected]
Definition of ratings
Rating Meaning
Buy Total expected returns of more than 15%. Total expected return includes dividend yields.
Hold Price expected to move in the range of 10% downside to 15% upside from the current market price.
Sell Price expected to move downwards by more than 10%
Research Analyst(s) Certification The Research Analyst(s), with respect to each issuer and its securities covered by them in this research report, certify that: All of the views expressed in this research report accurately reflect his or her or their personal views about all of the issuers and their securities; and No part of his or her or their compensation was, is, or will be directly or indirectly related to the specific recommendations or views expressed in this research report. Important Disclosures This research report has been prepared by JM Financial Institutional Securities Limited (JM Financial Institutional Securities) to provide information about the company(ies) and sector(s), if any, covered in the report and may be distributed by it and/or its associates solely for the purpose of information of the select recipient of this report. This report and/or any part thereof, may not be duplicated in any form and/or reproduced or redistributed without the prior written consent of JM Financial Institutional Securities. This report has been prepared independent of the companies covered herein.
JM Financial Institutional Securities is registered with the Securities and Exchange Board of India (SEBI) as a Research Analyst, Merchant Banker and a Stock Broker having trading memberships of the BSE Ltd. (BSE), National Stock Exchange of India Ltd. (NSE) and Metropolitan Stock Exchange of India Ltd. (MSEI). No material disciplinary action has been taken by SEBI against JM Financial Institutional Securities in the past two financial years which may impact the investment decision making of the investor.
JM Financial Institutional Securities provides a wide range of investment banking services to a diversified client base of corporates in the domestic and international markets. It also renders stock broking services primarily to institutional investors and provides the research services to its institutional clients/investors. JM Financial Institutional Securities and its associates are part of a multi-service, integrated investment banking, investment management, brokerage and financing group. JM Financial Institutional Securities and/or its associates might have provided or may provide services in respect of managing offerings of securities, corporate finance, investment banking, mergers & acquisitions, broking, financing or any other advisory services to the company(ies) covered herein. JM Financial Institutional Securities and/or its associates might have received during the past twelve months or may receive compensation from the company(ies) mentioned in this report for rendering any of the above services.
JM Financial Institutional Securities and/or its associates, their directors and employees may; (a) from time to time, have a long or short position in, and buy or sell the securities of the company(ies) mentioned herein or (b) be engaged in any other transaction involving such securities and earn brokerage or other compensation or act as a market maker in the financial instruments of the company(ies) covered under this report or (c) act as an advisor or lender/borrower to, or may have any financial interest in, such company(ies) or (d) considering the nature of business/activities that JM Financial Institutional Securities is engaged in, it may have potential conflict of interest at the time of publication of this report on the subject company(ies).
Neither JM Financial Institutional Securities nor its associates or the Research Analyst(s) named in this report or his/her relatives individually own one per cent or more securities of the company(ies) covered under this report, at the relevant date as specified in the SEBI (Research Analysts) Regulations, 2014.
The Research Analyst(s) principally responsible for the preparation of this research report and members of their household are prohibited from buying or selling debt or equity securities, including but not limited to any option, right, warrant, future, long or short position issued by company(ies) covered under this report. The Research Analyst(s) principally responsible for the preparation of this research report or their relatives (as defined under SEBI (Research Analysts) Regulations, 2014); (a) do not have any financial interest in the company(ies) covered under this report or (b) did not receive any compensation from the company(ies) covered under this report, or from any third party, in connection with this report or (c) do not have any other material conflict of interest at the time of publication of this report. Research Analyst(s) are not serving as an officer, director or employee of the company(ies) covered under this report.
While reasonable care has been taken in the preparation of this report, it does not purport to be a complete description of the securities, markets or developments referred to herein, and JM Financial Institutional Securities does not warrant its accuracy or completeness. JM Financial Institutional Securities may not be in any way responsible for any loss or damage that may arise to any person from any inadvertent error in the information contained in this report. This report is provided for information only and is not an investment advice and must not alone be taken as the basis for an investment decision. The investment discussed or views expressed or recommendations/opinions given herein may not be suitable for all investors. The user assumes the entire risk of any use made of this information. The information contained herein may be changed without notice and JM Financial Institutional Securities reserves the right
to make modifications and alterations to this statement as they may deem fit from time to time.

NBFC 26 October 2017
JM Financial Institutional Securities Limited Page 27
This report is neither an offer nor solicitation of an offer to buy and/or sell any securities mentioned herein and/or not an official confirmation of any transaction.
This report is not directed or intended for distribution to, or use by any person or entity who is a citizen or resident of or located in any locality, state, country or other jurisdiction, where such distribution, publication, availability or use would be contrary to law, regulation or which would subject JM Financial Institutional Securities and/or its affiliated company(ies) to any registration or licensing requirement within such jurisdiction. The securities described herein may or may not be eligible for sale in all jurisdictions or to a certain category of investors. Persons in whose possession this report may come, are required to inform themselves of and to observe such restrictions.
Persons who receive this report from JM Financial Singapore Pte Ltd may contact Mr. Ruchir Jhunjhunwala ([email protected]) on +65 6422 1888 in respect of any matters arising from, or in connection with, this report. Additional disclosure only for U.S. persons: JM Financial Institutional Securities has entered into an agreement with JM Financial Securities, Inc. ("JM Financial Securities"), a U.S. registered broker-dealer and member of the Financial Industry Regulatory Authority ("FINRA") in order to conduct certain business in the United States in reliance on the exemption from U.S. broker-dealer registration provided by Rule 15a-6, promulgated under the U.S. Securities Exchange Act of 1934 (the "Exchange Act"), as amended, and as interpreted by the staff of the U.S. Securities and Exchange Commission ("SEC") (together "Rule 15a-6").
This research report is distributed in the United States by JM Financial Securities in compliance with Rule 15a-6, and as a "third party research report" for purposes of FINRA Rule 2241. In compliance with Rule 15a-6(a)(3) this research report is distributed only to "major U.S. institutional investors" as defined in Rule 15a-6 and is not intended for use by any person or entity that is not a major U.S. institutional investor. If you have received a copy of this research report and are not a major U.S. institutional investor, you are instructed not to read, rely on, or reproduce the contents hereof, and to destroy this research or return it to JM Financial Institutional Securities or to JM Financial Securities.
This research report is a product of JM Financial Institutional Securities, which is the employer of the research analyst(s) solely responsible for its content. The research analyst(s) preparing this research report is/are resident outside the United States and are not associated persons or employees of any U.S. registered broker-dealer. Therefore, the analyst(s) are not subject to supervision by a U.S. broker-dealer, or otherwise required to satisfy the regulatory licensing requirements of FINRA and may not be subject to the Rule 2241 restrictions on communications with a subject company, public appearances and trading securities held by a research analyst account.
JM Financial Institutional Securities only accepts orders from major U.S. institutional investors. Pursuant to its agreement with JM Financial Institutional Securities, JM Financial Securities effects the transactions for major U.S. institutional investors. Major U.S. institutional investors may place orders with JM Financial Institutional Securities directly, or through JM Financial Securities, in the securities discussed in this research report.
Additional disclosure only for U.K. persons: Neither JM Financial Institutional Securities nor any of its affiliates is authorised in the United Kingdom (U.K.) by the Financial Conduct Authority. As a result, this report is for distribution only to persons who (i) have professional experience in matters relating to investments falling within Article 19(5) of the Financial Services and Markets Act 2000 (Financial Promotion) Order 2005 (as amended, the "Financial Promotion Order"), (ii) are persons falling within Article 49(2)(a) to (d) ("high net worth companies, unincorporated associations etc.") of the Financial Promotion Order, (iii) are outside the United Kingdom, or (iv) are persons to whom an invitation or inducement to engage in investment activity (within the meaning of section 21 of the Financial Services and Markets Act 2000) in connection with the matters to which this report relates may otherwise lawfully be communicated or caused to be communicated (all such persons together being referred to as "relevant persons"). This report is directed only at relevant persons and must not be acted on or relied on by persons who are not relevant persons. Any investment or investment activity to which this report relates is avai lable only to relevant persons and will be engaged in only with relevant persons.
Additional disclosure only for Canadian persons: This report is not, and under no circumstances is to be construed as, an advertisement or a public offering of the securities described herein in Canada or any province or territory thereof. Under no circumstances is this report to be construed as an offer to sell securities or as a solicitation of an offer to buy securities in any jurisdiction of Canada. Any offer or sale of the securities described herein in Canada will be made only under an exemption from the requirements to file a prospectus with the relevant Canadian securities regulators and only by a dealer properly registered under applicable securities laws or, alternatively, pursuant to an exemption from the registration requirement in the relevant province or territory of Canada in which such offer or sale is made. This report is not, and under no circumstances is it to be construed as, a prospectus or an offering memorandum. No securities commission or similar regulatory authority in Canada has reviewed or in any way passed upon these materials, the information contained herein or the merits of the securities described herein and any representation to the contrary is an offence. If you are located in Canada, this report has been made available to you based on your representation that you are an “accredited investor” as such term is defined in National Instrument 45-106 Prospectus Exemptions and a “permitted client” as such term is defined in National Instrument 31-103 Registration Requirements, Exemptions and Ongoing Registrant Obligations. Under no circumstances is the information contained herein to be construed as investment advice in any province or territory of Canada nor should it be construed as being tailored to the needs of the recipient. Canadian recipients are advised that JM Financial Securities, Inc., JM Financial Institutional Securities Limited, their affiliates and authorized agents are not responsible for, nor do they accept, any liability whatsoever for any direct or consequential loss arising from any use of this research report or the information contained herein.