kara steeland [email protected] adena kass [email protected] william finnicum [email protected]...
TRANSCRIPT

Kara Steeland [email protected]
Adena Kass [email protected]
William Finnicum [email protected] Global Change 1-Section 5

•Non-Renewable Resources: coal, gas, oil
•Combustion of fossil fuels in urban buildings is responsible for approximately half of the global carbon dioxide emissions each year (Beascochea and Filippin, 2005)
•Buildings are responsible for about 37% of energy consumed in the United States and consumed 68% of the electricity produced (LEED-NC Reference Guide)
•Fossil fuel emissions add carbon dioxide to the atmosphere which increases greenhouse effect and global warming
Image taken from: https://ctools.umich.edu/access/content/group/db7fe7ed-e073-46a4-80bc-
358b887d9cc9/Lecture%20Powerpoints/George%20Kling/Climate_models_lecture.pdf

•Our case study will examine how we can reduce fossil fuel consumption in the construction and maintenance of a building.
•By following the guidelines of sustainable architecture, we will minimize the amount of fossil fuels consumed in the construction and maintenance
of a building.
• Sustainable architecture attempts to decrease energy use and create buildings that generate their own energy

Image taken from www.mcgill.ca
•Used interchangeably with the term ‘green building’
• Aspects of sustainable architecture (Gissen, 2002):
•Energy: redesign mechanical systems to use less energy; use renewable sources (wind, water, solar power)
•Light: shading
•Air: ventilation
•Greenery: use plants to treat water
•Water
•Waste
•Construction : use recycled, local, and renewable materials
•Renewable materials: resources that can be replenished at the same rate they are being used

Building a visitor’s center in the Nichols Arboretum in order to determine the decrease in CO2 emissions as a result of using
sustainable building practices
Image taken from: http://www.enfo.ie/leaflets/Sustainable%20Building.htm
Compare the materials used and energy sources in a green building and a conventional building
Sustainable designreduces need for fossil fuels

The orientation of the building within the Arboretum is essential in order to maximize the use of natural energy sources such as the river and the sun:
•be built on a hill with the largest side facing south
•more windows will be placed on the side of the building with southern exposure, allowing the radiation to enter the building in the winter
•deciduous trees on the southern side of the building will shield the visitor’s center from sun in the summertime
•ventilation: large vents under the roof of the visitor’s center (Gissen, 2002)
•two stories so that it can have a slim shapemaximize ventilation caused by breezes naturally flowing through its windows (Battle, 2002)
(Kim, 2005)
0
10
20
30
40
50
60
70
80
90
100
Conventional Green
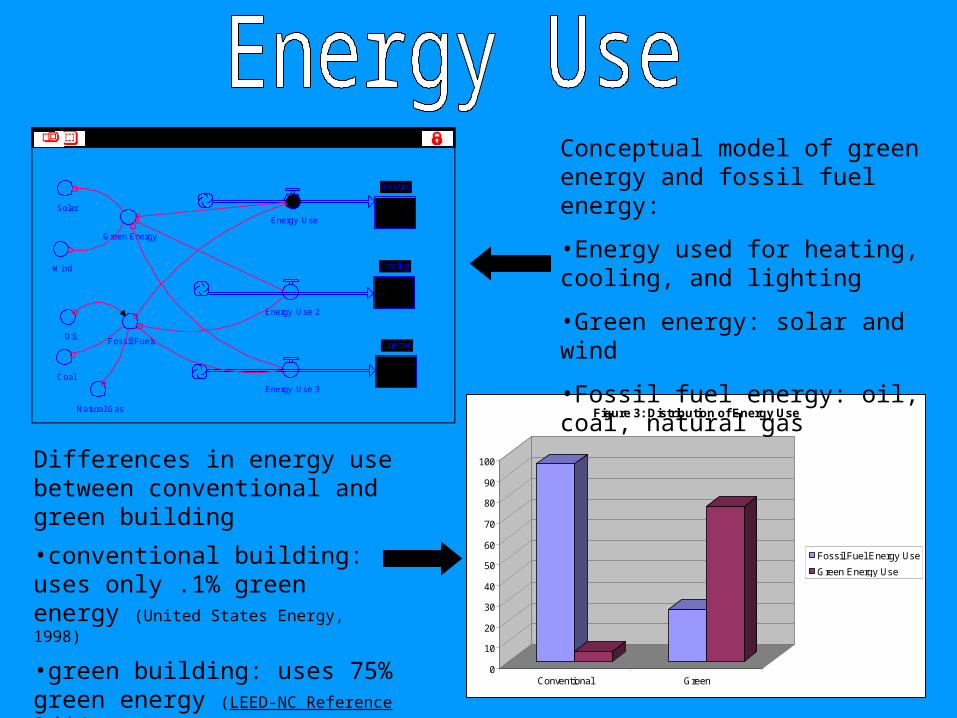
Figure 3: Distribution of Energy Use
Fossil Fuel Energy Use
Green Energy Use
Heating
Cooling
Lighting
Energy Use
Energy Use 2
Energy Use 3
Green Energy
Fossil Fuels
Solar
Wind
Oil
Coal
Natural Gas
Figure 4. Energy Use in Building Maintenace
Conceptual model of green energy and fossil fuel energy:
•Energy used for heating, cooling, and lighting
•Green energy: solar and wind
•Fossil fuel energy: oil, coal, natural gas
Differences in energy use between conventional and green building
•conventional building: uses only .1% green energy (United States Energy, 1998)
•green building: uses 75% green energy (LEED-NC Reference Guide)

Figure 5: Percentages of Energy Consumption in a Conventional Building
38.8
23.2
22.9
7.93.8
3.2 0.07
0.04 Oil
Natural Gas
Coal
Nuclear
Hydroelectric
Biomass
Solar
Wind
Figure 6: Percentages of Energy Consumption in a Green Building
16.5
8.5
30
45 Oil
Natural Gas
Solar
Wind
Conventional building utilizes only .07% solar energy and .04% wind energy (United States Energy, 1998)
Green building uses 45% wind energy and 30% solar energy (LEED-NC
Reference Guide)

Materials Used
Local & Renewable
Local & Nonrenewable
Nonlocal & Renewable
Nonlocal & NonrenewableTransportation Nonlocal
Transportation Local
Transportation Pollution
Figure 7. Pollution caused by Construction
Conceptual model of types of materials and the resulting pollution during building construction:
•Compare local, non-local, renewable, and non-renewable resources
•Best source: local and renewableleast fossil fuel emissions and environmental impact

Figure 8: Material Composition of a Conventional Building
2
604
63
55
10 5 Steel
Concrete
Rubber
Lumber
Asphalt
Plastics/Composites
Recycled Materials
Gravel
OSB Board
0
10
20
30
40
50
60
70
80
90
Glass CeilingTiles
Aluminum Steel Concrete CellusloseInsulation
Figure 9: Percentages of Recycled Materials used in a Green Building
Percent ofeachmaterialthat isrecycled
•No standards for recycled or renewable materials in conventional buildings
•Use mainly recycled material in green building; 25-80% recycled materials (Hunt, 2002)
•Wood is considered to be the most renewable resources:
•only 6% used in conventional building (Keoleian, 2000)
•According to LEED (leadership in energy and environmental design), at least 50% wood must be used in green building (LEED-NC Reference Guide)

0
5
10
15
20
25
30
35
40
45
50
Manufactured Extracted or Recovered
Figure 10: Percentages of Local Materials Used in a Green Building
Local Materials
•Local resources: materials that are produced or recovered within 500 miles of a project site
•LEED standards require a building to utilize 50% of materials that are extracted or recovered locally and 20% that are manufactured locally (LEED-NC Reference Guide)
•By using mostly local materials for construction, the impacts on the environment due to fossil fuel emissions are decreased

•our proposed visitor’s center will use energy and materials efficiently
•conventional building:
•.1% renewable energy (United States Energy, 1998)
•non-renewable and non-local materials
•sustainable building:
•75% renewable energy (LEED-NC Reference Guide)
•recycled and renewable materials
•70% local materials (LEED-NC Reference Guide)
•conclusion: the visitor’s center built according to sustainable guidelines will have reduced fossil fuel emissions and have a decreased impact on the environment

Beascochea, A., and C. Filippin. 2005. Energy-efficient housing for low-income students in a highly variable environment of central Argentina. Renewable Energy 32: 1-20.
Energy and Atmosphere. LEED-NC Reference Guide, 2.1: 109-181
Gissen, D., ed. 2002. Big & Green: Toward Sustainable Architecture in the 21st Century. Princeton Architectural Press, New York.
Hunt, H.D. 2002. Green Building. Construction Technology, 1569.
Keoleian, G.A., Blanchard, & S., Reppe, P. 2000. Life Cycle Energy, Costs, and Strategies for Improving a Single-Family House. Journal of Industrial Ecology, 4:
135-156.
Kim, D.K. 2005. The natural environment control system of Korean traditional architecture: Comparison with Korean contemporary architecture. Building and
Environment, 41: 1905-1912.
Materials and Resources. LEED Reference Guide, 2.1: 185-238.
“United States Energy and World Energy Production and Consumption Statistics.” 1998. <http://energy.cr.usgs.gov/energy/stats_ctry/Stat1.html> (28 November 2006)