kanta murali politics of fdi conference, niehaus …pcglobal/conferences/fdi2011/...economic...
TRANSCRIPT

Economic Liberalization, Electoral Coalitions and Private Investment in India
Kanta Murali∗
Politics of FDI Conference, Niehaus Center for Globalization and Governance, September 23-24, 2011
∗ Ph.D. Candidate, Politics Department, Princeton University, Princeton, NJ 08544; [email protected] For their comments and suggestions, I thank Atul Kohli, Evan Lieberman, Grigore Pop-Eleches, Amaney Jamal, Noam Lupu and Dinsha Mistree. All errors and omissions are my own. This paper draws on chapters 1, 2 and 3 of my dissertation.

Terminology and a list of abbreviations
Adivasis Scheduled Tribes; also referred to as STs
AP Andhra Pradesh
BJP Bharatiya Janata Party
CPI Communist Party of India
CPI (M) Communist Party of India –Marxist
Dalits Scheduled Castes; also referred to as SCs or Harijans
FDI Foreign Direct Investment
FPTP First-Past-the-Post
INC Indian National Congress
IPE International Political Economy
KHAM Kshatriya Harijan Adivasi Muslim
MLA Member of the Legislative Assembly
OBC Other Backward Castes
PRP Praja Rajyam Party
NTR N.T. Rama Rao
SAD Shiromani Akali Dal
SC Scheduled Castes; also referred to as Dalits
ST Scheduled Tribes; also referred to as Adivasis
TDP Telugu Desam Party
TRS Telangana Rashtra Samiti
UP Uttar Pradesh
YSR Y.S. Rajasekhar Reddy

1
1. Introduction: motivation and questions
Cases of rapid growth in the developing world are rare. If examples of high growth in poor
countries are few and far between, rarer still are those that have occurred in a democratic setting.
From the point of view of an extensive literature on redistribution, these trends are not
surprising. Starting with the classic models of Romer (1975) and Meltzer and Richard (1981),
scholars have posited an inverse relationship between income and individual preferences for
redistribution – individuals with lower incomes are likely to favor greater redistribution. While
recent theories have emphasized other variables in explaining redistributive preferences such as
structure of inequality, skill types, prospects for mobility, risk aversion, values and beliefs, even
those that highlight alternative mechanisms empirically confirm an inverse relationship between
income and preferences for redistribution (e.g., Alesina and Angeletos 2005; Alesina and Ferrara
2005; Iversen and Soskice 2001).
A related set of studies link democracies to redistributive outcomes at a macro-level (e.g.,
Acemoglu and Robinson 2005; Boix 2003). Though these authors focus on the conditions under
which democracies emerge and consolidate, they too assume that the poor prefer higher
redistribution than the rich. Authoritarianism privileges elite interests while democracies are
responsive to the poor and, as a result, should redistribute more. Some authors also broadly
suggest that democracies are better for the welfare of the poor as they provide more social
spending or public goods than non-democracies (e.g., Brown and Hunter 1999; Kaufman and
Segura-Ubiergo 2001; Lake and Baum 2001; Stasavage 2005).1
If the poor generally prefer redistribution and democracies have a proclivity to redistribute,
we should see poor democracies focusing predominantly on redistribution. Given the nature of
resource constraints in developing democracies, policymakers often face a trade-off between
growth-related and redistributive policies.2 It is therefore unlikely that growth will occur in such
circumstances. Yet as a largely poor and highly-competitive democracy that has witnessed a
notable growth transformation, India poses a puzzle to this hypothesis. Over the last two 1 Ross (2006) challenges the claim that democracies have a better record on the welfare of the poor. In addition, levels of redistribution vary within democracies (e.g., Iversen and Soskice 2006, 2009). 2 As discussed in the conclusion of this paper, there are several reasons why a trade-off between growth-related goals and redistribution may exist in developing countries. The extent to which there is a trade-off is ultimately an empirical question. In Indian states, there is considerable evidence of the tension between growth-oriented and redistributive goals after market reforms.

2
decades, India has been among the world’s fastest growing economies. Between 1991-92, when
it adopted extensive market reforms, and 2009-10, India’s average annual GDP growth rate was
an impressive 6.5 per cent.3 This stands in stark contrast to the experience of other successful
late developers. Not only did well-established democratic politics precede India’s shift to a high-
growth path, economic change has taken place in a polity where the poor constitute a near
majority of the electorate and are more likely to participate in the electoral process than
economically-privileged sections (Yadav 1999, 2002). 4
The puzzle posed by India’s experience – of rapid growth in the midst of a largely poor
electorate – leads to a broader question that forms the main motivation of my dissertation, on
which this paper is based. What are the political conditions conducive to high growth in poor
democracies? Through a subnational analysis of India’s economic transformation, this paper
argues that under certain circumstances in poor democracies, redistributive pressures are more
contained and policymakers can prioritize growth-related concerns. The core argument focuses
on the nature of the social base of voters backing governments, which I refer to as electoral
coalitions.5 Some configurations of electoral coalitions are more favorable to growth-related
issues than others. Specifically, narrow-right coalitions, characterized by the joint presence of
core groups with similar economically-advanced profiles and substantial representation of
business interests, are most conducive to growth-friendly policies.
How do narrow-right coalitions emerge in the presence of poor electorates? When identity
politics forms the main mode of political mobilization, underlying social cleavage patterns
influence the choice of groups that parties seek to target in constructing electoral bases of
support. In such cases, I find that certain cleavage structures can affect party strategies in a way
that allows growth-friendly coalitions to emerge in the midst of poor electorates. These coalitions
3Calculations based on GDP data from RBI (2010). 4 Poverty measures are highly controversial in India. The World Bank’s estimates suggest that 41.6 per cent of India’s population lived below the $1.25 a day poverty line in 2005 and 75.6 per cent lived below $2 per day. Official estimates of the Indian government peg the poverty headcount ratio at 37.2 per cent in 2004-05 (Tendulkar Report). This translates to 301.7 million people below the poverty line. Another government-appointed taskforce using a different methodology, the Saxena Committee, estimated the poverty ratio at 50 per cent in its report while a third, the Sengupta Committee, put the figure of “poor and vulnerable” at 77 per cent of India’s population or 836 million people. 5 Throughout this paper, electoral coalitions refer to the base of voters who support a particular government and not to a coalition of parties in government. However, governments comprising a coalition of parties have frequently come to power in India in the last two decades. In such cases, the vote base of all parties that comprise the government is taken into account.

3
are unlikely to occur in developing country contexts if economic interests form the sole basis of
mobilization.
The argument is developed in relation to a particular empirical puzzle that examines variation
in one of the key inputs of growth – investment – across Indian states after market reforms.6 A
focus on investment in subnational units in India is particularly suitable for an analysis of
political conditions favorable to growth. Starting with neoclassical growth theory, models have
highlighted the importance of investment in the growth process. While there are multiple sources
of growth and other explanatory factors have also been emphasized, a positive empirical
relationship between investment rates and growth is widely accepted (e.g., Barro and Sala-i-
Martin 2004). The subnational units analyzed in the larger dissertation project have primary
responsibility for most policy areas related to investment promotion and are subject to a similar
constitutional, financial and electoral structure. Critically, this allows the study to control for
several potentially confounding institutional factors and focus closely on political conditions
favorable to growth-related concerns.
Specifically, this paper examines the markedly different performances of subnational
governments in the competition for private industrial investment in India, which began after the
adoption of market reforms in 1991.7 Despite being subject to a similar institutional framework,
some states have attracted considerably higher levels of investment than others. In turn, several
scholars point out that these varied patterns of investment can be traced to both initial socio-
economic conditions as well as state agency – policies and measures undertaken by governments
(Ahluwalia 2000; Besley et al. 2007; Kohli 2006; Subramanian 2008). Focusing on state
activism in the context of subnational competition for investment in India after 1991, this paper
addresses the following questions. What role have subnational governments played in attracting
private investment to their jurisdictions? Why have some Indian states been more successful in
attracting investment than others?
6 The term state is used in two contexts in this paper. The first refers to the political and bureaucratic institutions of government. The second, used in this sentence, refers to the tier of government below the federal level in India. In the latter context, the terms state, regional and subnational are used interchangeably. 7 Investment throughout this paper is meant to refer to private industrial investment – domestic and foreign direct investment by the corporate sector. It does not include portfolio investment or investment in agriculture, except for agro-based or agro-processing industry.

4
Neither socio-economic determinants of investment location emphasized by neoclassical
economics and its variants nor several political variables highlighted by cross-national studies of
foreign direct investment can adequately explain regional patterns of investment observed in
India. At a more general level of analysis, factors emphasized by political economy explanations
of growth and policy-making such as colonial inheritance, partisan preferences and ideology,
political competition, ethnic diversity and leadership offer additional hypotheses. However, as
section 6 outlines in more detail, even these theories have limited salience in explaining patterns
of investment observed across Indian states.
In contrast, this paper suggests that, at a proximate level, subnational patterns observed in
India after 1991 can be explained by the varying nature of state agency in investment promotion.
Some subnational governments have been more pro-active and aggressive in attempting to attract
private investment. As a result, both the speed and scope of policies have differed, contrary to
expectations of the convergence hypothesis that posits that units competing for mobile capital
should adopt similar capital-friendly policies (e.g., Andrews 1994; Cerny 1993). A deeper
question automatically follows from this variation. Why have some states been more pro-active
and business-friendly than others? I argue that state activism in relation to investment promotion
is dependent on the nature of electoral coalitions backing governments. In particular, the class
profile of voters who comprise electoral coalitions crucially affects both how investor-friendly
states can be in formulating policy as well as how efficient they are in implementing these
policies. The policy framework, in turn, affects decisions of individual investors and
subsequently aggregate investment outcomes. Figure 1 provides a schematic representation of
the argument.
[Figure 1 here]
Typically, policymakers in units competing for mobile capital face two sets of incentives –
pressures to undertake business-friendly policies and demands arising from the electorate that are
often more redistributive. In developing countries such as India, where decisions involve the use
of limited resources or growth has not been inclusive, the two sets of pressures tend to be at odds
with one another. Electoral coalitions, in turn, determine what goals governments prioritize and
how they balance multiple aims in the context of limited resources. Coalitions are conceptualized
as four types – narrow-right, narrow-left, wide-right and wide-left. I argue that states that have

5
been more pro-active and investor-friendly are backed by narrow-right electoral coalitions. Core
groups of voters in this type of electoral alliance share a similar economically-advanced profile
and business groups are also substantially incorporated in the coalition. The joint presence of
these factors has two consequences. The redistributive pressures exerted by narrow-right
coalitions are more muted than those arising from other coalitions. Second, there are fewer
contradictory incentives for policymakers backed by narrow-right coalitions. As a result, they
can formulate and implement investor-friendly policies in a more consistent and coherent
fashion.
Narrow-left, wide-right and wide-left coalitions stand in contrast to narrow-right ones.
Narrow-left coalitions consist of similarly placed poor groups and there is minimal incorporation
of business interests. The key demands of this coalition are primarily redistributive and there are
considerable challenges to formulating and implementing an investor-friendly agenda. While
wide-left coalitions are similar to narrow-left ones in that business representation is small, the
socio-economic profile of core groups in this coalition is more mixed – some groups are poor,
others are better off. Inasmuch as middle or high income groups are included, this coalition is not
solely focused on redistribution and is more investor-friendly than narrow-left ones. Wide-right
coalitions incorporate business in a more substantial fashion but, unlike narrow-right ones, also
include other groups drawn from more diverse points in the socio-economic spectrum. As a
result, economic interests of wide-right coalitions are more varied and their demands tend to pull
politicians in multiple directions. Thus, governments backed by wide-right coalitions cannot
formulate and implement as coherent and consistent a pro-business agenda as narrow-right
coalitions can but they are typically much more investor-friendly than either narrow-left or wide-
left ones.
To explain the origins of narrow-right coalitions, my dissertation provides an explanation
that highlights the role of identity politics. For a variety of reasons such as the existence of well-
established social arrangements or the presence of low information environments, identity
politics often acts as the primary mode of political mobilization in poor democracies. In such
cases, certain pre-existing cleavage patterns influence party strategies of coalition construction in
a way that allows narrow-right coalitions to emerge.

6
I trace the emergence of specific types of electoral coalitions in Indian states to diverse social
environments and emphasize the key role of caste as the dominant mode of political mobilization
and participation. As a ranked ethnic system, caste is also linked to economic status and caste
groups tend to be largely bound within particular economic classes. Focusing on the dimensions
of numerical size and resource control, my explanation categorizes underlying caste structures
across Indian states into four patterns. These variations influence the nature of political
competition in different ways. In particular, these differences affect the choice of groups that
parties mobilize across states. As a result, particular types of electoral coalitions are more likely
to emerge under certain pre-existing caste configurations. Specifically, the overlap between
numerical strength and entrepreneurial identity inherent in “dominant caste” patterns allows
parties to win electoral majorities with narrow-right coalitions. Other cleavage structures that are
characterized by the presence of numerous small groups make wide coalitions more likely.
The ability of narrow-right coalitions to succeed electorally is aided by the fact that large
groups enjoy significant leverage in India’s first-past-the-post system and parties can rely
disproportionately on such sections. The dependence on specific social vote banks has been
particularly evident over the last three decades with increasing competition and declining
thresholds for electoral success at the subnational level. At the state level in India, parties
routinely form governments with vote shares much lower than 50 per cent.
Though my explanation for the emergence of electoral coalitions begins with a focus on pre-
existing cleavage structures, it emphasizes that coalition formation is not a static process.
Cleavage structures influence party strategies but the latter, in turn, have a feedback effect on
subsequent decisions related to political mobilization. To reflect its dynamic and sequential
nature, I chronologically trace the process of coalition formation in the case studies. In doing so,
I highlight the impact of both cleavage structure and political agency.
In the larger dissertation project, I first draw on evidence from in-depth case studies of four
Indian states – Gujarat, Punjab, Andhra Pradesh (AP) and Bihar – which are treated as “model-
building” cases (Lieberman 2005). I then test the applicability of the core argument on a broader
group of 17 Indian states. In this paper, I provide empirical evidence from two of the four model-

7
building cases – Gujarat and Punjab.8 Socio-economic conditions in these two rich states were
relatively similar at the start of the economic liberalization process in 1991 but their performance
in the competition for investment has diverged considerably. Gujarat has, arguably, been the
most pro-active state in India in the competition for investment while Punjab has been largely
apathetic, despite possessing sound infrastructure and an established industrial base. My
explanation suggests that narrow-right coalitions in Gujarat, which have backed successive
governments since 1990, have allowed the state to prioritize an investor-friendly agenda. In
contrast, Punjab governments have been pulled in different directions by wide-right coalitions. In
response to diverse pressures arising from wide-right coalitions, successive Punjab governments
have resorted to populism. Vicious cycles of competitive populism over the last two decades
have led to a severe drain of the exchequer and the state simply does not have the finances to
create a business-friendly investment climate.
This paper traces narrow-right coalitions in Gujarat and wide-right coalitions in Punjab to
varying cleavage patterns present in the two states. The overlap between numerical and
economic strength of certain groups embodied in Gujarat’s dominant caste structure has allowed
the BJP to build winning coalitions around economically-advanced sections. In comparison,
most social groups, including entrepreneurial ones, are small in Punjab. As a result, parties have
had to rely on a more diverse set of groups to win elections and wide-right coalitions have been
the norm in the state. In addition to these states, my dissertation includes two more in-depth case
studies of Andhra Pradesh and Bihar (not discussed in this paper). The policy commitments of
these two states have fluctuated over time and I argue that these temporal changes are explained
by shifts in the type of electoral coalitions backing governments. The types of coalitions, in turn,
arise due to the specific nature of social cleavages in these states.
This paper contributes to four strands of scholarly work. By highlighting political conditions
conducive to investment in the presence of poor electorates, it has implications for studies on the
politics of growth and policy-making in developing countries. The argument points to a factor –
electoral bases of support – which has been largely ignored by existing theories of investment
location. By focusing on state agency in poor democracies, the paper also contributes to the
developmental state literature. Finally, this paper joins a growing set of subnational studies on
8 Chapter 4 of my dissertation includes in-depth cases of Andhra Pradesh and Bihar and is available on request.

8
India, which highlight the impact of diverse social and political environments across states in
explaining varied policy outcomes within the country.
The rest of this paper is laid out as follows. The next section outlines the empirical puzzle in
more detail, placing it within the larger context of market reforms in India as well as existing
explanations of investment location. Section 3 briefly describes the research design and method
of case selection. Section 4 spells out the argument in more detail. Section 5 includes the
empirical evidence for the argument, first briefly outlining the nature of policy variation across
states and then tracing the argument through two case studies. Studies in the political economy
literature on growth and policy-making offer additional hypotheses and I evaluate my argument
against these explanations in section 6. Section 7 concludes.
2. The empirical puzzle
2.1. The background: market reforms and subnational competition for investment in
India
In response to a balance of payments crisis in the summer of 1991, India embarked on a path
of extensive market reforms. Socialist planning, an inward orientation and an interventionist state
gave way to a more external outlook and decentralized structure that involved a very different
role for the market and the state. The centerpiece of India’s post-independence policy regime –
the industrial licensing system – was virtually eliminated, drastically reducing state control of the
private sector. Private investment supplanted public investment as the main engine of growth and
this in turn had major consequences for the nature and content of policy-making in the country
(e.g., Ahluwalia 2000; Jenkins 1999; Kohli 2004, 2006; Rudolph and Rudolph 2001; Singh and
Srinivasan 2006; Sinha 2005). India also changed its external sector strategy considerably, easing
regulations on foreign investment and gradually liberalizing its trade regime.
The process of economic liberalization had critical political and economic consequences.
One major shift has been in the nature of economic policy-making and the role of the center and
state governments in this process. Prior to 1991, New Delhi enjoyed dominant control of
economic policy but the onset of reforms led to a sharp decentralization of economic decision-
making and brought state governments to the forefront of policy-making. The virtual elimination
of the licensing system in 1991 meant that private investment was no longer subject to

9
geographical constraints by the federal government. This resulted in states competing with each
other to attract domestic and foreign private investment to their jurisdictions. According to
Rudolph and Rudolph, “by the end of the 1990s, state chief ministers became the marquee
players in India’s federal market economy. What has attracted media and policy attention in
recent years is the competition among the states for international attention and for domestic and
foreign private investment” (2001: 1541).
At the same time, growing subnational economic authority was politically reinforced by
parallel transformations occurring in India’s vibrant democracy.9 The decline of the Congress,
the onset of coalition governments at the center, the marked regionalization of Indian politics and
major surges in the participation of lower castes in the populous north – processes that had their
origins in the 1960s but reached their peak in the early 1990s – all led to a vastly different
environment where states began to enjoy new-found political leverage. In short, the era of
reforms has seen a discernible shift in the locus of economic and political power from New Delhi
to the states.
Despite this downward shift of economic and political power, there are considerable
differences in the way subnational governments have reacted over the last three decades. In
contrast to the infamous “Hindu rate of growth” of 3.2 per cent between 1965-66 and 1980-81,
India grew at 6.5 per cent between 1991-92 and 2009-10. These robust national growth rates,
however, have been accompanied by considerable regional differences. In turn, several studies
suggest that the proximate cause of regional growth differentials after 1991 is diverging private
investment levels across states (e.g., Ahluwalia 2000; Besley et al. 2007; Kohli 2006;
Subramanian 2008). As the next section will show in more detail, there has been considerable
divergence in investment patterns across Indian states in the post-1991 period.
Studies in the Indian political economy literature cited above suggest that varying actions of
subnational governments as well as differing initial conditions play a key role in explaining
investment performance. Contrary to some expectations, the state continues to play a critical and
9 By the provisions of the Indian constitution, state governments have jurisdiction in the area of industries, except those declared by parliament to be necessary for defense purposes or expedient to public interest. States also have significant responsibility in most policy areas relevant to investment promotion such as land, electricity, roads (excluding national highways), labor laws, certain taxes, special economic zones and law and order. However, the presence of the industrial licensing system until 1991 allowed the center to control the location of investment.

10
active role in the economic sphere in India, though the nature of its tasks has changed after
economic liberalization.10 However, state agency varies regionally – some subnational
governments appear to be more pro-active and have greater capacity to achieve development
outcomes than others (e.g., Besley et al. 2007; Kohli 2006; Rudolph and Rudolph 2001;
Subramanian 2008). Contrasting the growth experiences of Bihar and Gujarat, Kohli suggests:
“A variety of Bihar’s initial conditions, including the investment climate, are clearly part of this
story. However, it is also the case that repeated governments in Bihar have simply not been
developmental…The absence of state activism for development is costing Bihar dearly” (2006:
1367). This paper thus focuses on the question of state activism in the competition for private
investment and attempts to understand why some states have performed better than others since
1991.
The next section first lays out the nature of variation in investment across Indian states and
then shows that existing theories do not explain these patterns adequately.
2.2. The puzzle of spatial and temporal variation in investment patterns
Table 1 and figure 2 demonstrate the variation in investment patterns across Indian states in
the 1991 to 2010 period while figure 3 demonstrates temporal variation within select states.11
Gujarat and Maharashtra, which have just over 14 per cent of India’s population, received almost
31 per cent of the total number of investment projects and 21.4 per cent of the total value of
investment in the country between 1991 and 2010. To put it in more stark terms, the per capita
investment received by Gujarat between 1991 and 2010 is more than 15 times that received by
Bihar, India’s poorest state, and more than 40 times that received by Kerala, a state much-feted
for its various human development achievements. These spatial patterns also transcend a simple
rich vs. poor state divide. There is variation within groups of high income (based on per capita
levels) states as well as low income states.
[Table 1, Figures 2 and 3 here] 10 Chapter 2 of my dissertation compares measures and policies across states. 11 These are calculations of proposed investment based on data from the Secretariat of Industrial Assistance (Ministry of Commerce and Industry, Government of India). To start a business, investors must file an industrial entrepreneur’s memorandum (IEM) or letter of intent (LOI) giving details on the proposed project. In a few sectors, such as coal and other minerals, investors are still required to obtain licenses. Until recently, investment data was collected by the government at the time that the IEMs or LOIs were filed. This data does not contain details of actual implementation.

11
Theories that stress socio-economic determinants in explaining investment location do
account for some variation in investment seen across Indian states but do not provide a complete
explanation. Neoclassical growth theories such as the Solow model suggest that economies with
lower capital per worker tend to have higher rates of return. As a result, capital is expected to
flow from capital-rich to capital-scarce areas (e.g., Barro and Sala-i-Martin 2004). Empirical
challenges to this view led scholars to include additional factors such as human capital to
standard neoclassical models as well as variables such as political instability, regime type,
property rights and constitutional checks and balances (e.g., Alesina and Perotti 1996; Barro
1991, 1996, 1997; Lucas 1990; Stasavage 2002). Away from neoclassical theories, the economic
geography literature suggests that there are a set of centripetal factors that encourage spatial
concentration of economic activity and firm location such as market size, thick labor markets and
information spillovers but also a set of centrifugal forces such as land, natural resources and
pollution that discourage agglomeration (Krugman 1991, 1998).
The theories mentioned above typically highlight variables such as level of economic
development, market size, infrastructure and human capital as factors that affect investment
location. Figure 4 plots actual values of cumulative investment from 1991-2008 against values of
investment that are predicted by initial socio-economic conditions in 1991, specifically per capita
income (as a proxy for level of economic development), state domestic product (as a proxy for
market size), literacy (as a proxy for human capital) and road density (as a proxy for
infrastructure). As figure 4 shows, socio-economic factors do not provide a complete
explanation – several states lie above and below the line.
[Figure 4 here]
The international political economy (IPE) literature on foreign direct investment stresses
both political factors as well as socio-economic determinants. Political variables highlighted in
the IPE literature include regime type (e.g., Jensen 2003, 2006; Feng 2001), various types of
political institutions (e.g., Henisz 2000, 2002; Knack and Keefer 1995; Stasavage 2002), political
uncertainty (e.g., Brunetti et al. 1998) and participation in international trade agreements and
preferential trade agreements (e.g., Büthe and Milner 2008). Investment patterns observed across
Indian states pose a puzzle even for these theories. Most of the political variables that are
emphasized in the IPE literature are applicable only in a cross-national context. The Indian states

12
included in the larger dissertation project are subject to the same legal, electoral and financial
framework. The subnational research design used automatically controls for several political and
institutional factors such as regime type, property rights, participation in trade agreements,
electoral rules and formal constitutional checks and balances. As such it is not clear what type of
institutions and what sources of political instability affect investment in a subnational context.
The larger project aims to explore these factors.
At a more general level of analysis, explanations of growth and policy-making focusing
on factors such as colonial inheritance, partisan preferences and ideology, political competition,
ethnic diversity and leadership are also relevant to study of investment. These theories are
insufficient in explaining patterns observed, as section 7 demonstrates.
3. Research Design
As existing explanations are insufficient in accounting for subnational patterns observed, my
dissertation first draws on evidence from in-depth case studies of four Indian states – Gujarat,
Punjab, Andhra Pradesh (AP) and Bihar – which are treated as “model-building” cases
(Lieberman 2005). The applicability of the argument is then tested on a broader group of 17
Indian states. This paper includes abridged versions of two of the four main case studies –
Gujarat and Punjab.
The model-building cases were selected on the basis of the procedure suggested in
Lieberman (2005). A considerable portion of the literature on the spatial determinants of private
investment focuses on socio-economic variables such as market size, level of economic
development and human development. A simple cross-section OLS regression was first run
using investment data and initial socio-economic conditions. More specifically, cumulative
investment from 1991 to 2008 was regressed on proxies of four socio-economic variables (level
of economic development, market size, human capital and infrastructure in 1991). Figure 4 plots
actual investment values against those predicted by these socio-economic factors. Employing an
“off- the-line” strategy, four states – Gujarat, Andhra Pradesh (AP), Punjab and Bihar – that are
not well predicted were chosen. Socio-economic variables would have predicted similar levels of
investment in Gujarat, AP and Punjab but the actual outcomes in these states vary considerably
from predicted ones, making the comparison a potentially interesting one.
13
[Figure 4 here]
4. The argument
The core argument of my dissertation suggests that certain configurations of electoral
coalitions are more conducive to the formulation and implementation of an investor-friendly
agenda than others. In particular, narrow-right electoral coalitions, characterized by the joint
presence of similar economically-advanced core groups as well as substantial representation of
business, are most likely to support an environment favorable to capital.
4.1. Conceptualizing electoral coalitions
The central argument focuses on the class base of core voters backing governments. By
core voters, I refer to those who have a strong preference for a particular party and on whom the
party depends significantly for its support. In advanced democracies, the grounds for such
attachment are typically partisan or programmatic. In developing democracies, other
considerations such as identity often form the basis for such predisposition to a particular party.
Coalitions are categorized based on two dimensions – first, the similarity of socio-
economic profiles of core groups and second, the extent of business incorporation. Core groups
can range from poor to economically-advanced and the first dimension tries to capture the extent
to which these sections are similar in terms of their socio-economic standing. In other words, it
looks at whether class bases of core voters are confined or diverse. The second dimension
focuses on the level of business representation in coalitions, which can range from minimal to
substantial. The category of business is assumed to include capitalists controlling large-scale
industry as well as small entrepreneurs. Using these two factors, electoral coalitions can be
classified into four ideal types – narrow-right, narrow-left, wide-left and wide-right. The
classification can be represented as a 2 x 2 (figure 5). The core groups of narrow-right coalitions
share a comparable economically-advanced profile. Such coalitions also incorporate business
interests substantially. Narrow-left coalitions consist of similarly placed poor groups and there is
minimal incorporation of business interests. Finally, both types of wide coalitions consist of
14
mixture of poor and wealthy groups. However, business incorporation in wide-left coalitions is
minimal while it is more significant in wide-right ones.
[Figure 5 here]
For a coalition to be classified as narrow-right, both factors (similarity of socio-economic
profile of core groups and substantial incorporation of business) must be jointly present. Neither
is individually sufficient. For example, a coalition of extremes with substantial business presence
on one end and poor agricultural workers on the other, which would be classified as wide-right,
is likely to place conflicting pressures on politicians. As a result, policymakers are unlikely to be
able to prioritize a capital-friendly agenda as those backed by narrow-right coalitions. On the
other hand, a coalition consisting of similarly placed poor groups may have congruent interests
but these are likely to be purely redistributive and not supportive of a pro-business policy regime.
4.2. Mechanisms – electoral coalitions and policymaking
Policymakers in developing countries trying to attract investment to their jurisdiction are
faced with two distinct pressures – the incentives to undertake capital-friendly policies and
redistributive pressures from the electorate. While most governments in poor and advanced-
industrial societies face such choices, the context in which decisions are made is qualitatively
different in developing countries. In developing democracies, the two sets of pressures arising
from capital and the electorate are often at odds with each other for several reasons. Developing
democracies not only have to face challenges arising from the very nature of late development
but are required to simultaneously balance the imperatives of development and democracy within
a context of limited resources. Creating a business-friendly policy framework requires
governments to offer a variety of incentives, concessions and provide specialized infrastructure
to attract capital to their jurisdictions.12 In doing so, they have to use scarce funds to create a
favorable investment climate. Prioritizing a pro-business agenda has clear opportunity costs and
such costs can result in considerable political contestation in developing countries.13 This is
particularly true in countries such as India where growth has not been inclusive and benefits have
12 Table 2 briefly outlines policies undertaken by governments to attract investment. Chapter 2 of my dissertation focuses on these measures in more detail. 13 For instance, as discussed in chapter 2 of my dissertation, subsidized land provided by governments to private capital in India demonstrates this trend clearly.

15
not been equally distributed. In addition, there is inherently a time-inconsistency problem. While
capital has to be favored in the short-run through policies and measures, benefits of growth
accrue only in the longer-term and are often uncertain. This poses major challenges in building a
political consensus for growth-related aims. In sum, policymakers in poor democracies typically
face a trade-off between capital-friendly goals, on one side, and redistributive imperatives, on the
other.
The key question then is when can states in developing democratic contexts undertake
business-friendly policies? I suggest that the interests of core groups in electoral coalitions are
significant in determining two aspects – the goals prioritized by the state and the balance
achieved between multiple aims. Certain types of electoral coalitions allow policymakers to
prioritize pro-business policies more than others. Specifically, narrow-right coalitions are most
likely to be favorable to creating capital-friendly environments for two reasons. First, the
redistributive pressures generated by narrow-right coalitions are less intense than those placed on
policymakers by wide-right, wide-left or narrow-left coalitions. Second, the confined nature of
economic interests implies that policymakers are not subject to contradictory demands. In other
words, they are not pulled in as many directions as policymakers backed by wide coalitions. As a
result, they enjoy insulation from pressures emanating from below and are able to create
attractive investment climates. In turn, investors respond favorably to these policy signals.
In contrast, narrow-left coalitions generate primarily redistributive impulses for
politicians. As a result, policies formulated by governments backed by narrow-left coalitions are
likely to be far less business-friendly than those undertaken by other coalitions. The two types of
wide coalitions represent intermediate cases. These coalitions share the feature that they include
economically-dissimilar core groups who have varied interests. While business incorporation is
substantial in wide-right coalitions, it is minimal in wide-left ones. Consequently, wide-right
coalitions tend to prioritize business-friendly goals more than wide-left ones. The diverse
pressures arising from both types of wide coalitions require policymakers to balance a variety of
contrasting goals simultaneously. They cannot prioritize growth-related policies to the extent that
those backed by narrow-right coalitions can. These coalitions are also not driven by purely
distributive motives as is the case with narrow-left coalitions. The record of governments
supported by wide coalitions on growth-related outcomes tends to be mixed.

16
4.3. The social origins of electoral coalitions: underlying cleavages, political
mobilization and coalition types
Narrow-right coalitions reflect a conjunction of political and economic power. If such
pro-capitalist coalitions are most amenable to attracting investment, a causally prior question
arises. How do they arise in poor democracies? This paper suggests that electoral coalitions have
social origins and are products of underlying cleavage structures. Beginning with the classic
work of Lipset and Rokkan (1967), the impact of social cleavages in influencing political
competition, especially the nature of party systems, has been widely explored. The argument put
forward here follows this extensive literature in suggesting that social cleavages condition the
nature of political competition and affect the construction of electoral bases of support.
As is the case elsewhere, the central concern for politicians in developing democracies
revolves around constructing electorally-successful coalitions. For a variety of reasons such as
the existence of well-established social arrangements, the presence of low information
environments and weak states, identity politics often acts as the basis of political competition and
participation in developing countries. In such cases where identity politics dominates, both party
strategies related to political mobilization as well as voter attachments tend to be conditioned by
pre-existing social divisions. Most importantly, underlying cleavages determine which groups
parties choose to mobilize and, as a result, determine the nature and composition of electoral
coalitions.
In the context of Indian states, this paper highlights two dimensions related to underlying
cleavages that affect the composition of electoral coalitions. First, I find that group size
influences party strategies related to electoral coalition formation; it determines whether parties
can rely on a few groups to construct electoral majorities or have to depend on a more diverse
base. Both Posner (2004b) and Chandra (2004) point to the effect of group size on political
competition. As Chandra suggests, large social groups that can be collectively mobilized have
been electorally efficacious across institutional contexts. This has been particularly true in FPTP
systems. Conversely, where groups are small, parties have incentives to employ a more catch-all
strategy.
While group size influences the likelihood of parties relying on confined or diverse
electoral bases, I suggest that the inclusion of business interests is linked to the nature of
resource control embodied by certain social cleavages. In particular, in ranked or other

17
hierarchical social institutions, there is often a relationship between social and economic status.
Business interests in such cases tend to be concentrated within specific social groups. In India,
domestic capitalists have typically emerged from those groups that have historically enjoyed
control of either capital or land by virtue of their position in the social hierarchy. If groups that
control economic resources are also numerically sizeable, this allows parties in poor democracies
to construct electoral majorities around these economically-advanced sections. As such, an
overlap between group size and resource control inherent in some cleavage patterns can lead to
an alignment of political and economic power in the midst of poor electorates.
The focus on pre-existing cleavage structures does not imply that political agency is
irrelevant. Indeed, as I outline in the case studies, coalition construction is an ongoing and
sequential process where politicians attempt to manipulate existing categories. In addition,
contextual details are particularly important to understanding specific dynamics of coalition
construction. The next section lays out the explanation in relation to Indian states. An illustration
of how the explanation works across Indian states may make the general framework above
clearer.
4.3.1. The origins of electoral coalitions with specific reference to India
The explanation I advance highlights the central role of caste in Indian politics. This has been
particularly true at the state-level (Chhibber 1999; Jaffrelot 2009). There are a variety of
mechanisms through which caste plays a prominent role in Indian politics – voters are primarily
mobilized on the basis of caste, it plays a crucial role in candidate selection and poll promises
often target specific caste groups. Several ethnic parties also exist at the regional level to
represent interests of one or more specific castes (Chandra 2004). Chhibber and Petrocik (1989)
show that even at the height of its national dominance, the Congress had very distinct caste bases
across states. Caste is equally critical when looking at voters. While not a universal phenomenon,
there tends to be strong similarity in voting patterns among members of individual castes (Brass
1990; Shah 2004; Yadav 1999).
Aside from its role in structuring political competition and participation, one other aspect
related to caste is relevant to the explanation. In India, caste has an overlapping correspondence
with class and social groups tend to be largely bound within particular economic classes in India.
In the broader dissertation, I attempt to demonstrate this by including a mapping of caste and

18
class based on survey data. As Jaffrelot (2009: 3) suggests “they [caste and class] have always
broadly overlapped and they still do, as evident from the National Sample Survey 2000 which
shows a remarkable correlation between caste and one’s standard of living…Unsurprisingly
caste and occupations coincide to a large extent.” In a similar vein, Harriss points out: “we know
that there is no neat mapping between class and caste but there are strong broad correspondences,
for example between land ownership and caste position…In practice, we have to study the
caste/class bases of different regimes in order to address the critical question of balance of class
power” (1999: 3368). This dissertation follows much of the Indian political economy literature
by taking into account the relationship between caste and class when describing electoral
coalitions.
Though caste cleavages remain the primary mode and idiom of political mobilization in
India, they tend to be localized and territorially contained within state boundaries (e.g., Brass
1990; Chhibber and Petrocik 1989; Chhibber 1999; Frankel 1989; Kothari 1970; Yadav 1999,
2004). Placing emphasis on these varied subnational political environments, I focus on two
dimensions – numerical size of social groups and economic resource control – and suggest that
the underlying social cleavages within Indian states can be divided into four basic patterns
(described in the next sub-section). 14 These patterns have led to divergent party strategies with
respect to political mobilization and have affected the nature and composition of electoral bases
of support. In India’s competitive FPTP system, the presence of large groups opens the
possibility that parties can depend disproportionately on such groups to construct electoral
majorities. As a result, they have fewer incentives to target a diverse range of social groups. In
contrast, small group size tends to force parties in India to appeal to a more diverse support base.
A second dimension of resource control inherent in certain cleavage patterns can be linked to
the inclusion of business in electoral coalitions in Indian states. Importantly, certain groups have
enjoyed access to resources, either capital or land, by virtue of their social status. Access to
resources, in turn, has resulted in those groups forming the main business sections in particular
states. The association between ethnicity and capital is particularly evident in the fact that the
social origins of entrepreneurship in India can be divided into two major strands. Entrepreneurs
in the first and older strand have typically emerged from traditional merchant and trading
14 I borrowed the idea of a four-fold caste structure from Atul Kohli. For details on regional patterns of caste, I drew substantially on Frankel and Rao(1989), Kothari (1970), Jaffrelot (2003) , Shah (2004) and Srinivas (1994).

19
communities within the social system. This includes groups such as Banias, Marwaris, Parsis,
Chettiars, Gounders, Khatris, Aroras, Sindhis, Khojas and a variety of other regional variants
(Damodaran 2008; Tripathi and Jumani 2007). Most of these groups occupied the position of
merchants and traders within the traditional social hierarchy. As a result, they enjoyed access to
capital and business networks and emerged as the country’s earliest industrialists. A second,
more recent, strand of entrepreneurs in India have arisen from certain landowning castes, who
have moved from commercial agriculture to industry (e.g., Baru 2000; Damodaran 2008; Sinha
2005). This shift has been particularly true of “dominant castes” such as the Patidars in Gujarat
and the Kammas and Reddys in Andhra Pradesh. The groups that form the bulk of capitalists in
the country have, thus, historically enjoyed control over economic resources, whether capital in
the case of the trading communities or land in the case of the dominant castes. This access to
resources arose as a result of the location of these groups within social hierarchy. As such, the
link between caste and capital remains significant.
In turn, parties mobilize groups primarily on the basis of caste and certain entrepreneurial
groups have been included on account of their social identity. However, the numerical strength
of business groups varies under different cleavage structures, resulting in differing political
leverage of capital across Indian states. In some states, entrepreneurial groups tend to enjoy
numerical strength and it is in such cases that narrow-right coalitions have emerged. The
different cleavage patterns and their effects on coalition construction are described in more detail
below.
4.3.1.1. Four cleavage patterns across Indian states
The first pattern includes states with “dominant caste” patterns, described in the seminal
sociological work of Srinivas (1994). In these states, certain castes, typically non-Brahmin, share
two features – they are numerically preponderant relative to other castes and enjoy considerable
economic power arising of out of landownership. Typically, dominant caste states include two or
more rival groups. States such as Gujarat, Andhra Pradesh, Karnataka, Haryana and Orissa tend
to follow this pattern. In Gujarat and Andhra Pradesh, the traditional access to land of dominant
castes enabled the transfer of surpluses from commercial agriculture into industry. As a result,
these groups came to form a major part of the entrepreneurial base in these states.

20
The second pattern, which is found mostly in the populous Hindi-heartland states of the
north, is one where the caste system conforms to the four varna structure.15 These states have
representation of castes (jatis) from all four varnas; lower castes form the vast majority of the
population but upper castes dominated all aspects of social and political life until the 1990s.
Certain large castes exist such as the Yadavs in Bihar (nearly 12 per cent of Bihar’s population)
and the Jats in UP. Unlike dominant caste states, these large castes did not control economic
resources and were socially marginalized. The entrepreneurial base in these states is thin and the
few producer groups that exist are small in size. One other aspect of the cleavage structure in the
Hindi-heartland has been emphasized by authors such as Jaffrelot (2003, 2009). Upper castes
form a greater proportion of the population in these states than in other parts of India. This partly
explains why their political domination lasted longer in the Hindi heartland than in the south or
west.
The third variation, which exists in southern states such as Tamil Nadu and Kerala, has some
similarities to the traditional varna structure found in the Hindi-heartland in that upper castes
were historically powerful both politically and socially. However, most castes tend to be small
and none is numerically preponderant. The apex of the structure tends to be much narrower with
upper castes forming a much smaller proportion of the population than their counterparts in the
Hindi-heartland, facilitating the emergence of lower caste social movements in the south even in
the colonial era (Jaffrelot 2003). A variety of landowning groups, smaller merchant castes and
some upper castes came to form the entrepreneurial class but tend to be small in size.
Finally, there is a fourth group of states such as Punjab and West Bengal where other
dimensions such as religion have acted in conjunction with caste (Kohli 1989). The cross-cutting
nature of cleavage patterns in these states has resulted in politically-relevant social groups being
small size. As in the southern pattern, entrepreneurial groups also tend to be small. The cross-
cutting nature of cleavages and small group size implies that parties cannot rely
disproportionately on a single social group to create electoral majorities.
15 At the most basic level, the caste system can be conceived of a four-fold ritual hierarchy. The four main macro-groupings or varnas are the Brahmins, Kshatriyas, Vaishyas and Shudras. Outside these four broad groupings of the caste system are the Dalits or scheduled castes, who are considered to be at the bottom of the pyramid in terms of ritual status. Within these varnas lie a multitude of horizontal or segmental categories known as jatis. As scholars have pointed out, the actual operationalization of caste tends to be as jati (e.g., Brass 1990; Chhibber 1999; Kothari 1970; Yadav 1999). Jatis are largely localized.

21
4.3.1.2. From cleavage patterns to electoral coalition types
These different patterns with their attendant mix of numerical size and resource control have
affected party competition and coalition formation in dissimilar ways. Under India’s simple
plurality system, large groups have enjoyed considerable electoral salience and parties have been
able to rely on a small base of support where such groups are present. As such, narrow coalitions
have tended to occur in those states such as Gujarat, Andhra Pradesh and Bihar where
numerically large sections are present. 16 Wide coalitions, in contrast, have been constructed in
states where there are numerous small groups and no group is large enough to dominate
electorally. Parties, thus, have to rely on a relatively diverse base of voters. This tends to be the
case in states such as Tamil Nadu and Kerala as well as West Bengal and Punjab.
The extent of business representation has been determined by the caste-capital link, which
remains significant in India. Parties mobilize primarily on the basis of caste and business groups
tend to be concentrated within particular castes. Though the caste-capital association exists under
all four cleavage patterns described earlier, it is only under dominant caste structures that
business groups enjoy numerical strength. As a result, business groups are electorally-significant
only under dominant caste patterns. The convergence of political and economic power and the
emergence of narrow-right coalitions are, therefore, most likely under such cleavage structures.
The ability of narrow-right coalitions to win elections has been assisted by the nature of
India’s competitive FPTP system, where parties have formed governments with a plurality of
vote. The vote share required to form governments at the state level in in India in the last two
decades has typically fluctuated between 35 and 40 per cent. In states where electoral
fragmentation is high, the threshold for victory has been particularly low.17 In short, elections
can be won with vote shares less than 50 per cent; allowing parties to rely on specific vote banks
rather than creating a diverse base of support. In dominant caste states, the presence of large
entrepreneurial groups has allowed parties to rely disproportionately on these sections. It is caste-
based mobilization that predicates such situations in the first place.
16 Narrow coalitions are not necessarily comprised of a single caste. In most cases, no single caste can provide sufficient electoral support and multi-caste coalitions are a necessity (Chhibber 1999). However, multi-caste coalitions in India do not always include a large number of groups. 17 For example, the average vote share of the largest party in elections in Bihar between 1990 and 2005 was 28.62 per cent.

22
A robust base of capital also exists under the southern Indian and cross-cutting cleavage
patterns. However, producer groups in these cleavage patterns are small. The lack of numerical
strength of single caste groups has meant that parties have to resort to catch-all strategies and
build diverse bases of support. As a result, wide-right coalitions tend to arise in these states.
Finally, the Hindi-heartland, over the last two decades, has seen configurations that are on the
opposite end of the spectrum from narrow-right coalitions. Large caste groups exist in these
states but these groups are also the most economically-marginalized sections of society. As a
result, narrow-left coalitions are more likely to arise in these states and the potential to create
business-friendly coalitions is limited.
While party strategies are predicated on the nature of the underlying cleavage structure, the
process of coalition-building is not static. Political agency matters and politicians have
attempted to aggregate or disaggregate cleavage dimensions with varying success. Since political
competition is also strategic, choices of parties at different points in time are also conditioned by
what their competitors do. In addition, past choices matter in relation to current mobilization. In
short, coalition construction can be thought of as an ongoing process where underlying cleavage
structure makes certain strategies and certain types of coalitions more likely in the first place.
These strategies, in turn, have a feedback effect. Coalitions within a particular state can, thus,
shift over time. To highlight the fact that coalition building is evolving, I chronologically trace
the process of coalition construction in the post-independence period in each of the case studies.
5. Empirical evidence : policy variation and two case studies
The starting point of the explanation is that some states have been pro-active in undertaking
policies and measures to attract investment to their jurisdictions than others. Chapter 2 of my
dissertation lays out policy variation across the four case study states in more detail. In this
paper, I provide a brief summary of these differences. Based on an analysis of industrial policy
documents of state governments, other government documents, interviews and newspaper
reports, undertaken during fieldwork in 2009-10, policies across the four case study states were
compared. Variation is discussed along eight broad dimensions– infrastructure, incentives and
subsidies offered, regulatory environment related to starting and operating a business, labor laws,
government role in land acquisition by industry, creation of special economic zones (SEZs),
institutional infrastructure for industrialization and branding and promotion activities.
23
Subnational governments have substantial, if not sole, jurisdiction in these areas. These
dimensions are also typically highlighted in both policy reports relating to investment climate
and investor surveys as being important (e.g., WorldBank 2005, 2006, 2007B). Interviews with
investors during fieldwork confirmed the salience of these aspects.
Based on the eight areas above, I find that some states have clearly been more pro-active than
others (table 2 provides a brief summary).18 This has meant that the speed and scope of policies
formulated as well as implementation of these policies have differed across the four states and, in
some cases, within these states over time. Among the four case study states, Gujarat and Andhra
Pradesh (between 1994 and 2004) have been more aggressive in their efforts to attract
investment while Punjab has lagged behind. For most of the post-1991 period, Bihar remained
apathetic to investment promotion as well as most developmental efforts in general. However,
there has been a noticeable change in the state over the last six years.
[Table 2 here]
The core argument of this paper suggests that this variation in state agency in the competition
for investment can be explained by the nature of electoral coalitions backing governments. In
turn, these electoral coalitions themselves can be traced to underlying cleavage structures.
Below, I present evidence from two of the four model-building cases in the dissertation – Gujarat
and Punjab. These two states are among India’s richest and both enjoyed strong preconditions for
investment success at the start of the reforms process in 1991. However, the contrast in their
performance has been stark – while Gujarat has been extremely successful in attracting
investment after 1991, Punjab has demonstrated considerable apathy to the competition for
investment. I suggest that this variation can be traced to the nature of electoral coalitions.
5.1. Gujarat – narrow alliances and business-friendly policies
Created in 1960 from the bifurcation of the erstwhile Bombay state, Gujarat has been one of
the most industrialized and prosperous states in the country over the last five decades. Though it
accounts for only 5 per cent of the India’s population, Gujarat is responsible for over 15 per cent
18 A more detailed version of the table is in chapter 2 of my dissertation.

24
of the total output of organized industrial sector in the country.19 Gujarat’s growth performance
in the post-reforms period has been particularly impressive. Between 1991-92 and 2009-10, the
state’s gross state domestic product (GSDP) grew at an average annual rate of over 8.1 per cent
compared to a national average of 6.5 per cent. The state has also been among the top performers
in terms of investment outcomes - between 1991 and 2010, receiving 11.8 per cent of investment
in the country by total value. Gujarat has been extremely pro-active in the competition for private
investment and has been consistently investor-friendly throughout the post-1991 period.
On the surface, Gujarat’s success in attracting investment in the post-1991 period is not
entirely surprising. The region has a long history of entrepreneurship – a thriving maritime trade
existed even in pre-colonial times. In many ways, Gujarat has been a classic developmental state
since its formation in 1960 (Sinha 2005). It has long prioritized growth more than other
objectives and the state has played an active role in the industrial realm. As was the case with
several developmental states in East Asia and Latin America, rapid growth in Gujarat has been
accompanied by illiberal political trends. Strongly majoritarian politics has characterized the
state, particularly since the 1990s, and there have been high levels of social, political and
economic exclusion of certain groups, chiefly Muslims and, to a lesser extent, scheduled tribes
(e.g., Hirway 2000).
While pre-1991 factors have no doubt shaped Gujarat’s response to the competition for
private investment in the post-1991 period, a sole focus on continuity leaves several issues
unaddressed. First, how and why has Gujarat maintained its economic dominance in the post-
1991 period when some other states have managed to squander their pre-1991 advantages? As
the case study of Punjab will show, favorable initial conditions are not sufficient for success in
the competition for investment. Second, Gujarat has been more pro-active and has outperformed
even other high and middle income states. How and why did Gujarat adapt more quickly to
economic liberalization than similarly placed states? These questions merit additional
explanation.
5.1.1. A background of Gujarat’s society and pre-1991 politics
19 Population figures from the Census of India 2011 (provisional tables, Table 1; censusindia.gov.in; accessed May 30, 2011). Share of industrial output calculated from total output data of the factory sector from the Annual Survey of Industries 2008-09, CSO, Government of India (Table 3; mospi.nic.in; accessed May 30, 2011).
25
Gujarat’s cleavage structure exemplifies “dominant caste” patterns. The Patidars are the
main dominant caste in the state. They are numerically sizeable, accounting for over 12 per cent
of the state’s population, and have historically enjoyed economic power through the control of
land (Kohli 1990; Shah 1989).20 Largely involved in commercial agriculture, the Patidars began
transferring surpluses to industry since the late 19th century (Sinha 2005). They now constitute
one of the main entrepreneurial groups in the state. Banias, who account for approximately 3 per
cent of the population, also have a significant presence in industry. Brahmins comprise about 4
per cent of the state’s population and are mainly involved in white-collar professions. Together,
these three economically-advanced castes – Patidars, Brahmins and Banias – have largely
controlled Gujarati politics for most of its fifty-one year history.
The main lines of conflict in Gujarat have been between the aforementioned castes and
another large group, the Kshatriyas. Though strictly a political aggregation of several groups, the
Kshatriyas, who constitute approximately 29 per cent of Gujarat’s population, operate socially
and politically as a caste grouping and have come to represent the main challenge to Patidar
political dominance (Kothari and Maru 1970; Kohli 1990). The Kshatriyas exhibit considerable
economic diversity and include some wealthy sections as well as several poorer sections within
their ranks. The most economically and socially-marginalized groups in Gujarat include Dalits
(7.1 per cent), Adivasis (4.8 per cent) and Muslims (9.1 per cent) of the population.21
For the first decade and a half after its formation in 1960, Gujarat was a one party state
ruled by the Congress. The state’s economically-advanced castes, namely the Brahmins, Banias
and Patidars, overwhelmingly dominated Gujarati politics in this period and the Congress’
internal dynamics reflected their supremacy. Low levels of mobilization of marginalized groups
and intra-elite harmony meant that the state’s politics “had an aura of gentility” (Kohli 1990:
244). Sinha (2005) suggests that the institutional framework for subsequent industrialization was
largely put in place during this period.
20 The 1931 census in India was the last one to collect information on individual castes other than scheduled castes and scheduled tribes. Scheduled caste and scheduled tribe populations are counted in each Indian census. Despite the short-coming of not having updated details on individual castes, most studies on Indian politics, including the ones cited in this paragraph, use the 1931 data and extrapolate from it. I use estimates of individual caste populations from these studies. 21Data from Census of India 2001 (censusindia.gov.in).

26
The general placidity of this early period was jolted considerably in the mid-1970s. One
of the main reasons was high levels of conflict between the state’s two numerically large castes –
the Patidars and Kshatriyas. Until the 1960s, the Kshatriyas had largely been excluded from
power, leading to considerable alienation. By the early 1970s, they were ripe for mobilization
and this was substantially exploited by Indira Gandhi. The split in the Congress in 1969 between
the Indira Gandhi-led Congress (R) and the Morarji Desai-led Congress (O) had major
repercussions in Gujarat and resulted in a realignment of social bases. In response to the
Congress’ increasing leftward orientation and populist commitments, the more conservative
social groups in the party began to search for alternatives. Subsequently, these sections backed
Desai’s wing of the party over Indira Gandhi’s (Sud 2007).
Indira Gandhi, however, managed to prevail over the Congress (O) in Gujarat. As part of
her broader strategy throughout the country, she mobilized weaker socio-economic groups who
had been politically ignored until then. In Gujarat, the numerically large Kshatriyas as well as
Dalits and Adivasis were mobilized through a strong rhetoric of populism and a variety of
redistributive promises. The ascendancy of the Kshatriyas in the Congress, in turn, elicited a
sharp response from the Patidar-Brahmin-Bania alliance. Most notably, their opposition took the
form of the Navnirman movement – which started as a student-led protest against corruption and
inflation but morphed into wider opposition against Congress rule. Throughout 1974, the state
saw a cycle of violence with constant riots, street protests and subsequent government
repression. The protests led to the fall of the government and a coalition of parties under the
Janata formed the first non-Congress government in the state in 1975.
The Congress regrouped and came back to power through a successful electoral strategy
that brought together an alliance of Kshatriyas, Harijans (Dalits), Adivasis (scheduled tribes) and
Muslims under the acronym KHAM. Members of the KHAM alliance were rewarded with
considerable representation in the Madhavsinh Solanki-led Congress government that came to
power in 1980. Almost seventy percent of Solanki’s cabinet was filled by legislators with a
KHAM background, a clear signal to the Patidar-Brahmin-Bania alliance of the changing power
dynamics (Wood 1987). On returning to power in 1985, his policy agenda was far more
controversial. One of the policies Solanki undertook was to institute reservations (affirmative
action policies) for other backward castes (Kshatriyas constitute a major portion of the OBC

27
grouping in Gujarat).Tension between the Brahmin-Bania-Patidar group and the KHAM alliance
had been brewing since the early 1980s over the former’s sudden exclusion from power and the
announcement of reservations proved to be a flashpoint. Six months of rioting and violence led
to the replacement of Solanki by another Congress leader, Amarsinh Chaudhary. Chaudhary
gave into the demands of the protesting elite castes, first dropping several KHAM members from
his cabinet and then putting reservations on hold.
The anti-reservation riots allowed the dominant Patidar-Brahmin-Bania alliance to regain
their political hold on the state, which continues till today (Patel 1999; Shah 1987, 1991, 1996,
2007; Sud 2007). However, this dominance would occur in the 1990s in a new form – the Hindu-
nationalist BJP. What began as an upper-caste student agitation against reservations of the
Solanki government was taken over by the BJP and its affiliates and soon morphed into riots
against the state’s Muslims and lower castes. For Shah (1996, 2007), the anti-reservation riots of
1985 was the crucial point at which the BJP began to reap the rewards of a strategy to cut the
electoral pie across religious lines.
5.1.2. Gujarat in the post-1991 period: BJP dominance and narrow-right coalitions
The major foothold it gained through riots represented the beginning of the BJP’s upward
rise in Gujarat. This period also saw the reassertion of the Patidar-Brahmin-Bania alliance after
the interlude of the 1980s. Since 1990, the BJP has held significant sway – it was part of a
coalition government that headed the state between 1990 and 1994 and has headed governments
almost continuously from 1995.22 Given the levels of anti-incumbency in state politics in India
over the last two decades, this is rare. Since the mid-1990s, the state has become a firmly two-
party state – the Congress competes with the BJP but has not bettered its rival in either a
parliamentary or assembly election since 1995. Compared with other states, politics in Gujarat
has been relatively less populist. New groups have been mobilized both through a Hindu
nationalist plank as well as some targeted welfare schemes; in contrast to less discretionary
redistributive promises elsewhere.
22 The sole exception was a brief period between 1996 and 1998 when a group of defectors led by Shankarsinh Vaghela broke away from the BJP to form a new party, which briefly headed the government.

28
State politics in Gujarat has taken a strongly majoritarian flavor since the 1990s. The
BJP’s agenda in Gujarat, which has mixed Hindu nationalism with Gujarati subnationalism
(“Gujarati asmita”), is aimed at attracting a majority of Hindus in the state while excluding
certain groups, notably Muslims. The most notorious episode in the state’s recent majoritarian
history was the communal pogrom in 2002, where over 2000 people, largely Muslim, were
killed. Since 2001, the state has been headed by its controversial chief minister, Narendra Modi.
Celebrated in business circles for leading an efficient, investor-friendly and relatively clean
administration, he is equally vilified outside these circles for his role in the 2002 riots.
The 1990s has seen a polarization in the social bases of the BJP and the Congress.
Backed by a coalition comprising primarily of three core groups – the Brahmins, Banias and
Patidars – the BJP has won clear electoral majorities over the last decade and a half. In fact,
many authors view the emergence of the BJP itself as a reassertion of Brahmin-Bania-Patidar
dominance after the KHAM experiment in the 1980s ( Shah 2007; Patel 1999; Prakash 2003). As
table 3 shows, a considerable majority of upper castes vote for the BJP in comparison to the
Congress. In particular, support from the dominant Patidars for the BJP is significant. Based on
post-poll surveys, Kumar (2003b) finds that 82 per cent of Patidars voted for the BJP in the 2002
assembly elections while Jani (2009) suggests that 87 per cent of this group supported the BJP in
2009. Interestingly, the BJP’s support decreases among economically-weaker sections of Gujarat
such as the Dalits and Adivasis; these sections vote predominantly for the Congress. The
Congress, however, has not formed a government in Gujarat since 1990.
[Table 3 here]
While the core Patidar, Bania and Brahmin groups have firmly been in the BJP’s fold
since the early 1990s, the party has attempted to widen its base through a combination of Hindu
unity appeals, a stress on Gujarati subnationalism and development programs (Heath 1999; Patel
1999; Shah 2007; Sud 2007). The BJP’s attempts at expansion, however, have seen mixed and
temporary results. It did manage to gain increase its support among some OBC sections,
particularly those such as the wealthier Rajputs in the mid-1990s. However, the BJP, on the
whole, has also failed to divert Dalit and Adivasi support from the Congress in any substantial
measure.

29
In terms of socio-economic profiles, the core groups that support the BJP tend to be
considerably more privileged than those that form the Congress’ base. A majority of richer
groups support the BJP while Congress sees an opposite trend (e.g., Shah 2007). Using their
higher social status, the Brahmins and Banias were the first groups to take advantage of
educational and employment opportunities under the British (e.g., Shah 1987; Wood 1987). By
independence, these groups largely were in white collar professions in urban areas and those that
remained in rural areas were largely landed and wealthy. Until the 20th century, the Patidars were
largely rural, landed and primarily involved in commercial agriculture (Sinha 2005). The
Patidars also had a long tradition of overseas migration from India since the 19th century but
maintained strong links by sending investible surpluses back to their villages. The first four
decades of the 20th century saw a major socio-economic transformation of the Patidars. They
began transferring surpluses accrued through commercial agriculture and overseas migration into
industry. The education levels of this group also began to rise dramatically. The access to
resources and education facilitated the entry of the three elite castes into industry. These groups,
particularly the Patidars, comprise the bulk of the entrepreneurial class in Gujarat (Shinoda
2000). Shinoda’s study also shows that these three groups are dispersed across several industries
and have a strong foothold in the more capital-intensive and technologically advanced sectors of
the Gujarat economy. These castes were the main beneficiaries and supporters of the state’s
industrialization agenda in the 1960s and 1970s and this period witnessed a major expansion in
the Gujarat’s middle class led by these three castes.
5.1.3. Tracing the mechanism – coalitions, interests and policies
The BJP has won comfortable electoral majorities since the 1990s relying on a coalition
comprising three economically powerful and dominant castes. I classify this coalition as narrow-
right. The three castes, Patidars, Brahmins and Banias, comprise the majority of the capitalist
class in the state. Moreover, the core groups have a similar economic profile and representation
from poorer groups is relatively limited. This narrow-right coalition has essentially remained in
place since 1990. The economically-advanced and entrepreneurial nature of this coalition has
allowed Gujarat to prioritize investment and these core groups have been strongly supportive of
the state’s investor-friendly framework.

30
Gujarat in the 1990s has emphasized attracting private investment as one of its chief
aims and it is only very recently that the state has begun to belatedly focus on human
development. Policies have been more business-friendly than elsewhere. Among other aspects,
the state has prioritized infrastructure development, eased the regulatory environment, facilitated
the acquisition of land for industry and offered a variety of concessions. In many ways, Gujarat’s
exclusionary politics and commitment to growth is reminiscent of descriptions of classic East
Asia developmental states (e.g., Evans 1995; Kohli 2004; Wade 1990). Interestingly, Gujarat’s
own policy documents and government rhetoric have viewed the Asian “tigers” as models to
emulate (e.g., Gujarat 2003).
The pro-active role played by the state in investment promotion can be traced to the class
profile of the core groups backing Gujarat governments. Redistributive pressures on the state
have been relatively less intense than those seen elsewhere in the country. The entrepreneurial
nature of the BJP’s core groups has allowed the party to prioritize investment over other
concerns. Populism has also not dominated politics in Gujarat as it has in other states. The
mobilization of new groups has been mainly attempted through emotional appeals of Hindu
nationalism with some targeted welfare measures. The government has generally tended not to
reward electoral support through large populist schemes such as free electricity as other state
governments have. The finances of the state have remained buoyant, letting the state focus on
improving its business environment and building infrastructure. In short, the composition of
Gujarat’s electoral coalitions and the nature of their interests have allowed the state to create a
policy regime that is extremely favorable to attracting private investment.
5.1.4. Explaining the emergence of narrow-right coalitions in Gujarat
Under dominant caste patterns in Gujarat, certain groups in Gujarat are numerically
preponderant and historically enjoyed over resources, particularly land. The combination of
numerical strength and resource control, in turn, has predicated the emergence of narrow-right
coalitions. The size of the dominant castes has allowed parties, particularly the BJP since the
1990s, to construct successful electoral coalitions around this group. The BJP has supplemented
Patidar support with that from Brahmins and Banias to create electorally-successful coalitions.
These three castes are also largely entrepreneurial; their entry into industry can be traced to their
access to economic resources arising from their social position. The rival to the BJP in the state –

31
the Congress – has since the 1970s built its electoral base around another large caste - the
Kshatriyas - as well as Dalits, Adivasis and Muslims. This core groups in the Congress’ coalition
are economically-weaker than those of the BJP.
The timing and emergence of these distinct electoral coalitions of the Congress and BJP
reflect shifting mobilization strategies of these two parties. Gujarat witnessed Congress
dominance until the 1970s and control of party politics lay in the hands of a set of Patidar,
Brahmin and Bania elite. Though numerically sizeable, the Kshatriyas had been excluded from
the top rungs of power of the Congress for the first decade after Gujarat’s formation and were
looking for alternative channels. The emergence of Indira Gandhi and the split in the Congress in
1969 would provide the avenue for Kshatriya political expression and have major consequences
for the future of Gujarat’s politics. As part of her battles with the Syndicate – a coterie of
regional leaders who controlled power within the Congress – Indira Gandhi would come to
mobilize the poor throughout the country through populist promises. Her broader political
agenda in the country would result in a realignment of the support base of Congress in Gujarat.
This realignment set the stage for much of the political change that followed in the next thirty
years.
From a party that was once dominated by the Patidars, Brahmins and Banias, the Congress in
the 1970s would come to build its base around Kshatriyas, Dalits, Adivasis and Muslims. Under
Indira Gandhi’s direction, the party would put in place a strategy of predominantly nominating
backward castes, tribals and Muslim candidates on the party’s tickets (Sud 2007). By
successfully mobilizing the Kshatriyas along with the Harijans (Dalits), Adivasis and Muslims
(the strategy came to be known by its acronym KHAM), the Congress stormed back to power in
Gujarat in 1980 after losing the 1977 elections. On returning to power in 1985, the Congress
under Madhavsinh Solanki, even more controversially, attempted to institute reservations
(affirmative action policies) for the other backward castes (OBCs) and Dalits, who comprised a
considerable portion of the KHAM alliance. This would trigger a violent response from the
Patidar-Brahmin-Bania group in the form of anti-reservations protests.
These protests provided an opening for the BJP as it took over the riots and managed to shift
it to a movement against Muslims and lower castes. Eventually the dominant Patidar-Brahmin-
Bania alliance managed to regain their political control of the state through the BJP, a position

32
they continue to hold (Patel 1999; Shah 1987, 1991, 1996, 2007; Sud 2007). The BJP has built
its base around these three core groups. Though it attempted to expand its base to backward
castes, Dalits and Adivasis, this strategy has only had limited success. In sum, coalition
construction in Gujarat has been largely predicated on the underlying caste structure. The
numerical size of the Patidars and Kshatriyas allows parties to build narrow coalitions around
these groups. In addition, the entrepreneurial nature of certain castes allows for the distinct class
composition of the BJP’s electoral bases.
5.2. Punjab – wide-right alliances and competitive populism
In contrast to Gujarat, Punjab has been slow to react to the post-1991 environment despite
possessing sound infrastructure and a relatively well-developed industrial base prior to reforms.
Created in 1966, Punjab is India’s only Sikh majority state. For most of India’s post-
independence history, the state had the highest per capita income in the country. While the state
has seen higher levels of prosperity than most other parts of India, it also has a long history of
political crises and violence. Punjab was partitioned between India and Pakistan in 1947 and, as
a result, witnessed tremendous levels of displacement, turmoil and violence. The state, however,
managed to recover and was at the forefront of the Green Revolution in the 1960s and 1970s.
Political troubles once again surfaced in the form of a Sikh separatist movement in the late 1970s
and 1980s. The period of militancy came to an end in the early 1990s and the state has remained
peaceful since then.
Punjab has historically been the grain bowl of India. Though the state is mainly rural (almost
70 per cent), agriculture contributes only a quarter of the state’s gross state domestic product
(GSDP) while industry and services have larger shares of nearly 32 per cent and 44 per cent
respectively.23 Though agriculture is a vital part of the state, a vibrant small-scale industrial
sector exists in the state. Since 1991, however, Punjab began regressing economically and both
agricultural and industrial growth stagnated. Despite being in the throes of militancy for most of
the 1980s, the state’s industrial growth was well above the national average. However, the return
of peace in Punjab coincided with slow industrial growth. While Punjab’s manufacturing growth
between 1980 and 1990 was 9.32 per cent, it decelerated to 5.74 per cent between 1991 and
23 GSDP data from Central Statistical Organization, Government of India (mospi.nic.in).

33
2001. Authors suggest that the state’s rich agricultural base, infrastructure and entrepreneurial
culture provided excellent pre-conditions for industrial growth at the start of the reforms process
in 1991 but the state has simply been too slow and apathetic to adjust to the needs of economic
liberalization (Ahluwalia et al. 2008; Singh 2005).
This section will argue that the state’s indifference towards attracting investment can be
traced to the nature of the electoral coalitions that have backed various governments since the
early 1990s. The contradictory interests and demands of Punjab’s electoral alliances have
necessitated a complex balancing act on the part of several governments. This has, in turn, led to
a vicious cycle of competitive populism that has drained the state’s finances and adversely
affected the state’s ability to attract investment. Resources aside, the predominantly agricultural
nature of these coalitions has also meant that policy-makers have weak electoral incentives to be
industry-friendly.
5.2.1. Brief background of society and pre-1991 politics in Punjab
The story of Punjab’s politics has been one of interactions between three different sets of
cleavages – religion, a rural-urban dimension and caste. Punjab since 1966 has been the only
Sikh majority state in the country. Sikhs comprise almost 60 per cent of the state’s population
while Hindus account for approximately 37 per cent.24 Historically, there has been a mapping
between the religious and rural-urban dimensions in Punjab. Sikhs have been largely rural while
Hindus were primarily involved in trade and commerce and largely identified as an urban group
(Kumar 2006; Wallace 1989). Urbanization has blurred these boundaries over time. Sikhs and
Hindus in the state have, largely, not acted as a coherent political entity and internal divisions
within these groups have been vital. Both caste and rural-urban distinctions exist, dividing Sikhs
and Hindus internally.
Unlike most other Indian states, caste has operated in conjunction with other cleavages.
The cross-cutting nature of cleavages has meant that politically-relevant groups are of a small
size. The Jats, a predominantly landowning agricultural caste present among both Hindus and
Sikhs, are among the state’s larger social groups. They comprise approximately 35 per cent of
the Sikh population (Wallace 1989). Punjab’s Dalits comprise 28.9 per cent of the state’s
24 Data from Census of India (2001), accessed from indiastat.com.

34
population, the highest proportion in all Indian states.25 Dalits, who are also found among both
Hindus and Sikhs, have, however, not been mobilized politically as a single group. Among the
twice-born castes, Brahmins tended to have a small presence in Punjab (3.7 per cent) while
Rajputs are more sizeable (8.3 per cent).
In the immediate post-independence period, Punjab witnessed the dominance of the
Congress. In the early 1950s, the SAD, the main party representing the Sikhs, began making
demands first for a Sikh majority state and then for a separate Punjabi-speaking state (“Punjabi
Saba”). The demand, however, was rejected by the States Reorganization Commission. Despite
fraying Hindu-Sikh cooperation in the state, communal conciliation and accommodation
essentially characterized the 1950s due to a leader of considerable strength within the Congress –
Pratap Singh Kairon. As a Jat Sikh with a strong Nehruvian nationalist bent, Kairon was able to
bridge Hindu and Sikh concerns. Kairon also reformulated the Congress’ pre-independence
support base to create a coalition that was more fully representative of religious, class, caste,
rural-urban and regional dimensions of Punjab’s polity. By including a variety of elector profiles
within its fold, the Congress’s strategy was to appropriate the political middle ground (Wallace
1989). The party has continued to adopt the same strategy.
Factional politics weakened the Congress in the 1960s. At the same time, the SAD began
to reiterate its demands for a separate Punjabi Saba. With mounting pressure on the eve of the
Indo-Pakistan war in 1965, the Congress high command in New Delhi agreed to the creation of a
separate Punjabi-speaking state in March 1966; resulting in the borders of Punjab being redrawn.
The early to mid-1970s was a period of considerable change and turmoil at the national level
with Indira Gandhi first consolidating her power and then leading India into a brief tryst with
authoritarianism. During the Emergency, Indira Gandhi tried to make overtures to the SAD in
Punjab but the party was highly critical of her methods and supported the opposition Janata
coalition. On the back of popular discontent with the Emergency, the Janata unseated the
Congress at the national level for the first time in India’s history in 1977. In Punjab, the SAD-
Janata coalition won the 1977 assembly elections, though the government fell only two years
later.
25 Data from Census of India 2001 (censusindia.gov.in)

35
The Janata collapse paved the way for a particularly violent period in the 1980s when
Sikh militancy came to the fore in Punjab. Indira Gandhi and the Congress stormed back to
power in 1980. In a bid to undercut the SAD’s influence with Sikhs, the Congress propped up an
extremist preacher, Jarnail Singh Bhindranwale, in the late 1970s. Over the next few years,
Bhindranwale would come to lead a violent secessionist movement that demanded the
independence of a separate Sikh state, Khalistan, from India. The situation would come to a head
in the summer of 1984 when Operation Bluestar was mounted by the Indian army in an attempt
to remove Bhindranwale and his group from the Golden Temple in Amritsar, Sikhism’s holiest
place of worship where the militants had set up camp. Though successful in killing
Bhindranwale and his followers, the heavy-handed approach of the Indian army served to
exacerbate the situation and create sharp polarization between Hindus and Sikhs. Operation
Bluestar would also end up claiming Indira Gandhi’s life – she was assassinated in October 1984
by her Sikh bodyguards in retaliation. In turn, her killing would spark major riots in New Delhi
and surrounding areas.
Rajiv Gandhi, who succeeded his mother as Prime Minister, would adopt a more
conciliatory approach. Several steps were taken towards a solution, including a peace accord in
1985 with the moderate leader of the SAD, Sant Longowal. However, violence continued over
the next few years. Sikh militancy, however, turned excessively violent in the late 1980s, which
led to rapidly declining support for the Khalistan movement (Jodhka 2005; Van Dyke 2009).
Through considerable military force and some carrots over the next few years, the Indian
government managed to regain its hold on the state. Punjab saw a return to peace and the
Khalistan movement virtually ended by the early 1990s (Kumar 2006; Kumar 2003a; Singh
1998).
5.2.2. Post-1991 politics and social bases of electoral support
With a return to peace, Punjab has seen a bipolar configuration with the SAD and
Congress as the main parties. The BJP has emerged as a third party with considerable clout and
has had formal alliances with the SAD since 1997. Punjab has seen high levels of anti-
incumbency in the 1990s. The Congress won elections in 1992 and 2002 while the SAD-BJP
combine was in power from 1997 to 2002 and has been heading the state since 2007. With the
end of separatism in Punjab, political articulation along religious lines began to subside. Jodhka

36
(2005) suggests that religion had been sole axis of politics in the 1980s during the height of
militancy and, with “normal politics” returning to the state, caste, class and regional interests
have come back to the forefront.
This return to “normal” politics has meant that parties have once again been forced to
balance a variety of different pressures. This is particularly evident in the approaches of the two
main parties to political mobilization and coalition-building. Outflanked by the largely Sikh SAD
and the Hindu-nationalist BJP, the Congress since the mid-1950s has been a catch-all party and
its support continues to be derived from a diverse social base that cuts across religion, caste,
class and region (table 4a and 4b). I classify these as electoral coalitions as wide-right. Its base
consists of a range of socio-economic profiles including agricultural, industrial, upper caste and
scheduled caste groups. The Congress can also be considered marginally less rural than the SAD
but this difference is not substantial. Most Punjab governments have, first and foremost, to cater
to the state’s powerful agricultural sector.
[Table 4a and 4b here]
The SAD’s strategy has been somewhat distinct from the Congress. As a predominantly
Sikh party and more specifically one dominated by the agricultural Jat Sikhs, electoral alliances
have been a necessity for the SAD. The core support base of the SAD and its appeal as a
primarily Sikh party has meant that it has to seek a broader alliance to create an electoral
majority. Since the mid-1990s, the SAD has worked to enlarge its predominantly Sikh vote base
through a formal coalition with the Hindu-nationalist BJP and the alliance won state assembly
elections in 1997 and 2002. The SAD-BJP alliance has succeeded electorally because of the
complementary nature of the social bases of the SAD and the BJP – the former’s core base is
predominantly agricultural and Sikh while the latter’s mainly urban and Hindu. The coalition
includes representation of business interests, chiefly through the BJP’s Hindu groups. As in the
case of the Congress, the coalition backing SAD-BJP governments is also classified as wide-
right due to the fact that it includes a diverse range of socio-economic profiles as well as
representation of business interests.

37
5.2.3. Tracing the mechanism – wide-right coalitions to competitive populism
Given the interaction between various cleavage dimensions, social groups in Punjab
generally lack numerical strength. Support from a broad range of voters has, thus, been vital to
electoral success in Punjab in the post-1991 period. Both the Congress and SAD-BJP
governments have been backed by wide-right coalitions in the 1990s. Incorporation of groups
with a diversity of socio-economic profiles has, however, pulled various Punjab governments in
different directions. This has led both Congress and the SAD-BJP governments to balance
diverse demands through pure populism (e.g., Kumar 2006; Kumar 2003a; Singh 1998). Punjab
has a long tradition, dating back to the Green Revolution in the 1960s, of placating groups
through subsidies of various kinds such as fertilizer concessions and free electricity. Such
populism has taken a more intense form since the 1990s.
In many ways, competitive populism has been the dominant pattern of politics in Punjab
since the mid-1990s. The question of who receives free electricity is one such issue that has been
contested vigorously and provides insight into the type of politics prevailing in the state. “The
politics of populism introduced new competition among various sections of the population. It
was alleged that Mr. Badal’s [the chief minister of the SAD-BJP government] populism is pro-Jat
peasantry and it discriminates against other sections of society. For instance, the Bahujan Samaj
Morcha, an ally of the Akali Dal (Badal), asserted that the Punjab Chief Minister’s decision to
give free electricity to farmers created a wide gap between the farming community, those living
in urban areas and Dalits [scheduled castes]…In response to these assertions, the state
government decided to give free domestic power up to 30 units each per month to those
Scheduled Caste consumers who had a sanctioned load of not more than 300 watts. The effort of
the state government to appease the Scheduled Castes and Backward Castes did not succeed. The
Badal government was accused of betraying the weaker sections by fixing the 300 watt limit,
whereas no limit was fixed in case of farmers” (Kumar 2003: 386).26
Such complex balancing through populism has detracted from investment promotion in
several ways. Populist schemes have meant that there is little money left for industrial
infrastructure. Punjab has the highest per capita consumption of electricity in the country and
26 Italics mine.

38
free electricity to groups has greatly strained the state’s weak generation capacity. Since
agricultural interests are politically powerful, the solution of various governments to the
electricity problem has been to enforce weekly mandatory cuts. Land is another major constraint
in attracting new investment to the state. The Punjab government has chosen not to get involved
in land acquisition for industrial purposes due to the fear of loss of agricultural support.
Populism and the financial strain it places on the state have meant that the state is also unable
to deliver on concessions promised in industrial policy statements. As a result, it enjoys low
credibility among business and this was made amply clear in interviews with investors in the
state. On being asked to identify the main strengths and constraints of investing in the state, one
investor suggested: “Frankly, why would you invest in Punjab in manufacturing if you are sane?
We have roots here. We are part of the SME [small and medium enterprise] sector and SME
guys cannot move. Large firms can. Hero has moved out of Punjab. Mittal has moved out. Only
the SME firms stay here.”27 Another businessman was equally unambiguous and commented
that: “The Punjab government’s interest in industrialization is zero. All the government is
interested in is working on its vote bank. The vote bank is agriculture... The main interest of the
government is in buying these votes.”28
Low credibility of the government is compounded by the fact that agricultural income in
India is typically not taxed. In Punjab, this has meant that the industrial and trading section,
which are mostly urban, are disproportionately taxed. However, they see very little benefit as a
considerable portion of the government’s finances ends up as subsidies to rural groups. Industry
in Punjab has contrasting demands from agricultural sections and is opposed to measures such as
free electricity to farmers, which they see as adversely affecting the state’s finances and,
subsequently, its ability to develop industrial infrastructure and deliver public services. Punjab
has, at times, levied local taxes such as octroi and entry taxes on inputs, which are paid by
industry. These taxes were virtually abolished in most other states due to their adverse effect on
industrial growth. Unable to tax agriculture in any form because of its political clout, the state
continues to impose levies on industry instead.
27 Interview, May 6, 2010. 28 Interview, April 20, 2010; Ludhiana.

39
5.2.4. Cross-cutting cleavages and party strategies: tracing the emergence of Punjab’s
wide coalitions
Punjab is relatively unique in that no single issue has dominated politics in the state for a
long period of time. The only exception was the period of Sikh militancy in the 1980s, when
religious differences dominated (Jodhka 2005). The underlying cleavage structure in Punjab is
such that parties cannot depend on a few social groups to win elections. Wallace points out that
accommodation is essential to political success in Punjab as “no one group is sufficiently large,
no issue is so encompassing, no sub-region so significant to provide the necessary support base”
(1989: 464). As such, parties have to build support across a range of social groups. Wide
coalitions are, therefore, a necessity in Punjab. Both SAD-BJP governments as well as Congress-
led ones have been backed by wide-right coalitions, comprising groups with dissimilar economic
interests as well as representation of business.
Caste, class, rural –urban divisions and region have divided Sikhs and Hindus internally
and such segmentation has found political expression. Compared with other other groups, Jat
Sikhs constitute a sizeable group in Punjab. The SAD’s leadership has been predominantly from
this group and Jat Sikhs also constitute the core of the party’s vote base. However, the support of
Jat Sikhs alone cannot ensure electoral majorities. Moreover, the SAD has not been able to
mobilize the Sikhs as a single group due to internal caste and other differences. For example,
Dalit Sikhs, who are largely landless agricultural laborers, do not identify with the landowning
Jat Sikhs. As a result, the Dalit Sikhs vote largely for the Congress rather than the SAD as they
perceive the latter as being dominated by Jat Sikhs.
These lines of conflict have acted as constraints on coalition construction, particularly for
the SAD. Knowing that Jat Sikhs are not large enough to ensure an electoral majority and
recognizing that its appeal is limited, the SAD has relied on formal electoral alliances with the
BJP. The complementary nature of core support – the SAD’s largely rural Sikh base and the
BJP’s urban Hindu base – has been electorally successful. In addition, the alliance with the BJP
also had symbolic value; allowing the SAD to throw of its “anti-national” tag and establish its
mainstream credentials as a party that believed in India’s parliamentary democracy (Jodhka
2005). Like SAD-BJP governments, the Congress too has been backed by wide-right coalitions.
Since Pratap Singh Kairon’s time in the 1950s, the Congress recognized that it was likely to be

40
outflanked by the rural and Sikh SAD as well as Hindu-right parties such as the Jan Sangh and
the BJP. As a result, the Congress since the 1950s has chosen to capture the middle ground in the
state and appeal to a cross-religious, cross-regional, cross-caste and cross-class base.
In sum, cross-cutting cleavage patterns in Punjab have meant that social groups tend to be
small. While entrepreneurial groups exist, they lack numerical strength. As a result, both parties
have been backed by wide-right coalitions when in power.
6. Alternative explanations
The explanation laid out in this paper stands in contrast with theories of investment location,
as outlined in section 2. Apart from these theories, factors highlighted in political economy
explanations of growth, public goods and policy-making such as colonial inheritance, ethnic
fragmentation, partisan preferences and ideology, political competition and leadership are also
relevant to a study of investment and offer additional hypotheses. In this section, I evaluate the
relevance of alternative theories in explaining patterns of investment across Indian states.
6.1.1. Colonial inheritance
Several scholars trace divergent patterns of development to the varying nature of colonial
institutions (e.g., Acemoglu et al. 2001; Engerman and Sokoloff 2000; La Porta et al. 1999). In
relation to India, this line of research highlights the impact of two different sets of colonial
institutions on regional development outcomes – nature of land tenure systems and direct vs.
indirect British rule. Banerjee and Iyer (2005) find that areas previously under the zamindari
system (a landlord-based system) exhibit significantly lower levels investments and productivity
in agriculture as well as inferior outcomes in health and education when compared with ryotwari
regions (where property rights were assigned to peasant cultivators).
Scholars have also found the degree of British rule has influenced development outcomes.
Between 1858, when the Crown formally took over administration from the East India Company
to independence in 1947, about one-third of the Indian population was under indirect rule of
more than 560 native princes and rulers (Metcalf and Metcalf 2001). Except for external affairs
and defense, which were controlled by the British, these “princely states” had considerable
autonomy in internal administration. Banerjee et al. (2005) as well as Iyer (2010) find that areas

41
previously under direct British control had lower access to public goods in the post-
independence period than areas under indirect rule of princely states.
Two broad hypotheses derived from these studies are relevant to investment outcomes – first,
economic performance is likely to be worse in zamindari areas and, second, regions previously
under princely states should fare better than those under direct British rule. However, these
hypotheses are insufficient in explaining patterns observed. For a start, there is temporal
variation in the levels of investment attracted by states and colonial institutions cannot explain
this aspect. The current boundaries of Indian states, which were drawn on a linguistic basis, do
not correspond to those of colonial institutions. The four case studies in the dissertation contain
within them areas that were under both direct and indirect rule. Yet outcomes vary significantly.
Similarly, the boundaries of two case study states – Bihar and Andhra Pradesh – include
significant zamindari areas. Despite this, the two states have performed very differently. Much of
Punjab was subject to neither zamindari nor ryotwari systems, pointing to the role of alternative
factors.
6.1.2. Partisan preferences and ideology
The political economy literature arising from advanced-industrial countries suggests that
parties on the left and right have distinct economic objectives and these preferences affect the
choice of economic strategies pursued by governments (e.g., Alvarez et al. 1991; Boix 1997a,
1997b, 1998; Garrett and Lange 1985). Studies analyzing market reforms in Latin America and
Eastern Europe also point to the role of ideology in affecting economic policy choice and
implementation (e.g., Murillo 2005, 2002; Murillo and Martinez-Gallardo 2007).
In contrast to advanced-industrial countries, the ideological positions of Indian parties tend to
be far more fluid. This is particularly true at the regional level where ideological moorings and
policy positions often fluctuate significantly and various examples point to this. Jenkins (1999),
Kohli (forthcoming) and Varshney (1999) all point out that there has been general agreement on
the basics of the economic policy agenda at the national level, irrespective of whether the center-
left Congress or right-wing BJP have been in power. As the Andhra Pradesh case in my
dissertation outlines, the TDP under N.T. Rama Rao openly opposed economic liberalization in
its 1994 electoral campaign. Yet, Chandrababu Naidu, who replaced Rao as TDP party president

42
and chief minister that year, shifted the TDP’s economic position firmly to the right on coming
to power (Kennedy 2004). A particularly well-publicized case of ideological ambiguity was the
attempted re-invention of the Communist Party of India - Marxist (CPI-M) in West Bengal as
business-friendly since the mid-1990s. Commenting on the West Bengal case, the Economist
(2006) pointed out: “India's two Communist parties are more powerful and more contradictory…
Traditional left-wing policies such as land reform have now been supplemented under the state's
[West Bengal’s] chief minister, Buddhadeb Bhattacharjee, by a keen search for foreign
investment, and support for privatization – ideas that the party shuns at a national level.”29 While
the CPI (M) was reinventing itself as a business-friendly government in West Bengal, the same
was not true in Kerala where it has also led the government.
Parties also adopt contradictory positions at different times on the same issue. The cases of
labor reform and foreign investment provide excellent examples. At the federal level, both the
BJP and the Congress have attempted to implement market-friendly labor reforms when in
power but have blocked these very same measures when in opposition (Jenkins 2004; Venkata
Ratnam 2004). As an opposition party in the early 1990s, the BJP opposed foreign investment
openly, advocating a national self-sufficiency (“swadeshi”) agenda, but actively liberalized the
FDI regime when in power between 1999 and 2004.
Finally one other distinction with advanced-industrial countries and Latin America needs to
be noted. A formal link between leftist parties and labor unions forms part of the partisanship
explanation in several studies (e.g., Alvarez et al. 1991; Murillo 2005). India offers a very
different environment with 92 per cent of the total workforce employed by the unorganized
sector (Sengupta 2007). Organized labor is also highly fragmented – estimates suggest that there
are over 50,000 trade unions in India, which are split between 10 major trade union federations
affiliated to different political parties ranging from the communist parties on the left to the BJP
on the right (Teitelbaum 2006).
Rather than a focus on partisan preferences along a standard left-right dimension, the
explanation in this paper suggests that policies and measures undertaken by subnational
governments is influenced by the nature of electoral coalitions. The fluidity and the variation in
29 Italics mine.

43
partisan economic positions across states can, in turn, be explained by the fact that these
coalitions differ across states as well as within states over time.
6.1.3. Political competition
Dimensions of political competition have been linked to both policy adoption as well as
economic performance (e.g., Besley et al. 2010; Bueno de Mesquita et al. 2001; Chhibber and
Nooruddin 2004; Frye 2002; Murillo and Martinez-Gallardo 2007; Pinto and Timmons 2005).
While this dissertation broadly suggests the nature and trajectory of political competition matters
for investment outcomes, it differs from these studies in terms of the mechanisms emphasized.
These studies offer varied explanations on the effects of political competition. However, one
hypothesis can be adapted to investment patterns. Bueno de Mesquita et al. (2001) argue that
regimes characterized by smaller winning coalitions are more likely to deliver private goods
while those backed by larger winning coalitions are more likely to provide public goods.
Building on this insight, Chhibber and Nooruddin (2004) find that there is greater provision of
public goods under two-party competition in India than multi-party competition. If we adapt this
hypothesis and treat investment outcomes as a public good, we might similarly expect an inverse
relationship between investment and party system fragmentation. However, there is no evidence
of a significant relationship between fragmentation and investment outcomes in either direction.
The case studies also point to variation in investment outcomes within states that have relatively
similar levels of party fragmentation. Gujarat and Andhra Pradesh are both two-party states and
have differed. Punjab is bipolar but performs considerably worse than these states. Temporal
variation has also occurred when party system fragmentation remained broadly the same.
6.1.4. Ethnic fragmentation
Scholars have argued that ethnic heterogeneity has a negative impact on various outcomes
including growth, public goods provision and government performance (e.g., Alesina et al. 1999;
Alesina and La Ferrara 2005; Easterly and Levine 1997; Miguel and Gugerty 2005; La Porta et
al. 1999). However, ethnic fragmentation falls short in predicting investment patterns. For a start
ethnic fragmentation, which is relatively constant, cannot explain temporal variation within
states. In terms of the case studies, Gujarat, AP and Bihar perform very differently in the
competition for investment but have relatively similar ELFs (0.199, 0.201 and 0.281

44
respectively).30 Finally, explanations of ethnic heterogeneity typically rely on the ethno-
linguistic fractionalization (ELF) index as a measure of fragmentations. As authors such as
Posner (2004a) point out, the index suffers from several problems and may bias conclusions.
While ethnicity plays a role in my paper, I suggest that it is not fragmentation per se that matters.
I argue that underlying cleavages affect party strategies related to mobilization and political
agency also has to be taken into account in coalition-construction.
6.1.5. Leadership
In interviews during fieldwork, businesspersons often cited political leadership as one of the
strengths or weaknesses of investing in particular states. Chief ministers such as Narendra Modi
in Gujarat, Chandrababu Naidu in AP, S.M. Krishna in Karnataka and Naveen Patnaik in Orissa
and Nitish Kumar in Bihar have also been celebrated in the media as being responsible for
economic transformations in their states. The Rudolphs (2001) too highlight the role of
individual agency. While I do not dismiss the claim that leadership matters, it suggests that
leaders need to be viewed as an intermediate part of the chain that links coalitions to investment
outcomes. Arguments that focus solely on leadership neglect the question of where and how
preferences and constraints on individual leaders originate. It is in this context that the role
played by electoral coalitions is significant. In and of itself, strength and tenure of leadership has
neither been necessary nor sufficient in creating favorable investment climates in India as
examples of leaders such as Mayawati in Uttar Pradesh or Laloo Yadav in Bihar suggest. Sinha
(2004) points out how Gujarat performed exceedingly well after despite having considerable
seeing seven different chief ministers in the first decade after liberalization. Thus, investor-
friendly agendas of certain chief ministers need to be viewed as products of broader coalition
interests rather than merely individual predilections.
7. Conclusion
From the point of view of an extensive literature on redistribution, which predicts that high
growth in poor democracies is unlikely, India’s rapid growth over the last two decades is
puzzling. In contrast to such expectations, India’s economic transformation has taken place in the
midst of high levels of political competition in a largely poor and rural electorate. Driven by
30 ELFs calculated here are based on data on religion from the Census of India (2001).

45
India’s experience, this paper aims to understand the political conditions conducive to high
growth in poor democracies.
Examining a specific empirical puzzle related to investment – a key driver of growth – across
Indian states, this paper argues certain configurations of electoral coalitions allow policymakers
to prioritize growth-related concerns such as investment more than others. In particular, narrow-
right coalitions, characterized by core groups with similar economically-advanced profiles as
well as substantial representation of business interests, are most conducive to the formulation and
implementation of an investor-friendly agenda. Redistributive pressures generated by such
coalitions are less intense and policymakers can prioritize growth-related issues over other
competing concerns. As such, governments backed by narrow-right coalitions are more likely to
formulate and implement a pro-business agenda than those supported by other types of electoral
coalitions. In turn, investors react more favorably to this policy framework.
How do such coalitions emerge in the midst of poor electorates? When identity forms the
dominant mode of political mobilization, pre-existing social cleavage structures play a major role
in influencing party strategies of coalition construction. In such cases, certain cleavage
configurations can favor the emergence of narrow-right coalitions in poor democracies. The
emergence of these coalitions is predicated on identity-based mobilization and is unlikely to
occur if class was the main axis of politics in poor countries. In Indian states, this paper finds that
narrow-right coalitions are most likely to emerge under “dominant caste” patterns, which involve
an overlap between numerical strength of social groups and economic resource control. This
underlying correlation between size and resource control in India’s competitive first-past-the-
post system has allowed parties to construct electoral majorities with narrow-right coalitions.
One important concern can be directed against the core argument in this paper and I end by
briefly addressing this issue. The explanation laid out here suggests a trade-off between growth-
related goals and redistribution in poor democracies. There are several reasons why this dialectic
is likely to be valid in developing democracies. In the context of competition for investment,
governments need to create a favorable policy environment to attract capital to their jurisdictions.
For poor countries, this typically involves offering incentives and building specialized
infrastructure to attract capital. Given limited resources available to poor countries, such choices
involve significant opportunity costs. The trade-off is also likely to be exacerbated if the benefits

46
of growth are not distributed evenly. In addition, a time-inconsistency problem may also arise –
the benefits of growth typically accrue in the long-run while costs entailed by pro-business
policies occur in the short-term. This often results in considerable political contestation.31
Ultimately, the trade-off between growth and redistribution is an empirical question. In
Indian states, considerable evidence points to a divergence between the two aims. Despite its
recent growth success, India remains largely poor and overwhelmingly rural (over 72 per cent of
the population lives in rural areas). In addition, 92 per cent of the total workforce is in the
unorganized sector (Sengupta 2007). In contrast to these employment patterns, economic growth
in India in the post-1991 period has been driven primarily by capital-intensive industries and the
service sector (Kochhar et al. 2006; Subramanian 2008). Services accounted for almost 65 per
cent of the country’s GDP in 2009-10 while agriculture and allied services accounted for 14.6
per cent.32 This trend – of services constituting the greatest share of GDP – is prevalent in most
major Indian states. Employment generation in the organized sector has also been extremely
limited and the jobs that have been created in the formal sector have been of poor quality; they
are typically on a contractual basis and offer no social protection (e.g., Anant et al. 2006; Nagaraj
2006). In short, a variety of trends point to a skewed distribution of benefits after market reforms
in India. Even the current national government officially acknowledges that growth has not been
inclusive after 1991 (e.g., India 2008). This lack of inclusiveness, thus, forms the basis of
tensions between growth-oriented and redistributive policies in India.
In the context of growing democratization, balancing the imperatives of growth and
redistribution with limited resources is likely to be a legitimate concern for several developing
countries. In such contexts, purely class-based political mobilization is likely to result in a focus
on redistributive goals. Policies such as investment are unlikely to be prioritized. In contrast, as
this paper attempts to demonstrate, identity politics can unexpectedly lead to the emergence of
electoral coalitions that are conducive to growth-friendly goals in poor democracies.
31 In India, land is one such area that has resulted in significant political contestation. This is discussed in chapter 2 of my dissertation. 32 Calculated from RBI (2010), Table 3: Components of Gross Domestic Product (At Factor Cost)

47
Appendix – Figures and tables
Figure 1: The argument

48
Table 1: Total Investment across states – 1991 to 2010
State Total Investment (In Million
Rs.)
Share of total investment
value received nationally (%)
Total number of investment
proposals
Share of total number of proposals received
nationally (%)
Per Capita Total
Investment (In Rs.)
Chhattisgarh 10,456,450 13.72 2,798.00 3.15 501,894 Orissa 10,444,630 13.7 1,650.00 1.86 283,783 Gujarat 8,979,100 11.78 10,333.00 11.65 177,204
Maharashtra 7,434,670 9.75 15,769.00 17.77 76,742 Andhra Pradesh 6,896,070 0.05 6,932.00 7.81 90,488
Karnataka 5,992,490 7.86 3,897.00 4.39 113,385 Madhya Pradesh 5,752,810 7.55 3,548.00 4.00 95,327
Jharkhand 4,307,600 5.65 1,043.00 1.18 159,860 West Bengal 3,384,520 4.44 4,852.00 5.47 42,214 Tamil Nadu 3,139,370 4.12 7,910.00 8.92 50,306
Uttar Pradesh 2,155,450 2.83 7,201.00 8.12 12,969 Rajasthan 1,352,170 1.77 3,512.00 3.96 23,929
Bihar 1,082,330 1.42 406.00 0.46 13,040 Punjab 1,075,300 1.41 3,349.00 3.77 44,144
Haryana 911,320 1.2 4,391.00 4.95 43,099 Uttarkhand 605,240 0.79 2,068.00 2.33 71,297
Himachal Pradesh 328,080 0.43 996.00 1.12 53,978 Assam 312,050 0.41 613.00 0.69 11,707 Kerala 137,660 0.18 702.00 0.79 4,323
Goa 134,010 0.18 770.00 0.87 99,414 *Chhattisgarh, Jharkhand and Uttarakhand were formed in 2000. They were part of Madhya Pradesh, Bihar and Uttar Pradesh respectively until 1999. Source: Calculations based on data from the Secretariat of Industrial Assistance (Ministry of Commerce and Industry, Government of India); SIA statistics (January 2011) available at http://dipp.nic.in

49
Source: Calculations based on data from the Secretariat of Industrial Assistance (Ministry of Commerce and Industry, Government of India); SIA statistics (January 2011) available at http://dipp.nic.in
0
200,000
400,000
600,000
800,000
1,000,000
1,200,000
1,400,000
1,600,000
1,800,000
1998 1999 2000 2001 2002 2003 2004 2005 2006 2007 2008 2009
Annu
al In
vest
men
t (In
mill
ion
Rs.)
Year
Figure 3: Annual Investment in Select High and Middle Income States
AP GUJ MAH TN WB KAR PUN HAR

50
Regression results used in Figure 4
VARIABLES State Per Capita Income
0.217 (0.368)
Road Density -0.201 (0.139)
Literacy Rate 1,347 (2,886)
GSDP 961.8** (375.7)
Constant -10,268* (5,054) Observations 20 R-squared 0.375
Standard errors in parentheses; *** p<0.01, ** p<0.05, * p<0.1
AP
ASS BIH
CHH
DELGOA
GUJ
HAR
HP
JHA
KAR
KER
MAH
MP
ORI
PUNRAJ
TN UPWB
R-squared = 0.3745
010
0020
0030
0040
0050
00
Cum
ulat
ive In
vestm
ent 1
991-
2007
(in
billio
n ru
pees
)
0 1000 2000 3000 4000
Fitted values
Actual Values Fitted values
Figure 4: Actual vs. Predicted Values of Cumulative Investment
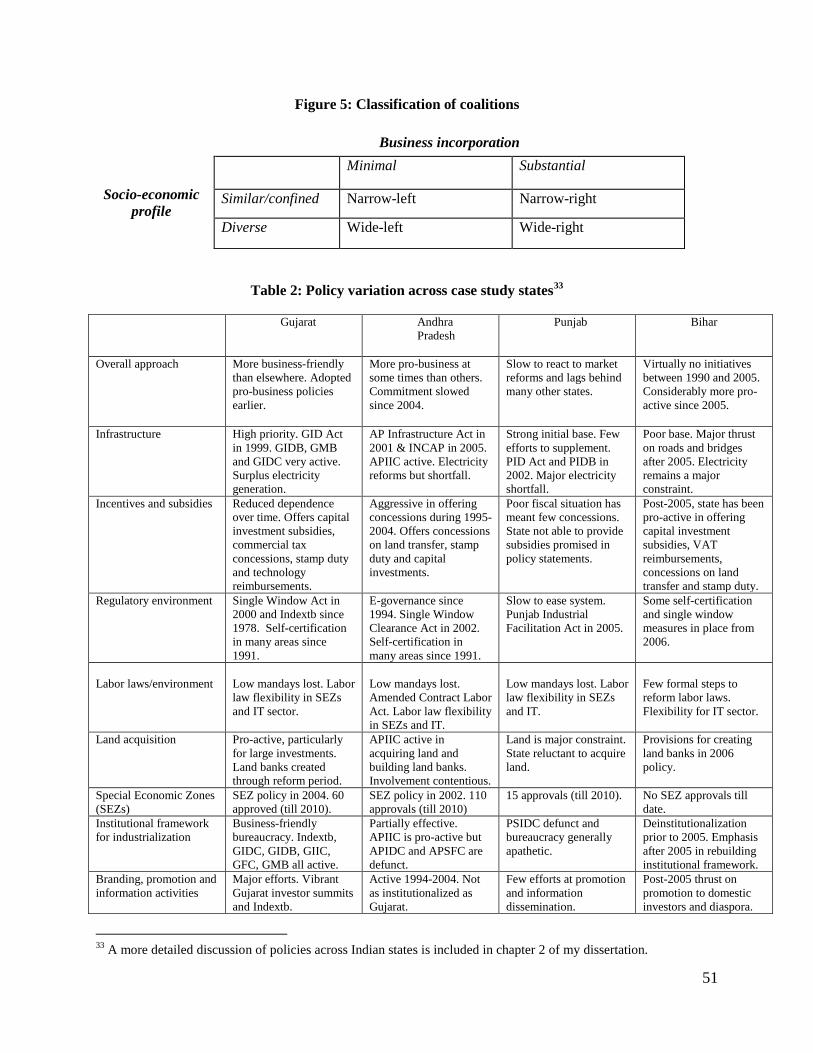
51
Figure 5: Classification of coalitions
Business incorporation
Socio-economic profile
Minimal Substantial
Similar/confined Narrow-left Narrow-right
Diverse Wide-left Wide-right
Table 2: Policy variation across case study states33
Gujarat Andhra Pradesh
Punjab Bihar
Overall approach More business-friendly than elsewhere. Adopted pro-business policies earlier.
More pro-business at some times than others. Commitment slowed since 2004.
Slow to react to market reforms and lags behind many other states.
Virtually no initiatives between 1990 and 2005. Considerably more pro-active since 2005.
Infrastructure High priority. GID Act in 1999. GIDB, GMB and GIDC very active. Surplus electricity generation.
AP Infrastructure Act in 2001 & INCAP in 2005. APIIC active. Electricity reforms but shortfall.
Strong initial base. Few efforts to supplement. PID Act and PIDB in 2002. Major electricity shortfall.
Poor base. Major thrust on roads and bridges after 2005. Electricity remains a major constraint.
Incentives and subsidies Reduced dependence over time. Offers capital investment subsidies, commercial tax concessions, stamp duty and technology reimbursements.
Aggressive in offering concessions during 1995- 2004. Offers concessions on land transfer, stamp duty and capital investments.
Poor fiscal situation has meant few concessions. State not able to provide subsidies promised in policy statements.
Post-2005, state has been pro-active in offering capital investment subsidies, VAT reimbursements, concessions on land transfer and stamp duty.
Regulatory environment Single Window Act in 2000 and Indextb since 1978. Self-certification in many areas since 1991.
E-governance since 1994. Single Window Clearance Act in 2002. Self-certification in many areas since 1991.
Slow to ease system. Punjab Industrial Facilitation Act in 2005.
Some self-certification and single window measures in place from 2006.
Labor laws/environment
Low mandays lost. Labor law flexibility in SEZs and IT sector.
Low mandays lost. Amended Contract Labor Act. Labor law flexibility in SEZs and IT.
Low mandays lost. Labor law flexibility in SEZs and IT.
Few formal steps to reform labor laws. Flexibility for IT sector.
Land acquisition Pro-active, particularly for large investments. Land banks created through reform period.
APIIC active in acquiring land and building land banks. Involvement contentious.
Land is major constraint. State reluctant to acquire land.
Provisions for creating land banks in 2006 policy.
Special Economic Zones (SEZs)
SEZ policy in 2004. 60 approved (till 2010).
SEZ policy in 2002. 110 approvals (till 2010)
15 approvals (till 2010). No SEZ approvals till date.
Institutional framework for industrialization
Business-friendly bureaucracy. Indextb, GIDC, GIDB, GIIC, GFC, GMB all active.
Partially effective. APIIC is pro-active but APIDC and APSFC are defunct.
PSIDC defunct and bureaucracy generally apathetic.
Deinstitutionalization prior to 2005. Emphasis after 2005 in rebuilding institutional framework.
Branding, promotion and information activities
Major efforts. Vibrant Gujarat investor summits and Indextb.
Active 1994-2004. Not as institutionalized as Gujarat.
Few efforts at promotion and information dissemination.
Post-2005 thrust on promotion to domestic investors and diaspora.
33 A more detailed discussion of policies across Indian states is included in chapter 2 of my dissertation.

52
Table 3: Social Bases of the BJP and Congress in Gujarat (Percentage vote of respondents for BJP and Congress by caste/community)
Election
1995 1996 1998 1999 2002 2004
BJP INC BJP INC BJP INC BJP INC BJP INC BJP INC
Upper Castes 67 20 76 18 77 13 77 16 79 16 67 26
OBCs 38 38 65 30 57 28 38 61 59 38 40 55
Scheduled Castes 17 61 61 35 47 45 33 64 27 67 24 67
Scheduled Tribes 29 59 34 55 43 46 33 67 34 49 48 46
Muslims 7 47 33 65 38 62 10 90 10 69 20 60 Source: Data from Shah (2007), table 6.4, p.173. Except 1996 is based on post-poll surveys of voters in Gujarat in assembly and parliamentary elections conducted by CSDS (New Delhi). 1996 survey was conducted by CSS (Surat).
Table 4a: Social Bases of the Congress and BJP-SAD in Punjab in 2002 (Percentage vote of respondents for BJP and Congress by caste/community)
INC-CPI* SAD-BJP
Hindu upper caste 56 22
Hindu OBC 52 12
Hindu Dalit (SC) 49 9
Jat Sikh 23 52
Khatri Sikh 25 61
Sikh OBC 39 34
Dalit Sikh 40 30
*The Communist Party of India (CPI) was an alliance partner of the Congress in 2002. Source: Kumar and Kumar (2002). Data based on post-poll survey of the 2002 assembly elections conducted by CSDS (New Delhi).
Table 4b: Social Bases of the Congress and BJP-SAD in Punjab in 2009
INC SAD-BJP
Hindu Upper Caste 58 36
Hindu OBC 62 32
Dalits 60 16
Jat Sikhs 37 54
Other Sikhs 32 60
Source: Kumar and Sekhon(2009). Data based on post-poll survey of the 2009 Lok Sabha elections conducted by CSDS (New Delhi).

53
References Acemoglu, Daron, Simon Johnson, and James Robinson. 2001. "The Colonial Origins of Comparative
Development: An Empirical Investigation." American Economic Review 91 (5):1369-401. Acemoglu, Daron, and James Robinson. 2005. Economic Origins of Dictatorship and Democracy.
Cambridge: Cambridge University Press. Ahluwalia, Isher Judge, Saumitra Chaudhuri, and Samrat Sidhu. 2008. "Punjab Industrial Review."
UNIDO. Ahluwalia, M.S. 2000. "Economic Performance of States in the Post-Reforms Period." Economic and
Political Weekly May 6:1637-48. Alesina, Alberto, and George-Marios Angeletos. 2005. "Fairness and Redistribution." American
Economic Review 95 (4):960-80. Alesina, Alberto, Reza Baqir, and William Easterly. 1999. "Public Goods and Ethnic Divisions."
Quarterly Journal of Economics 114 (4):1243-84. Alesina, Alberto, and Eliana La Ferrara. 2005. "Preferences for redistribution in the land of
opportunities." Journal of Public Economics 89 (5-6):897-931 Alesina, Alberto, and Eliana La Ferrara. 2005. "Ethnic Diversity and Economic Performance." Journal of
Economic Literature 43 (3):762-800. Alesina, Alberto, and R Perotti. 1996. "Income Distribution, political instability and investment."
European Economic Review 40:1203-28. Alvarez, Michael R., Geoffrey Garrett, and Peter Lange. 1991. "Government Partisanship, Labor
Organization, and Macroeconomic Performance." American Political Science Review 85 (2):539-56
Anant, T.C.A, R Hasan, R Mohapatra, R Nagaraj, and S.K Sasikumar. 2006. "Labor Markets in India: Issues and Perspectives." In Labor Markets in Asia: Issues and Perspectives, ed. J. Felipe and R. Hasan. Basingstoke, Hampshire: Palgrave Macmillan.
Andrews, D. 1994. "Capital Mobility and Structural Autonomy." International Studies Quarterly 38 (2). Banerjee, Abhijit, and Lakshmi Iyer. 2005. "History, Institutions, and Economic Performance: The
Legacy of Colonial Land Tenure Systems in India." American Economic Review 95 (4):1190-213. Banerjee, Abhijit, Lakshmi Iyer, and Rohini Somanathan. 2005. "History, Social Divisions, and Public
Goods in Rural India." Journal of the European Economic Association 3 (2/3):639 - 47. Barro, R. 1991. "Economic Growth in a Cross Section of Countries." Quarterly Journal of Economics
106. Barro, R. 1996. "Democracy and Growth." Journal of Economic Growth 1 (1):1-27. Barro, R. 1997. Determinants of Economic Growth: A Cross-Country Empirical Study. Cambridge, MA:
MIT Press. Barro, R, and X Sala-i-Martin. 2004. Economic Growth. Cambridge, MA: MIT Press. Baru, Sanjaya. 2000. "Economic Policy and the Development of Capitalism in India: the role of regional
capitalists and political parties." In Transforming India: Social and Political Dynamics of Democracy, ed. F. R. Frankel, Z. Hasan, R. Bhargava and B. Arora. New Delhi: Oxford University Press.
Besley, Timothy, Robin Burgess, and Berta Esteve-Volart. 2007. "The Policy Origins of Poverty and Growth in India." In Delivering on the Promise of Pro-Poor Growth, ed. T. Besley and L. Cord: Palgrave Macmillan and World Bank.
Besley, Timothy, Torsten Persson, and Daniel Sturm. 2010. "Political Competition, Policy and Growth: Theory and Evidence from the US." Review of Economic Studies 77 (4):1329-52.
Boix, Carles. 1997a. "Political Parties and the Supply Side of the Economy: The Provision of Physical and Human Capital in Advanced Economies, 1960-90." American Journal of Political Science 41 (3):814-45
Boix, Carles. 1997b. "Privatizing the Public Business Sector in the Eighties: Economic Performance, Partisan Responses and Divided Governments." British Journal of Political Science 27 (4):473-96

54
Boix, Carles. 1998. Political Parties, Growth and Equality: Conservative and Social Democratic Economic Strategies in the World Economy. Cambridge: Cambridge University Press.
Boix, Carles. 2003. Democracy and Redistribution. Cambridge: Cambridge University Press. Brass, Paul R. 1990. The Politics of India Since Independence. Cambridge: Cambridge University Press. Brown, David S., and Wendy Hunter. 1999. "Democracy and Social Spending in Latin America, 1980-
92." American Political Science Review 93 (4):779-90. Brunetti, Aymo, Gregory Kisunko, and Beatrice Weder. 1998. "Credibility of Rules and Economic
Growth: Evidence from a Worldwide Survey of the Private Sector " World Bank Economic Review 12 (3):353-84.
Bueno de Mesquita, B, J.D. Morrow, R Silversion, and A Smith. 2001. "Political Competition and Economic Growth." Journal of Democracy 12 (1):59-72.
Büthe, T., and H. V. Milner. 2008. "The Politics of Foreign Direct Investment into Developing Countries: Increasing FDI through International Trade Agreements?" American Journal of Political Science 52 (4):741-62.
Cerny, P. 1993. "The Political Economy of International Finance." In Finance and World Politics: Markets, Regimes and States in the Post-hegemonic Era, ed. P. Cerny. Aldershot, England: Elgar.
Chandra, Kanchan. 2004. Why Ethnic Parties Succeed: Patronage and Ethnic Head Counts in India. Cambridge: Cambridge University Press
Chhibber, Pradeep. 1999. Democracy without Associations: Transformation of the Party System and Social Cleavages in India. Ann Arbor: University of Michigan Press.
Chhibber, Pradeep, and Irfan Nooruddin. 2004. "Do Party Systems Count?: The Number of Parties and Government Performance in Indian States." Comparative Political Studies 37 (2).
Chhibber, Pradeep, and John Petrocik. 1989. "The Puzzle of Indian Politics: Social Cleavages and the Indian Party System." British Journal of Political Science 19 (2):191-210.
Damodaran, Harish. 2008. India's New Capitalists: Caste, Business and Industry in a Modern Nation. Houndmills, Basingstoke, Hampshire Palgrave Macmillan.
Easterly, William, and Ross Levine. 1997. "Africa's Growth Tragedy: Policies and Ethnic Divisions." Quarterly Journal of Economics 112 (4):1203-50.
Economist. 2006. "Comrades, come rally." The Economist, October 28, 2006, 69-70. Engerman, Stanley I., and Kenneth L. Sokoloff. 2000. "History Lessons: Institutions, Factors
Endowments, and Paths of Development in the New World." Journal of Economic Perspectives 14 (3):217-32.
Evans, P. 1995. Embedded Autonomy: States and Industrial Transformation. Princeton: Princeton University Press.
Feng, Yi. 2001. "Political Freedom, Political Instability, and Policy Uncertainty." International Studies Quarterly 45 (2):271-94.
Frankel, Francine R. 1989. "Introduction." In Dominance and State Power in Modern India, ed. F. R. Frankel and M. S. A. Rao. Delhi: Oxford University Press.
Frankel, Francine R., and M.S.A Rao, eds. 1989. Dominance and State Power in Modern India. 2 vols. Delhi: Oxford University Press.
Frye, Timothy. 2002. "The Perils of Polarization: Economic Performance in the Postcommunist World." World Politics 54:308-37.
Garrett, Geoffrey, and Peter Lange. 1985. "The Politics of Growth: Strategic Interaction and Economic Performance in the Advanced Industrial Democracies, 1974-1980." Journal of Politics 47 (3):792-827
Gujarat, Government of. 2003. "Industrial Policy 2003." ed. I. M. Dept. Gandhinagar. Harriss, John. 1999. "Comparing Political Regimes Across Indian States: A Preliminary Essay."
Economic and Political Weekly 34 (48):3367-77. Heath, Oliver. 1999. "Anatomy of the BJP's Rise to Power: Social, Regional and Political Expansion in
1990s." Economic and Political Weekly 34 (34/35):2511-7.

55
Henisz, Witold J. 2000. "The institutional environment for multinational investment." The Journal of Law, Economics, and Organization 16 (2).
Henisz, Witold J. 2002. "The institutional environment for infrastructure investment " Industrial and Corporate Change 11 (2):355-89.
Hirway, I. 2000. "Dynamics of Development in Gujarat: Some Issues." Economic and Political Weekly 35 (35-36):3106-20.
India, Planning Commission of. 2008. "Eleventh Five Year Plan - 2007-2012." New Delhi: Planning Commission of India.
Iversen, Torben, and David Soskice. 2001. "An Asset Theory of Social Preferences." American Political Science Review 95 (4):875-93.
Iversen, Torben, and David Soskice. 2006. "Electoral Institutions and the Politics of Coalitions: Why Some Democracies Redistribute More Than Others." American Political Science Review 100 (2):165-81.
Iversen, Torben, and David Soskice. 2009. "Distribution and Redistribution: The Shadow of the Nineteenth Century." World Politics 61 (3):438-86
Iyer, Lakshmi. 2010. "Direct versus Indirect Colonial Rule in India: Long-Term Consequences." Review of Economics and Statistics 92 (4):693-713.
Jaffrelot, Christophe. 2003. India’s silent revolution : the rise of the lower castes in North India New York: Columbia University Press.
Jaffrelot, Christophe. 2009. "Introduction." In Rise of the Plebians? The Changing Face of Indian Legislative Assemblies ed. C. K. Jaffrelot, Sanjay. New Delhi: Routledge.
Jani, Maheshwata. 2009. "Gujarat: BJP Scrapes Through." Economic and Political Weekly 44 (39):133-6. Jenkins, Rob. 1999. Democratic Politics and Economic Reform in India. Cambridge: Cambridge
University Press Jenkins, Rob. 2004. "Labour Policy and the Second Generation of Economic Reform in India." India
Review 3 (4):333-63. Jensen, N. 2003. "Democratic Governance and Multinational Corporations: Political Regimes and Inflows
of Foreign Direct Investment." International Organization 57 (3):587–616. Jensen, N. 2006. Nation States and the Multinational Corporation: A Political Economy of Foreign
Direct Investment. Princeton: PUP. Jodhka, Surinder S. 2005. "Return of the Regions: Identities and Electoral Politics in Punjab." Economic
and Political Weekly 40 (3):224-30. Kaufman, Robert R., and Alex Segura-Ubiergo. 2001. "Globalization, Domestic Politics and Social
Spending in Latin America, 1973-97." World Politics 53 (4):553-87. Kennedy, L 2004. "The Political Determinants of Reform Packaging: Contrasting Responses to Economic
Liberalization in Andhra Pradesh and Tamil Nadu." In Regional Reflections: Comparing Politics Across India's States, ed. R. Jenkins. New Delhi: OUP.
Knack, S, and P Keefer. 1995. "Institutions and Economic Performance: Cross-Country Tests Using Alternative Institutional Measures." Economics and Politics 7 (3).
Kochhar, K, U Kumar, R Rajan, A Subramanian, and I Tokatlidis. 2006. ""India's Pattern of Development: What Happened? What Follows?" " Journal of Monetary Economics 53 (5):981-1019.
Kohli, Atul. 1989. "From Elite Activism to Democratic Consolidation: The Rise of Reform Communism in West Bengal." In Dominance and State Power in Modern India, ed. F. R. Frankel and M. S. A. Rao. Delhi: Oxford University Press.
Kohli, Atul. 1990. Democracy and Discontent: India's Growing Crisis of Governability. Cambridge: Cambridge University Press
Kohli, Atul. 2004. State-Directed Development: Political Power and Industrialization in the Global Periphery. Cambridge: Cambridge University Press
Kohli, Atul. 2006. "Politics of Economic Growth in India, 1980-2005, parts I and II." Economic and Political Weekly April 1 and April 8.

56
Kohli, Atul. forthcoming. Want Amid Plenty: State and Economy in Pro-Business India. Cambridge: Cambridge University Press.
Kothari, Rajni. 1970. "Introduction." In Caste in Indian Politics, ed. R. Kothari. New Delhi: Orient Longman.
Kothari, Rajni, and Rushikesh Maru. 1970. "Federating for Political Interests: The Kshatriyas of Gujarat." In Caste in Indian Politics, ed. R. Kothari. New Delhi: Orient Longman.
Krugman, P. 1991. "Increasing Returns and Economic Geography." Journal of Political Economy 99 (3). Krugman, P. 1998. "What's New About the New Economic Geography." Oxford Review of Economic
Policy 14 (2). Kumar, Ashutosh. 2006. "Electoral Politics in Punjab: 1966-2004." Journal of Punjab Studies 12 (1):111-
27. Kumar, Ashutosh, and Sanjay Kumar. 2002. "Assembly Elections: Decline of Identity Politics."
Economic and Political Weekly 37 (15):1384-8. Kumar, Ashutosh, and Jagroop Singh Sekhon. 2009. "Punjab: Resurgence of the Congress." Economic
and Political Weekly 44 (39):183-6. Kumar, Pramod. 2003a. "Electoral Politics in Punjab: From Autonomy to Secession." In India's 1999
Elections and 20th Century Politics, ed. R. Roy and P. Wallace. New Delhi: Sage. Kumar, Sanjay. 2003b. "Gujarat Assembly Elections 2002: Analysing the Verdict." Economic and
Political Weekly 38 (4):270-5. La Porta, Rafael, Florencio Lopez-de-Silanes, Andrei Shleifer, and Robert Vishny. 1999. "The quality of
government." Journal of Law, Economics and Organization 15 (1):222-79. Lake, David A., and Matthew A. Baum. 2001. "The Invisible Hand of Democracy: Political Control and
the Provision of Public Services." Comparative Political Studies 34 (6):587-621. Lieberman, Evan. 2005. "Nested Analysis as a Mixed-Method Strategy for Comparative Research."
American Political Science Review 99 (3). Lipset, Seymour Martin, and Stein Rokkan. 1967. "Cleavage Structures, Party Systems and Voter
Alignments." In Party Systems and Voter Alignments: Cross-National Perspectives, ed. S. M. Lipset and S. Rokkan. New York: Free Press.
Lucas, R.E. 1990. "Why Doesn't Capital Flow From Rich to Poor Countries?" American Economic Review 80 (2).
Meltzer, Allan H., and Scott F. Richard. 1981. "A Rational Theory of the Size of Government." Journal of Political Economy 89 (5):914-27.
Metcalf, Barbara D., and Thomas R. Metcalf. 2001. A Concise History of Modern India. Cambridge: Cambridge University Press.
Miguel, Edward, and Mary Kay Gugerty. 2005. "Ethnic diversity, social sanctions, and public goods in Kenya " Journal of Public Economics 89 (11-12):2325-68
Murillo, Maria Victoria. 2002. "Political Bias in Policy Convergence: Privatization Choices in Latin America." World Politics 54 (4):462-93.
Murillo, Maria Victoria. 2005. "Partisanship amidst Convergence: The Politics of Labor Reform in Latin America." Comparative Politics 37 (4).
Murillo, Maria Victoria, and Cecilia Martinez-Gallardo. 2007. "Political Competition and Policy Adoption: Market Reforms in Latin American Public Utililites." American Journal of Political Science 51 (1):120-39.
Nagaraj, R. 2006. Economic Growth and Reforms: Selected Essays. Delhi: Academic Foundation. Patel, Priyavadan. 1999. "Sectarian Mobilisation, Factionalism and Voting in Gujarat." Economic and
Political Weekly 34 (34/35):2423-33. Pinto, Pablo M., and Jeffrey F. Timmons. 2005. "The Political Determinants of Economic Performance:
Political Competition and the Sources of Growth." Comparative Political Studies 38 (1):26-50. Posner, Daniel. 2004a. "Measuring Ethnic Fractionalization in Africa." American Journal of Political
Science 48 (4):849-63.

57
Posner, Daniel. 2004b. "The Political Salience of Cultural Difference: Why Chewas and Tumbukas Are Allies in Zambia and Adversaries in Malawi." American Political Science Review 98 (4):529-45.
Prakash, Aseem. 2003. "Re-Imagination of the State and Gujarat's Electoral Verdict." Economic and Political Weekly 38 (16):1601-10.
RBI. 2010. "Handbook of Statistics on the Indian Economy 2009-10." Mumbai: Reserve Bank of India. Romer, Thomas. 1975. "Individual welfare, majority voting and the properties of a linear income tax."
Journal of Public Economics 4 (2):163-85. Ross, M. 2006. "Is Democracy Good for the Poor?" American Journal of Political Science 50 (4):860-74. Rudolph, Lloyd I., and Susanne Hoeber Rudolph. 2001. "Iconisation of Chandrababu: Sharing
Sovereignty in India's Federal Market Economy." Economic and Political Weekly May 5. Sengupta, Arjun (National Commission for Enterprises in the Unorganized Sector). 2007. "Report on
Conditions of Work and Promotion of Livelihoods in the Unorganized Sector." New Delhi. Shah, Ghanshyam. 1987. "Middle Class Politics: Case of Anti-Reservation Agitations in Gujarat."
Economic and Political Weekly 22 (19-21):AN155-AN72. Shah, Ghanshyam. 1989. "Caste Sentiments, Class Formation and Dominance in Gujarat." In Dominance
and State Power in Modern India, ed. F. R. Frankel and M. S. A. Rao. Delhi: Oxford University Press.
Shah, Ghanshyam. 1991. "Tenth Lok Sabha Elections - BJP's Victory in Gujarat." Economic and Political Weekly:2921-4.
Shah, Ghanshyam. 1996. "BJP's Rise to Power." Economic and Political Weekly 31 (2/3):165-70. Shah, Ghanshyam. 2004. "Introduction: Caste and Democratic Politics." In Caste and Democratic Politics
in India, ed. G. Shah. London: Anthem Press. Shah, Ghanshyam. 2007. "Gujarat after Godhra." In India's 2004 Elections: Grass-roots and National
Perspectives, ed. R. Roy and P. Wallace. New Delhi: Sage. Shinoda, Takashi. 2000. "Institutional Change and Entrepreneurial Development: SSI Sector." Economic
and Political Weekly 35 (35/36). Singh, Gurharpal. 1998. "The Akalis and the BJP in Punjab: From Ayodhya to the 1997 Legislative
Election." In The BJP and the Compulsions of Politics in India, ed. T. B. Hansen and C. Jaffrelot. New Delhi: Oxford University Press.
Singh, Lakhwinder. 2005. "Deceleration of Industrial and Rural Industrialization Strategy for Indian Punjab." Journal of Punjab Studies 12 (2):271-84.
Singh, N, and T.N Srinivasan. 2006. "Indian Federalism, Economic Reform and Globalization." In Federalism and Economic Reform, ed. J. Wallack and T. N. Srinivasan. Cambridge, UK: Cambridge University Press.
Sinha, Aseema. 2004. "Ideas, Interests and Institutions in Policy Change: A Comparison of West Bengal and Gujarat." In Regional Reflections: Comparing Politics Across India's States, ed. R. Jenkins. New Delhi: OUP.
Sinha, Aseema. 2005. The Regional Roots of Developmental Politics in India: A Divided Leviathan. Bloomington: Indiana University Press.
Srinivas, M.N. 1994. The Dominant Caste and Other Essays. New Delhi: OUP. Stasavage, David. 2002. "Private Investment and Political Institutions." Economics and Politics 14 (1). Stasavage, David. 2005. "Democracy and Education Spending in Africa." American Journal of Political
Science 49 (2):343-58. Subramanian, A. 2008. India's Turn: Understanding the Economic Transformation. New Delhi: OUP. Sud, Nikita. 2007. "Constructing and Contesting a Gujarati-Hindu Ethno-religious Identity Through
Development Programmes in an Indian Province." Oxford Development Studies 35 (2):131-47 Teitelbaum, Emmanuel. 2006. Mobilizing Restraint: Unions and the Politics of Economic Development
in South Asia, Ph.D Thesis: Department of Government, Cornell University. Tripathi, Dwijendra, and Jyoti Jumani. 2007. The Concise Oxford History of Indian Business. New Delhi:
OUP.

58
Van Dyke, Virginia. 2009. "The Khalistan Movement in Punjab, India, and the Post-Militancy Era: Structural Change and New Political Compulsions." Asian Survey 49 (6):975-97.
Varshney, Ashutosh. 1999. "Mass Politics or Elite Politics? India's Reforms in Comparative Perspective." In India in the Era of Economic Reforms, ed. J. Sachs, A. Varshney and N. Bajpai. New Delhi: Oxford University Press.
Venkata Ratnam, C.S. 2004. "The Politics of Labor Reforms in India." In India - the Political Economy of Reforms, ed. B. Debroy and R. Mukherji. New Delhi: Bookwell.
Wade, R. 1990. Governing the Market: Economic Theory and the Role of the Government in East Asian Industrialization. Princeton: Princeton University Press.
Wallace, Paul. 1989. "Religious and Ethnic Politics: Political Mobilization in Punjab." In Dominance and State Power in Modern India, ed. F. R. Frankel and M. S. A. Rao. Delhi: Oxford University Press.
Wood, John R. 1987. "Reservations in Doubt: The Backlash Against Affirmative Action in Gujarat, India." Pacific Affairs 60 (3):408-30.
WorldBank. 2005. World Development Report 2005: A Better Investment Climate For Everyone. Washington, D.C: World Bank.
WorldBank. 2006. The Investment Climate in Brazil, India, and South Africa: A Contribution to the IBSA Debate. Washington, D.C: World Bank.
WorldBank. 2007B. Doing Business in South Asia in 2007. Washington D.C.: World Bank. Yadav, Yogendra. 1999. "Electoral Politics in the Time of Change: India's Third Electoral System, 1989-
1999." Economic and Political Weekly 34 (34-35):2393-9. Yadav, Yogendra. 2002. "Understanding the Second Dramatic Upsurge: trends of bahujan participation in
electoral politics in the 1990s." In Transforming India: Social and Political Dynamics of Democracy, ed. F. R. Frankel, Z. Hasan, R. Bhargava and B. Arora. New Delhi: Oxford University Press
Yadav, Yogendra. 2004. "The Elusive Mandate of 2004." Economic and Political Weekly 39 (51):5383-98.