kansas wastewater operator's school energy use and
TRANSCRIPT

Kansas Wastewater Operator's School
Energy Use and Nutrient Reduction Presentation

Aeration Control for Nutrient Reduction
Our Mission: To protect and improve the health and environment of all Kansans.
Prepared byRodney R. Geisler, P.E., ChiefMunicipal Programs Section
Bureau of Water, KDHE
Kansas 96th Annual Water & Wastewater Operators SchoolLawrence, Kansas
August 4, 2016

Nutrient Reduction Requirements Are Now Being Placed into NPDES Permits
Our Mission: To protect and improve the health and environment of all Kansans.
My Discussions will present the Regulatory Requirements for Nutrient Reduction and the Benefits of Aeration Control
Following me – Jerry Grant of Fort Scott Comm. College will be Presenting Case Studies of Operations Successes to Reduce Nutrient
Discharges

Nutrients of Concern - Nitrogen
Our Mission: To protect and improve the health and environment of all Kansans.
Start with Basics – Kansas goal is to reduce Nitrogen and Phosphorus discharges to streams
Nitrogen – can be treated and removed with typical activated sludge biological treatment processes to very low concentrations
Nitrogen Reduction is easier with Operator Training, DO/ORP probes and monitors, VFDs, and computer controls

Nutrients of Concern - Phosphorus
Our Mission: To protect and improve the health and environment of all Kansans.
Phosphorus – is different.
Typical activated sludge processes will treat to remove about 40% TP influent concentration. We need to remove another 40% (on average) to Meet Goals.
To Meet Goals requires Bio-P activated sludge processes or chemical precipitation, or use both.
Phosphorus reduction is not easy, not real expensive but not cheap either.

6
Impaired Streams – Examples

7
Impaired Reservoirs – Examples

Harmful Algal Blooms (HABs)
Our Mission: To protect and improve the health and environment of all Kansans.
•Caused by Excessive Nutrients, and are Happening More Frequently •Happening in More Lakes in Kansas•Major Concern with Recreation•Also a Concern to Drinking Water Supplies•KDHE Finding HAB Toxins in Waterbodys•Now Also Finding HAB Toxins in Raw Water Drawn from Lakes for Drinking Water Treatment•No Toxins Found in Finished Drinking Water (Thank Goodness)

EPA New “2013” Ammonia Criterion
Our Mission: To protect and improve the health and environment of all Kansans.
•As Proposed by EPA, and to be Adopted by Kansas Regulations, the Ammonia Criteria now also Considers Toxicity to Mussels and Snails•Overall Impact is There will be Much More Stringent Numeric Criteria for Ammonia•Expect NPDES Permit Effluent Limitations for Ammonia Concentration Reduced by 60%•And many Permits Now With “Monitoring Only” for Ammonia will have Limits for Ammonia
EPA New “2013” Ammonia Criterion
Our Mission: To protect and improve the health and environment of all Kansans.
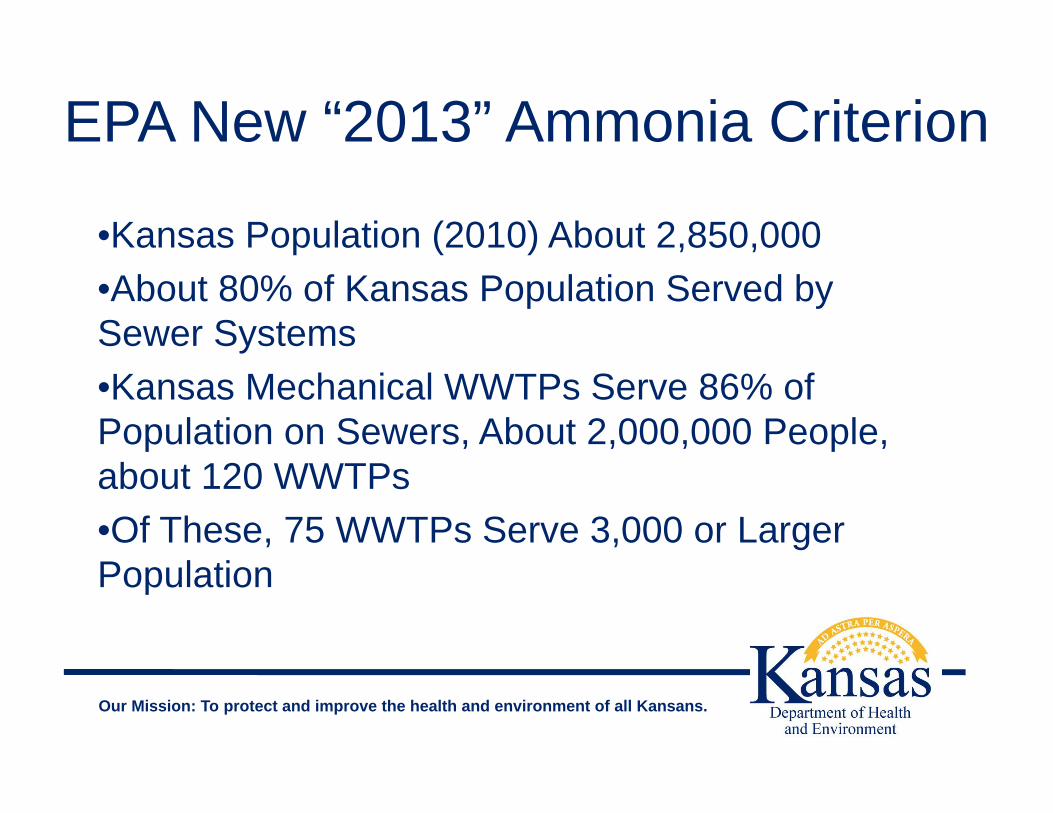
•Kansas Population (2010) About 2,850,000•About 80% of Kansas Population Served by Sewer Systems•Kansas Mechanical WWTPs Serve 86% of Population on Sewers, About 2,000,000 People, about 120 WWTPs•Of These, 75 WWTPs Serve 3,000 or Larger Population

EPA New “2013” Ammonia Criterion
Our Mission: To protect and improve the health and environment of all Kansans.
•Most Mechanical WWTPs Can Meet These New Ammonia Limitations Based on the EPA 2013 Ammonia Criterion•KDHE Estimates – 16 Mechanical WWTPs Major Expense Upgrades, 21 Mechanical WWTPs Operator Training & Minor Expense Improvements (Computer Controls); Letters have been sent to these WWTP Permittees•And Then There are the 350 Discharging Lagoons

EPA New “2013” Ammonia Criterion and Lagoons
Our Mission: To protect and improve the health and environment of all Kansans.
•If and When Act. Sl. Is Required to Replace a Lagoon, KDHE Will Require Biological Nutrient Removal (BNR) Treatment Process Upgrades to Reduce Nutrients and also Reduce Energy Use and Improve Operations Reliability•EPA Provided a (Engr. Consultant) Contractor to Create a Small Flows Cost Curve for BNR Treatment Process Construction and Operations in Kansas
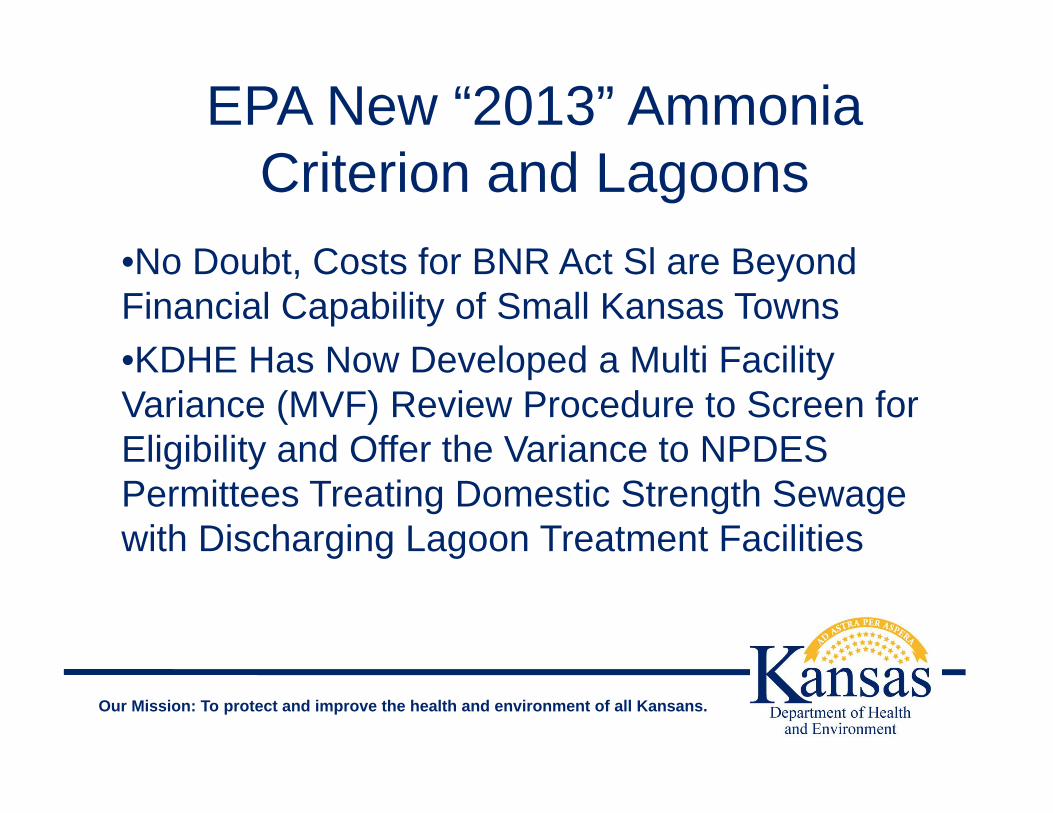
EPA New “2013” Ammonia Criterion and Lagoons
Our Mission: To protect and improve the health and environment of all Kansans.
•No Doubt, Costs for BNR Act Sl are Beyond Financial Capability of Small Kansas Towns•KDHE Has Now Developed a Multi Facility Variance (MVF) Review Procedure to Screen for Eligibility and Offer the Variance to NPDES Permittees Treating Domestic Strength Sewage with Discharging Lagoon Treatment Facilities
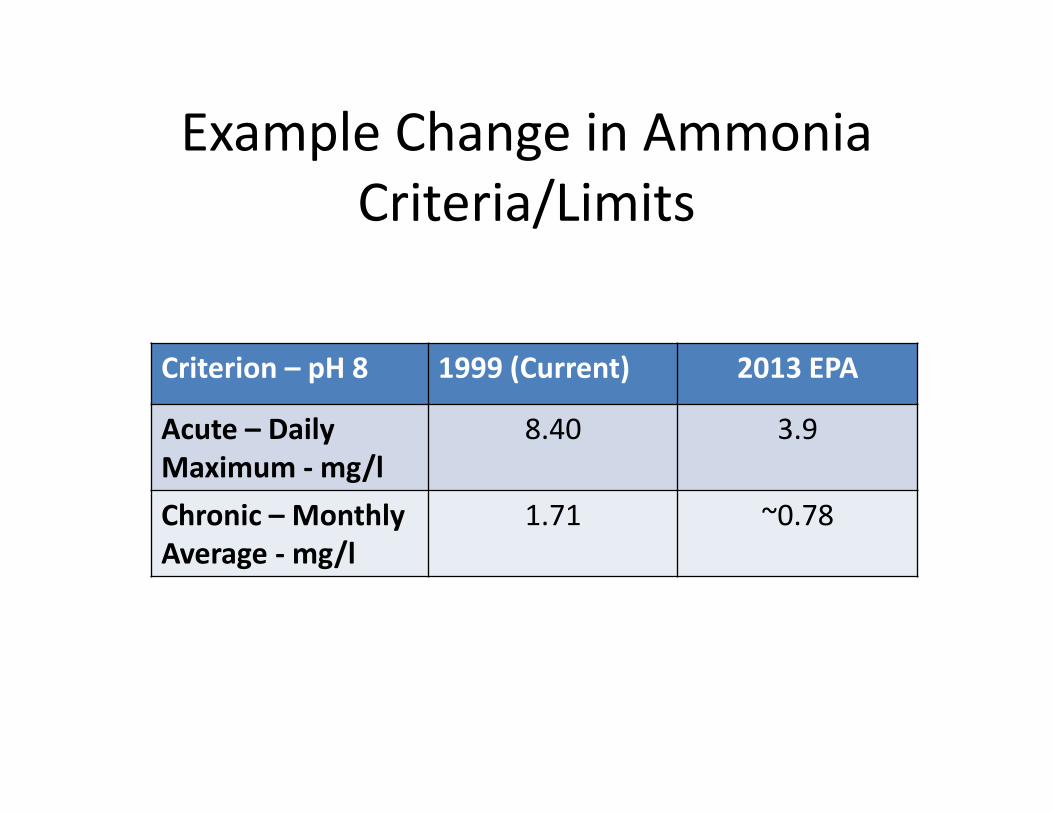
Example Change in Ammonia Criteria/Limits
Criterion – pH 8 1999 (Current) 2013 EPA
Acute – Daily Maximum ‐mg/l
8.40 3.9
Chronic – Monthly Average ‐mg/l
1.71 ~0.78

EPA Eco Region Nutrient Criteria
Stream Criteria
Region TN (mg/L) TP (ug/L) Chla (ug/L)
IV 0.56 23.00 2.40
V 0.88 67.00 3.00
VI 2.18 76.25 2.70
IX 0.69 36.56 0.93

Our Mission: To protect and improve the health and environment of all Kansans.
EPA Published these recommended criteria numbers in the year 2001 – 15 Years AgoTN proposed criteria in-stream is as low as 0.56 mg/lTP proposed criteria in-stream is as low as 0.023 mg/lBest WWTP performance for TN in 2001 was about 3.0 mg/l, but some now do better with DO/ORP ControlsBest WWTP performance for TP in 2001 was about 0.3 mg/l, but some now do better with DO/ORP Controls, and/or with Chemical Precipitation
EPA Eco Region Nutrient Criteria

Kansas Surface Water Nutrient Reduction Plan
Our Mission: To protect and improve the health and environment of all Kansans.
Document Prepared by KDHE Dated December 29, 2004Purpose was to consider ALL sources of nutrients –Municipal, Industrial, Agricultural, StormwaterResult for Municipal Wastewater Treatment was the 3 tiers of design for nutrient reduction – BNR, ENR, LOTFirst Phase Goals are BNR - 8.0 mg/l TN and 1.5 mg/l TP OR 10 mg/l TN and 1.0 mg/l TP – operator’s choice, considering influent pollutant balance of BOD to TN to TP

Kansas 303(d) List of Impaired Streams, TMDLs, and Permit Limits
Our Mission: To protect and improve the health and environment of all Kansans.
TN Contributes to Impairments in 409 Stream Segments and LakesTP Contributes to Impairments in 709 Lakes and Stream Segments compared to the Kansas “First Step” TMDL goal of 0.201 mg/l (201 ppb) in-stream concentration for TP

NPDES Permits and Nutrients
Our Mission: To protect and improve the health and environment of all Kansans.
•Impaired Streams 2016 303(d) Listings – TN– Ammonia – 1 stream segment– Nitrate – pH (also TP)– Biology ‐ Streams (also TP) – Eutrophication ‐ Lakes (also TP) – Dissolved Oxygen due to WWTPs (also TP)
•Impaired Streams 303(d) Listings – TP•TMDLs WLAs

NPDES Permits and Nutrients
Our Mission: To protect and improve the health and environment of all Kansans.
•Impaired Streams 2016 303(d) Listings – TN– Ammonia – 1 stream segment, JoCo Nelson WWTP– Nitrate – pH (also TP)– Biology ‐ Streams (also TP) – Eutrophication ‐ Lakes (also TP) – Dissolved Oxygen due to WWTPs (also TP)
•Impaired Streams 303(d) Listings – TP•TMDLs WLAs
NPDES Permits and Nutrients
Our Mission: To protect and improve the health and environment of all Kansans.
•Impaired Streams 2016 303(d) Listings – TN– Ammonia – 1 stream segment, JoCo Nelson WWTP– Nitrate – 11 stream segments– pH (also TP)– Biology ‐ Streams (also TP) – Eutrophication ‐ Lakes (also TP) – Dissolved Oxygen due to WWTPs (also TP)
•Impaired Streams 303(d) Listings – TP•TMDLs WLAs

NPDES Permits and Nutrients
Our Mission: To protect and improve the health and environment of all Kansans.
•Impaired Streams 2016 303(d) Listings – TN– Ammonia – 1 stream segment, JoCo Nelson WWTP– Nitrate – 11 stream segments, 9 due to WWTPs– pH (also TP)– Biology ‐ Streams (also TP) – Eutrophication ‐ Lakes (also TP) – Dissolved Oxygen due to WWTPs (also TP)
•Impaired Streams 303(d) Listings – TP•TMDLs WLAs

NPDES Permits and Nutrients
Our Mission: To protect and improve the health and environment of all Kansans.
•Impaired Streams 2016 303(d) Listings – TN– Ammonia – 1 stream segment, JoCo Nelson WWTP– Nitrate – 11 stream segments, 9 Due to WWTPs, 6 have Permits w/ Limit for NO3+NO2 of 10 mg/l
– pH (also TP)– Biology ‐ Streams (also TP) – Eutrophication ‐ Lakes (also TP) – Dissolved Oxygen due to WWTPs (also TP)
•Impaired Streams 303(d) Listings – TP•TMDLs WLAs

NPDES Permits and Nutrients
Our Mission: To protect and improve the health and environment of all Kansans.
•Impaired Streams 2016 303(d) Listings – TN– Ammonia – 1 stream segment, JoCo Nelson WWTP– Nitrate – 11 stream segments, 9 Due to WWTPs, 6 have Permits w/ Limit for NO3+NO2 of 10 mg/l, the other 3 are Wichita Plt. 1&2, Salina, and Emporia
– pH (also TP)– Biology ‐ Streams (also TP) – Eutrophication ‐ Lakes (also TP) – Dissolved Oxygen due to WWTPs (also TP)
•Impaired Streams 303(d) Listings – TP•TMDLs WLAs

NPDES Permits and Nutrients
Our Mission: To protect and improve the health and environment of all Kansans.
•Impaired Streams 2016 303(d) Listings – TN– Ammonia – 1 stream segment, JoCo Nelson WWTP– Nitrate – 11 stream segments, 9 Due to WWTPs, 5 have Permits w/ Limit for NO3+NO2 of 10 mg/l
– pH (also TP) – 44 stream segments– Biology ‐ Streams (also TP) – Eutrophication ‐ Lakes (also TP) – Dissolved Oxygen due to WWTPs (also TP)
•Impaired Streams 303(d) Listings – TP•TMDLs WLAs
NPDES Permits and Nutrients
Our Mission: To protect and improve the health and environment of all Kansans.
•Impaired Streams 2016 303(d) Listings – TN– Ammonia – 1 stream segment, JoCo Nelson WWTP– Nitrate – 11 stream segments, 9 Due to WWTPs, 5 have Permits w/ Limit for NO3+NO2 of 10 mg/l
– pH (also TP) – 44 stream segments– Biology ‐ Streams (also TP) ‐103 stream segments– Eutrophication ‐ Lakes (also TP) – Dissolved Oxygen due to WWTPs (also TP)
•Impaired Streams 303(d) Listings – TP•TMDLs WLAs

NPDES Permits and Nutrients
Our Mission: To protect and improve the health and environment of all Kansans.
•Impaired Streams 2016 303(d) Listings – TN– Ammonia – 1 stream segment, JoCo Nelson WWTP– Nitrate – 11 stream segments, 9 Due to WWTPs, 5 have Permits w/ Limit for NO3+NO2 of 10 mg/l
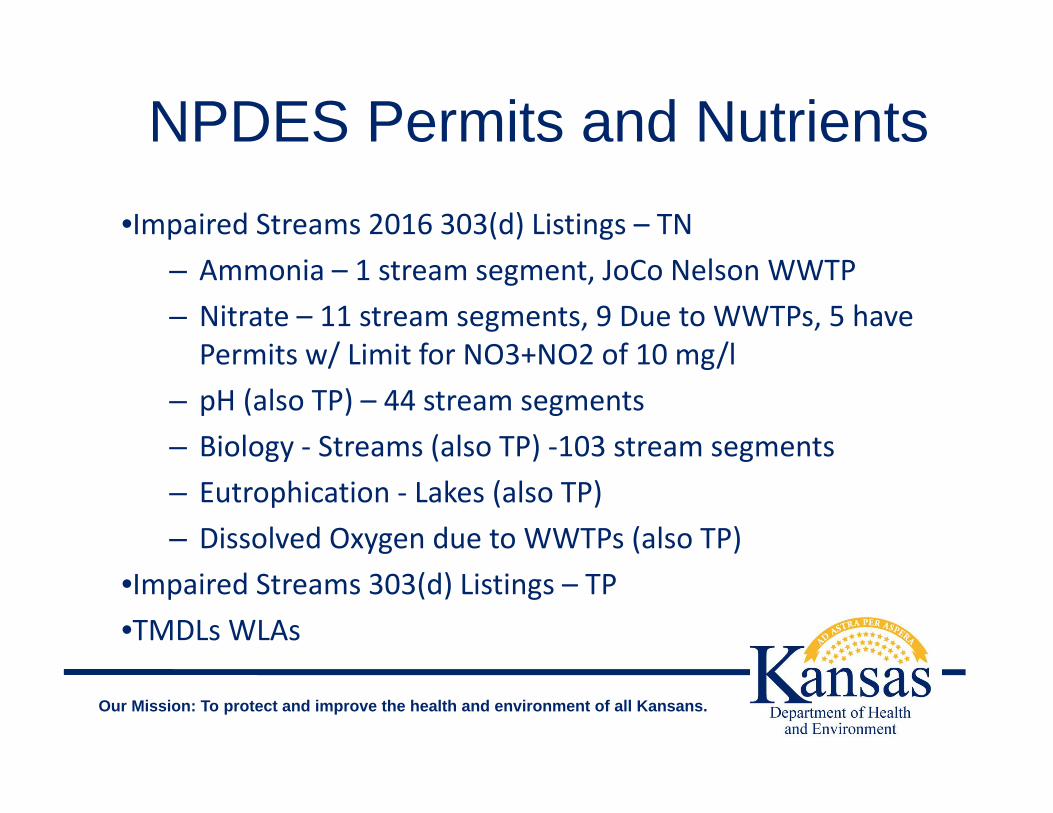
– pH (also TP) – 44 stream segments– Biology ‐ Streams (also TP) ‐103 stream segments– Eutrophication ‐ Lakes (also TP) – 248 lakes– Dissolved Oxygen due to WWTPs (also TP)
•Impaired Streams 303(d) Listings – TP•TMDLs WLAs

NPDES Permits and Nutrients
Our Mission: To protect and improve the health and environment of all Kansans.
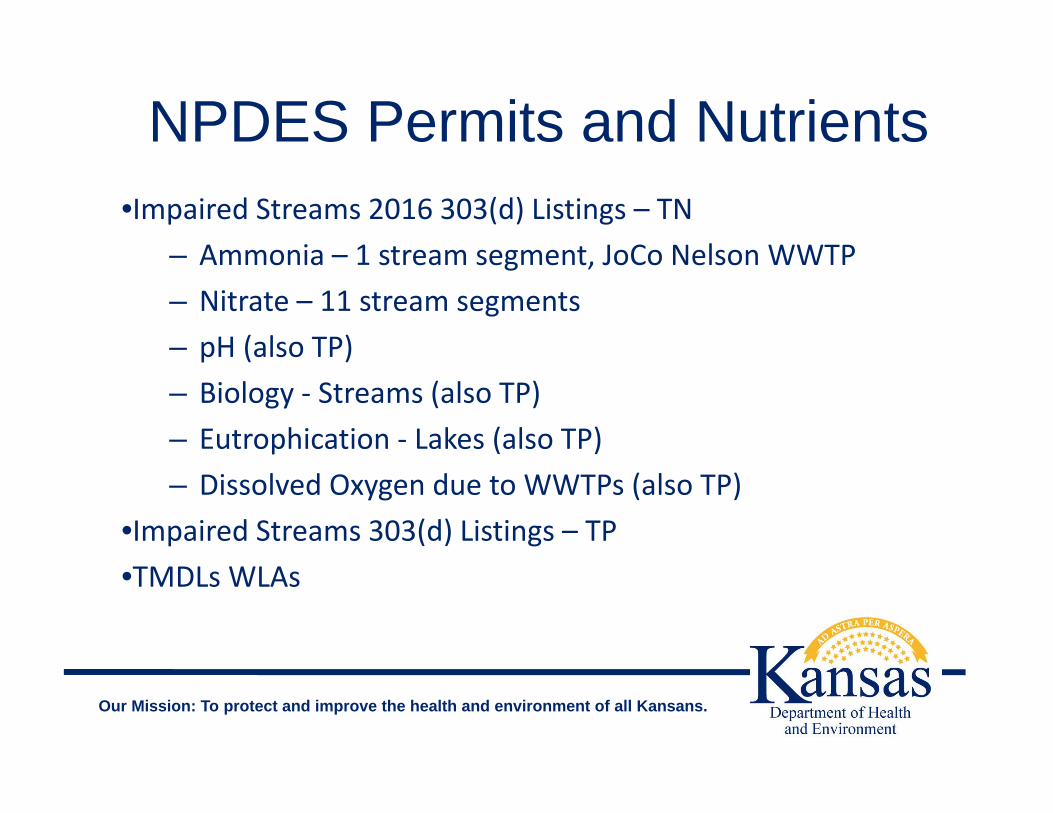
•Impaired Streams 2016 303(d) Listings – TN– Ammonia – 1 stream segment, JoCo Nelson WWTP– Nitrate – 11 stream segments, 9 Due to WWTPs, 5 have Permits w/ Limit for NO3+NO2 of 10 mg/l
– pH (also TP) – 44 stream segments– Biology ‐ Streams (also TP) ‐103 stream segments– Eutrophication ‐ Lakes (also TP) – 248 lakes– Dissolved Oxygen due to WWTPs (also TP) – 2 stream segments, JoCo Blue, ~Coff.
•Impaired Streams 303(d) Listings – TP•TMDLs WLAs

NPDES Permits and Nutrients
Our Mission: To protect and improve the health and environment of all Kansans.
•Impaired Streams 2016 303(d) Listings – TN– Ammonia – 1 stream segment, JoCo Nelson WWTP– Nitrate – 11 stream segments, 9 Due to WWTPs, 5 have Permits w/ Limit for NO3+NO2 of 10 mg/l
– pH (also TP) – 44 stream segments– Biology ‐ Streams (also TP) ‐103 stream segments– Eutrophication ‐ Lakes (also TP) – 248 lakes– Dissolved Oxygen due to WWTPs (also TP) – 2, JoCo Blue, ~ Coff.
•Impaired Streams 303(d) Listings – TP – Est. 350 Stream Segments Compared to EPA Eco‐Region Criteria, w/o Lakes•TMDLs WLAs

BOD Removal Bio-Chemistry
Our Mission: To protect and improve the health and environment of all Kansans.
•CBOD is Carbonaceous BOD : (CBOD) C5H7O2N + O2 + microbes = CO2 + H20 + N(gas) + more microbes•BOD5 Includes both CBOD and NOD --Nitrogenous Oxygen Demand – we use TKN Lab Test to Measure This -- which is Organic N (proteins) + Ammonia (NH3)
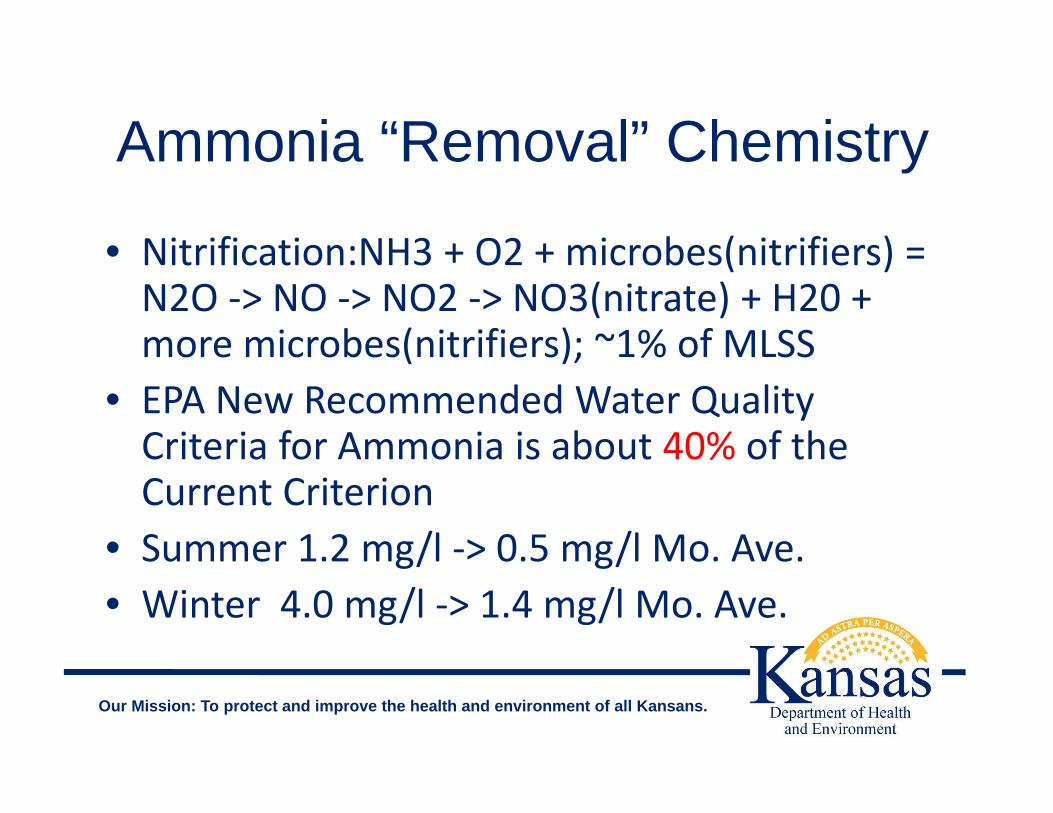
Ammonia “Removal” Chemistry
Our Mission: To protect and improve the health and environment of all Kansans.
• Nitrification:NH3 + O2 + microbes(nitrifiers) = N2O ‐> NO ‐> NO2 ‐> NO3(nitrate) + H20 + more microbes(nitrifiers); ~1% of MLSS
• EPA New Recommended Water Quality Criteria for Ammonia is about 40% of the Current Criterion
• Summer 1.2 mg/l ‐> 0.5 mg/l Mo. Ave.• Winter 4.0 mg/l ‐> 1.4 mg/l Mo. Ave.

Ammonia and Total Nitrogen
Our Mission: To protect and improve the health and environment of all Kansans.
TN in raw sewage is TKN (NH3 + Org-N) – in the reduced formsTN in treated effluent is TKN (NH3 + Org-N) + (NO3+NO2) – BOTH reduced and oxidized forms of nitrogenAlmost Every One of the Mech Plant NPDES permits in Kansas have Limits for Ammonia – Daily Max. and Monthly Average - mg/l
Ammonia and Total Nitrogen
Our Mission: To protect and improve the health and environment of all Kansans.
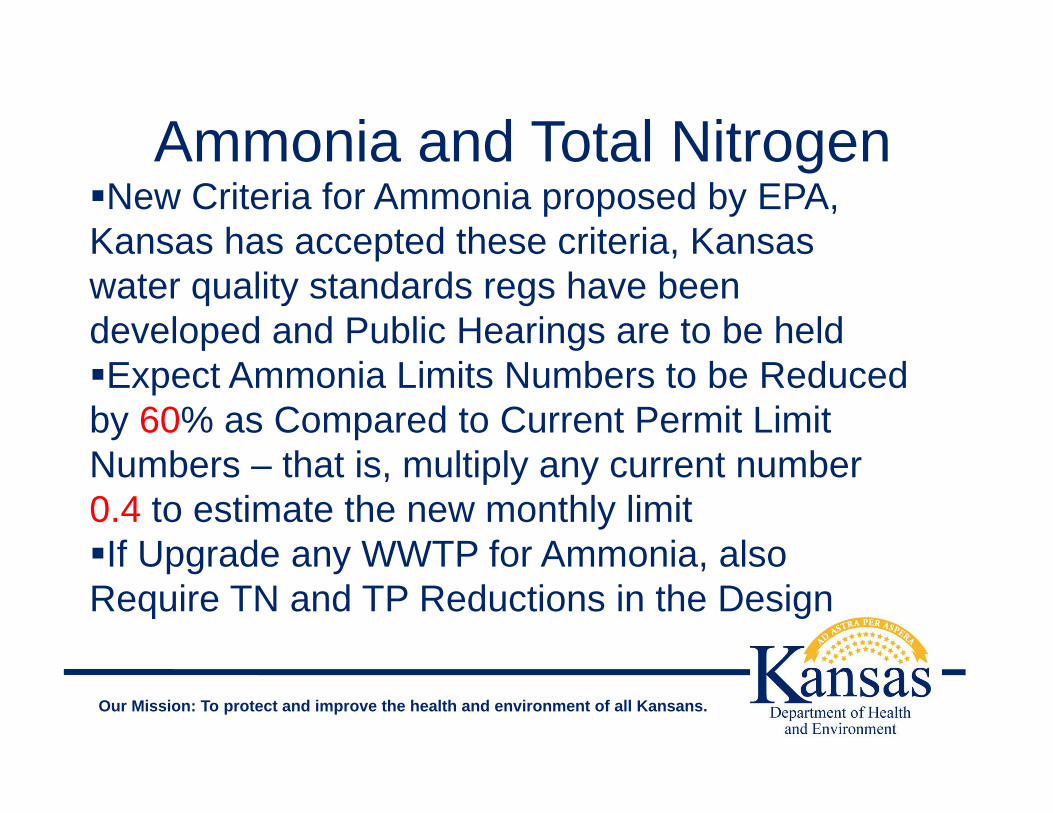
New Criteria for Ammonia proposed by EPA, Kansas has accepted these criteria, Kansas water quality standards regs have been developed and Public Hearings are to be heldExpect Ammonia Limits Numbers to be Reduced by 60% as Compared to Current Permit Limit Numbers – that is, multiply any current number 0.4 to estimate the new monthly limitIf Upgrade any WWTP for Ammonia, also Require TN and TP Reductions in the Design
Nutrient Removal – First TN
Our Mission: To protect and improve the health and environment of all Kansans.
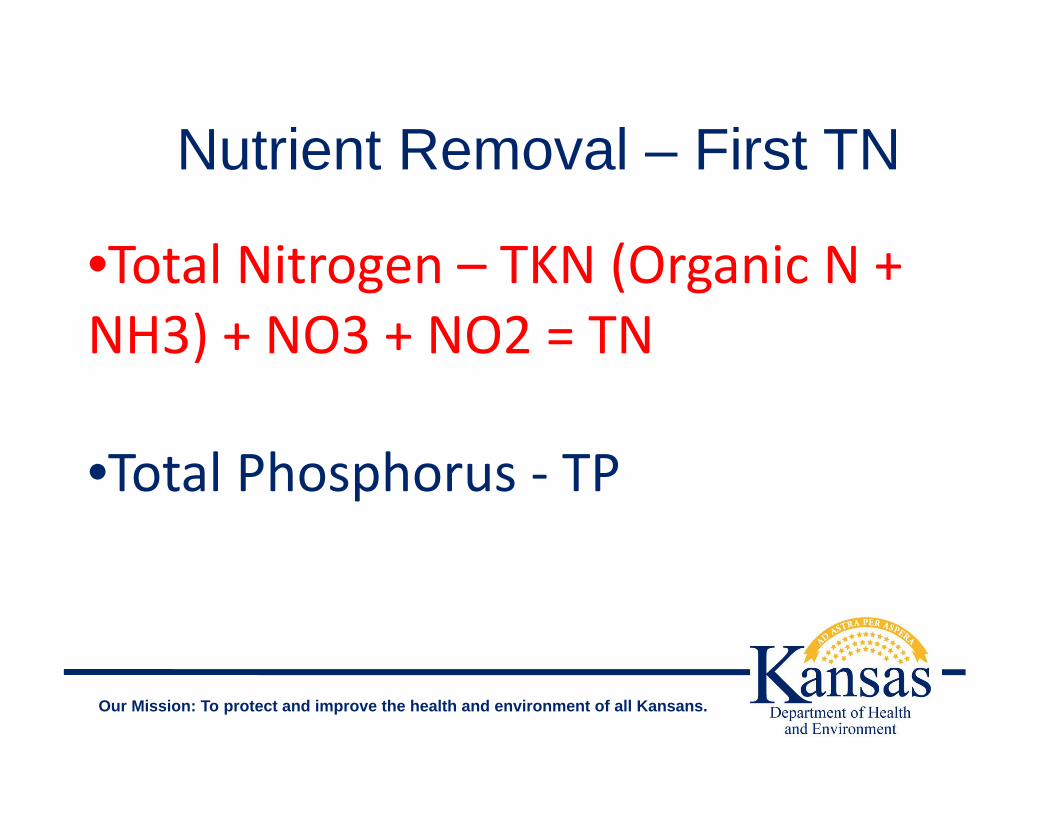
•Total Nitrogen – TKN (Organic N + NH3) + NO3 + NO2 = TN
•Total Phosphorus ‐ TP

Current Recommendations to Reduce Total Nitrogen
Our Mission: To protect and improve the health and environment of all Kansans.
•Kansas Surface Water Nutrient Reduction Plan – BNR - 8.0, ENR - 5.0, LOT - 3.0•Current Recommendation Continues to be to use Biological Processes to meet More Stringent Ammonia Criteria/Limits, and also meet the goal of 10 mg/l Monthly Average TN with De-nitrification without Chemical Addition

Current Recommendations to Reduce Total Nitrogen
Our Mission: To protect and improve the health and environment of all Kansans.
•We are Learning to do Better TN Reduction with Biological Processes with VFDs, DO/ORP Probes, and Computerized Aeration Controls•But if you need carbon source to denitrify –Suggest avoid Methanol; Suggest also try Glycerin (or Glycerol)

Computer Controls of Aeration Processes
Our Mission: To protect and improve the health and environment of all Kansans.
•Aeration Control can Substantially Reduce Total Nitrogen (and Total Phosphorus) in Effluent•Aeration Control can Substantially Reduce Energy Costs – Note: 1 pound NO3-N = 2.9 lbs D.O.•Computerization Control of Aeration Systems Reduces Electricity Use and Cost Savings can pay for Cost of Equipment within Months (not Years)

Computer Controls of Aeration Processes
Our Mission: To protect and improve the health and environment of all Kansans.
• ORP is Shaping Up to be a Superior Process Control Technique as Compared to DO, As this Allows Computers to Measure Use of NO3 in Addition to DO
•Can Reduce Minimum D. O. Setpoint, or the ORP setpoints – Which Eliminates Over-aeration
•Any Activated Sludge Process can be Controlled to Fully Nitrify – NH3 + O2 -> NO2; NO2 + O2 -> NO3

Computer Controls of Aeration Processes
Our Mission: To protect and improve the health and environment of all Kansans.
• And Controlled to De-nitrify - NO3 + BOD -> NO2; NO2 + BOD -> NO; NO + BOD -> N2 (gas)
• And Sometimes can also do Bio-P Reduction• Computer Adjusts Aeration to Maintain DO or ORP Setpoint with Variations of Air Temperature, Mixed Liquor Concentration, Water Temperature, and Diurnal Flow – Greatly Improves Aeration Efficiency

Computer Controls of Aeration Processes
Our Mission: To protect and improve the health and environment of all Kansans.
• Expected Reduction of Aeration Costs 30%, Overall Plant-wide Power Costs Expected Reduction of 15%
•Article in KRWA “The Kansas Lifeline” November 2013 – Buhler Oxidation Ditch -Reduced Total WWTP Electricity Use by 17%

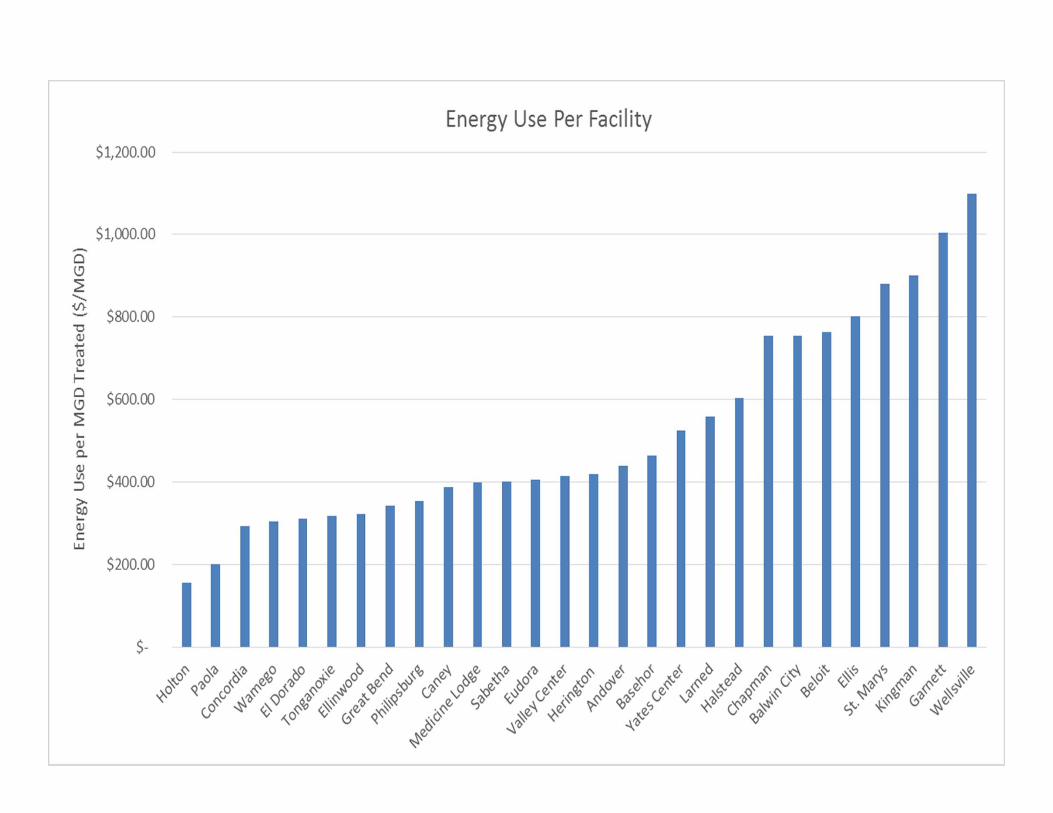
Operations Technical Assistance
Our Mission: To protect and improve the health and environment of all Kansans.
• KRWA Technical Assistance – Operations and Management Improvements to Resolve Non-Compliance at Small Mech Plants and Lagoons
• FSCC Technical Assistance – Operational Revisions to Reduce TN and TP in Effluent at Large WWTPs
• WSU Energy Audits – Facility and Operations Reviews to Reduce Energy and Oper. Costs at Small Mech WWTPs
Operations Technical Assistance
Our Mission: To protect and improve the health and environment of all Kansans.
• No Cost to City or Owner – Tech Assistance Contracts are paid by KDHE CW SRF Service Fees
• The Next Few Slides Present a Summary of Electricity Use at many Different Types of WWTFs Now in Use in Kansas as Provided by the WSU Efforts
• Electricity Use Varies from 2,500 kWh/MG Treated to 11,900 kWh/MG Treated

Electricity Usage
Our Mission: To protect and improve the health and environment of all Kansans.
- At National Level - WERF Report “A Guide to Net-Zero Solutions for Water Resource Recovery Facilities” (2015)
- “Typical” Electricity Use BNR about 1,800 kWh/MG Treated
- “Best-Practice” Electricity Use BNR about 1,100 kWh/MG Treated
- We Have Opportunities to Improve

Our Mission: To protect and improve the health and environment of all Kansans.
Our Mission: To protect and improve the health and environment of all Kansans.

Reduce Electricity Usage
Our Mission: To protect and improve the health and environment of all Kansans.
•Upcoming EPA “2013” Criteria for Ammonia Will Require Almost All WWTPs in Kansas to Fully Nitrify –Power Usage and Costs Will Increase•First Thing to Reduce Power Costs, if Nitrify and do not De-nitrify, then Revise the Treatment Process to De-Nitrify and Utilize the NO3 (nitrate) Oxygen
– Motors & Blowers– use VFDs (or AFDs)– Add Full Time OPR/DO Monitors– Computer Controls to Insure Minimum Power to
meet DO Needs, and to De-nitrify (SCADA)

Our Mission: To protect and improve the health and environment of all Kansans.

Our Mission: To protect and improve the health and environment of all Kansans.

Lessons Learned – Small Mech WWTP Reviews
Our Mission: To protect and improve the health and environment of all Kansans.
• Aeration Control can Substantially Reduce TN (and TP) in Effluent by “Recovering” the Oxygen from Nitrate (NO3), by use of Computerized Control of Aeration Systems
• AND Effluent Quality Improves!!• Minor Costs of Probes, Controls, Computer are Responsibility of City or Owner
• BUT!! Also we HAVE to Keep the Bugs Warm –Above 10 C or the Nitrifiers Lay Down on the Job

Continuing – Nutrient Removal ‐ TP
Our Mission: To protect and improve the health and environment of all Kansans.
•Total Nitrogen – TKN (Organic N + NH3) + NO3 + NO2 = TN
•Total Phosphorus ‐ TP

Total Phosphorus
Our Mission: To protect and improve the health and environment of all Kansans.
- Measured as both Ortho-phosphate (oxidized PO4) and Phosphorus (not oxidized)
- Oxidized Phosphorus (as PO4 – phosphate) can be in solids or in liquids
- The “Not oxidized” Phosphorus (as P) can also be in solids or in liquids
- Purpose of wastewater “treatment” is to change all liquid-form P into solid-form P, and remove the solid TP with the sludge

Total Phosphorus
Our Mission: To protect and improve the health and environment of all Kansans.
- TP in Bio-P WWTP effluent and Sludge is more “bioavailable” than TP from mineral fertilizers, or NPS runoff
- Phosphorus is Everywhere – food, cleansers, fertilizers, toothpaste, dish soap, laundry soap, prep for painting, matchsticks, and on and on and on
- Phosphorus is in our teeth, its in our bones, its inside our eyeballs
Total Phosphorus
Our Mission: To protect and improve the health and environment of all Kansans.
- History – EPA published the “Process Design Manual for Phosphorus Removal” in 1971, updated in 1976
- In 1971 “typical” TP in Raw Sewage was an Average ~ 11.5 mg/l, Median ~ 10.0 mg/l in that study

Total Phosphorus
Our Mission: To protect and improve the health and environment of all Kansans.
- Today, in Kansas, information from the KDHE DMR/Oracle database – Raw Sewage Average TP is ~5.1 mg/l and Median ~4.5 mg/l
- Why the Decrease? EPA is working with industry to reduce/remove Phosphorus from Daily Use Products, and Having Good Success
Kansas 303(d) List of Impaired Streams, TMDLs, and Permit Limits
Our Mission: To protect and improve the health and environment of all Kansans.
Kansas is taking an “incremental” approach to TP control thru 303(d) Listings and implementation Phase 1 is 201 ppb in-stream concentration, and effluent limits of 1.5 - 1.0 mg/l for Mech Plants, and 2.0 mg/l performance expectation for lagoons – Annual Averages (Prior 12 months effluent data)
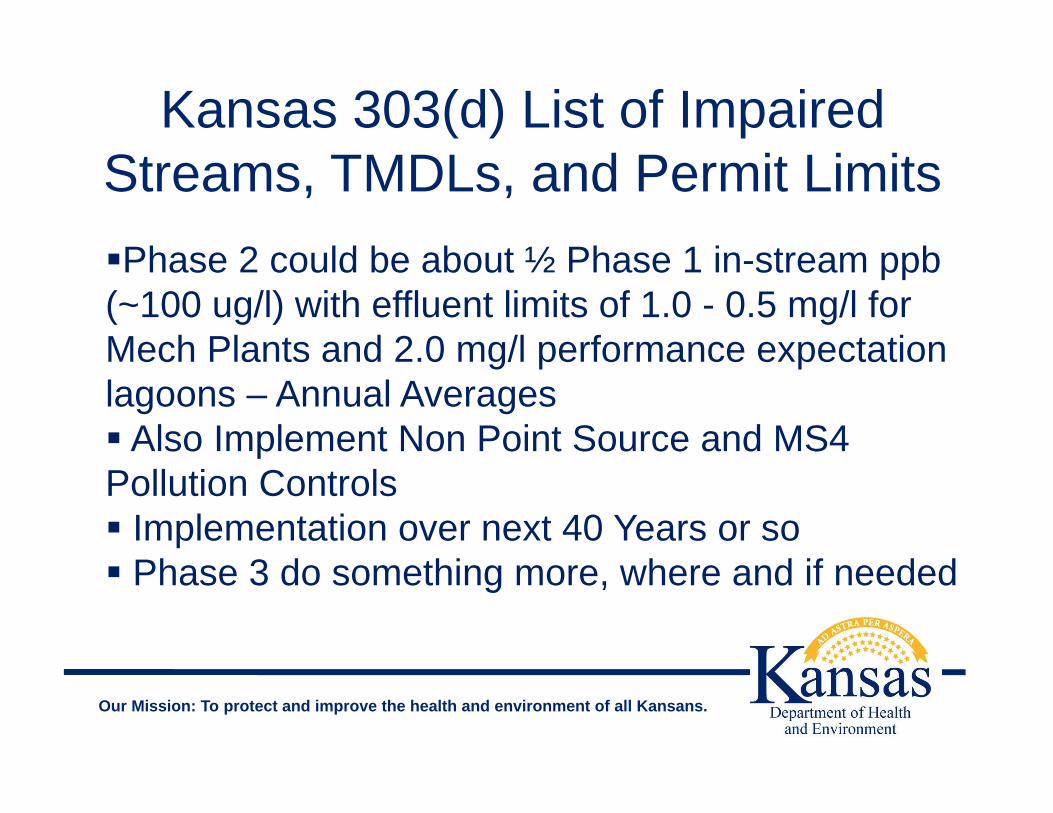
Kansas 303(d) List of Impaired Streams, TMDLs, and Permit Limits
Our Mission: To protect and improve the health and environment of all Kansans.
Phase 2 could be about ½ Phase 1 in-stream ppb (~100 ug/l) with effluent limits of 1.0 - 0.5 mg/l for Mech Plants and 2.0 mg/l performance expectation lagoons – Annual Averages Also Implement Non Point Source and MS4 Pollution Controls Implementation over next 40 Years or so Phase 3 do something more, where and if needed

Biological Phosphorus Removal
Our Mission: To protect and improve the health and environment of all Kansans.
- Also Called “Luxury Uptake” as the microbes take in more P than they need to survive, and form ortho-phosphate “lipids” inside the sludge microbes
- Requires a “Balanced Diet” of Pollutants – 40:10:1200 BOD : 50 TKN : 5 TP -- Normal Domestic
Strength Sewage in Kansas today- New Designs Provide 3 to 5 Chamber Activated
Sludge System – Anaerobic Tank, Anoxic Tank, Aeration Tank – and Well Trained Operator, with Computer Controls Really Helps

Biological Phosphorus Removal
Our Mission: To protect and improve the health and environment of all Kansans.
- Sequencing Batch Reactors - Some can do Luxury Uptake, Some Can’t – Detention Time
- But ANY Existing WWTF Design an Improve with Improved Operations Training and Computer Controls
- If Influent TP is over 7 mg/l, suggest look for high strength discharge – industry that paints, food or meat processing, soap or cleanser manufacturer, and require pretreatment to reduce TP to 1.0 mg/l

Biological Phosphorus Removal
Our Mission: To protect and improve the health and environment of all Kansans.
- Also Consider Changing Sewer Use Ordinance, to NOT Surcharge high BOD and TSS, but Instead Surcharge high TP
- Bio-P Fails When the Microbes Run out of BOD - Bio-P Activated Sludge Process uses lots of
BOD to “capture and recapture” phosphorus into and out of the microbes

Recent Change to Emphasize TP over TN
Our Mission: To protect and improve the health and environment of all Kansans.
• TP – Ks Nut Red Plan – BNR – 1.5 mg/l, ENR –0.5 mg/l, LOT – 0.3 mg/l
• TP – Ks Nut Red Strategy – BNR/TMDLs – 1.0 mg/l – with Enforceable Limit as lbs per day, Prior 12 Month Annual Average
• Prior Guidance was to use Biological Processes, then Also use Chemical Addition (i.e., alum, ferric chloride), as Best the Community can Afford

Recent Change to Emphasize TP over TN
Our Mission: To protect and improve the health and environment of all Kansans.
• New Emphasis Continues to be to Encourage Biological Processes, and/or also Chemical Addition as needed, goal is 1.0 mg/l Monthly Average
• And we can Reduce TP Further with Chemical Addition Following Bio-P Removal

Bio‐P and Chem‐P Phosphorus Removal
Our Mission: To protect and improve the health and environment of all Kansans.
- Bio-P Process – P + O2 -> PO4 (oxidized); PO4 + BOD -> P (reduced) ; P + O2 -> PO4; PO4 + BOD -> P; over and over and over again
- Waste Sludge Volume Reduced by Denitrification, Waste Sludge Volume Slightly Increased by Bio-P Process

Bio‐P and Chem‐P Phosphorus Removal
Our Mission: To protect and improve the health and environment of all Kansans.
- Chem-P Removal can use Alum or Ferric, and an Operations Scheme can add Chemical at Several Locations in Collection System (odor control, ties up H2S first then P) and/or Treatment Process
- Chem.-P Removal can use Many of the Different Forms of Alum or Ferric, can add Chemical to Several Locations, Into the Collection System (as odor control ties up H2S first, then P) and/or Into the Treatment Plant Processes

Chem‐P Phosphorus Removal
Our Mission: To protect and improve the health and environment of all Kansans.
-Chem-P Treatment Significantly Increases Waste Sludge Volume, Each WWTP Unique, Est. 20% to 40% Increase in Sludge Solids Volume to Reduce TP from 5 mg/l Influent to TP to 1 mg/l Effluent
-Always do Jar Tests as Part of Design Services or Testing Operations Changes
Chem‐P Phosphorus Removal
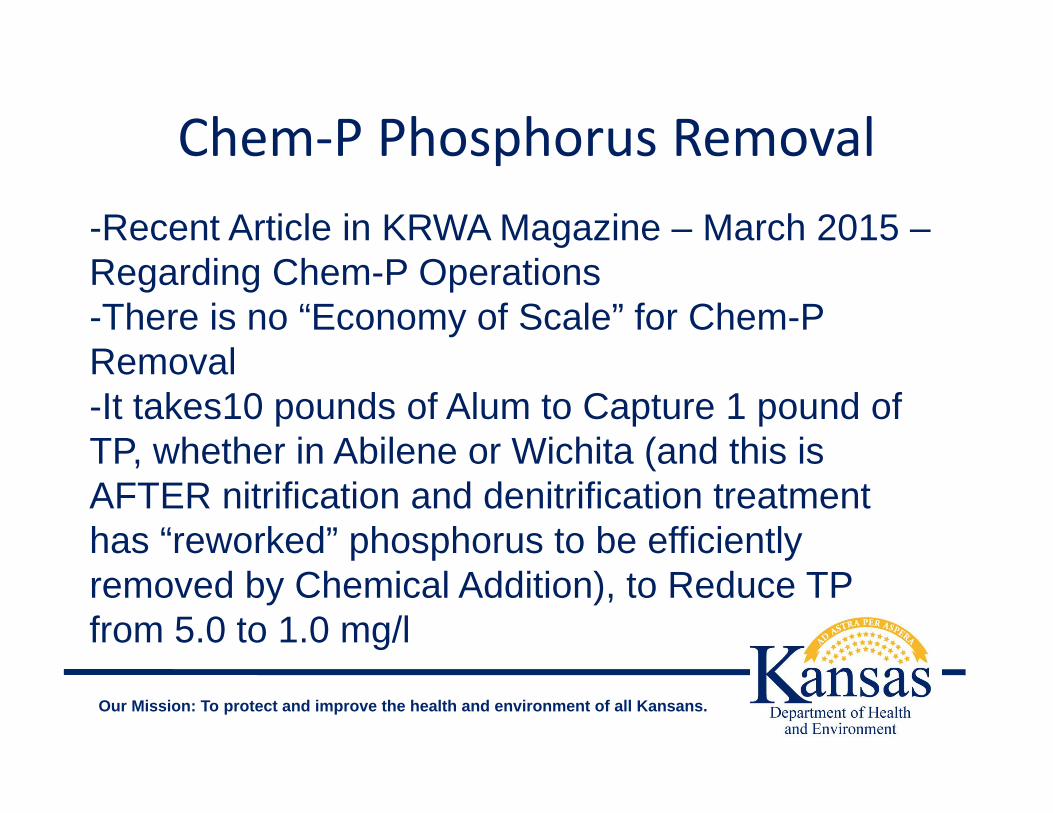
Our Mission: To protect and improve the health and environment of all Kansans.
-Recent Article in KRWA Magazine – March 2015 –Regarding Chem-P Operations-There is no “Economy of Scale” for Chem-P Removal-It takes10 pounds of Alum to Capture 1 pound of TP, whether in Abilene or Wichita (and this is AFTER nitrification and denitrification treatment has “reworked” phosphorus to be efficiently removed by Chemical Addition), to Reduce TP from 5.0 to 1.0 mg/l

Phosphorus Removal is Different
Our Mission: To protect and improve the health and environment of all Kansans.
EPA Report-Advanced Wastewater Treatment to Achieve Low Concentration of Phosphorus, EPA 910-R-07-002 April 2007
Factoid from the Report-Effluent TP Concentrations can be Reduced to 0.10 mg/l by Addition of Alum to a BNR Effluent at 135 mg/l Followed by Filtration –Effluent pH Adjustment Then Also Required

Giving Credit….
Our Mission: To protect and improve the health and environment of all Kansans.
The Next Two Slides are taken From a Presentation by Dr. David Jenkins, Professor in the Graduate School
University of California at Berkeley, entitled “Principals of Phosphate Removal
by Chemical Precipitation” presented at the WEFTEC Technical Workshop “Phosphorus Removal to Very Low
Levels”, October 22, 2006, in Dallas, TX

Phosphorus Removal is Different
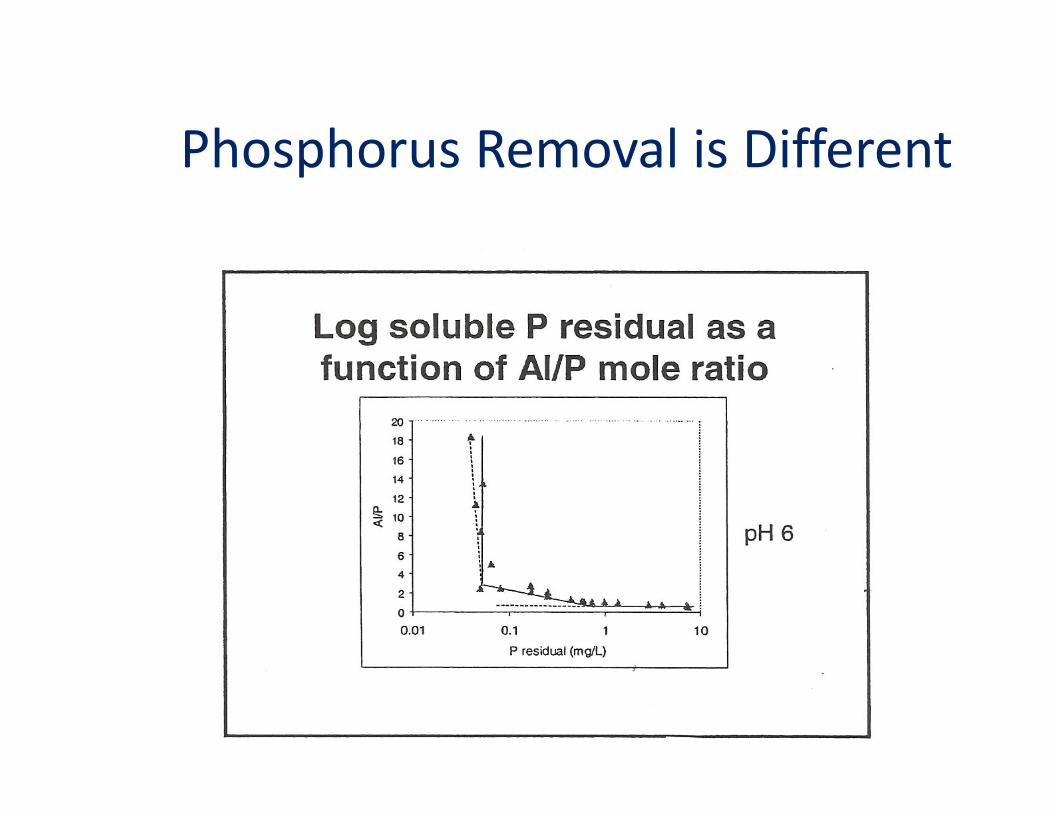
Phosphorus Removal is Different
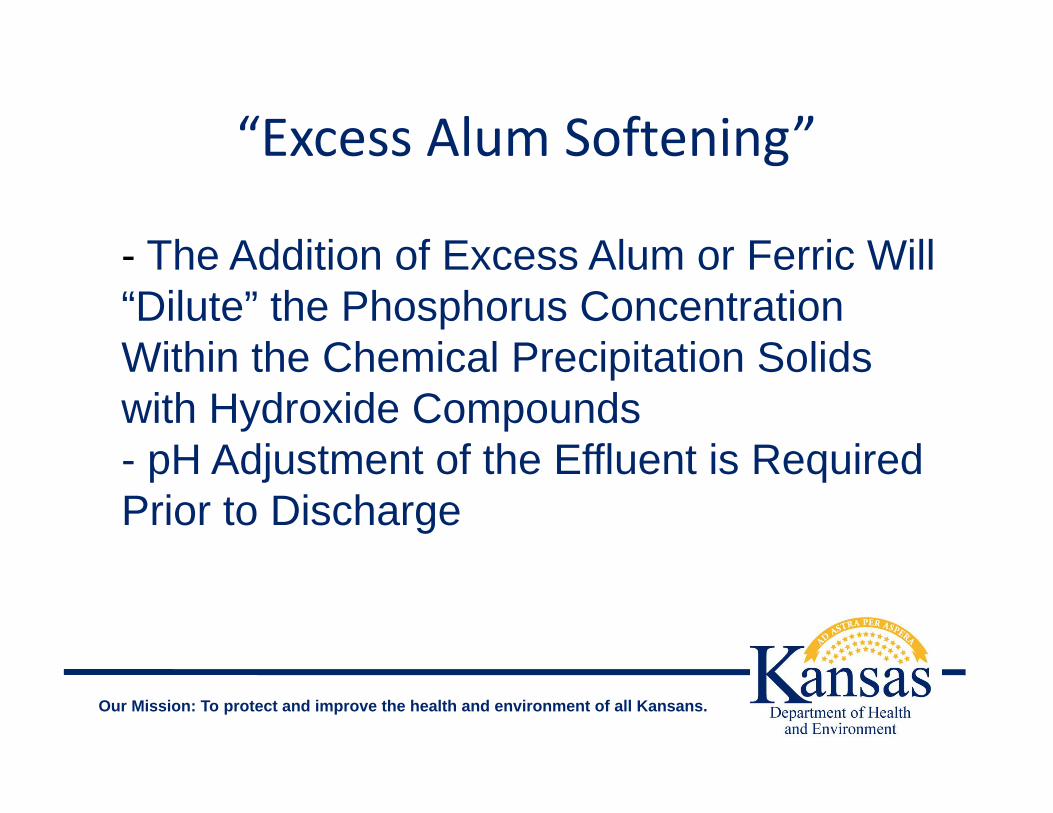
“Excess Alum Softening”
Our Mission: To protect and improve the health and environment of all Kansans.
- The Addition of Excess Alum or Ferric Will “Dilute” the Phosphorus Concentration Within the Chemical Precipitation Solids with Hydroxide Compounds- pH Adjustment of the Effluent is Required Prior to Discharge

“Excess Alum Softening” con’t
Our Mission: To protect and improve the health and environment of all Kansans.
Assuming 1 mg/l TSS in EffluentAl to P Ratio for TP >= 0.5 mg/l is 1 to 1Al to P Ratio for TP =< 0.1 mg/l is 4 to 1Al to P Ratio for TP =< 0.03 mg/l is 10 to 1Al to P Ratio for TP =< 0.01 mg/l is 30 to 1
Note Alum is About 10% Aluminum

Diversity of Treatment in Kansas
Our Mission: To protect and improve the health and environment of all Kansans.
- Example: Connecticut – 90 WWTPs (all alike??)- Kansas – Seems Like Every WWTP is Different
- ABCs of Equipment and Designs- Aero-mods- (sequencing) Batch Reactors- “Carousel” (“racetrack”) [Vertical Turbine Mixers]- Oxidation Ditches [Horizontal Rotors]- Schreiber Designs- Unique Designs

Oxidation Ditch
Our Mission: To protect and improve the health and environment of all Kansans.
Raw Sewage
PS HW FC
FC
UV
Effluent to StreamValveVault
RAS
M
M

Oxidation Ditch Nitrification-Denitrification Process
Our Mission: To protect and improve the health and environment of all Kansans.
MVFD
MVFDDO or ORP Probe
Raw Sewage
RAS
MLSS to Clarifiers
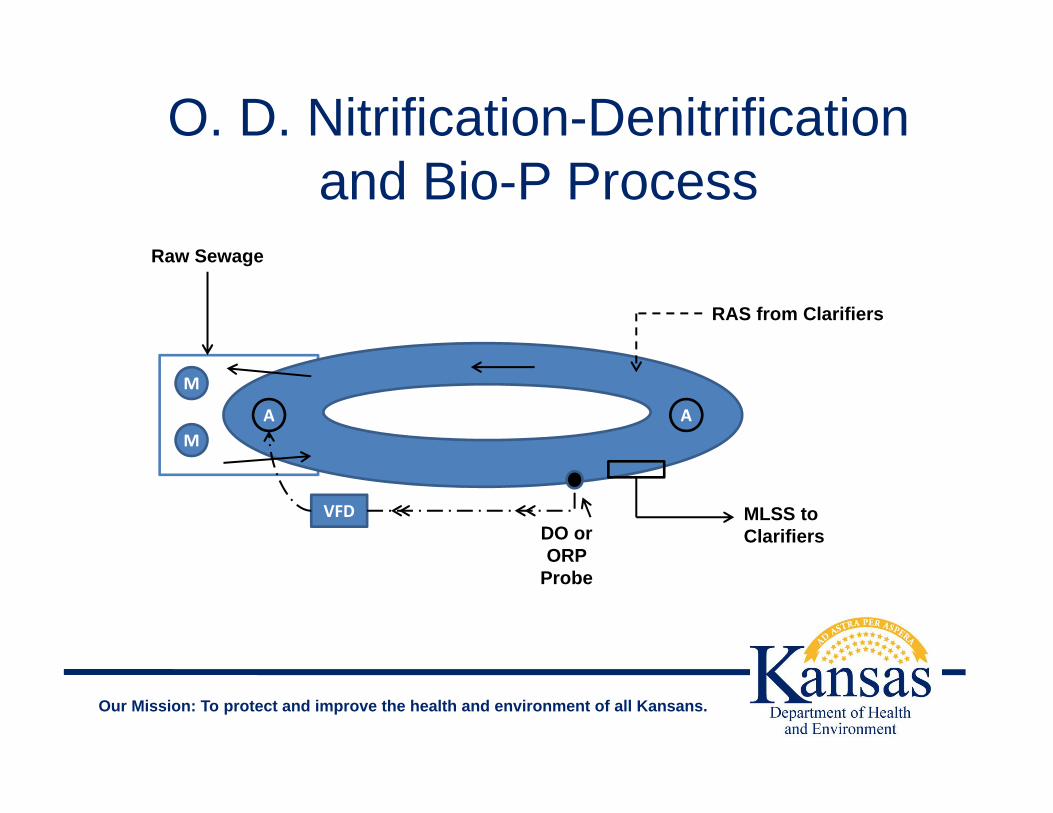
O. D. Nitrification-Denitrification and Bio-P Process
Our Mission: To protect and improve the health and environment of all Kansans.
M
M
Raw Sewage
RAS from Clarifiers
A A
VFD MLSS to ClarifiersDO or
ORP Probe

Buhler Oxidation Ditch
76

Oxidation Ditch – Chem-P
Our Mission: To protect and improve the health and environment of all Kansans.
Raw Sewage
PS HW FC
FC
UV
Effluent to StreamValveVault
RAS
M
M

Edgerton Chem‐P System
Our Mission: To protect and improve the health and environment of all Kansans.

Our Mission: To protect and improve the health and environment of all Kansans.
Edgerton Chem‐P System cont.

“Carousel” Nitrification-Denitrification and Bio-P Process
M
M
Raw Sewage
RAS from Clarifiers
A A
VFD MLSS to ClarifiersDO or
ORP Probe
Our Mission: To protect and improve the health and environment of all Kansans..

Haysville “Carousel”
81

Maize Aeromod
82

Spring Hill Schreiber
83

Abilene SBR
84

Chanute Unique Trickling Filter
85

Salina Unique
86

Our Mission: To protect and improve the health and environment of all Kansans.
Poundages, Flow Measurement and Effluent Reuse
- Reporting Daily Poundage Discharges is required by TMDL/Waste Loan Allocations, Which Requires Effluent Flow Measurement
- Effluent Reuse, such as Irrigation, Provides an Alternate Path for Effluent Other than Discharge to the Receiving Stream
- KDHE is Now Also Reviewing Permits to Require Flow Measurement of Effluent to Irrigation or Other Reuse Methods
- Effluent Reuse is Encouraged, as this Reduces Pounds of Nutrients Discharged to Streams

Our Mission: To protect and improve the health and environment of all Kansans.
Reuse of Effluent to Reduce Discharge Volumes and Costs
Agricultural Irrigation130 Muni, Comm, Ind WWTP Permits Allow “Optional” Irrigation, with no Additional Disinfection Required, about 10 Permits Have “Mandatory” Reuse
Golf Course Irrigation24 Muni & Comm Permits, Additional Disinfection is Required to Protect Public Access Areas
Industrial Reuse – Typically Cooling5 to 10 Permits Allow This
Less Stringent Treatment Required to Reuse Effluent Than to Discharge to Stream

Reuse of Effluent to Help Meet Nutrient Reduction Goals
Our Mission: To protect and improve the health and environment of all Kansans.
• Example – Ks Nutrient Goals of 8 mg/l TN & 1.5 mg/l TP are Annual Averages
• 1.0 MGD effluent flow X 8 mg/l TN X 8.34 (conversion factor) = 66.7 #/da X 365 day/yr = 24,353 #/yr
• If Irrigate Golf Course 30 da/yr @ 1 mgd/day, then TN Discharged to Stream is (365‐30=335 days) 24,353/335 = 72.7 #/da Allowed When Discharging, or 8.7 mg/l

Summary
Our Mission: To protect and improve the health and environment of all Kansans.
- KDHE Nutrient Reduction Efforts Today are to Establish Goals (10 and 1) and Offer Training to Operators (Fort Scott CC, KRWA, WSU)
- Perhaps Nearly Every Activated Sludge WWTP in Kansas can be Upgraded to produce 3 mg/l TN with DO Probes and VFDs and Computer Controls, AND Save Electricity
- Perhaps Bio-P can be Added to Activated Sludge WWTPs to Produce 1.0 mg/l TP, but expect Construction Upgrades
Summary
Our Mission: To protect and improve the health and environment of all Kansans.
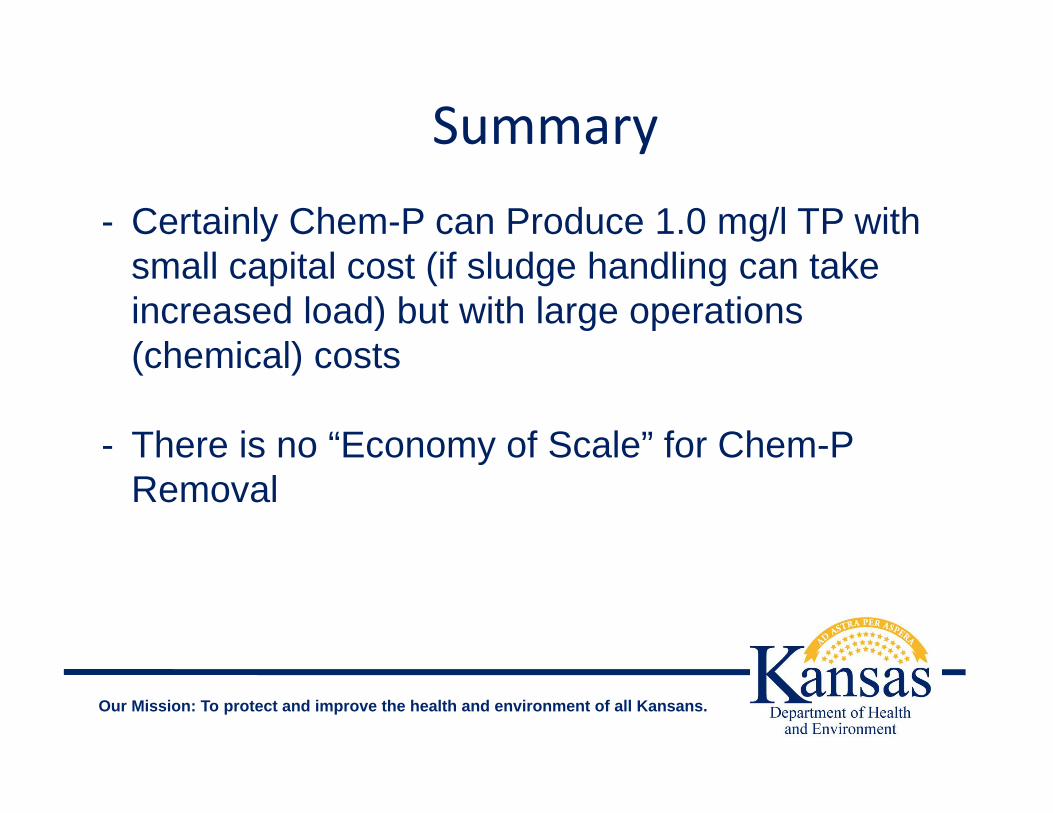
- Certainly Chem-P can Produce 1.0 mg/l TP with small capital cost (if sludge handling can take increased load) but with large operations (chemical) costs
- There is no “Economy of Scale” for Chem-P Removal

Summary
Our Mission: To protect and improve the health and environment of all Kansans.
- It takes10 pounds of Alum to Capture 1 pound of TP, whether in Abilene or Wichita, and this is AFTER nitrification and denitrification treatment has “reworked” phosphorus to be efficiently removed, to Reduce TP from 5.0 to 1.0 mg/l
- Operators Should Experiment with Jar tests and Chemical additions, to Determine Quantities of Chemical Needed and Sludge Produced

Summary
Our Mission: To protect and improve the health and environment of all Kansans.
- For Larger Design Flow WWTPs – Bio-P is Often Cheaper, Process Design in Conjunction With Ammonia Removal
- Costs?? Each WWTP is Unique. Expect Chem-P to cost $1 to $2 per month per household for chemical purchase and feeders/storage, AND this assumes no upgrade needed to solids handling facilities
Summary
Our Mission: To protect and improve the health and environment of all Kansans.
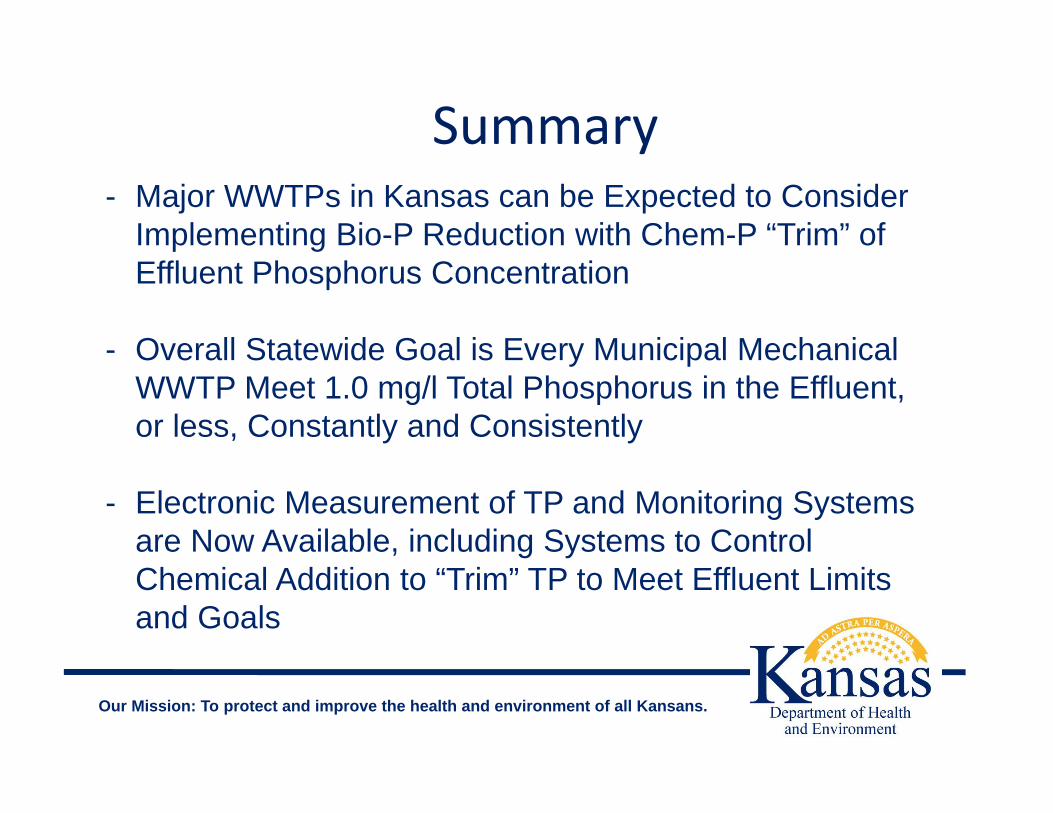
- Major WWTPs in Kansas can be Expected to Consider Implementing Bio-P Reduction with Chem-P “Trim” of Effluent Phosphorus Concentration
- Overall Statewide Goal is Every Municipal Mechanical WWTP Meet 1.0 mg/l Total Phosphorus in the Effluent, or less, Constantly and Consistently
- Electronic Measurement of TP and Monitoring Systems are Now Available, including Systems to Control Chemical Addition to “Trim” TP to Meet Effluent Limits and Goals

Bottom Line
Our Mission: To protect and improve the health and environment of all Kansans.
•Significant push to reduce nutrients•Kansas – will utilize an incremental reduction strategy
– Reduce now, criteria later– May need tweaking, but still the framework for reduction– EPA and environmental groups acknowledge progress
• Want to see more results more quickly•Non Point Source reduction is a long process
– Probably 1‐4 decades depending on watershed size•Point Sources can take measured steps now
– We do see impacts from Point Sources (wastewater trmt. plants)– Failure to do so would invite intervention by others
• Most likely, very stringent criteria = stringent permit limits


www.kdheks.gov