kansas lower republican basin total … · retention time (months) est. 2 ... all but five of the...
TRANSCRIPT

1
KANSAS LOWER REPUBLICAN BASIN TOTAL MAXIMUM DAILY LOAD
Water Body: Lake Olathe and Cedar Lake Water Quality Impairment: Eutrophication (Replaces Existing Cedar Lake Eutrophication TMDL)
1. INTRODUCTION AND PROBLEM IDENTIFICATION Subbasin: Lower Kansas River County: Johnson HUC 8: 10270104 HUC 11 (HUC 14): 060 (020) (Figure 1) Ecoregion: IX-Southeastern Temperate Forested Plains and Hills, Central Irregular Plains,
Osage Cuestas (40b) Drainage Area: Approximately 16.9 square miles (Cedar Lake 6.10 square miles, Lake Olathe
10.8 square miles) Conservation Pool: Cedar Lake Lake Olathe Surface Area (acres) 54 170
Maximum Depth (feet) 14.0 44.0 Mean Depth (feet) 6.20 18.2 Total Storage Volume 334 3,100
(acre-feet) Retention Time (months) Est. 2 Est. 6
Designated Uses: Primary Contact Recreation (A for Lake Olathe and B for Cedar Lake);
Expected Aquatic Life Support; Domestic Water Supply; Food Procurement; Industrial Water Supply
Authority: City of Olathe 2004 303(d) Listing: Kansas/Lower Republican River Basin – Lakes (Lake Olathe) 1998 303(d) Listing: Table 4 – Water Quality Limited Lakes (Cedar Lake) Impaired Use: All uses are impaired to a degree by eutrophication Water Quality Standard: Nutrients - Narrative: The introduction of plant nutrients into
streams, lakes, or wetlands from artificial sources shall be controlled to

2
prevent the accelerated succession or replacement of aquatic biota or the production of undesirable quantities or kinds of aquatic life. (KAR 28-16-28e(c)(2)(B)). The introduction of plant nutrients into surface waters designated for
primary or secondary contact recreational use shall be controlled to prevent the development of objectionable concentrations of algae or algal by-products or nuisance growths of submersed, floating, or emergent aquatic vegetation. (KAR 28-16-28e(c)(7)(A)).
Figure 1. Map of Lake Olathe Watershed

3
2. CURRENT WATER QUALITY CONDITION AND DESIRED ENDPOINT
Level of Eutrophication: Cedar Lake - Lower Hypereutrophic, Trophic State Index = 67.0 Lake Olathe – Fully Eutrophic, Trophic State Index = 59.7 Monitoring Sites: LM061601 for Cedar Lake, LM061301 for Lake Olathe, USGS Monitoring Sites (USGS 06892440, USGS 06892450, and USGS 385218094521200) for Cedar Creek and Lake Olathe. Period of Record Used: Surveys by KDHE in 1989 and USGS in 1998 - 2004. Current Condition: A TMDL was completed for Cedar Lake in 1999 – The lake in 1989 had an average chlorophyll a concentration of 41 µg/L (ppb) and Trophic State Index of 67.0 indicating a hypereutrophic condition. The average total phosphorus concentration was 115 µg/L (ppb). Phosphorus appears to the primary limiting factor. Chlorophyll-to-phosphorus yield was good. Inorganic turbidity was very low, with abundant light in the shallow water column. This TMDL will make slight adjustments to the existing Cedar Lake TMDL, but will focus primarily on Lake Olathe. Over the period of record, the average chlorophyll-a concentration in Lake Olathe was 19.4 µg/L (ppb). This relates to a Trophic State Index of 59.7. The average, total phosphorus (TP) concentration was 0.05 mg/L (ppm). The average total Kjeldahl nitrogen (TKN) was 0.78 mg/L (ppm). The average nitrite plus nitrate concentration was 0.47 mg/L (ppm). The chlorophyll-to-phosphorus yield was moderately good. Hydrology Cedar Lake is located on a small tributary to Cedar Creek that runs into Lake Olathe. Table 1 indicates the flow statistics from the gaging station installed on the creek in 2000 as well as long term estimates for the segment (USGS 2275) of Cedar Creek above Lake Olathe (Perry, et al, 2004). There is a notable jump in flow beyond mean flows or flows exceeded less than 25 percent of the time (Figure 2). The long term estimated mean flow of 9.8 cubic feet per second (cfs) was the basis for the unit runoff of 0.29 meters (m) per year used in modeling the trophic state of Lake Olathe. The hydrology of Cedar Lake was estimated as that necessary to support a hydraulic residence time of 2 months (0.16 m/yr). Flood flows are over two orders of magnitude greater than mean flow. Table 1. Summary Statistics for Flow (cfs) in Cedar Creek above Lake Olathe Flow Estimate
Drainage Area
Min Q
Max Q
Mean Q
10% Q
25% Q
Med Q
75% Q
90% Q
2 yr flood
10 yr flood
100 yr flood
2000-04 Gaged
13.3 miles2 0 570 9.3 16 5.4 1.5 0.36 0.06 NA NA NA
Seg 2275 Estimate
11.5 miles2 NA NA 9.8 11.6 3.75 0.94 0 0 1640 4720 10,500

4
Figure 2. Cedar Creek Flow Duration Curve
Flow - Cedar Creek
0.01
0.1
1
10
100
1000
0 10 20 30 40 50 60 70 80 90 100
% of Days Flow Exceeded
Flo
w in
CF
S
Lake Nutrients Table 2 provides average nutrient and chlorophyll concentrations over years, by season and by depth. Table 3 displays individual concentrations in the lake water column over time as sampled by USGS over 2000-2004. Table 2. Average Nutrient and Chlorophyll Levels in Lake Olathe (nutrients in ppm; chlorophyll in ppb) Average Condition
NH3 Unfiltered TKN
Filtered TKN
NO3& NO2
NO2 Unfiltered TP
Filtered TP
PO4 Chl a Chl b
2000-2004 0.080 0.783 0.472 0.469 0.028 0.053 0.051 0.020 19.5 1.6 2000-2003 0.080 0.811 0.455 0.476 0.029 0.051 0.053 0.019 13.7 1.1 2000-2002 0.087 0.838 0.460 0.509 0.032 0.054 0.056 0.019 14.4 1.3 2004 0.078 0.650 0.550 0.434 0.023 0.058 0.040 0.024 28.7 2.3 June-Oct 0.050 0.805 0.439 0.212 0.030 0.049 0.049 0.018 22.7 2.0 Hypolimnion 2.277 3.118 2.867 0.222 0.019 0.373 0.233 0.211 2.7 0.2

5
Table 3. Lake Olathe Concentrations over Time
Date Total Phosphorus
(mg/L)
Total Kjeldahl Nitrogen (mg/L)
Nitrite+ Nitrate (mg/L)
Chlorophyll a (ug/L)
Secchi Disc Depth
(ft)
Total Suspended
Solids (mg/L)
Turbidity (NTU)
10/9/1989 14.4 6/21/2000 0.04 0.67 0.05 16.8 2.4 10 7/20/2000 0.04 0.71 0.05 13.5 3.0 10 8/22/2000 0.04 0.74 0.05 3.0 10 9/19/2000 0.04 0.76 0.05 22.2 3.0 10 10/24/2000 0.07 0.98 0.19 18.5 2.5 10 7.8 12/7/2000 0.06 0.95 0.34 0.6 2.3 10 3.7 3/20/2001 0.14 1.10 2.17 4.7 1.6 10 23.0 4/18/2001 0.03 0.81 1.97 3.0 12.0 5/17/2001 0.06 0.58 1.24 4.6 6.1 6/27/2001 0.06 1.00 0.95 12.9 2.9 17.0 8/14/2001 0.04 0.81 0.03 1.8 3.2 13.0 10/23/2001 0.06 0.97 0.10 27.3 9.7 2/21/2002 0.04 0.60 0.61 1.1 6.2 4.6 4/23/2002 0.04 0.57 0.53 22.8 15.0 6/4/2002 0.05 0.83 0.49 18.2 6/18/2002 0.05 0.89 0.32 17.0 2.8 6.9 7/23/2002 0.04 0.88 0.05 17.4 2.5 10.0 9/6/2002 0.06 1.10 0.05 30.8 11.0
10/30/2002 0.07 0.97 0.44 4.4 1.4 18.0 2/20/2003 0.04 0.55 0.61 4.2 3.5 5/20/2003 0.04 0.64 0.52 3.7 4.2 7.4 7/29/2003 0.03 0.85 0.06 2.5 5.4 9/30/2003 0.04 0.70 0.08 22.9 3.1 4.3 3/22/2004 0.09 0.81 1.11 2.0 11 19.0 6/16/2004 0.04 0.43 0.88 5.5 5.6 10 41.0 7/8/2004 3.5 7/14/2004 15.6 5.2 7/21/2004 14.4 3.0 7/28/2004 0.06 0.76 0.06 0.1 2.6 10 8.2 8/5/2004 0.04 0.39 0.06 34.8 3.2 8/11/2004 31.8 2.7 8/26/2004 82.2 1.6 9/2/2004 58.6 2.0 9/9/2004 44.8 2.5 9/16/2004 0.06 0.86 0.06 33.9 3.5 10 6.9 9/24/2004 12.1 2.7 9/30/2004 10.9 3.2

6
Phosphorus All but five of the unfiltered samples for total phosphorus were above the detection limit, whereas only four of the filtered TP and orthophosphate samples were measured above their detection limits. Therefore, most of the phosphorus seen in the water column is probably in colloidal organic form, while algae and macrophytes rapidly take up any labile inorganic orthophosphate released to the water. 2004 saw larger amounts of phosphorus in the lake, driven by early spring concentrations (Figure 3). The growing season tends to have lower phosphorus because of lower inflows and loadings to the lake in those months and the uptake of phosphorus by lake biota. Phosphorus accumulates in the deeper portions of the lake, through settling of sediment and organic material. The low oxygen levels in the hypolimnion support redox reactions that liberate orthophosphate from the sediments to the overlying water. The lack of active biota in the light and temperature limited deep zone retards assimilation of the phosphorus. Input from Cedar Creek tends to be steady for a majority of the time for both total and dissolved forms of phosphorus (Figure 4). At the high flows exceeded less than 5 percent of the time; there is a significant increase in total phosphorus concentrations. The geometric mean total phosphorus concentration is 0.864 mg/l for these high flow conditions, significantly different from the geometric mean concentration of 0.103 mg/l under normal conditions. Dissolved phosphorus concentrations raise from 0.049 mg/l at normal flows to 0.058 mg/l at high flows, although this is not a statistically significant difference. The difference in total and dissolved phosphorus concentrations is significantly different at all flows, but the proportion of total phosphorus that passes through a filter is larger at normal flows (~ 48%) than at high flows (~7%). Using the four-year period of record, a flow weighted average total phosphorus concentration of 0.596 mg/l and average filterable (available P) proportion of 21.3% is derived for model analysis.

7
Figure 3. Total Phosphorus (TP) in Lake Olathe
TP - Lake Olathe Near Dam
0.00
0.02
0.04
0.06
0.08
0.10
0.12
0.14
0.16
6/21/0
07/2
0/00
8/22/0
09/1
9/00
10/24
/0012/
7/00
3/20/0
14/1
8/01
5/17/0
16/2
7/01
8/14/0
1
10/23
/012/2
1/02
4/23/0
26/4
/02
6/18/0
27/2
3/02
9/6/02
10/30
/022/2
0/03
5/20/0
37/2
9/03
9/30/0
33/2
2/04
6/16/0
47/2
8/04
8/5/04
9/16/0
4
Date
Co
nc.
in
mg
/L
TP Dis TP
Figure 4. Total Phosphorus (TP) in Cedar Creek
Total & Dissolved Phosphorus - Cedar Creek
0.01
0.1
1
10
0 10 20 30 40 50 60 70 80
% of Days Flow Exceeded
Co
nc.
in m
g/L
TP Hi Flow TP Norm Flow TP Norm Flow Geo. Mean TP Norm Flow CI 90%
Dis TP Hi Flow Dis TP Norm Flow Dis TP Norm Flow Geo. Mean Dis TP Norm Flow CI 90%
TP Hi Flow Geo. Mean Dis TP Hi Flow Geo. Mean

8
Nitrogen Similar to most lakes, nitrogen concentrations are an order of magnitude greater than those for phosphorus. Total Kjeldahl Nitrogen (TKN) is the dominant form of nitrogen in Lake Olathe and Cedar Creek (Table 3). A high proportion of the TKN is dissolved (Figure 5), and is likely composed of organic nitrogen, since ammonia tends to be at low or undetectable levels in the lake epilimnion. Nitrate and nitrite levels are notable, but less than those of TKN (Figure 6). Nitrite makes up a small proportion of the combined concentration with nitrate. Nitrate levels tend to be highest in the spring, but are likely taken up by lake biota after June. During the growing season, TKN tends to be high, while ammonia and nitrate are low. The inorganic forms are likely assimilated into the lake biology and organic forms in cell structure or refractory particulates predominate. Accumulated organic material at depth in the lake increases the concentration of TKN. Because of the oxygen-poor condition in the hypolimnion, the reduced form of ammonia becomes prevalent, while nitrate and nitrite are reduced by bacteria stripping off their oxygen atoms. Similar to phosphorus, TKN in Cedar Creek is fairly steady under normal flows, but rises significantly at the highest flows (Figure 7). Dissolved TKN remains similar in concentration at high flows as at other times (geometric means 0.554 mg/l vs. 0.486 mg/l), but high flow significantly increases unfiltered TKN (2.955 mg/l vs. 0.739 mg/l). Nitrate, on the other hand, remains constant across all flow conditions (geometric mean = 0.76 mg/l; Figure 8). Figure 5. Total Kjeldahl Nitrogen (TKN) in Lake Olathe
TKN - Lake Olathe Near Dam
0.0
0.5
1.0
1.5
2.0
2.5
3.0
6/21/0
07/2
0/008/2
2/009/1
9/00
10/24
/0012/
7/003/2
0/014/1
8/015/1
7/016/2
7/018/1
4/01
10/23/
012/2
1/024/2
3/02
6/4/02
6/18/0
27/2
3/029/6
/02
10/30/
022/2
0/035/2
0/037/2
9/039/3
0/033/2
2/046/1
6/047/2
8/04
8/5/04
9/16/0
4
Date
Co
nc.
in m
g/L
TKN Dis TKN

9
Figure 6. Nitrite plus Nitrate in Lake Olathe
Nitrite plus Nitrate - Lake Olathe Near Dam
0.0
0.5
1.0
1.5
2.0
2.5
6/21/0
07/2
0/008/2
2/00
9/19/0
0
10/24/
0012/
7/00
3/20/0
14/1
8/01
5/17/0
16/2
7/018/1
4/01
10/23/
012/2
1/02
4/23/0
26/4
/02
6/18/0
27/2
3/02
9/6/02
10/30/
022/2
0/03
5/20/0
37/2
9/039/3
0/03
3/22/0
46/1
6/04
7/28/0
48/5
/04
9/16/0
4
Date
Co
nc.
in m
g/L
Nitri+Nitra Dis
Figure 7. Total Kjeldahl Nitrogen (TKN) in Cedar Creek
TKN & Dissolved TKN - Cedar Creek
0.1
1
10
0 10 20 30 40 50 60 70 80
% of Days Flow Exceeded
Co
nc.
in
mg
/L
TKN Hi Flow TKN Norm Flow TKN Norm Flow Geo. Mean TKN Norm Flow CI 90%
Dis TKN Hi Flow Dis TKN Norm Flow Dis TKN Norm Flow Geo. Mean Dis TKN Norm Flow CI 90%
TKN Hi Flow Geo. Mean Dis TKN Hi Flow Geo. Mean

10
Figure 8. Nitrite plus Nitrate in Cedar Creek
Nitrite and Nitrate - Cedar Creek
0.1
1
10
0 10 20 30 40 50 60 70 80
% of Days Flow Exceeded
Co
nc.
in m
g/L
Nitri+Nitra Nitri+Nitra Geo Mean Nitri+Nitra CI 90%
Chlorophyll Average chlorophyll a levels are indicated of eutrophication (Table 3; Figure 9). Concentrations average around 14 ppb prior to 2004. Samples in 2004 averaged 28.7 ppb; however, the August-September growth period was sampled more intensely in 2004 than previously. Overall concentration during the growing season is 22.7 ppb. What little chlorophyll is found in the hypolimnion is probably the result of yet-to-be decomposed settled phytoplankton. Concentrations of chlorophyll b range from 1-2 ppb, indicative of green algae in the summer and euglenoid algae in the fall. The Carlson Trophic State Index (TSI) using chlorophyll shows a seasonal pattern of eutrophy in the summer, approaching hypereutrophy in 2004 (Figure 10). Algae levels between October and April decline notably. Comparing the TSI values derived from chlorophyll, phosphorus and secchi disk depths shows under-utilization of the total phosphorus present relative to the amount of chlorophyll (Figure 11). The relative plots showing higher TSI values from phosphorus (a direct relation) and secchi depths (an inverse relation) indicate the lake is light limited by suspended solids in the water column. These solids (sediment and organic material) are also likely bound with much of the total phosphorus measured in the lake. As these solids settle to the lake bottom, they accumulate the phosphorus in the sediments. USGS coring indicated sediment phosphorus concentrations of 774 ug/kg of sediment. Annual loading was estimated at 9720 lbs/year for Lake Olathe. This is in contrast to coring at Cedar Lake that showed concentrations of 1540 ug/kg and loading of 14,700 lbs/year. There is a definite relationship between the average total phosphorus seen in Cedar Creek during May-

11
October and the average chlorophyll a levels seen in Lake Olathe during June-October in each year over 2000-2004 (Figure 12). Also notable is the fact that both the average phosphorus inflow and in-lake chlorophyll content have increased over the past three years. Figure 9. Chlorophyll a in Lake Olathe
Chlorophyll a - Lake Olathe Near Dam
0
10
20
30
40
50
60
70
80
90
6/21/0
07/2
0/00
9/19/0
0
10/24
/0012
/7/00
3/20/0
16/2
7/01
8/14/0
1
10/23
/012/2
1/02
4/23/0
26/4
/02
6/18/0
27/2
3/02
9/6/02
10/30
/022/2
0/03
5/20/0
39/3
0/03
6/16/0
4
7/14/0
47/2
1/04
7/28/0
48/5
/04
8/11/0
4
8/26/0
49/2
/049/9
/04
9/16/0
4
9/24/0
4
9/30/0
4
Date
Con
c. in
ug/
L
Figure 10. Tropic State Index (TSI) of Chlorophyll a (Chl), Lake Olathe
TSI(Chl) - Lake Olathe 2000-2004
20
30
40
50
60
70
80
Jun-
00
Aug
-00
Oct
-00
Dec
-00
Feb
-01
Apr
-01
Jun-
01
Aug
-01
Oct
-01
Dec
-01
Feb
-02
Apr
-02
Jun-
02
Aug
-02
Oct
-02
Dec
-02
Feb
-03
Apr
-03
Jun-
03
Aug
-03
Oct
-03
Dec
-03
Feb
-04
Apr
-04
Jun-
04
Aug
-04
Mon-Year
TS
I
Lake Olathe near Dam Lake Olathe Upstream

12
Figure 11. Tropic State Index (TSI) Deviation Graph, Lake Olathe
TSI - Lake Olathe
-10
0
10
20
30
40
50
60
-10 0 10 20 30 40 50 60
TSI(SD)-TSI(Chl)
TS
I(T
P)-
TS
I(C
hl)
Lake Olathe near Dam Lake Olathe Upstream
Figure 12. Chlorophyll a in Lake Olathe vs. Total Phosphorus in Cedar Creek
Growing Season Average TP and Chl a (Jun-Oct 2000-04)
10
14
18
22
26
30
0.25 0.275 0.545 0.983 3.185
Seasonal Average TP (ppm)
Sea
sona
l Ave
rage
Chl
a (
ppb)

13
Phytoplankton Various groups of algae have dominated the composition of Lake Olathe at various times over 2000-2002 (Figure 13, Table 4). There were two outbreaks of blue-green algae, the most notorious of the causes of taste and odor problems in water supplies, in June 2000 and August 2001. Diatoms (Bacillariophyta) tend to dominate in the spring before the onset of runoff and the growing season. Cryptophyta, such as Rhodomonas and Cryptomonas, became abundant in the spring, as well. Green algae are always present, but Chlamydomonas became dominant in 2002. Euglenophyta, typically, Trachelomonas, dominated in the autumn, particularly as diatom abundance declined. There was a relative weak relationship between dominant groups of phytoplankton, chlorophyll levels and the biovolume seen at each sampling (Table 4). The two largest accumulations of biovolume occurred in June 2000 and October 2002, the corresponding chlorophyll levels were 16.8 ppb and 4.4 ppb, respectively. The first date coincided with a blue-green algal bloom; the latter was dominated by the euglenoid Trachelomonas. The levels of chlorophyll b, a pigment restricted to green and euglenoid algae, corresponded fairly well to dominance by either of those groups. Cryptomonas has been linked to increased nitrogen content in water. Comparison of the dominant algae in Cedar Creek and Lake Olathe suggests seeding of certain taxa (Melosira, Synedra, Trachelomonas, Chlamydomonas, Cryptomonas) from the creek into the lake at times (Table 5). Many of the diatoms found in the sediment cores of the Lake Olathe are found abundantly in Cedar Creek, more so than in the water column of the lake itself. Conversely, blue-green algae seem to be predominantly supported in the lake, Cyanophyta is sparsely found in Cedar Creek, except for occasional samples of Aphanocapsa. Diatoms are more prevalent in the hypolimnion and in the epilimnion of the lake headwaters, than in the epilimnion of the main lake body. Diatoms identified in the sediment cores of Cedar Lake and Lake Olathe show a predominance of a few select species (Table 6). Most of the taxa are centric as opposed to pennate diatoms, indicating a preference for planktonic forms, rather than benthic or attached. Centric to pennate ratios in the top and bottom cores range from 5.1 to 6.2, respectively, in Lake Olathe. In Cedar Lake, the lowest core had a C:P ratio of 3.6, but the upper core foot was almost devoid of pennate forms, leaving a ratio of 16. These ratios tend to support the notion of ongoing eutrophication and siltation, conditions that favor free-floating algae over those dwelling at depth. One of the most prevalent genera, Aulacoseira, was not noted in the subsequent lake sampling and was found in only one of the Cedar Creek samplings. Conversely, Melosira was found consistently in the water columns of the lake and creek, but is not found in the Lake Olathe sediment cores, and rarely noted in the Cedar Creek cores (M.varians). Both genera are very similar and it is possible they are interchanged during identification. The sediment analysis is not hampered by the presence of organic matter shielding details of the silicon frustules (samples are treated with acid to remove organic matter) unlike the lake analysis (samples are examined without acid treatment, leaving the organic components, such as chloroplasts).

14
Taken together, the presence of certain diatoms, such as Asterionella, Fragillaria, Synedra, Stephanodiscus and Melosira granulate, along with green and blue-green algae during the summer, is indicative of eutrophic conditions in the lake (Wetzel, Table 14-2, 1975). Figure 13. Phytoplankton in Lake Olathe
Abundance of Phytoplankton in Lake Olathe 2000-2002
0
10
20
30
40
50
60
70
80
90
100
6/1/00
6/20/0
06/2
1/00
10/24
/003/2
0/01
4/18/0
15/1
7/01
6/27/0
18/1
4/01
10/23
/012/2
1/02
4/23/0
26/4
/02
6/18/0
29/6
/02
10/30
/02
Date
Per
cen
tag
e
Bacillariophyta Chlorophyta Cryptophyta Cyanophyta Euglenophyta Others

15
Table 4. Dominant Phytoplankton and Proportion of Blue-green Algae – Lake Olathe Dominant Phytoplankton Species Percentage of
Blue-green Algae (Cyanophyta)
Biovolume of all algae
Chlorophyll a & b concentrations
Date
Name Percentage um3/ml ppb
6/1/2000 Rhodomonas minuta (Cryptophyta)
52.6% 0% 224K NA
6/20/2000 Anabaena spp. (Cyanophyta)
32.3% 52.5% 19.5M NA
6/21/2000 Pseudoanabaena spp. (Cyanophyta)
37.2% 54.52% 1.1M 16.8/1.6
10/24/2000 Trachelomonas spp. (Euglenophyta)–
34.7% 2.04% 297K 18.5/1.6
3/20/2001 Cyclotella spp. (Bacillariophyta)
63.4% 0% 78K 4.7/0.1
4/18/2001 Chlamydomonas spp. (Chlorophyta)
42.0% 0.2%9 216K NA
5/17/2001 Melosira islandica (Bacillariophyta)
28.7% 0% 275K NA
6/27/2001 Chlamydomonas spp. (Chlorophyta)
37.8% 4.38% 600K 12.9/1.9
8/14/2001 Melosira islandica (Bacillariophyta)
38.9% 40.74% 760K 1.8/0.1
10/23/2001 Cryptomonas spp. (Cryptophyta)
32.2% 5.29% 986K 27.3/8.7
2/21/2002 Cryptomonas spp. (Cryptophyta)
50.2% 0.55% 139K 1.1/0.1
4/23/2002 Melosira islandica (Bacillariophyta)
23.6% 0.10% 240K 22.8/0.1
6/4/2002 Chlamydomonas spp. (Chlorophyta)
55.2% 0% 672K 18.2/2.1
6/18/2002 Chlamydomonas spp. (Chlorophyta)
66.2% 0.03% 177K 17.0/1.2
9/6/2002 Chlamydomonas spp. (Chlorophyta)
58.7% 0% 296K 30.8/0.1
10/30/2002 Trachelomonas spp. (Euglenophyta)
30.8% 2.44% 93.3M
4.4/0.1

16
Table 5. Five most abundant algae in Cedar Creek and Lake Olathe at Selected Times, 2000-02 Date Water #1 Group #2 Group #3 Group #4 Group #5 Group 6/20/00 Cedar
Creek Staurastrum spp. (24.2%)
Aphanocapsa spp. (16.4%)
Rhoicosphena curvata (13.8%)
Chlorella ellipsoidea (6.5%)
Scenedesmus bijuga (4.1%)
6/20/00 Lake Olathe
Anabaena spp. (32.3%)
Synedra delicatissima (29.6%)
Pseudoanabaena spp. (16.9%)
Scenedesmus bijuga (6.5%)
Chlamydomonas spp. (4.3%)
6/27/01 Cedar Creek
Melosira spp. (28%)
Cryptomonas ovata (16%)
Trachelomonas spp. (9.1%)
Gyrosigma spp. (8.5%)
Synedra spp. (7.5%)
6/27/01 Lake Olathe
Chlamydomonas spp. (37.8%)
Melosira granulata (20.2%)
Crypotomonas ovata (17.9%)
Fragillaria spp. (8.9%)
Oscillatoria limnetica (3.6%)
8/14/01 Lake Olathe
Melosira islandica (38.9%)
Anabaena flos-aquae (23.7%)
Anabaena spp. (12.4%)
Synedra ulna (5.2%)
Cyclotella spp. (4.6%)
4/23/02 Lake Olathe
Melosira islandica (23.6%)
Melosira granulata (11.6%)
Trachelomonas spp. (10.4%)
Synedra delicattissima (10.0%)
Cryptomonas spp. (9.9%)
5/12/02 Cedar Creek
Trachelomonas spp. (24.3%)
Chlamydomonas spp. (20.3%)
Nitzschia spp. (11.9%)
Melosira islandica (7.8%)
Synedra delicatissima (5.8%)
6/18/02 Lake Olathe
Chlamydomonas spp (66.2%)
Trachelomonas spp. (22.1%)
Cryptomonas spp. (5.6%)
Melosira islandica (1.9%)
Cyclotella spp. (1.3%)

17
Table 6. Predominant diatoms found in sediment cores of Cedar Lake and Lake Olathe Core Location Diatom taxa Order Cedar Lake Lake Olathe Upper Foot # of valves # of valves Aulacoseira cf alpigena Centrales 542 642 Cyclotella meneghiniana Centrales 44 222 Aulacoseira granulate Centrales 229 168 Cyclotella bodanica Centrales 0 146 Asterionella formosa Pennales 0 138 Stephanodiscus nigarae Centrales 8 114 Cyclotella ocillata Centrales 3 86 Synedra delicatissima Pennales 2 52 Cyclotella striata Centrales 38 0 Fragillaria capucina Pennales 0 36 Cyclostephanos cf dubius Centrales 0 30 Achnanthidium minutissimum Pennales 6 30 Remaining centric diatoms Centrales 4 20 Remaining pennate diatoms Pennales 6 76 Lowest Foot Aulacoseira distans Centrales 155 0 Aulacoseira granulata Centrales 125 160 Aulacoseira cf alpigena Centrales 0 97 Achnanthidium minutissimum Pennales 40 34 Cyclotella meneghiniana Centrales 30 35 Aulacoseira lirata Centrales 30 0 Cyclotella borden Centrales 0 30 Stephanodiscus nigarae Centrales 30 29 Remaining centric diatoms Centrales 25 27 Remaining pennate diatoms Pennales 70 27
Endpoints of Desired Water Quality (Implied Load Capacity) at Cedar Lake and Lake Olathe The original TMDL for Cedar Lake in 1999 sought a chlorophyll a concentration of 12 ppb to fully support the designated uses of the lake. That endpoint will be carried forward by this TMDL. The City of Olathe developed a goal of 10 ppb for Lake Olathe. This TMDL will ultimately achieve the city’s goal as the long-term seasonal average to achieve the water quality standards at the lake. An initial state goal of 12 ppb, on average, will be sought with initial reductions in phosphorus loadings to the lake. Additionally, in order to protect the water supply function of the lake and recognizing occasional algal blooms are likely to occur in the future, a further goal establishing a maximum single incident chlorophyll concentration of 20 ppb is established to reduce the frequency of taste and odor problems brought on by such blooms. Of the 32 lake samples taken over 1998-2004, 12 were over 20 ppb. This maximum chlorophyll endpoint will ensure long-term average levels remain below 12 ppb and reduce the likelihood that algae composition will be dominated by blue-green taxa. The exact load reductions of phosphorus necessary to achieve this 20 ppb chlorophyll cap cannot be determined because of the impact of other factors influencing algal response to a single episode of nutrient loading (concurrent turbidity, seasonality, etc.) However, on a qualitative basis, any reduction in phosphorus loading will lower the risk of epic algal blooms occurring in the lake.

18
In support of the chlorophyll endpoints, in-lake average concentrations of total phosphorus will need to be 35 ppb and a maximum level set at 50 ppb. A corroborating endpoint of Secchi Disk depths greater than one meter (1 m) will also be used to assess the aesthetic quality of the lake for recreation. 3. SOURCE INVENTORY AND ASSESSMENT Land Use: Currently, more than half of the watershed is cropland (54%) (Table 7 and Figure 14). The agricultural runoff is the main source of nutrient inputs to the watershed. The City of Olathe estimates that the total annual loads of phosphorus and nitrogen to the watershed are 5,962 pounds and 257,400 pounds, respectively. Cropland contributes about 4,600 pounds (77%) of phosphorus and 100,000 pounds (39%) of nitrogen annually. The City of Olathe is planning to fully urbanize the watershed area within the next 25 to 30 years. After fully developed, the watershed will have 0% cropland and grassland (Table 7). The urban residential and commercial areas will increase from the current 15% to 62%. The City of Olathe also estimates that the total annual loads of phosphorus and nitrogen will increase to 9,630 pounds and 639,000 pounds, respectively. Urban residential and commercial land use will contribute about 7,500 pounds (78%) of phosphorus and 560,000 (88%) pounds of nitrogen to the watershed. It is expected that the urban runoff will gradually become the major source of nutrient inputs to the watershed during the development. Urbanization can have detrimental effects on the health of the watershed. The increased stormwater runoff often begins a chain of events including flooding, erosion, stream channel alteration, and ecological damage (City of Olathe, 2004). Combined with an increase in man-made pollutants, these changes result in degraded systems no logger capable of providing good drainage and healthy habitat, or allow for natural removal of pollutants (City of Olathe, 2004). To protect and improve the water quality in the lakes, mitigating measures must be installed to minimize the potential problems brought by increasing the impervious surface of the lake watersheds. Table 7. Current (2005) and Future (ca. 2030) Land Use Land Use Current Area
(acres) Current Area
(%) Future Area
(acres) Future Area
(%) Change (acres)
Cropland 5731 54 0 0 -5731 Grassland 935 9 0 0 -935 Forest 664 6 725 7 61 Parks 298 3 646 6 348 Urban Residential 277 6 3647 35 3370 Rural Residential 397 5 1758 17 1361 Commercial 920 9 2801 27 1881 Industrial/Mfg. 256 2 780 8 524 Quarries 879 6 0 0 -879 Source: Lake Olathe Watershed Restoration & Protection Plan, City of Olathe, 2004

19
Figure 14. Current Land Use Coverage (2005) for the Lake Olathe Watershed
Source: Lake Olathe Watershed Restoration & Protection Plan, City of Olathe, 2004 NPDES: There are 8 NPDES permitted facilities located within the watershed (Table 8). The discharges from these facilities to the watershed are limited to stormwater runoffs or occasional pit dewatering. None of the discharges are viewed as a nutrient source to the lakes, although some discharges from quarry wash operations could contribute suspended solids, leading to siltation of the lake water column. . Projections by the City of Olathe indicate the quarries will be converted to other types of land use in the future (Table 7). Two MS4 stormwater NPDES permits cover the Lake Olathe watershed; Olathe (KSR041025, M-

20
KS52-SU01) and Johnson County (KSR041007, M-KS52-SU02). Both permits have provisions to install Best Management Practices to deal with pollutants cited by TMDLs on Lake Olathe and Cedar Lake and are in effect until September 30, 2009. Table 8. NPDES Facilities in Lake Olathe Watershed
KS Permit # NPDES # Facility Name
Facility Type
Design Flow
TSS Permit Limits (mg/l)
Permit Expires
I-KS52-PO08 KS0089303 Shawnee Rock Plant #3 Limestone Quarry – stormwater Sporadic 30 avg; 45 max
07/31/11
I-KS52-PO07 KS0089290 Olathe Aggregates Asphalt Sales Limestone Quarry - stormwater Sporadic Narrative 07/31/11 I-KS52-PO09 KS0089478 Johnson County Aggregates Limestone Quarry – stormwater Sporadic Narrative 12/31/06 I-KS52-PO10 KS0092321 Holland Corporation Aggregates & Concrete – strm wtr Sporadic Narrative 12/31/11 I-KS52-PR02 KSG110030 Kincaid Ready Mix Concrete Aggregates & Concrete – strm wtr Sporadic 100 09/30/07 I-KS52-PR04 KSG110070 Quicksilver Ready Mix Aggregates & Concrete – strm wtr Sporadic 100 09/30/07 I-KS32-NP07 KSG110005 Century Concrete Aggregates & Concrete – strm wtr 0.001
MGD 100 09/30/07
M-KS52-NO01 KSJ000398 Lakestone Estates Wastewater Lagoon used for Irrigation Non-Q 0 08/31/11
Livestock: Phosphorus from animal waste is a potential contributing factor. Currently, 9% of land in the watershed is grassland. The grazing density is low for this part of the state (19-28 animal units per square mile). There are no animal feeding operations located in or around the watershed that are permitted or certified by KDHE according to the KDHE Livestock Permitting database. Grassland will be converted to urban land uses in the future; therefore any animal waste contributing nutrients to the lakes will be domestic in origin. Background Levels: Some nutrient loading within the lake might be contributed from atmospheric deposition or seepage from geologic formation and soil. Resuspension of sediment and nutrients within the lake might be caused by the wind mixing the water column or carp feeding along the lake bottom. 4. ALLOCATION OF POLLUTANT REDUCTION RESPONSIBILITY Reduction of phosphorus loading to the lakes is the long-term strategy to reduce their trophic states and the frequency of nuisance algal blooms. This reduction must continue even in the face of an increasingly urbanized watershed with higher proportions of impervious surface and nutrient wash-off. Point Sources: A current Wasteload Allocation of zero is established by this TMDL because of the lack of nutrient contributions from the point sources discharging directly into the Lake Olathe drainage. Most of the facilities are quarry or aggregate operations that will limit their discharges to high runoff conditions. Furthermore, these operations might contribute some suspended solids to the lakes, but the nutrient content of their stormwater will likely be low. A Wasteload Allocation for urban stormwater above the lakes must be established and the resulting permits will have appropriate Best Management Practices put in place to minimize any increased nutrient loading to the lake from urban development. Currently, about 17% of the lake watershed is developed, therefore, the current desired load capacity of 4840 pounds per year is further distributed by 810

21
pounds per year to the Wasteload Allocation assigned to urban stormwater activities in the watershed (Table 9). At the ultimate build-out level anticipated in 25-30 years, the percent of developed land in the watershed climbs to 70%. Therefore, the future desired load capacity, which increases to 6230 pounds per year because of the increase in inflows to the lake, is distributed by 4310 pounds per year to the Wasteload Allocation for MS4 permits. Table 9. Loading Conditions and Reductions Necessary to Meet TMDL
Loading Condition
Chl a (ug/L)
TP (ug/L)
Load (lbs/year)
% Reduction
WLA (lbs/yr)
WLA- MS4 (lbs/yr)
Load Allocation (lbs/yr)
Load Allocation - Atmosphere (lbs/yr)
Current 22.7 81 11,050 ------------- 0.0 Not Set Not Set 70 State Goal 12.0 43 5,800 47.5% 0.0 975 4755 70 City Goal 10.0 36 4,840 56.2% 0.0 810 3960 70 Urbanized Condition (Higher inflows and loadings) Altered Current
36.8 131 23,725 Increase of 215%
0.0 Not Set Not Set 70
City Goal 10.0 35 6,230 73.8% 0.0 4310 1850 70
Urbanization increases loading by increasing runoff from impervious areas and increasing the number of phosphorus sources (lawns, roads, pets, population density) contributing to the stream system. The increased runoff also shortens the residence time of water in the lake (from roughly 6 months to 4 months), decreasing the settling potential of incoming phosphorus. The City of Olathe’s Management Plan for the lake anticipates complete build out in the watershed, leading to an increased 60% in phosphorus loading and necessary 74% reduction to achieve this TMDL. Spreadsheets of the CNET model used to calculate loadings and corresponding lake conditions are provided in Appendix A. The best fit to existing KDHE and USGS data was provided by using Vollenweider’s (1976) phosphorus sedimentation model that predicts in-lake phosphorus levels as a function of the square root of the hydraulic residence time. Similarly, a linear chlorophyll response relation with phosphorus aligned fairly well with the observed data. The original TMDL for Cedar Lake called for a reduction in phosphorus loading from an estimated current condition of 3,748 pounds per year to 911 pounds per year, a 73% reduction. However, USGS has since developed more detailed data on the hydrology and loading into Cedar Lake. In order to match up with the USGS estimated long term overland loading to Cedar Lake of 14,700 pounds per year, runoff into the lake had to carry a total phosphorus concentration of 2650 ppb, but only about 7% of that would be biologically available, both situations possible when flows in the Cedar Creek drainage surpass the 5% exceedance flow. This TMDL revises the expected load reduction necessary to achieve a chlorophyll concentration of 12 ppb to 66% (from 14,760 pounds/yr to 5,028 pounds/yr). Because of anticipated high urbanization in the future above Cedar Bluff, 80% of the 4950 pounds per year of load (the remaining load after subtracting the Margin of Safety of 56 #/yr and atmospheric load of 22 #/yr) will be the Wasteload Allocation assigned to urban stormwater (3960 #/yr). The CNET spreadsheet is provided in Appendix B.

22
Nonpoint Sources: The hydrology of loading into these lakes, clearly establishes high flow runoff as the principal loading mechanism of introducing phosphorus into the lakes and fueling their primary productivity. Therefore, this TMDL will initially be dominated by the Load Allocation assigned to non-point sources, but will transition to a Wasteload Allocation for future urban stormwater activities. Table 9 shows the current loading estimates, the necessary current and future Load Allocations to achieve the 12 and 10 ppb chlorophyll endpoints and the percent reduction in loading for Lake Olathe. The table also shows the potential impact of an increasingly urbanized watershed above the lake. The current estimate of loading is within 12% of the estimate derived by USGS in their sediment coring of the Lake (9720 pounds per year). The Load Allocation for Cedar Lake is 1012 #/yr, after accounting for the MS4 Wasteload Allocation, and the Margin of Safety. The Load Allocations for both lakes include ground surface non-point sources and atmospheric deposition. Because of the ruling on the Anacostia River requiring TMDLs be expressed as daily loads, Region VII has requested that TMDLs such as this one include a daily load expression, using an approach described in the Technical Support Document for Water Quality Based Toxics Control (EPA/505/2-90-001). Expressing the load in terms of daily time steps does not imply a daily response of chlorophyll to phosphorus loading. The average chlorophyll level seen over the growing season in a lake is influenced by internal lake nutrient loading, water residence time, wind action and interactions between light penetration, nutrients, sediments and algal communities. Nonetheless, in accord with the EPA request, daily load calculations are provided in Appendix C. Defined Margin of Safety: The margin of safety provides some hedge against the uncertainty in meeting the endpoint tied to state water quality standards. In this case, the local goal of 10 ppb is more stringent than that used by the state in lake eutrophication issues (12 ppb). Therefore, the Margin of Safety for Lake Olathe will be the additional 1000 pounds of annual load reduction necessary to achieve the local goal. Reducing current loads by this additional amount will ensure that the state water quality standard is being achieved. For Cedar Lake, its current condition of plant communities and shallow depth resembles more of a wetland than lake. Because of its evolved condition, the likelihood of either primary contact recreation or public water supply uses being made at Cedar Lake are diminished, especially since those uses are provided at the downstream Lake Olathe. Nonetheless, the desired target goal of 12 ppb of chlorophyll is established at Cedar Lake, regardless if those uses are present. The explicit Margin of Safety for Cedar Lake is 56 #/yr, assuring the Wasteload and Load Allocations will attain the assumed level of designated use despite the lake’s physical shortcomings. Reducing phosphorus loads above Cedar Lake will result in improved quality within its lake-wetland complex and will further protect the quality of Lake Olathe. State Water Plan Implementation Priority: Because the Lake Olathe watershed is an important water supply feature of Johnson County, this TMDL will be a High Priority for implementation, particularly in light of the watershed’s vulnerability to urbanization impacts. Unified Watershed Assessment Priority Ranking: This watershed lies within the Lower Kansas (HUC 8: 10270104) with a priority ranking of 1 (High Priority for restoration).

23
Priority Considerations: The distribution of loading is skewed to the infrequent high flow events occurring on Cedar Creek (Figure 15). A majority of load occurs less than 5 percent of the time, when flows increase by several orders of magnitude over normal conditions. The phosphorus is typically bound to sediment transported during these high flow events and has reduced bio-availability (BAF). Analysis of data from Cedar Creek indicates the proportion of dissolved or inorganic phosphorus potentially available to lake biota drops from nearly half (48%) of the total phosphorus during normal conditions to about 7% of total phosphorus during runoff. Nonetheless, most of the loading of bioavailable phosphorus occurs during the high flow events because of the large mass of phosphorus moving into the lake at those times. Therefore, practices to reduce or eliminate loading to the lake should be selected among those that are effective at flows greater than mean flow or flows exceeded 25% of the time or less. Practices that are applied to normal or low flow conditions have little relative impact to the condition of the lake. Runoff control through detention ponds and enhanced infiltration is the most likely approach to curtail loading to the lake, particularly as the watershed becomes more urban in nature. Figure 15. Distribution of Loading into Lake Olathe and Focus for Load Reductions
Distribution of Phosphorus Loads into Lake Olathe
0.1
1
10
100
1000
10000
90 80 70 60 50 40 30 20 10 1
Pct of Time Flow was exceeded
Load
in lb
s/yr
Current Load Current BAF Desired Load Desired BAF
5. IMPLEMENTATION Desired Implementation Activities As the land uses in the watershed above the lakes changes from cropland and grassland to urban, the necessary implementation activities will also need to transition from land treatment practices to stormwater control. The guiding principles are outlined in the City’s Lake Olathe Watershed Restoration and Protection Plan. These principles are crafted in anticipation of ongoing development in

24
the lake watershed. Additional activities are identified in the City’s plan as well as the proposed Watershed Restoration and Protection Strategy implementation project. 1. Avoid direct stormwater discharges into waterways or the lakes 2. No net increase in the volume or rate of water discharged into the waterways over and above the pre-development conditions at each site of development. 3. No net increase in pollutant load delivered to Lake Olathe beyond pre-development conditions. 4. Minimize the amount of impervious cover in the watershed to minimize the delivery of pollutants to Lake Olathe. 5. Implement appropriate nutrient management measures to cropland and grassland areas currently in place in the lake watershed. 6. Implement city measures through the State-supported WRAPS process to significantly reduce loading of phosphorus and sediment to the lakes. Implementation Programs Guidance
Watershed Management Program - KDHE a. Support ongoing implementation projects conducted under the Watershed
Restoration and Protection Strategy (WRAPS) for Lake Olathe, including demonstration projects and outreach efforts dealing with erosion and sediment control, stormwater management and practices, pollution prevention, public outreach and studies of water quality impacts of new development.
b. Support septic system inspection, upgrade and repair through the Johnson County Local Environmental Protection Program.
c. Provide technical and financial assistance on nutrient management and vegetative buffer development in vicinity of streams via the WRAPS.
d. Through the WRAPS, support aspects of the City’s Stormwater Program, outside the requirements of the Phase II NPDES permit, that promote stream buffers, installation of new and retrofitted stormwater management practices, including Low Impact Development and Best Management Practices, and runoff treatment train practices, all working to mitigate the impacts of impervious area in the watershed.
NPDES Permits – KDHE
a. Ensure quarries in the watershed of the lakes are appropriately permitted for their occasional discharge to waterways, minimizing sediment loading to the lakes.
Stormwater NPDES Permits – KDHE
a. Coordinate stormwater management between Olathe and Johnson County b. Revise MS4 stormwater general permits for Johnson County and Olathe to
incorporate requirements to begin implementation of Best Management Practices for nutrient loading into Cedar Creek and Lake Olathe.
c. Ensure the City’s Phase II Stormwater Program addresses illicit discharges to the

25
city stormwater system and waterways, public outreach, pollution prevention practices, such as street sweeping, construction site runoff control, post-construction stormwater management, as well as placement of Best Management Practices to address sediment and phosphorus, particularly in new development above the lake, pursuant to this High Priority TMDL.
Water Resource Cost Share Nonpoint Source Pollution Control Program - SCC
a. Apply conservation farming practices, including terraces and waterways, sediment control basins, and constructed wetlands in cropland of unincorporated areas of Johnson County lying within the lake watershed.
b. Provide sediment control practices to minimize erosion and sediment and nutrient transport from cropland and grassland in the lake watershed.
Riparian Protection Program - SCC
a. Establish or reestablish natural riparian systems, including vegetative filter strips and streambank vegetation along Cedar Creek and its tributaries.
b. Develop riparian restoration projects. c. Promote wetland construction to assimilate nutrient loadings. d. Coordinate riparian management within Olathe and in unincorporated Johnson
County.
Buffer Initiative Program - SCC a. Install vegetative buffer strips along Cedar Creek and its tributaries.
Reservoir Restoration Demonstration Project – Kansas Water Office
a. Support a lake restoration project at Cedar Lake
Time Frame for Implementation: Stormwater control and management practices should be installed in the watershed in 2006 with the initiation of WRAPS financial and technical support from the State Water Plan. Implementation should be ongoing, but shift its emphasis over time from agricultural oriented practices to urban stormwater as the watershed builds out over the next 30 years. Targeted Participants: Primary participants for implementation will initially be agricultural producers within the drainage of the lake and the City of Olathe. Initial work in before 2007 should include local assessments by conservation district personnel and county extension agents to locate within the lake drainage:
1. Total row crop acreage 2. Cultivation alongside Cedar Creek 3. Drainage alongside or through animal feeding lots 4. Livestock use of riparian areas 5. Fields with manure applications

26
The City of Olathe will assess and inventory the various pollutant sources within its jurisdiction, including those components addressed within its Phase II Stormwater NPDES permit, including illicit discharges, construction sites and new development and redevelopment sites.
Milestone for 2010: The year 2010 marks the next cycle of 303d activities in the Kansas-Lower Republican Basin. At that point in time, sampled data from Lake Olathe should indicate evidence of reduced phosphorus and chlorophyll levels than those seen 2000-2004. Delivery Agents: The primary delivery agents for program participation will be the City of Olathe, the Johnson County Stormwater Program and the Johnson County Conservation District. Reasonable Assurances: Authorities: The following authorities may be used to direct activities in the watershed to reduce pollutants and to assure allocations of pollutants to point and non-point sources can be attained.
1. K.S.A. 65-171d empowers the Secretary of KDHE to prevent water pollution and to protect the beneficial uses of the waters of the state through required treatment of sewage and established water quality standards and to require permits by persons having a potential to discharge pollutants into the waters of the state.
2. K.S.A. 2-1915 empowers the State Conservation Commission to develop programs to assist the protection, conservation and management of soil and water resources in the state, including riparian areas.
3. K.S.A. 75-5657 empowers the State Conservation Commission to provide financial assistance for local project work plans developed to control nonpoint source pollution.
4. K.S.A. 82a-901, et seq. empowers the Kansas Water Office to develop a state water plan directing the protection and maintenance of surface water quality for the waters of the state.
5. K.S.A. 82a-951 creates the State Water Plan Fund to finance the implementation of the Kansas Water Plan, including selected Watershed Restoration and Protection Strategies.
6. The Kansas Water Plan and the Kansas-Lower Republican Basin Plan provide the guidance to state agencies to coordinate programs intent on protecting water quality and to target those programs to geographic areas of the state for high priority in implementation.
Funding: The State Water Plan Fund annually generates $16-18 million and is the primary funding mechanism for implementing water quality protection and pollutant reduction activities in the state through the Kansas Water Plan. The state water planning process, overseen by the Kansas Water Office, coordinates and directs programs and funding toward watersheds and water resources of

27
highest priority. Typically, the state allocates at least 50% of the fund to programs supporting water quality protection. Additionally, $2 million has been allocated between the State Water Plan Fund and EPA 319 funds to support implementation of Watershed Restoration and Protection Strategies. The Lake Olathe WRAPS has been selected for funding support in State Fiscal Year2006. This watershed and its TMDL are a High Priority consideration and should receive funding beginning in 2006. Effectiveness: Stormwater control practices, notably those involving runoff retention will reduce pollutant loading to waterways. Nutrient control has been proven effective through conservation tillage, contour farming and use of grass waterways and buffer strips. The key to success will be widespread utilization of stormwater management in developed areas and mitigation measures at sites with high proportions of impervious cover. 6. MONITORING Additional sampling by the City of Olathe and the USGS is expected to occur in the future. The data collected by those monitoring efforts will assess the degree that implementation of Best Management Practices has been effective in abating impacts from the changing watershed above the lakes. Those data are not expected to be obtained before 2010, when the next cycle of TMDL development and revision is slated for the waters of the Kansas-Lower Republican Basin. However, raw water taken from the lake should be monitored for nutrient and geosmin content at the Olathe water treatment plant by the City. The implied water quality condition from the water supply data will be examined in 2010 as part of re-visiting this TMDL. With implementation efforts in full swing after 2010, some follow-up monitoring in the lake and watershed, including use of sensors at the lake is expected to be established by the USGS and Olathe to assess changes in water quality associated with changes in the lake watershed. 7. FEEDBACK Public Notice: Public notification of the second round of TMDLs in the Kansas-Lower Republican Basin was made in the Kansas Register in January 5, 2006. An active Internet Web site was established at http://www.kdheks.gov/tmdl/ to convey information to the public on the general establishment of TMDLs and specific TMDLs for the Kansas-Lower Republican Basin. Public Hearing: Public Hearings on the second round of TMDLs for the Kansas-Lower Republican Basin were held in Olathe on January 19, and in Topeka on January 30, 2006. Comments were received from Johnson County Wastewater and Stormwater Programs. Basin Advisory Committee: The Kansas-Lower Republican Basin Advisory Committee met to discuss the second round of TMDLs in the basin on April 7, 2005 in Lawrence, July 26, 2005 in Concordia, October 20, 2005 in Lawrence and January 24, 2006 in Topeka.

28
Discussion with City of Olathe : A meeting to discuss TMDLs of interest to the City of Olathe and Johnson County occurred on December 21, 2005. Milestone Evaluation: In 2010, evaluation will be made as to the progress in implementing Best Management Practices in Johnson County and Olathe. Additionally, any lake nutrient or biological data will be examined to assess the condition of Lake Olathe. Changes in the amount of developed land and land use above the lake should be noted and compared to conditions seen in 2004. Subsequent decisions will be made regarding the implementation approach and follow up of additional implementation in the watershed. Consideration for 303(d) Delisting: The lake will be evaluated for delisting under Section 303(d), based on the lake’s chemical and biological monitoring data collected between 2010 and 2015. Therefore, the decision for delisting will come about in the preparation of the 2016 303(d) list. Should modifications be made to the applicable water quality criteria during the implementation period, consideration for delisting, desired endpoints of this TMDL and implementation activities might be adjusted accordingly. Incorporation into Continuing Planning Process, Water Quality Management Plan and the Kansas Water Planning Process: Under the current version of the Continuing Planning Process, the next anticipated revision would come in 2007, which will emphasize revision of the Water Quality Management Plan. At that time, incorporation of this TMDL will be made into both documents. Recommendations of this TMDL will be considered in Kansas Water Plan implementation decisions under the State Water Planning Process for Fiscal Years 2008-2010. Bibliography Carlson, Robert E. Expanding the Trophic State Concept to Identify Non-Nutrient Limited Lakes and
Reservoirs. Enhancing the States’ Lake Management Programs, 1991: 59-71. City of Olathe. Lake Olathe Watershed Restoration & Protection Plan. July 13, 2004. U. S. EPA. Protocol for Developing Nutrient TMDLs, First Edition. EPA 841-B-99-007. November
1999. Wetzel, Robert G., Limnology, 1st Edition, 1975, W.B. Saunders Co.; 743 p. Perry, CA., Wolock, D.M., and Artman, J.C.; Estimates of Flow Duration, Mean Flow and Peak-
Discharge Frequency Values for Kansas Stream Locations; USGS Scientific Investigations Report 2004-5033; 2004; 651 p.
Mau, David P.; Sediment Deposition and Selected Water Quality Characteristics in Cedar Lake and
Lake Olathe, Northeast Kansas, 2000; USGS Water-Resources Investigations Report 02-

29
4073; 2002; 71 p. Mau, D.P., A.C. Ziegler, S.D. Porter and L.M Pope; Surface Water Quality Conditions and Relation
to Taste and Odor Occurrences in the Lake Olathe Watershed, Northeast Kansas, 2000-2002; USGS Scientific Investigations Report 2004-5047; 2004; 95 p.
KDHE; Total Maximum Daily Load for Eutrophication in Cedar Lake; 1999; 6 p. Revised July 19, 2007

30
Appendix A. CNET Results for Lake Olathe Scenarios

31
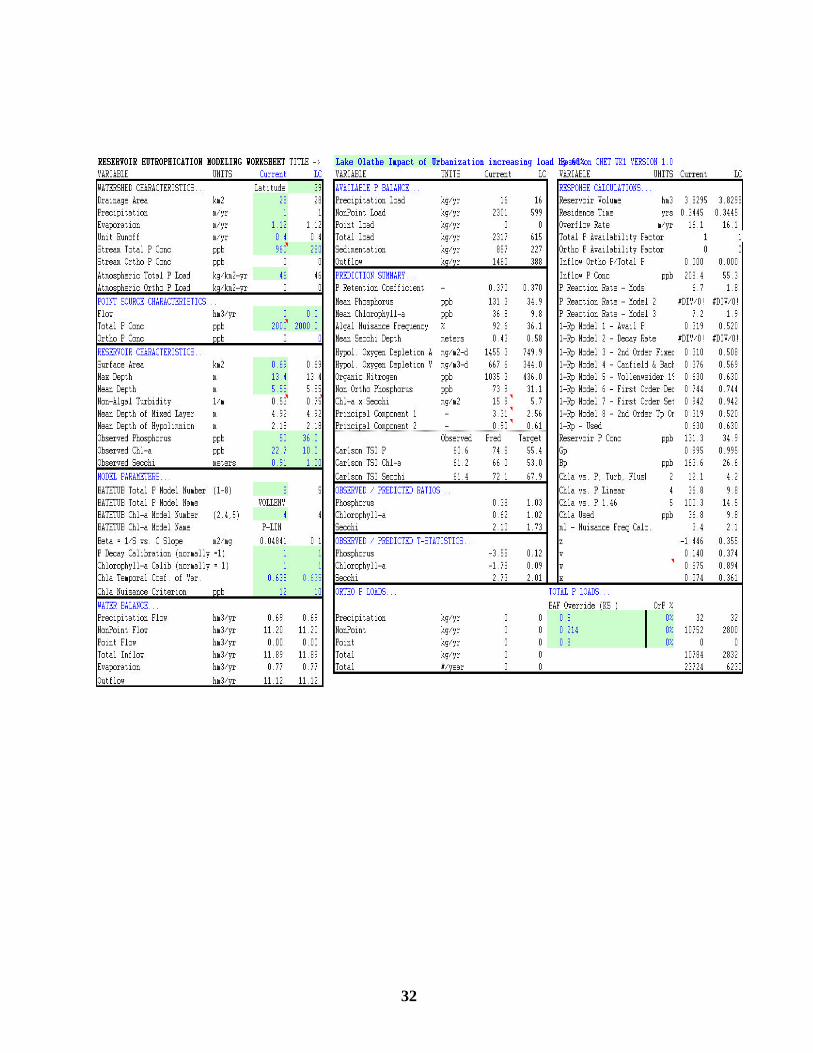
32

33
Appendix B. CNET Results for Cedar Lake Analysis

34
Appendix C. Daily Load Calculations Maximum Daily Load = (Long Term Average Load) * e [Zs – 0.5s2]
Where: s 2 = ln(CV2+1) CV = Coefficient of variation = Standard Deviation / Mean (assumed to be 0.5) Z = 2.326 for 99th percentile probability basis Loading Condition
Annual TP Load (#/yr)
Z s 2 e [Zs – 0.5s2]
Max Daily Load MS4 WLA LA
Current 11,050 2.326 0.223 2.684 81.2 #/d 13.8 #/d 67.4 #/d State Goal 5800 2.326 0.223 2.684 42.6 #/d 7.2 #/d 35.4 #/d City Goal 4800 2.326 0.223 2.684 35.3 #/d 6 #/d 29.3 #/d Urban Future 23,725 2.326 0.223 2.684 174.4 #/d 122 #/d 52 #/d Future Goal 6200 2.326 0.223 2.684 45.6 #/d 31.9 #/d 13.7 #/d