kalman filtering and neural networks - snu · kalman filtering and neural networks edited by simon...
TRANSCRIPT


KALMAN FILTERING ANDNEURAL NETWORKS

KALMAN FILTERING ANDNEURAL NETWORKS
Edited by
Simon HaykinCommunications Research Laboratory,
McMaster University, Hamilton, Ontario, Canada
A WILEY-INTERSCIENCE PUBLICATION
JOHN WILEY & SONS, INC.
New York = Chichester = Weinheim = Brisbane = Singapore = Toronto

Designations used by companies to distinguish their products are often claimed as
trademarks. In all instances where John Wiley & Sons, Inc., is aware of a claim, the
product names appear in initial capital or ALL CAPITAL LETTERS. Readers, however, should
contact the appropriate companies for more complete information regarding trademarks
and registration.
Copyright 2001 by John Wiley & Sons, Inc.. All rights reserved.
No part of this publication may be reproduced, stored in a retrieval system or transmitted
in any form or by any means, electronic or mechanical, including uploading,
downloading, printing, decompiling, recording or otherwise, except as permitted under
Sections 107 or 108 of the 1976 United States Copyright Act, without the prior written
permission of the Publisher. Requests to the Publisher for permission should be
addressed to the Permissions Department, John Wiley & Sons, Inc., 605 Third Avenue,
New York, NY 10158-0012, (212) 850-6011, fax (212) 850-6008,
E-Mail: [email protected].
This publication is designed to provide accurate and authoritative information in regard to
the subject matter covered. It is sold with the understanding that the publisher is not
engaged in rendering professional services. If professional advice or other expert
assistance is required, the services of a competent professional person should be sought.
ISBN 0-471-22154-6
This title is also available in print as ISBN 0-471-36998-5.
For more information about Wiley products, visit our web site at www.Wiley.com.

CONTENTS
Preface xi
Contributors xiii
1 Kalman Filters 1
Simon Haykin
1.1 Introduction = 1
1.2 Optimum Estimates = 3
1.3 Kalman Filter = 5
1.4 Divergence Phenomenon: Square-Root Filtering = 10
1.5 Rauch–Tung–Striebel Smoother = 11
1.6 Extended Kalman Filter = 16
1.7 Summary = 20
References = 20
2 Parameter-Based Kalman Filter Training:Theory and Implementation 23
Gintaras V. Puskorius and Lee A. Feldkamp
2.1 Introduction = 23
2.2 Network Architectures = 26
2.3 The EKF Procedure = 28
2.3.1 Global EKF Training = 29
2.3.2 Learning Rate and Scaled Cost Function = 31
2.3.3 Parameter Settings = 32
2.4 Decoupled EKF (DEKF) = 33
2.5 Multistream Training = 35
v

2.5.1 Some Insight into the Multistream Technique = 40
2.5.2 Advantages and Extensions of Multistream
Training = 42
2.6 Computational Considerations = 43
2.6.1 Derivative Calculations = 43
2.6.2 Computationally Efficient Formulations for
Multiple-Output Problems = 45
2.6.3 Avoiding Matrix Inversions = 46
2.6.4 Square-Root Filtering = 48
2.7 Other Extensions and Enhancements = 51
2.7.1 EKF Training with Constrained Weights = 51
2.7.2 EKF Training with an Entropic Cost Function = 54
2.7.3 EKF Training with Scalar Errors = 55
2.8 Automotive Applications of EKF Training = 57
2.8.1 Air=Fuel Ratio Control = 58
2.8.2 Idle Speed Control = 59
2.8.3 Sensor-Catalyst Modeling = 60
2.8.4 Engine Misfire Detection = 61
2.8.5 Vehicle Emissions Estimation = 62
2.9 Discussion = 63
2.9.1 Virtues of EKF Training = 63
2.9.2 Limitations of EKF Training = 64
2.9.3 Guidelines for Implementation and Use = 64
References = 65
3 Learning Shape and Motion from Image Sequences 69
Gaurav S. Patel, Sue Becker, and Ron Racine
3.1 Introduction = 69
3.2 Neurobiological and Perceptual Foundations of our Model = 70
3.3 Network Description = 71
3.4 Experiment 1 = 73
3.5 Experiment 2 = 74
3.6 Experiment 3 = 76
3.7 Discussion = 77
References = 81
vi CONTENTS

4 Chaotic Dynamics 83
Gaurav S. Patel and Simon Haykin
4.1 Introduction = 83
4.2 Chaotic (Dynamic) Invariants = 84
4.3 Dynamic Reconstruction = 85
4.4 Modeling Numerically Generated Chaotic Time Series = 87
4.4.1 Logistic Map = 87
4.4.2 Ikeda Map = 91
4.4.3 Lorenz Attractor = 99
4.5 Nonlinear Dynamic Modeling of Real-World
Time Series = 106
4.5.1 Laser Intensity Pulsations = 106
4.5.2 Sea Clutter Data = 113
4.6 Discussion = 119
References = 121
5 Dual Extended Kalman Filter Methods 123
Eric A. Wan and Alex T. Nelson
5.1 Introduction = 123
5.2 Dual EKF – Prediction Error = 126
5.2.1 EKF – State Estimation = 127
5.2.2 EKF – Weight Estimation = 128
5.2.3 Dual Estimation = 130
5.3 A Probabilistic Perspective = 135
5.3.1 Joint Estimation Methods = 137
5.3.2 Marginal Estimation Methods = 140
5.3.3 Dual EKF Algorithms = 144
5.3.4 Joint EKF = 149
5.4 Dual EKF Variance Estimation = 149
5.5 Applications = 153
5.5.1 Noisy Time-Series Estimation and Prediction = 153
5.5.2 Economic Forecasting – Index of Industrial
Production = 155
5.5.3 Speech Enhancement = 157
5.6 Conclusions = 163
Acknowledgments = 164
CONTENTS vii

Appendix A: Recurrent Derivative of the Kalman Gain = 164
Appendix B: Dual EKF with Colored Measurement Noise = 166
References = 170
6 Learning Nonlinear Dynamical System Using theExpectation-Maximization Algorithm 175
Sam T. Roweis and Zoubin Ghahramani
6.1 Learning Stochastic Nonlinear Dynamics = 175
6.1.1 State Inference and Model Learning = 177
6.1.2 The Kalman Filter = 180
6.1.3 The EM Algorithm = 182
6.2 Combining EKS and EM = 186
6.2.1 Extended Kalman Smoothing (E-step) = 186
6.2.2 Learning Model Parameters (M-step) = 188
6.2.3 Fitting Radial Basis Functions to Gaussian
Clouds = 189
6.2.4 Initialization of Models and Choosing Locations
for RBF Kernels = 192
6.3 Results = 194
6.3.1 One- and Two-Dimensional Nonlinear State-Space
Models = 194
6.3.2 Weather Data = 197
6.4 Extensions = 200
6.4.1 Learning the Means and Widths of the RBFs = 200
6.4.2 On-Line Learning = 201
6.4.3 Nonstationarity = 202
6.4.4 Using Bayesian Methods for Model Selection and
Complexity Control = 203
6.5 Discussion = 206
6.5.1 Identifiability and Expressive Power = 206
6.5.2 Embedded Flows = 207
6.5.3 Stability = 210
6.5.4 Takens’ Theorem and Hidden States = 211
6.5.5 Should Parameters and Hidden States be Treated
Differently? = 213
6.6 Conclusions = 214
Acknowledgments = 215
viii CONTENTS

Appendix: Expectations Required to Fit the RBFs = 215
References = 216
7 The Unscented Kalman Filter 221
Eric A. Wan and Rudolph van der Merwe
7.1 Introduction = 221
7.2 Optimal Recursive Estimation and the EKF = 224
7.3 The Unscented Kalman Filter = 234
7.3.1 State-Estimation Examples = 237
7.3.2 The Unscented Kalman Smoother = 240
7.4 UKF Parameter Estimation = 243
7.4.1 Parameter-Estimation Examples = 2
7.5 UKF Dual Estimation = 249
7.5.1 Dual Estimation Experiments = 249
7.6 The Unscented Particle Filter = 254
7.6.1 The Particle Filter Algorithm = 259
7.6.2 UPF Experiments = 263
7.7 Conclusions = 269
Appendix A: Accuracy of the Unscented Transformation = 269
Appendix B: Efficient Square-Root UKF Implementations = 273
References = 277
Index 283
CONTENTS ix


PREFACE
This self-contained book, consisting of seven chapters, is devoted to
Kalman filter theory applied to the training and use of neural networks,
and some applications of learning algorithms derived in this way.
It is organized as follows:
� Chapter 1 presents an introductory treatment of Kalman filters, with
emphasis on basic Kalman filter theory, the Rauch–Tung–Striebel
smoother, and the extended Kalman filter.
� Chapter 2 presents the theoretical basis of a powerful learning
algorithm for the training of feedforward and recurrent multilayered
perceptrons, based on the decoupled extended Kalman filter (DEKF);
the theory presented here also includes a novel technique called
multistreaming.
� Chapters 3 and 4 present applications of the DEKF learning algo-
rithm to the study of image sequences and the dynamic reconstruc-
tion of chaotic processes, respectively.
� Chapter 5 studies the dual estimation problem, which refers to the
problem of simultaneously estimating the state of a nonlinear
dynamical system and the model that gives rise to the underlying
dynamics of the system.
� Chapter 6 studies how to learn stochastic nonlinear dynamics. This
difficult learning task is solved in an elegant manner by combining
two algorithms:
1. The expectation-maximization (EM) algorithm, which provides
an iterative procedure for maximum-likelihood estimation with
missing hidden variables.
2. The extended Kalman smoothing (EKS) algorithm for a refined
estimation of the state.
xi

� Chapter 7 studies yet another novel idea – the unscented Kalman
filter – the performance of which is superior to that of the extended
Kalman filter.
Except for Chapter 1, all the other chapters present illustrative applica-
tions of the learning algorithms described here, some of which involve the
use of simulated as well as real-life data.
Much of the material presented here has not appeared in book form
before. This volume should be of serious interest to researchers in neural
networks and nonlinear dynamical systems.
SIMON HAYKIN
Communications Research Laboratory,
McMaster University, Hamilton, Ontario, Canada
xii PREFACE

Contributors
Sue Becker, Department of Psychology, McMaster University, 1280 Main
Street West, Hamilton, ON, Canada L8S 4K1
Lee A. Feldkamp, Ford Research Laboratory, Ford Motor Company, 2101
Village Road, Dearborn, MI 48121-2053, U.S.A.
Simon Haykin, Communications Research Laboratory, McMaster
University, 1280 Main Street West, Hamilton, ON, Canada L8S 4K1
Zoubin Ghahramani, Gatsby Computational Neuroscience Unit, Univer-
sity College London, Alexandra House, 17 Queen Square, London
WC1N 3AR, U.K.
Alex T. Nelson, Department of Electrical and Computer Engineering,
Oregon Graduate Institute of Science and Technology, 19600 N.W. von
Neumann Drive, Beaverton, OR 97006-1999, U.S.A.
Gaurav S. Patel, 1553 Manton Blvd., Canton, MI 48187, U.S.A.
Gintaras V. Puskorius, Ford Research Laboratory, Ford Motor Company,
2101 Village Road, Dearborn, MI 48121-2053, U.S.A.
Ron Racine, Department of Psychology, McMaster University, 1280
Main Street West, Hamilton, ON, Canada L8S 4K1
Sam T. Roweis, Gatsby Computational Neuroscience Unit, University
College London, Alexandra House, 17 Queen Square, London WC1N
3AR, U.K.
Rudolph van der Merwe, Department of Electrical and Computer
Engineering, Oregon Graduate Institute of Science and Technology,
19600 N.W. von Neumann Drive, Beaverton, OR 97006-1999, U.S.A.
Eric A. Wan, Department of Electrical and Computer Engineering,
Oregon Graduate Institute of Science and Technology, 19600 N.W.
von Neumann Drive, Beaverton, OR 97006-1999, U.S.A.
xiii

KALMAN FILTERING ANDNEURAL NETWORKS

Adaptive and Learning Systems for Signal Processing,Communications, and Control
Editor: Simon Haykin
Beckerman = ADAPTIVE COOPERATIVE SYSTEMS
Chen and Gu = CONTROL-ORIENTED SYSTEM IDENTIFICATION: An H1
Approach
Cherkassky and Mulier = LEARNING FROM DATA: Concepts, Theory,and Methods
Diamantaras and Kung = PRINCIPAL COMPONENT NEURAL NETWORKS:Theory and Applications
Haykin = KALMAN FILTERING AND NEURAL NETWORKS
Haykin = UNSUPERVISED ADAPTIVE FILTERING: Blind Source Separation
Haykin = UNSUPERVISED ADAPTIVE FILTERING: Blind Deconvolution
Haykin and Puthussarypady = CHAOTIC DYNAMICS OF SEA CLUTTER
Hrycej = NEUROCONTROL: Towards an Industrial Control Methodology
Hyvarinen, Karhunen, and Oja = INDEPENDENT COMPONENT ANALYSIS
Kristic, Kanellakopoulos, and Kokotovic = NONLINEAR AND ADAPTIVECONTROL DESIGN
Nikias and Shao = SIGNAL PROCESSING WITH ALPHA-STABLEDISTRIBUTIONS AND APPLICATIONS
Passino and Burgess = STABILITY ANALYSIS OF DISCRETE EVENT SYSTEMS
Sanchez-Pena and Sznaler = ROBUST SYSTEMS THEORY ANDAPPLICATIONS
Sandberg, Lo, Fancourt, Principe, Katagiri, and Haykin = NONLINEARDYNAMICAL SYSTEMS: Feedforward Neural Network Perspectives
Tao and Kokotovic = ADAPTIVE CONTROL OF SYSTEMS WITH ACTUATORAND SENSOR NONLINEARITIES
Tsoukalas and Uhrig = FUZZY AND NEURAL APPROACHES INENGINEERING
Van Hulle = FAITHFUL REPRESENTATIONS AND TOPOGRAPHIC MAPS:From Distortion- to Information-Based Self-Organization
Vapnik = STATISTICAL LEARNING THEORY
Werbos = THE ROOTS OF BACKPROPAGATION: From OrderedDerivatives to Neural Networks and Political Forecasting

1
KALMAN FILTERS
Simon HaykinCommunications Research Laboratory, McMaster University,
Hamilton, Ontario, Canada
1.1 INTRODUCTION
The celebrated Kalman filter, rooted in the state-space formulation of
linear dynamical systems, provides a recursive solution to the linear
optimal filtering problem. It applies to stationary as well as nonstationary
environments. The solution is recursive in that each updated estimate of
the state is computed from the previous estimate and the new input data,
so only the previous estimate requires storage. In addition to eliminating
the need for storing the entire past observed data, the Kalman filter is
computationally more efficient than computing the estimate directly from
the entire past observed data at each step of the filtering process.
In this chapter, we present an introductory treatment of Kalman filters
to pave the way for their application in subsequent chapters of the book.
We have chosen to follow the original paper by Kalman [1] for the
1
Kalman Filtering and Neural Networks, Edited by Simon HaykinISBN 0-471-36998-5 # 2001 John Wiley & Sons, Inc.

derivation; see also the books by Lewis [2] and Grewal and Andrews [3].
The derivation is not only elegant but also highly insightful.
Consider a linear, discrete-time dynamical system described by the
block diagram shown in Figure 1.1. The concept of state is fundamental to
this description. The state vector or simply state, denoted by xk, is defined
as the minimal set of data that is sufficient to uniquely describe the
unforced dynamical behavior of the system; the subscript k denotes
discrete time. In other words, the state is the least amount of data on
the past behavior of the system that is needed to predict its future behavior.
Typically, the state xk is unknown. To estimate it, we use a set of observed
data, denoted by the vector yk.
In mathematical terms, the block diagram of Figure 1.1 embodies the
following pair of equations:
1. Process equation
xkþ1 ¼ Fkþ1;kxk þ wk; ð1:1Þ
where Fkþ1;k is the transition matrix taking the state xk from time k
to time k þ 1. The process noise wk is assumed to be additive, white,
and Gaussian, with zero mean and with covariance matrix defined
by
E½wnwTk � ¼
Qk for n ¼ k;0 for n 6¼ k;
�ð1:2Þ
where the superscript T denotes matrix transposition. The dimension
of the state space is denoted by M.
Figure 1.1 Signal-flow graph representation of a linear, discrete-timedynamical system.
2 1 KALMAN FILTERS

2. Measurement equation
yk ¼ Hkxk þ vk; ð1:3Þ
where yk is the observable at time k and Hk is the measurement
matrix. The measurement noise vk is assumed to be additive, white,
and Gaussian, with zero mean and with covariance matrix defined
by
E½vnvTk � ¼
Rk for n ¼ k;0 for n 6¼ k:
�ð1:4Þ
Moreover, the measurement noise vk is uncorrelated with the
process noise wk . The dimension of the measurement space is
denoted by N.
The Kalman filtering problem, namely, the problem of jointly solving
the process and measurement equations for the unknown state in an
optimum manner may now be formally stated as follows:
� Use the entire observed data, consisting of the vectors y1; y2; . . . ; yk ,
to find for each k 1 the minimum mean-square error estimate of
the state xi.
The problem is called filtering if i ¼ k, prediction if i > k, and smoothing
if 1 i < k.
1.2 OPTIMUM ESTIMATES
Before proceeding to derive the Kalman filter, we find it useful to review
some concepts basic to optimum estimation. To simplify matters, this
review is presented in the context of scalar random variables; general-
ization of the theory to vector random variables is a straightforward matter.
Suppose we are given the observable
yk ¼ xk þ vk;
where xk is an unknown signal and vk is an additive noise component. Let
xxk denote the a posteriori estimate of the signal xk , given the observations
y1; y2; . . . ; yk . In general, the estimate xxk is different from the unknown
1.2 OPTIMUM ESTIMATES 3

signal xk . To derive this estimate in an optimum manner, we need a cost
(loss) function for incorrect estimates. The cost function should satisfy two
requirements:
� The cost function is nonnegative.
� The cost function is a nondecreasing function of the estimation error
~xxk defined by
~xxk ¼ xk � xxk :
These two requirements are satisfied by the mean-square error
defined by
Jk ¼ E½ðxk � xxkÞ2�
¼ E½~xx2k �;
where E is the expectation operator. The dependence of the cost
function Jk on time k emphasizes the nonstationary nature of the
recursive estimation process.
To derive an optimal value for the estimate xxk , we may invoke two
theorems taken from stochastic process theory [1, 4]:
Theorem 1.1 Conditional mean estimator If the stochastic processes
fxkg and fykg are jointly Gaussian, then the optimum estimate xxk that
minimizes the mean-square error Jk is the conditional mean estimator:
xxk ¼ E½xk jy1; y2; . . . ; yk �:
Theorem 1.2 Principle of orthogonality Let the stochastic processes
fxkg and fykg be of zero means; that is,
E½xk � ¼ E½yk � ¼ 0 for all k:
Then:
(i) the stochastic process fxkg and fykg are jointly Gaussian; or
(ii) if the optimal estimate xxk is restricted to be a linear function of
the observables and the cost function is the mean-square error,
(iii) then the optimum estimate xxk, given the observables y1,
y2; . . . ; yk, is the orthogonal projection of xk on the space
spanned by these observables.
4 1 KALMAN FILTERS

With these two theorems at hand, the derivation of the Kalman filter
follows.
1.3 KALMAN FILTER
Suppose that a measurement on a linear dynamical system, described by
Eqs. (1.1) and (1.3), has been made at time k. The requirement is to use
the information contained in the new measurement yk to update the
estimate of the unknown state xk . Let xx�k denote a priori estimate of the
state, which is already available at time k. With a linear estimator as the
objective, we may express the a posteriori estimate xxk as a linear
combination of the a priori estimate and the new measurement, as
shown by
xxk ¼ Gð1Þk xx�k þ Gkyk; ð1:5Þ
where the multiplying matrix factors Gð1Þk and Gk are to be determined. To
find these two matrices, we invoke the principle of orthogonality stated
under Theorem 1.2. The state-error vector is defined by
~xxk ¼ xk � xxk : ð1:6Þ
Applying the principle of orthogonality to the situation at hand, we may
thus write
E½~xxkyTi � ¼ 0 for i ¼ 1; 2; . . . ; k � 1: ð1:7Þ
Using Eqs. (1.3), (1.5), and (1.6) in (1.7), we get
E½ðxk � Gð1Þk xx�k � GkHkxk � GkwkÞy
Ti � ¼ 0 for i ¼ 1; 2; . . . ; k � 1:
ð1:8Þ
Since the process noise wk and measurement noise vk are uncorrelated, it
follows that
E½wkyTi � ¼ 0:
1.3 KALMAN FILTER 5

Using this relation and rearranging terms, we may rewrite Eq. (8) as
E½ðI � GkHk � Gð1Þk ÞxkyT
i þ Gð1Þk ðxk � xx�
k ÞyTi � ¼ 0; ð1:9Þ
where I is the identity matrix. From the principle of orthogonality, we now
note that
E½ðxk � xx�k ÞyTi � ¼ 0:
Accordingly, Eq. (1.9) simplifies to
ðI � GkHk � Gð1Þk ÞE½xkyT
i � ¼ 0 for i ¼ 1; 2; . . . ; k � 1: ð1:10Þ
For arbitrary values of the state xk and observable yi, Eq. (1.10) can only
be satisfied if the scaling factors Gð1Þk and Gk are related as follows:
I � GkHk � Gð1Þk ¼ 0;
or, equivalently, Gð1Þk is defined in terms of Gk as
Gð1Þk ¼ I � GkHk : ð1:11Þ
Substituting Eq. (1.11) into (1.5), we may express the a posteriori estimate
of the state at time k as
xxk ¼ xx�k þ Gkðyk � Hk xx�
k Þ; ð1:12Þ
in light of which, the matrix Gk is called the Kalman gain.
There now remains the problem of deriving an explicit formula for Gk.
Since, from the principle of orthogonality, we have
E½ðxk � xxkÞyTk � ¼ 0; ð1:13Þ
it follows that
E½ðxk � xxkÞyyTk � ¼ 0; ð1:14Þ
6 1 KALMAN FILTERS

where yyTk is an estimate of yk given the previous measurement
y1; y2; . . . ; yk�1. Define the innovations process
~yyk ¼ yk � yyk : ð1:15Þ
The innovation process represents a measure of the ‘‘new’’ information
contained in yk ; it may also be expressed as
~yyk ¼ yk � Hk xx�k
¼ Hkxk þ vk � Hk xx�k
¼ Hk ~xx�k þ vk : ð1:16Þ
Hence, subtracting Eq. (1.14) from (1.13) and then using the definition of
Eq. (1.15), we may write
E½ðxk � xxkÞ~yyTk � ¼ 0: ð1:17Þ
Using Eqs. (1.3) and (1.12), we may express the state-error vector xk � xxk
as
xk � xxk ¼ ~xx�k � GkðHk ~xx�k þ vkÞ
¼ ðI � GkHkÞ~xx�k � Gkvk : ð1:18Þ
Hence, substituting Eqs. (1.16) and (1.18) into (1.17), we get
E½fðI � GkHkÞ~xx�k � GkvkgðHk ~xx
�k þ vkÞ� ¼ 0: ð1:19Þ
Since the measurement noise vk is independent of the state xk and
therefore the error ~xx�k , the expectation of Eq. (1.19) reduces to
ðI � GkHkÞE½~xxk ~xxT�k �HT
k � GkE½vkvTk � ¼ 0: ð1:20Þ
Define the a priori covariance matrix
P�k ¼ E½ðxk � xx�
k Þðxk � xx�k Þ
T�
¼ E½~xx�k � ~xxT�k �: ð1:21Þ
1.3 KALMAN FILTER 7

Then, invoking the covariance definitions of Eqs. (1.4) and (1.21), we may
rewrite Eq. (1.20) as
ðI � GkHkÞP�k HT
k � GkRk ¼ 0:
Solving this equation for Gk, we get the desired formula
Gk ¼ P�k HT
k ½HkP�k HT
k þ Rk ��1; ð1:22Þ
where the symbol ½���1 denotes the inverse of the matrix inside the square
brackets. Equation (1.22) is the desired formula for computing the Kalman
gain Gk , which is defined in terms of the a priori covariance matrix P�k .
To complete the recursive estimation procedure, we consider the error
covariance propagation, which describes the effects of time on the
covariance matrices of estimation errors. This propagation involves two
stages of computation:
1. The a priori covariance matrix P�k at time k is defined by Eq. (1.21).
Given P�k , compute the a posteriori covariance matrix Pk , which, at
time k, is defined by
Pk ¼ E½~xxk ~xxTk �
¼ E½ðxk � xxkÞðxk � xxkÞT�: ð1:23Þ
2. Given the ‘‘old’’ a posteriori covariance matrix, Pk�1, compute the
‘‘updated’’ a priori covariance matrix P�k .
To proceed with stage 1, we substitute Eq. (1.18) into (1.23) and note
that the noise process vk is independent of the a priori estimation error ~xx�k .
We thus obtain1
Pk ¼ ðI � GkHkÞE½~xx�k ~xxT�
k �ðI � GkHkÞTþ GkE½vkvT
k �GTk
¼ ðI � GkHkÞP�k ðI � GkHkÞ
Tþ GkRkGT
k : ð1:24Þ
1Equation (1.24) is referred to as the ‘‘Joseph’’ version of the covariance update equation
[5].
8 1 KALMAN FILTERS
Expanding terms in Eq. (1.24) and then using Eq. (1.22), we may
reformulate the dependence of the a posteriori covariance matrix Pk on
the a priori covariance matrix P�k in the simplified form
Pk ¼ ðI � GkHkÞP�k � ðI � GkHkÞP
�k HT
k GTk þ GkRkGT
k
¼ ðI � GkHkÞP�k � GkRkGT
k þ GkRkGTk
¼ ðI � GkHkÞP�k : ð1:25Þ
For the second stage of error covariance propagation, we first recognize
that the a priori estimate of the state is defined in terms of the ‘‘old’’ a
posteriori estimate as follows:
xx�k ¼ Fk;k�1xxk�1: ð1:26Þ
We may therefore use Eqs. (1.1) and (1.26) to express the a priori
estimation error in yet another form:
~xx�k ¼ xk � xx-k
¼ ðFk;k�1xk�1 þ wk�1Þ � ðFk;k�1xxk�1Þ
¼ Fk;k�1ðxk�1 � xxk�1Þ þ wk�1
¼ Fk;k�1 ~xxk�1 þ wk�1: ð1:27Þ
Accordingly, using Eq. (1.27) in (1.21) and noting that the process noise
wk is independent of ~xxk�1, we get
P�k ¼ Fk;k�1E½~xxk�1 ~xx
Tk�1�F
Tk;k�1 þ E½wk�1wT
k�1�
¼ Fk;k�1Pk�1FTk;k�1 þ Qk�1; ð1:28Þ
which defines the dependence of the a priori covariance matrix P�k on the
‘‘old’’ a posteriori covariance matrix Pk�1.
With Eqs. (1.26), (1.28), (1.22), (1.12), and (1.25) at hand, we may now
summarize the recursive estimation of state as shown in Table 1.1. This
table also includes the initialization. In the absence of any observed data at
time k ¼ 0, we may choose the initial estimate of the state as
xx0 ¼ E½x0�; ð1:29Þ
1.3 KALMAN FILTER 9

and the initial value of the a posteriori covariance matrix as
P0 ¼ E½ðx0 � E½x0�Þðx0 � E½x0�ÞT�: ð1:30Þ
This choice for the initial conditions not only is intuitively satisfying but
also has the advantage of yielding an unbiased estimate of the state xk .
1.4 DIVERGENCE PHENOMENON: SQUARE-ROOT FILTERING
The Kalman filter is prone to serious numerical difficulties that are well
documented in the literature [6]. For example, the a posteriori covariance
matrix Pk is defined as the difference between two matrices P�k and
Table 1.1 Summary of the Kalman filter
State-space model
xkþ1 ¼ Fkþ1;kxk þ wk;
yk ¼ Hkxk þ vk;
where wk and vk are independent, zero-mean, Gaussian noise processes of
covariance matrices Qk and Rk, respectively.
Initialization: For k ¼ 0, set
xx0 ¼ E½x0�;
P0 ¼ E ½ðx0 � E½x0�Þðx0 � E½x0�ÞT�:
Computation: For k ¼ 1; 2; . . . , compute:
State estimate propagation
xx�k ¼ Fk;k�1xx�
k�1;
Error covariance propagation
P�k ¼ Fk;k�1Pk�1FT
k;k�1 þ Qk�1;
Kalman gain matrix
Gk ¼ P�k HT
k HkP�k HT
k þ Rk
� ��1;
State estimate update
xxk ¼ xx�k þ Gk yk � Hk xx�
k
� �;
Error covariance update
Pk ¼ ðI � GkHkÞP�k :
10 1 KALMAN FILTERS

GkHkP�k ; see Eq. (1.25). Hence, unless the numerical accuracy of the
algorithm is high enough, the matrix Pk resulting from this computation
may not be nonnegative-definite. Such a situation is clearly unacceptable,
because Pk represents a covariance matrix. The unstable behavior of the
Kalman filter, which results from numerical inaccuracies due to the use of
finite-wordlength arithmetic, is called the divergence phenomenon.
A refined method of overcoming the divergence phenomenon is to use
numerically stable unitary transformations at every iteration of the Kalman
filtering algorithm [6]. In particular, the matrix Pk is propagated in a
square-root form by using the Cholesky factorization:
Pk ¼ P1=2k P
T=2k ; ð1:31Þ
where P1=2k is reserved for a lower-triangular matrix, and P
T=2k is its
transpose. In linear algebra, the Cholesky factor P1=2k is commonly referred
to as the square root of the matrix Pk . Accordingly, any variant of the
Kalman filtering algorithm based on the Cholesky factorization is referred
to as square-root filtering. The important point to note here is that the
matrix product P1=2k P
T=2k is much less likely to become indefinite, because
the product of any square matrix and its transpose is always positive-
definite. Indeed, even in the presence of roundoff errors, the numerical
conditioning of the Cholesky factor P1=2k is generally much better than that
of Pk itself.
1.5 RAUCH–TUNG–STRIEBEL SMOOTHER
In Section 1.3, we addressed the optimum linear filtering problem. The
solution to the linear prediction problem follows in a straightforward
manner from the basic theory of Section 1.3. In this section, we consider
the optimum smoothing problem.
To proceed, suppose that we are given a set of data over the time
interval 0 < k N . Smoothing is a non-real-time operation in that it
involves estimation of the state xk for 0 < k N, using all the available
data, past as well as future. In what follows, we assume that the final time
N is fixed.
To determine the optimum state estimates xxk for 0 < k N, we need to
account for past data yj defined by 0 < j k, and future data yj defined by
k < j N . The estimation pertaining to the past data, which we refer to as
forward filtering theory, was presented in Section 1.3. To deal with the
1.5 RAUCH–TUNG–STRIEBEL SMOOTHER 11

issue of state estimation pertaining to the future data, we use backward
filtering, which starts at the final time N and runs backwards. Let xxfk and
xxbk denote the state estimates obtained from the forward and backward
recursions, respectively. Given these two estimates, the next issue to be
considered is how to combine them into an overall smoothed estimate xxk ,
which accounts for data over the entire time interval. Note that the symbol
xxk used for the smoothed estimate in this section is not to be confused with
the filtered (i.e., a posteriori) estimate used in Section 1.3.
We begin by rewriting the process equation (1.1) as a recursion for
decreasing k, as shown by
xk ¼ F�1kþ1;kxkþ1 � F�1
kþ1;kwk; ð1:32Þ
where F�1kþ1;k is the inverse of the transition matrix Fkþ1;k . The rationale
for backward filtering is depicted in Figure 1.2a, where the recursion
begins at the final time N . This rationale is to be contrasted with that of
forward filtering depicted in Figure 1.2b. Note that the a priori estimate
xxb�k and the a posteriori estimate xxb
k for backward filtering occur to the
right and left of time k in Figure 1.2a, respectively. This situation is the
exact opposite to that occurring in the case of forward filtering depicted in
Figure 1.2b.
To simplify the presentation, we introduce the two definitions:
Sk ¼ ½Pbk ��1; ð1:33Þ
S�k ¼ ½Pb�
k ��1; ð1:34Þ
Figure 1.2 Illustrating the smoother time-updates for (a ) backward filteringand (b) forward filtering.
12 1 KALMAN FILTERS

and the two intermediate variables
zzk ¼ ½Pbk ��1xxb
k ¼ Sk xxbk; ð1:35Þ
zz�k ¼ ½Pb�k �
�1xxb�k ¼ S�
k xxb�k : ð1:36Þ
Then, building on the rationale of Figure 1.2a, we may derive the
following updates for the backward filter [2]:
1. Measurement updates
Sk ¼ S�k þ HkR�1
k Hk; ð1:37Þ
zzk ¼ zz�k þ HTk R�1
k yk; ð1:38Þ
where yk is the observable defined by the measurement equation
(1.3), Hk is the measurement matrix, and R�1k is the inverse of the
covariance matrix of the measurement noise vk .
2. Time updates
Gbk ¼ Skþ1½Skþ1 þ Q�1
k ��1; ð1:39Þ
S�k ¼ FT
kþ1;kðI � GbkÞSkþ1Fkþ1;k; ð1:40Þ
zz�k ¼ FTkþ1;kðI � Gb
kÞzzkþ1; ð1:41Þ
where Gbk is the Kalman gain for backward filtering and Q�1
k is the
inverse of the covariance matrix of the process noise wk . The
backward filter defined by the measurement and time updates of
Eqs. (1.37)–(1.41) is the information formulation of the Kalman
filter. The information filter is distinguished from the basic Kalman
filter in that it propagates the inverse of the error covariance matrix
rather than the error covariance matrix itself.
Given observable data over the interval 0 < k N for fixed N, suppose
we have obtained the following two estimates:
� The forward a posteriori estimate xxfk by operating the Kalman filter
on data yj for 0 < j k.
� The backward a priori estimate xxb�k by operating the information
filter on data yj for k < j N.
1.5 RAUCH–TUNG–STRIEBEL SMOOTHER 13

With these two estimates and their respective error covariance matrices at
hand, the next issue of interest is how to determine the smoothed estimate
xxk and its error covariance matrix, which incorporate the overall data over
the entire time interval 0 < k N .
Recognizing that the process noise wk and measurement noise vk are
independent, we may formulate the error covariance matrix of the a
posteriori smoothed estimate xxk as follows:
Pk ¼ ½½Pfk ��1
þ ½Pb�k �
�1��1
¼ ½½Pfk ��1
þ S�k �
�1: ð1:42Þ
To proceed further, we invoke the matrix inversion lemma, which may be
stated as follows [7]. Let A and B be two positive-definite matrices related
by
A ¼ B�1 þ CD�1CT ;
where D is another positive-definite matrix and C is a matrix with
compatible dimensions. The matrix inversion lemma states that we may
express the inverse of the matrix A as follows:
A�1 ¼ B � BC½D þ CT BC��1CT B:
For the problem at hand, we set
A ¼ P�1k ;
B ¼ Pfk;
C ¼ I;
D ¼ ½S�k �
�1;
where I is the identity matrix. Then, applying the matrix inversion lemma
to Eq. (1.42), we obtain
Pk ¼ Pfk � P
fk ½P
b�k þ P
fk �
�1Pfk
¼ Pfk � P
fk S�
k ½I þ Pfk S�
k ��1P
fk : ð1:43Þ
From Eq. (1.43), we find that the a posteriori smoothed error covariance
matrix Pk is smaller than or equal to the a posteriori error covariance
14 1 KALMAN FILTERS

matrix Pfk produced by the Kalman filter, which is naturally due to the fact
that smoothing uses additional information contained in the future data.
This point is borne out by Figure 1.3, which depicts the variations of Pk ,
Pfk , and Pb�
k with k for a one-dimensional situation.
The a posteriori smoothed estimate of the state is defined by
xxk ¼ Pkð½Pfk ��1xx
fk þ ½Pb�
k ��1xxb�
k Þ: ð1:44Þ
Using Eqs. (1.36) and (1.43) in (1.44) yields, after simplification,
xxk ¼ xxfk þ ðPkz�k � Gk xx
fk Þ; ð1:45Þ
where the smoother gain is defined by
Gk ¼ Pfk S�
k ½I þ Pfk S�
k ��1; ð1:46Þ
which is not to be confused with the Kalman gain of Eq. (1.22).
The optimum smoother just derived consists of three components:
� A forward filter in the form of a Kalman filter.
� A backward filter in the form of an information filter.
� A separate smoother, which combines results embodied in the
forward and backward filters.
The Rauch–Tung–Striebel smoother, however, is more efficient than the
three-part smoother in that it incorporates the backward filter and separate
Figure 1.3 Illustrating the error covariance for forward filtering, backwardfiltering, and smoothing.
1.5 RAUCH–TUNG–STRIEBEL SMOOTHER 15

smoother into a single entity [8, 9]. Specifically, the measurement update
of the Rauch–Tung–Striebel smoother is defined by
Pk ¼ Pfk � AkðP
f �kþ1 � Pkþ1ÞA
Tk ; ð1:47Þ
where Ak is the new gain matrix:
Ak ¼ Pfk FT
kþ1;k ½Pf �kþ1�
�1: ð1:48Þ
The corresponding time update is defined by
xxk ¼ xxfk þ Akðxxkþ1 � xx
f �kþ1Þ ð1:49Þ
The Rauch–Tung–Striebel smoother thus proceeds as follows:
1. The Kalman filter is applied to the observable data in a forward
manner, that is, k ¼ 0; 1; 2; . . . , in accordance with the basic theory
summarized in Table 1.1.
2. The recursive smoother is applied to the observable data in a
backward manner, that is, k ¼ N � 1;N � 2; . . . , in accordance
with Eqs. (1.47)–(1.49).
3. The initial conditions are defined by
PN ¼ PfN ; ð1:50Þ
xxk ¼ xxfk : ð1:51Þ
Table 1.2 summarizes the computations involved in the Rauch–Tung–
Striebel smoother.
1.6 EXTENDED KALMAN FILTER
The Kalman filtering problem considered up to this point in the discussion
has addressed the estimation of a state vector in a linear model of a
dynamical system. If, however, the model is nonlinear, we may extend the
use of Kalman filtering through a linearization procedure. The resulting
filter is referred to as the extended Kalman filter (EKF) [10–12]. Such an
16 1 KALMAN FILTERS

extension is feasible by virtue of the fact that the Kalman filter is described
in terms of difference equations in the case of discrete-time systems.
To set the stage for a development of the extended Kalman filter,
consider a nonlinear dynamical system described by the state-space model
xkþ1 ¼ fðk; xkÞ þ wk; ð1:52Þ
yk ¼ hðk; xkÞ þ vk; ð1:53Þ
Table 1.2 Summary of the Rauch–Tung–Striebel smoother
State-space model
xkþ1 ¼ Fkþ1;kxk þ wk
yk ¼ Hkxk þ vk
where wk and vk are independent, zero-mean, Gaussian noise processes of
covariance matrices Qk and Rk, respectively.
Forward filter
Initialization: For k ¼ 0, set
xx0 ¼ E½x0�;
P0 ¼ E½ðx0 � E½x0�ðx0 � E½x0�ÞT�:
Computation: For k ¼ 1; 2; . . . , compute
xxf �k ¼ Fk;k�1xx
f �k�1;
Pf �k ¼ Fk;k�1P
fk�1FT
k;k�1 þ Qk�1;
Gfk ¼ P
f �k HT
k ½HkPf �k HT
k þ Rk ��1;
xxfk ¼ xx
f �k þ G
fk ðyk � Hk xx
f �k Þ:
Recursive smoother
Initialization: For k ¼ N, set
PN ¼ PfN ;
xxk ¼ xxfk :
Computation: For k ¼ N � 1;N � 2, compute
Ak ¼ Pfk FT
kþ1;k ½Pf �kþ1�
�1;
Pk ¼ Pfk � AkðP
f �kþ1 � Pkþ1ÞA
Tk ;
xxk ¼ xxfk þ Ak xxkþ1 � xx
f �kþ1
� �:
1.6 EXTENDED KALMAN FILTER 17

where, as before, wk and vk are independent zero-mean white Gaussian
noise processes with covariance matrices Rk and Qk, respectively. Here,
however, the functional fðk; xkÞ denotes a nonlinear transition matrix
function that is possibly time-variant. Likewise, the functional hðk; xkÞ
denotes a nonlinear measurement matrix that may be time-variant, too.
The basic idea of the extended Kalman filter is to linearize the state-
space model of Eqs. (1.52) and (1.53) at each time instant around the most
recent state estimate, which is taken to be either xxk or xx�k , depending on
which particular functional is being considered. Once a linear model is
obtained, the standard Kalman filter equations are applied.
More explicitly, the approximation proceeds in two stages.
Stage 1 The following two matrices are constructed:
Fkþ1;k ¼@fðk; xÞ
@x
����x¼xxk
; ð1:54Þ
Hk ¼@hðk; xkÞ
@x
����x¼xx�
k
: ð1:55Þ
That is, the ijth entry of Fkþ1;k is equal to the partial derivative of the ith
component of Fðk; xÞ with respect to the jth component of x. Likewise, the ijth
entry of Hk is equal to the partial derivative of the ith component of Hðk; xÞ with
respect to the jth component of x. In the former case, the derivatives are evaluated
at xxk , while in the latter case, the derivatives are evaluated at xx�k . The entries of
the matrices Fkþ1;k and Hk are all known (i.e., computable), by having xxk and xx�k
available at time k.
Stage 2 Once the matrices Fkþ1;k and Hk are evaluated, they are then employed
in a first-order Taylor approximation of the nonlinear functions Fðk; xkÞ and
Hðk; xkÞ around xxk and xx�k , respectively. Specifically, Fðk; xkÞ and Hðk; xkÞ are
approximated as follows
Fðk; xkÞ � Fðx; xxkÞ þ Fkþ1;kðx; xxkÞ; ð1:56Þ
Hðk; xkÞ � Hðx; xx�k Þ þ Hkþ1;kðx; xx�
k Þ: ð1:57Þ
With the above approximate expressions at hand, we may now proceed to
approximate the nonlinear state equations (1.52) and (1.53) as shown by,
respectively,
xkþ1 � Fkþ1;kxk þ wk þ dk;
�yyk � Hkxk þ vk ;
18 1 KALMAN FILTERS

where we have introduced two new quantities:
�yyk ¼ yk � fhðx; xx�k Þ � Hk xx�
k g; ð1:58Þ
dk ¼ fðx; xxkÞ � Fkþ1;k xxk : ð1:59Þ
The entries in the term �yyk are all known at time k, and, therefore, �yyk can be
regarded as an observation vector at time n. Likewise, the entries in the term dk
are all known at time k.
Table 1.3 Extended Kalman filter
State-space model
xkþ1 ¼ fðk; xkÞ þ wk;
yk ¼ hðk; xkÞ þ vk ;
where wk and vk are independent, zero mean, Gaussian noise processes of
covariance matrices Qk and Rk, respectively.
Definitions
Fkþ1;k ¼@fðk; xÞ
@xjx¼xk
;
Hk ¼@hðk; xÞ
@xjx¼x�
k:
Initialization: For k ¼ 0, set
xx0 ¼ E½x0�;
P0 ¼ E½ðx0 � E½x0�Þðx0 � E½x0�ÞT�:
Computation: For k ¼ 1; 2; . . . , compute:
State estimate propagation
xx�k ¼ fðk; xxk�1Þ;
Error covariance propagation
P�k ¼ Fk;k�1Pk�1FT
k;k�1 þ Qk�1;
Kalman gain matrix
Gk ¼ P�k HT
k HkP�k HT
k þ Rk
� ��1;
State estimate update
xxk ¼ xx�k þ Gkyk � hðk; xx�
k Þ;
Error covariance update
Pk ¼ ðI � GkHkÞP�k :
1.6 EXTENDED KALMAN FILTER 19

Given the linearized state-space model of Eqs. (1.58) and (1.59), we
may then proceed and apply the Kalman filter theory of Section 1.3 to
derive the extended Kalman filter. Table 1.2 summarizes the recursions
involved in computing the extended Kalman filter.
1.7 SUMMARY
The basic Kalman filter is a linear, discrete-time, finite-dimensional
system, which is endowed with a recursive structure that makes a digital
computer well suited for its implementation. A key property of the
Kalman filter is that it is the minimum mean-square (variance) estimator
of the state of a linear dynamical system.
The Kalman filter, summarized in Table 1.1, applies to a linear
dynamical system, the state space model of which consists of two
equations:
� The process equation that defines the evolution of the state with time.
� The measurement equation that defines the observable in terms of the
state.
The model is stochastic owing to the additive presence of process noise
and measurement noise, which are assumed to be Gaussian with zero
mean and known covariance matrices.
The Rauch–Tung–Striebel smoother, summarized in Table 1.2, builds
on the Kalman filter to solve the optimum smoothing problem in an
efficient manner. This smoother consists of two components: a forward
filter based on the basic Kalman filter, and a combined backward filter and
smoother.
Applications of Kalman filter theory may be extended to nonlinear
dynamical systems, as summarized in Table 1.3. The derivation of the
extended Kalman filter hinges on linearization of the nonlinear state-space
model on the assumption that deviation from linearity is of first order.
REFERENCES
[1] R.E. Kalman, ‘‘A new approach to linear filtering and prediction problems,’’
Transactions of the ASME, Ser. D, Journal of Basic Engineering, 82, 34–45
(1960).
20 1 KALMAN FILTERS

[2] F.H. Lewis, Optical Estimation with an Introduction to Stochastic Control
Theory. New York: Wiley, 1986.
[3] M.S. Grewal and A.P. Andrews, Kalman Filtering: Theory and Practice.
Englewood Cliffs, NJ: Prentice-Hall, 1993.
[4] H.L. Van Trees, Detection, Estimation, and Modulation Theory, Part I. New
York: Wiley, 1968.
[5] R.S. Bucy and P.D. Joseph, Filtering for Stochastic Processes, with Applica-
tions to Guidance. New York: Wiley, 1968.
[6] P.G. Kaminski, A.E. Bryson, Jr., and S.F. Schmidt, ‘‘Discrete square root
filtering: a survey of current techniques,’’ IEEE Transactions on Automatic
Control, 16, 727–736 (1971).
[7] S. Haykin, Adaptive Filter Theory, 3rd ed. Upper Saddle River, NJ: Prentice-
Hall, 1996.
[8] H.E. Rauch, ‘‘Solutions to the linear smoothing problem,’’ IEEE Trans-
actions on Automatic Control, 11, 371–372 (1963).
[9] H.E. Rauch, F. Tung, and C.T. Striebel, ‘‘Maximum likelihood estimates of
linear dynamic systems,’’ AIAA Journal, 3, 1445–1450 (1965).
[10] A.H. Jazwinski, Stochastic Processes and Filtering Theory. New York:
Academic Press, 1970.
[11] P.S. Maybeck, Stochastic Models, Estimation and Control, Vol. 1. New York:
Academic Press, 1979.
[12] P.S. Maybeck, Stochastic Models, Estimation, and Control, Vol. 2. New
York: Academic Press, 1982.
REFERENCES 21

2
PARAMETER-BASEDKALMAN FILTER TRAINING:
THEORY ANDIMPLEMENTATION
Gintaras V. Puskorius and Lee A. FeldkampFord Research Laboratory, Ford Motor Company, Dearborn, Michigan, U.S.A.
([email protected], [email protected])
2.1 INTRODUCTION
Although the rediscovery in the mid 1980s of the backpropagation
algorithm by Rumelhart, Hinton, and Williams [1] has long been
viewed as a landmark event in the history of neural network computing
and has led to a sustained resurgence of activity, the relative ineffective-
ness of this simple gradient method has motivated many researchers to
develop enhanced training procedures. In fact, the neural network litera-
ture has been inundated with papers proposing alternative training
23
Kalman Filtering and Neural Networks, Edited by Simon HaykinISBN 0-471-36998-5 # 2001 John Wiley & Sons, Inc.

methods that are claimed to exhibit superior capabilities in terms of
training speed, mapping accuracy, generalization, and overall performance
relative to standard backpropagation and related methods.
Amongst the most promising and enduring of enhanced training
methods are those whose weight update procedures are based upon
second-order derivative information (whereas standard backpropagation
exclusively utilizes first-derivative information). A variety of second-order
methods began to be developed and appeared in the published neural
network literature shortly after the seminal article on backpropagation was
published. The vast majority of these methods can be characterized as
batch update methods, where a single weight update is based on a matrix
of second derivatives that is approximated on the basis of many training
patterns. Popular second-order methods have included weight updates
based on quasi-Newton, Levenburg–Marquardt, and conjugate gradient
techniques. Although these methods have shown promise, they are often
plagued by convergence to poor local optima, which can be partially
attributed to the lack of a stochastic component in the weight update
procedures. Note that, unlike these second-order methods, weight updates
using standard backpropagation can either be performed in batch or
instance-by-instance mode.
The extended Kalman filter (EKF) forms the basis of a second-order
neural network training method that is a practical and effective alternative
to the batch-oriented, second-order methods mentioned above. The
essence of the recursive EKF procedure is that, during training, in addition
to evolving the weights of a network architecture in a sequential (as
opposed to batch) fashion, an approximate error covariance matrix that
encodes second-order information about the training problem is also
maintained and evolved. The global EKF (GEKF) training algorithm
was introduced by Singhal and Wu [2] in the late 1980s, and has served as
the basis for the development and enhancement of a family of computa-
tionally effective neural network training methods that has enabled the
application of feedforward and recurrent neural networks to problems in
control, signal processing, and pattern recognition.
In their work, Singhal and Wu developed a second-order, sequential
training algorithm for static multilayered perceptron networks that was
shown to be substantially more effective (orders of magnitude) in terms of
number of training epochs than standard backpropagation for a series of
pattern classification problems. However, the computational complexity
of GEKF scales as the square of the number of weights, due to the
development and use of second-order information that correlates every
pair of network weights, and was thus found to be impractical for all but
24 2 PARAMETER-BASED KALMAN FILTER TRAINING

the simplest network architectures, given the state of standard computing
hardware in the early 1990s.
In response to the then-intractable computational complexity of GEKF,
we developed a family of training procedures, which we named the
decoupled EKF algorithm [3]. Whereas the GEKF procedure develops
and maintains correlations between each pair of network weights, the
DEKF family provides an approximation to GEKF by developing and
maintaining second-order information only between weights that belong to
mutually exclusive groups. We have concentrated on what appear to be
some relatively natural groupings; for example, the node-decoupled
(NDEKF) procedure models only the interactions between weights that
provide inputs to the same node. In one limit of a separate group for each
network weight, we obtain the fully decoupled EKF procedure, which
tends to be only slightly more effective than standard backpropagation. In
the other extreme of a single group for all weights, DEKF reduces exactly
to the GEKF procedure of Singhal and Wu.
In our work, we have successfully applied NDEKF to a wide range of
network architectures and classes of training problems. We have demon-
strated that NDEKF is extremely effective at training feedforward as well
as recurrent network architectures, for problems ranging from pattern
classification to the on-line training of neural network controllers for
engine idle speed control [4, 5]. We have demonstrated the effective use of
dynamic derivatives computed by both forward methods, for example
those based on real-time-recurrent learning (RTRL) [6, 7], as well as by
truncated backpropagation through time (BPTT(h)) [8] with the param-
eter-based DEKF methods, and have extended this family of methods to
optimize cost functions other than sum of squared errors [9], which we
describe below in Sections 2.7.2 and 2.7.3.
Of the various extensions and enhancements of EKF training that we
have developed, perhaps the most enabling is one that allows for EKF
procedures to perform a single update of a network’s weights on the basis
of more than a single training instance [10–12]. As mentioned above, EKF
algorithms are intrinsically sequential procedures, where, at any given
time during training, a network’s weight values are updated on the basis of
one and only one training instance. When EKF methods or any other
sequential procedures are used to train networks with distributed repre-
sentations, as in the case of multilayered perceptrons and time-lagged
recurrent neural networks, there is a tendency for the training procedure to
concentrate on the most recently observed training patterns, to the
detriment of training patterns that had been observed and processed a
long time in the past. This situation, which has been called the recency
2.1 INTRODUCTION 25

phenomenon, is particularly troublesome for training of recurrent neural
networks and=or neural network controllers, where the temporal order of
presentation of data during training must be respected. It is likely that
sequential training procedures will perform greedily for these systems, for
example by merely changing a network’s output bias during training to
accommodate a new region of operation. On the other hand, the off-line
training of static networks can circumvent difficulties associated with the
recency effect by employing a scrambling of the sequence of data
presentation during training.
The recency phenomenon can be at least partially mitigated in these
circumstances by providing a mechanism that allows for multiple training
instances, preferably from different operating regions, to be simulta-
neously considered for each weight vector update. Multistream EKF
training is an extension of EKF training methods that allows for multiple
training instances to be batched, while remaining consistent with the
Kalman methods.
We begin with a brief discussion of the types of feedforward and
recurrent network architectures that we are going to consider for training
by EKF methods. We then discuss the global EKF training method,
followed by recommendations for setting of parameters for EKF methods,
including the relationship of the choice of learning rate to the initialization
of the error covariance matrix. We then provide treatments of the
decoupled extended Kalman filter (DEKF) method as well as the multi-
stream procedure that can be applied with any level of decoupling. We
discuss at length a variety of issues related to computer implementation,
including derivative calculations, computationally efficient formulations,
methods for avoiding matrix inversions, and square-root filtering for
computational stability. This is followed by a number of special topics,
including training with constrained weights and alternative cost functions.
We then provide an overview of applications of EKF methods to a series of
problems in control, diagnosis, and modeling of automotive powertrain
systems. We conclude the chapter with a discussion of the virtues and
limitations of EKF training methods, and provide a series of guidelines for
implementation and use.
2.2 NETWORK ARCHITECTURES
We consider in this chapter two types of network architecture: the well-
known feedforward layered network and its dynamic extension, the
recurrent multilayered perceptron (RMLP). A block-diagram representa-
26 2 PARAMETER-BASED KALMAN FILTER TRAINING

tion of these types of networks is given in Figure 2.1. Figure 2.2 shows an
example network, denoted as a 3-3-3-2 network, with three inputs, two
hidden layers of three nodes each, and an output layer of two nodes.
Figure 2.3 shows a similar network, but modified to include interlayer,
time-delayed recurrent connections. We denote this as a 3-3R-3R-2R
RMLP, where the letter ‘‘R’’ denotes a recurrent layer. In this case, both
hidden layers as well as the output layer are recurrent. The essential
difference between the two types of networks is the recurrent network’s
ability to encode temporal information. Once trained, the feedforward
Figure 2.1 Block-diagram representation of two hidden layer networks. (a )depicts a feedforward layered neural network that provides a staticmapping between the input vector uk and the output vector yk. (b) depictsa recurrent multilayered perceptron (RMLP) with two hidden layers. In thiscase, we assume that there are time-delayed recurrent connectionsbetween the outputs and inputs of all nodes within a layer. The signals vi
k
denote the node activations for the ith layer. Both of these block repre-sentations assume that bias connections are included in the feedforwardconnections.
Figure 2.2 A schematic diagram of a 3-3-3-2 feedforward network archi-tecture corresponding to the block diagram of Figure 2.1a.
2.2 NETWORK ARCHITECTURES 27

network merely carries out a static mapping from input signals uk to
outputs yk , such that the output is independent of the history in which
input signals are presented. On the other hand, a trained RMLP provides a
dynamic mapping, such that the output yk is not only a function of the
current input pattern uk , but also implicitly a function of the entire history
of inputs through the time-delayed recurrent node activations, given by the
vectors vik�1, where i indexes layer number.
2.3 THE EKF PROCEDURE
We begin with the equations that serve as the basis for the derivation of the
EKF family of neural network training algorithms. A neural network’s
behavior can be described by the following nonlinear discrete-time
system:
wkþ1 ¼ wk þvk ð2:1Þ
yk ¼ hkðwk; uk; vk�1Þ þ nk : ð2:2Þ
The first of these, known as the process equation, merely specifies that the
state of the ideal neural network is characterized as a stationary process
corrupted by process noise vk , where the state of the system is given by
the network’s weight parameter values wk . The second equation, known as
the observation or measurement equation, represents the network’s desired
Figure 2.3. A schematic diagram of a 3-3R-3R-2R recurrent network archi-tecture corresponding to the block diagram of Figure 2.1b. Note thepresence of time delay operators and recurrent connections betweenthe nodes of a layer.
28 2 PARAMETER-BASED KALMAN FILTER TRAINING

response vector yk as a nonlinear function of the input vector uk, the
weight parameter vector wk, and, for recurrent networks, the recurrent
node activations vk ; this equation is augmented by random measurement
noise nk . The measurement noise nk is typically characterized as zero-
mean, white noise with covariance given by E½nknTl � ¼ dk;lRk. Similarly,
the process noise vk is also characterized as zero-mean, white noise with
covariance given by E½vkvTl � ¼ dk;lQk.
2.3.1 Global EKF Training
The training problem using Kalman filter theory can now be described as
finding the minimum mean-squared error estimate of the state w using all
observed data so far. We assume a network architecture with M weights
and No output nodes and cost function components. The EKF solution to
the training problem is given by the following recursion (see Chapter 1):
Ak ¼ ½Rk þ HTk PkHk �
�1; ð2:3Þ
Kk ¼ PkHkAk; ð2:4Þ
wwkþ1 ¼ wwk þ Kkjk; ð2:5Þ
Pkþ1 ¼ Pk � KkHTk Pk þ Qk : ð2:6Þ
The vector wwk represents the estimate of the state (i.e., weights) of the
system at update step k. This estimate is a function of the Kalman gain
matrix Kk and the error vector jk ¼ yk � yyk, where yk is the target vector
and yyk is the network’s output vector for the kth presentation of a training
pattern. The Kalman gain matrix is a function of the approximate error
covariance matrix Pk , a matrix of derivatives of the network’s outputs with
respect to all trainable weight parameters Hk , and a global scaling matrix
Ak . The matrix Hk may be computed via static backpropagation or
backpropagation through time for feedforward and recurrent networks,
respectively (described below in Section 2.6.1). The scaling matrix Ak is a
function of the measurement noise covariance matrix Rk , as well as of the
matrices Hk and Pk . Finally, the approximate error covariance matrix Pk
evolves recursively with the weight vector estimate; this matrix encodes
second derivative information about the training problem, and is augmen-
ted by the covariance matrix of the process noise Qk . This algorithm
attempts to find weight values that minimize the sum of squared errorPk j
Tk jk . Note that the algorithm requires that the measurement and
2.3 THE EKF PROCEDURE 29

process noise covariance matrices, Rk and Qk, be specified for all training
instances. Similarly, the approximate error covariance matrix Pk must be
initialized at the beginning of training. We consider these issues below in
Section 2.3.3.
GEKF training is carried out in a sequential fashion as shown in the
signal flow diagram of Figure 2.4. One step of training involves the
following steps:
1. An input training pattern uk is propagated through the network to
produce an output vector yyk. Note that the forward propagation is a
function of the recurrent node activations vk�1 from the previous time
step for RMLPs. The error vector jk is computed in this step as well.
2. The derivative matrix Hk is obtained by backpropagation. In this
case, there is a separate backpropagation for each component of the
output vector yyk, and the backpropagation phase will involve a time
history of recurrent node activations for RMLPs.
3. The Kalman gain matrix is computed as a function of the derivative
matrix Hk , the approximate error covariance matrix Pk , and the
measurement covariance noise matrix Rk . Note that this step
includes the computation of the global scaling matrix Ak .
4. The network weight vector is updated using the Kalman gain matrix
Kk , the error vector jk, and the current values of the weight vector wwk.
Figure 2.4 Signal flow diagram for EKF neural network training. The first twosteps, comprising the forward- and backpropagation operations, willdepend on whether or not the network being trained has recurrentconnections. On the other hand, the EKF calculations encoded by steps(3)–(5) are independent of network type.
30 2 PARAMETER-BASED KALMAN FILTER TRAINING

5. The approximate error covariance matrix is updated using the
Kalman gain matrix Kk , the derivative matrix Hk , and the current
values of the approximate error covariance matrix Pk . Although not
shown, this step also includes augmentation of the error covariance
matrix by the covariance matrix of the process noise Qk .
2.3.2 Learning Rate and Scaled Cost Function
We noted above that Rk is the covariance matrix of the measurement noise
and that this matrix must be specified for each training pattern. Generally
speaking, training problems that are characterized by noisy measurement
data usually require that the elements of Rk be scaled larger than for those
problems with relatively noise-free training data. In [5, 7, 12], we interpret
this measurement error covariance matrix to represent an inverse learning
rate: Rk ¼ Z�1k S�1
k , where the training cost function at time step k is now
given by ek ¼ 12jT
k Skjk, and Sk allows the various network output
components to be scaled nonuniformly. Thus, the global scaling matrix
Ak of equation (2.3) can be written as
Ak ¼1
Zk
S�1k þ HT
k PkHk
� ��1
: ð2:7Þ
The use of the weighting matrix Sk in Eq. (2.7) poses numerical
difficulties when the matrix is singular.1 We reformulate the GEKF
algorithm to eliminate this difficulty by distributing the square root of
the weighting matrix into both the derivative matrices as Hk* ¼ HkS1=2k and
the error vector as jk* ¼ S1=2k jk . The matrices Hk* thus contain the scaled
derivatives of network outputs with respect to the weights of the network.
The rescaled extended Kalman recursion is then given by
Ak* ¼1
Zk
I þ ðHk*ÞT PkHk*
� ��1
; ð2:8Þ
Kk* ¼ PkHk*Ak*; ð2:9Þ
wwkþ1 ¼ wwk þ Kk*jk*; ð2:10Þ
Pkþ1 ¼ Pk � Kk*ðHk*ÞT Pk þ Qk : ð2:11Þ
Note that this rescaling does not change the evolution of either the weight
vector or the approximate error covariance matrix, and eliminates the need
1This may occur when we utilize penalty functions to impose explicit constraints on
network outputs. For example, when a constraint is not violated, we set the corresponding
diagonal element of Sk to zero, thereby rendering the matrix singular.
2.3 THE EKF PROCEDURE 31

to compute the inverse of the weighting matrix Sk for each training
pattern. For the sake of clarity in the remainder of this chapter, we shall
assume a uniform scaling of output signals, Sk ¼ I, which implies
Rk ¼ Z�1k I, and drop the asterisk notation.
2.3.3 Parameter Settings
EKF training algorithms require the setting of a number of parameters. In
practice, we have employed the following rough guidelines. First, we
typically assume that the input–output data have been scaled and trans-
formed to reasonable ranges (e.g., zero mean, unit variance for all
continuous input and output variables). We also assume that weight
values are initialized to small random values drawn from a zero-mean
uniform or normal distribution. The approximate error covariance matrix
is initialized to reflect the fact that no a priori knowledge was used to
initialize the weights; this is accomplished by setting P0 ¼ E�1I, where E is
a small number (of the order of 0.001–0.01). As noted above, we assume
uniform scaling of outputs: Sk ¼ I. Then, training data that are character-
ized by noisy measurements usually require small values for the learning
rate Zk to achieve good training performance; we typically bound the
learning rate to values between 0.001 and 1. Finally, the covariance matrix
Qk of the process noise is represented by a scaled identity matrix qkI, with
the scale factor qk ranging from as small as zero (to represent no process
noise) to values of the order of 0.1. This factor is generally annealed from
a large value to a limiting value of the order of 10�6. This annealing
process helps to accelerate convergence and, by keeping a nonzero value
for the process noise term, helps to avoid divergence of the error
covariance update in Eqs. (2.6) and (2.11).
We show here that the setting of the learning rate, the process noise
covariance matrix, and the initialization of the approximate error covar-
iance matrix are interdependent, and that an arbitrary scaling can be
applied to Rk , Pk , and Qk without altering the evolution of the weight
vector ww in Eqs. (2.5) and (2.10). First consider the Kalman gain of Eqs.
(2.4) and (2.9). An arbitrary positive scaling factor m can be applied to Rk
and Pk without altering the contents of Kk :
Kk ¼ PkHk ½Rk þ HTk PkHk �
�1
¼ mPkHk ½mRk þ HTk mPkHk �
�1
¼ Py
kHk ½Ry
k þ HTk P
y
kHk ��1
¼ Py
kHkAy
k;
32 2 PARAMETER-BASED KALMAN FILTER TRAINING

where we have defined Ry
k ¼ mRk, Py
k ¼ mPk , and Ay
k ¼ m�1Ak . Similarly,
the approximate error covariance update becomes
Py
kþ1 ¼ mPkþ1
¼ mPk � KkHTk mPk þ mQk
¼ Py
k � KkHTk P
y
k þ Qy
k :
This implies that a training trial characterized by the parameter settings
Rk ¼ Z�1I, P0 ¼ E�1I, and Qk ¼ qI, would behave identically to a
training trial with scaled versions of these parameter settings: Rk ¼
mZ�1I, P0 ¼ mE�1I, and Qk ¼ mqI. Thus, for any given EKF training
problem, there is no one best set of parameter settings, but a continuum of
related settings that must take into account the properties of the training
data for good performance. This also implies that only two effective
parameters need to be set. Regardless of the training problem considered,
we have typically chosen the initial error covariance matrix to be
P0 ¼ E�1I, with E ¼ 0:01 and 0.001 for sigmoidal and linear activation
functions, respectively. This leaves us to specify values for Zk and Qk,
which are likely to be problem-dependent.
2.4 DECOUPLED EKF (DEKF)
The computational requirements of GEKF are dominated by the need to
store and update the approximate error covariance matrix Pk at each time
step. For a network architecture with No outputs and M weights, GEKF’s
computational complexity is OðNoM2Þ and its storage requirements are
OðM2Þ. The parameter-based DEKF algorithm is derived from GEKF by
assuming that the interactions between certain weight estimates can be
ignored. This simplification introduces many zeroes into the matrix Pk . If
the weights are decoupled so that the weight groups are mutually exclusive
of one another, then Pk can be arranged into block-diagonal form. Let g
refer to the number of such weight groups. Then, for group i, the vector wwik
refers to the estimated weight parameters, Hik is the submatrix of
derivatives of network outputs with respect to the ith group’s weights,
Pik is the weight group’s approximate error covariance matrix, and Ki
k is its
Kalman gain matrix. The concatenation of the vectors wwik forms the vector
wwk . Similarly, the global derivative matrix Hk is composed via concatena-
2.4 DECOUPLED EKF (DEKF) 33

tion of the individual submatrices Hik . The DEKF algorithm for the ith
weight group is given by
Ak ¼ Rk þPgj¼1
ðHjkÞ
T PjkH
jk
" #�1
; ð2:12Þ
Kik ¼ Pi
kHikAk; ð2:13Þ
wwikþ1 ¼ wwi
k þ Kikjk; ð2:14Þ
Pikþ1 ¼ Pi
k � KikðH
ikÞ
T Pik þ Qi
k : ð2:15Þ
A single global sealing matrix Ak , computed with contributions from all of
the approximate error covariance matrices and derivative matrices, is used
to compute the Kalman gain matrices, Kik . These gain matrices are used to
update the error covariance matrices for all weight groups, and are
combined with the global error vector jk for updating the weight vectors.
In the limit of a single weight group (g ¼ 1), the DEKF algorithm reduces
exactly to the GEKF algorithm.
The computational complexity and storage requirements for DEKF can
be significantly less than those of GEKF. For g disjoint weight groups, the
computational complexity of DEKF becomes OðN2o M þ No
Pgi¼1 M2
i Þ,
where Mi is the number of weights in group i, while the storage
requirements become OðPg
i¼1 M2i Þ. Note that this complexity analysis
does not include the computational requirements for the matrix of
derivatives, which is independent of the level of decoupling. It should
be noted that in the case of training recurrent networks or networks as
feedback controllers, the computational complexity of the derivative
calculations can be significant.
We have found that decoupling of the weights of the network by node
(i.e., each weight group is composed of a single node’s weight) is rather
natural and leads to compact and efficient computer implementations.
Furthermore, this level of decoupling typically exhibits substantial compu-
tational savings relative to GEKF, often with little sacrifice in network
performance after completion of training. We refer to this level of
decoupling as node-decoupled EKF or NDEKF. Other forms of decoupl-
ing considered have been fully decoupled EKF, in which each individual
weight constitutes a unique group (thereby resulting in an error covariance
matrix that has diagonal structure), and layer-decoupled EKF, in which
weights are grouped by the layer to which they belong [13]. We show an
example of the effect of all four levels of decoupling on the structure of
34 2 PARAMETER-BASED KALMAN FILTER TRAINING

the approximate error covariance matrix in Figure 2.5. For the remainder
of this chapter, we explicitly consider only two different levels of
decoupling for EKF training: global and node-decoupled EKF.
2.5 MULTISTREAM TRAINING
Up to this point, we have considered forms of EKF training in which a
single weight-vector update is performed on the basis of the presentation
of a single input–output training pattern. However, there may be situations
for which a coordinated weight update, on the basis of multiple training
Figure 2.5 Block-diagonal representation of the approximate error covar-iance matrix Pk for the RMLP network shown in Figure 2.3 for four differentlevels of decoupling. This network has two recurrent layers with three nodeseach and each node with seven incoming connections. The output layer isalso recurrent, but its two nodes only have six connections each. Only theshaded portions of these matrices are updated and maintained for thevarious forms of decoupling shown. Note that we achieve a reduction bynearly a factor of 8 in computational complexity for the case of nodedecoupling relative to GEKF in this example.
2.5 MULTISTREAM TRAINING 35

patterns, would be advantageous. We consider in this section an abstract
example of such a situation, and describe the means by which the EKF
method can be naturally extended to simultaneously handle multiple
training instances for a single weight update.2
Consider the standard recurrent network training problem: training on a
sequence of input–output pairs. If the sequence is in some sense homo-
geneous, then one or more linear passes through the data may well
produce good results. However, in many training problems, especially
those in which external inputs are present, the data sequence is hetero-
geneous. For example, regions of rapid variation of inputs and outputs
may be followed by regions of slow change. Alternatively, a sequence of
outputs that centers about one level may be followed by one that centers
about a different level. In any case, the tendency always exists in a
straightforward training process for the network weights to be adapted
unduly in favor of the currently presented training data. This recency effect
is analogous to the difficulty that may arise in training feedforward
networks if the data are repeatedly presented in the same order.
In this latter case, an effective solution is to scramble the order of
presentation; another is to use a batch update algorithm. For recurrent
networks, the direct analog of scrambling the presentation order is to
present randomly selected subsequences, making an update only for the
last input–output pair of the subsequence (when the network would be
expected to be independent of its initialization at the beginning of the
sequence). A full batch update would involve running the network through
the entire data set, computing the required derivatives that correspond to
each input–output pair, and making an update based on the entire set of
errors.
The multistream procedure largely circumvents the recency effect by
combining features of both scrambling and batch updates. Like full batch
methods, multistream training [10–12] is based on the principle that each
weight update should attempt to satisfy simultaneously the demands from
multiple input–output pairs. However, it retains the useful stochastic
aspects of sequential updating, and requires much less computation time
between updates. We now describe the mechanics of multistream training.
2In the case of purely linear systems, there is no advantage in batching up a collection of
training instances for a single weight update via Kalman filter methods, since all weight
updates are completely consistent with previously observed data. On the other hand,
derivative calculations and the extended Kalman recursion for nonlinear networks utilize
first-order approximations, so that weight updates are no longer guaranteed to be consistent
with all previously processed data.
36 2 PARAMETER-BASED KALMAN FILTER TRAINING

In a typical training problem, we deal with one or more files, each of
which contains a sequence of data. Breaking the overall data into multiple
files is typical in practical problems, where the data may be acquired in
different sessions, for distinct modes of system operation, or under
different operating conditions.
In each cycle of training, we choose a specified number Ns of randomly
selected starting points in a chosen set of files. Each such starting point is
the beginning of a stream. In the multistream procedure we progress
sequentially through each stream, carrying out weight updates according
to the set of current points. Copies of recurrent node outputs must be
maintained separately for each stream. Derivatives are also computed
separately for each stream, generally by truncated backpropagation
through time (BPTT(h)) as discussed in Section 2.6.1 below. Because
we generally have no prior information with which to initialize the
recurrent network, we typically set all state nodes to values of zero at
the start of each stream. Accordingly, the network is executed but updates
are suspended for a specified number Np of time steps, called the priming
length, at the beginning of each stream. Updates are performed until a
specified number Nt of time steps, called the trajectory length, have been
processed. Hence, Nt � Np updates are performed in each training cycle.
If we take Ns ¼ 1 and Nt � Np ¼ 1, we recover the order-scrambling
procedure described above; Nt may be identified with the subsequence
length. On the other hand, we recover the batch procedure if we take Ns
equal to the number of time steps for which updates are to be performed,
assemble streams systematically to end at the chosen Ns steps, and again
take Nt � Np ¼ 1.
Generally speaking, apart from the computational overhead involved,
we find that performance tends to improve as the number of streams is
increased. Various strategies are possible for file selection. If the number
of files is small, it is convenient to choose Ns equal to a multiple of the
number of files and to select each file the same number of times. If the
number of files is too large to make this practical, then we tend to select
files randomly. In this case, each set of Nt � Np updates is based on only a
subset of the files, so it seems reasonable not to make the trajectory length
Nt too large.
An important consideration is how to carry out the EKF update
procedure. If gradient updates were being used, we would simply average
the updates that would have been performed had the streams been treated
separately. In the case of EKF training, however, averaging separate
updates is incorrect. Instead, we treat this problem as that of training a
single, shared-weight network with NoNs outputs. From the standpoint of
2.5 MULTISTREAM TRAINING 37

the EKF method, we are simply training a multiple-output network in
which the number of original outputs is multiplied by the number of
streams. The nature of the Kalman recursion, because of the global scaling
matrix Ak , is then to produce weight updates that are not a simple average
of the weight updates that would be computed separately for each output,
as is the case for a simple gradient descent weight update. Note that we are
still minimizing the same sum of squared error cost function.
In single-stream EKF training, we place derivatives of network outputs
with respect to network weights in the matrix Hk constructed from No
column vectors, each of dimension equal to the number of trainable
weights, Nw. In multistream training, the number of columns is corre-
spondingly increased to NoNs. Similarly, the vector of errors jk has NoNs
elements. Apart from these augmentations of Hk and jk, the form of the
Kalman recursion is unchanged.
Given these considerations, we define the decoupled multistream EKF
recursion as follows. We shall alter the temporal indexing by specifying a
range of training patterns that indicate how the multi-stream recursion
should be interpreted. We define l ¼ k þ Ns � 1 and allow the range k : l
to specify the batch of training patterns for which a single weight vector
update will be performed. Then, the matrix Hik: l is the concatenation of
the derivative matrices for the ith group of weights and for training
patterns that have been assigned to the range k : l. Similarly, the augmen-
ted error vector is denoted by j k: l . We construct the derivative matrices
and error vector, respectively, by
H k: l ¼ ðHkHkþ1Hkþ2 Hl�1HlÞ;
j k: l ¼ ðjTk j
Tkþ1j
Tkþ2 j
Tl�1j
Tl Þ
T :
We use a similar notation for the measurement error covariance matrix
R k: l and the global scaling matrix A k: l, both square matrices of dimension
NoNs, and for the Kalman gain matrices Kik: l, with size Mi � NoNs. The
multistream DEKF recursion is then given by
A k: l ¼ R k: l þPgj¼1
ðHjk: lÞ
T PjkH
jk: l
" #�1
; ð2:16Þ
Kik: l ¼ Pi
kHik: lA k: l; ð2:17Þ
wwikþNs
¼ wwik þ Ki
k: lj k: l; ð2:18Þ
PikþNs
¼ Pik � Ki
k: lðHik: lÞ
T Pik þ Qi
k : ð2:19Þ
38 2 PARAMETER-BASED KALMAN FILTER TRAINING

Note that this formulation reduces correctly to the original DEKF
recursion in the limit of a single stream, and that multistream GEKF is
given in the case of a single weight group. We provide a block diagram
representation of the multistream GEKF procedure in Figure 2.6. Note that
the steps of training are very similar to the single-stream case, with the
exception of multiple forward-propagation and backpropagation steps, and
the concatenation operations for the derivative matrices and error vectors.
Let us consider the computational implications of the multistream
method. The sizes of the approximate error covariance matrices Pik and
the weight vectors wik are independent of the chosen number of streams.
On the other hand, we noted above the increase in size for the derivative
matrices Hik: l, as well as of the Kalman gain matrices Ki
k: l. However, the
computation required to obtain Hik: l and to compute updates to Pi
k is the
same as for Ns separate updates. The major additional computational
burden is the inversion required to obtain the matrix A k: l whose dimen-
sion is Ns times larger than in the single-stream case. Even this cost tends
to be small compared with that associated with the Pik matrices, as long as
Figure 2.6 Signal flow diagram for multistream EKF neural network training.The first two steps are comprised of multiple forward- and backpropagationoperations, determined by the number of streams Ns selected; these stepsalso depend on whether or not the network being trained has recurrentconnections. On the other hand, once the derivative matrix H k : l and errorvector j k : l are formed, the EKF steps encoded by steps (3)–(5) are inde-pendent of number of streams and network type.
2.5 MULTISTREAM TRAINING 39

NoNs is smaller than the number of network weights (GEKF) or the
maximum number of weights in a group (DEKF).
If the number of streams chosen is so large as to make the inversion of
A k: l impractical, the inversion may be avoided by using one of the
alternative EKF formulations described below in Section 2.6.3.
2.5.1 Some Insight into the Multistream Technique
A simple means of motivating how multiple training instances can be used
simultaneously for a single weight update via the EKF procedure is to
consider the training of a single linear node. In this case, the application of
EKF training is equivalent to that of the recursive least-squares (RLS)
algorithm. Assume that a training data set is represented by m unique
training patterns. The kth training pattern is represented by a d-dimen-
sional input vector uk, where we assume that all input vectors include a
constant bias component of value equal to 1, and a 1-dimensional output
target yk . The simple linear model for this system is given by
yyk ¼ uTk wf ; ð2:20Þ
where wf is the single node’s d-dimensional weight vector. The weight
vector wf can be found by applying m iterations of the RLS procedure as
follows:
ak ¼ ½1 þ uTk Pkuk �
�1; ð2:21Þ
kk ¼ Pkukak; ð2:22Þ
wkþ1 ¼ wk þ kkðyk � yykÞ; ð2:23Þ
Pkþ1 ¼ Pk � kkuTk Pk; ð2:24Þ
where the diagonal elements of P0 are initialized to large positive values,
and w0 to a vector of small random values. Also, wf ¼ wm after a single
presentation of all training data (i.e., after a single epoch).
We recover a batch, least-squares solution to this single-node training
problem via an extreme application of the multistream concept, where we
associate m unique streams with each of the m training instances. In this
case, we arrange the input vectors into a matrix U of size d � m, where
each column corresponds to a unique training pattern. Similarly, we
arrange the target values into a single m-dimensional column vector y,
40 2 PARAMETER-BASED KALMAN FILTER TRAINING

where elements of y are ordered identically with the matrix U. As before,
we select the initial weight vector w0 to consist of randomly chosen
values, and we select P0 ¼ E�1I, with E small. Given the choice of initial
weight vector, we can compute the network output for each training
pattern, and arrange all the results using the matrix notation
yy0 ¼ UT w0: ð2:25Þ
A single weight update step of the Kalman filter recursion applied to this
m-dimensional output problem at the beginning of training can be written
as
A0 ¼ ½I þ UT P0U��1; ð2:26Þ
K0 ¼ P0UA0; ð2:27Þ
w1 ¼ w0 þ K0ðy � yy0Þ; ð2:28Þ
where we have chosen not to include the error covariance update here for
reasons that will soon become clear. At the beginning of training, we
recognize that P0 is large, and we assume that the training data set is
scaled so that UT P0U � I. This allows A0 to be approximated by
A0 E½EI þ UT U��1; ð2:29Þ
since P0 is diagonal. Given this approximation, we can write the Kalman
gain matrix as
K0 ¼ U½EI þ UT U��1: ð2:30Þ
We now substitute Eqs. (2.25) and (2.30) into Eq. (2.28) to derive the
weight vector after one time step of this m-stream Kalman filter procedure:
w1 ¼ w0 þ U½EI þ UT U��1½y � UT w0�
¼ w0 � U½EI þ UT U��1UT w0 þ U½EI þ UT U�
�1y: ð2:31Þ
If we apply the matrix equality limE!0 U½EI þ UT U��1UT ¼ I , we obtain
the pseudoinverse solution:
wf ¼ w1 ¼ ½UUT ��1Uy; ð2:32Þ
2.5 MULTISTREAM TRAINING 41

where we have made use of
limE!0
U½EI þ UT U��1UT ¼ I; ð2:33Þ
limE!0
U½EI þ UT U��1UT ¼ ½UUT �
�1UUT ; ð2:34Þ
limE!0
U½EI þ UT U��1
¼ ½UUT ��1U: ð2:35Þ
Thus, one step of the multistream Kalman recursion recovers very
closely the least-squares solution. If m is too large to make the inversion
operation practical, we could instead divide the problem into subsets and
perform the procedure sequentially for each subset, arriving eventually at
nearly the same result (in this case, however, the covariance update needs
to be performed).
As illustrated in this one-node example, the multistream EKF update is
not an average of the individual updates, but rather is coordinated through
the global scaling matrix A. It is intuitively clear that this coordination is
most valuable when the various streams place contrasting demands on the
network.
2.5.2 Advantages and Extensions of Multistream Training
Discussions of the training of networks with external recurrence often
distinguish between series–parallel and parallel configurations. In the
former, target values are substituted for the corresponding network outputs
during the training process. This scheme, which is also known as teacher
forcing, helps the network to get ‘‘on track’’ and stay there during training.
Unfortunately, it may also compromise the performance of the network
when, in use, it must depend on its own output. Hence, it is not uncommon
to begin with the series–parallel configuration, then switch to the parallel
configuration as the network learns the task. Multistream training seems to
lessen the need for the series–parallel scheme; the response of the training
process to the demands of multiple streams tends to keep the network from
getting too far off-track. In this respect, multistream training seems
particularly well suited for training networks with internal recurrence
(e.g., recurrent multilayered perceptrons), where the opportunity to use
teacher forcing is limited, because correct values for most if not all outputs
of recurrent nodes are unknown.
Though our presentation has concentrated on multistreaming simply as
an enhanced training technique, one can also exploit the fact that the
42 2 PARAMETER-BASED KALMAN FILTER TRAINING

streams used to provide input–output data need not arise homogeneously,
that is, from the same training task. Indeed, we have demonstrated that a
single fixed-weight, recurrent neural network, trained by multistream EKF,
can carry out multiple tasks in a control context, namely, to act as a
stabilizing controller for multiple distinct and unrelated systems, without
explicit knowledge of system identity [14]. This work demonstrated that
the trained network was capable of exhibiting what could be considered to
be adaptive behavior: the network, acting as a controller, observed the
behavior of the system (through the system’s output), implicitly identified
which system the network was being subjected to, and then took actions to
stabilize the system. We view this somewhat unexpected behavior as being
the direct result of combining an effective training procedure with
enabling representational capabilities that recurrent networks provide.
2.6 COMPUTATIONAL CONSIDERATIONS
We discuss here a number of topics related to implementation of the
various EKF training procedures from a computational perspective. In
particular, we consider issues related to computation of derivatives that are
critical to the EKF methods, followed by discussions of computationally
efficient formulations, methods for avoiding matrix inversions, and the
use of square-root filtering as an alternative means of insuring stable
performance.
2.6.1 Derivative Calculations
We discussed above both the global and decoupled versions of the EKF
algorithm, where we consider the global EKF to be a limiting form of
decoupled EKF (i.e., DEKF with a single weight group). In addition, we
have described the multistream EKF procedure as a means of batching
training instances, and have noted that multistreaming can be used with
any form of decoupled EKF training, for both feedforward and recurrent
networks. The various EKF procedures can all be compactly described by
the DEKF recursion of Eqs. (2.12)–(2.15), where we have assumed that
the derivative matrices Hik are given. However, the implications for
computationally efficient and clear implementations of the various forms
of EKF training depend upon the derivative calculations, which are
dictated by whether a network architecture is static or dynamic (i.e.,
feedforward or recurrent), and whether or not multistreaming is used. Here
2.6 COMPUTATIONAL CONSIDERATIONS 43

we provide insight into the nature of derivative calculations for training of
both static and dynamic networks with EKF methods (see [12] for
implementation details).
We assume the convention that a network’s weights are organized by
node, regardless of the degree of decoupling, which allows us to naturally
partition the matrix of derivatives of network outputs with respect to
weight parameters, Hk , into a set of G submatrices Hik , where G is the
number of nodes of the network. Then, each matrix Hik denotes the matrix
of derivatives of network outputs with respect to the weights associated
with the ith node of the network. For feedforward networks, these
submatrices can be written as the outer product of two vectors [3],
Hik ¼ ui
kðcikÞ
T ;
where uik is the ith node’s input vector and ci
k is a vector of partial
derivatives of the network’s outputs with respect to the ith node’s net input,
defined as the dot product of the weight vector wik with the corresponding
input vector uik. Note that the vectors ci
k are computed via the back-
propagation process, where the dimension of each of these vectors is
determined by the number of network outputs. In contrast to the standard
backpropagation algorithm, which begins the derivative calculation
process (i.e., backpropagation) with error signals for each of the network’s
outputs, and effectively combines these error signals (for multiple-output
problems) during the backpropagation process, the EKF methods begin
the process with signals of unity for each network output and back-
propagate a separate signal for each unique network output.
In the case of recurrent networks, we assume the use of truncated
backpropagation through time for calculation of derivatives, with a
truncation depth of h steps; this process is denoted by BPTT(h). Now,
each submatrix Hik can no longer be expressed as a simple outer product
of two vectors; rather, each of these submatrices is expressed as the sum of
a series of outer products:
Hik ¼
Phj¼1
Hi;jk ¼
Phj¼1
ui;jk ðc
i;jk Þ
T ;
where the matrix Hi;jk is the contribution from the jth step of back-
propagation to the computation of the total derivative matrix for the ith
node; the vector ui;jk is the vector of inputs to the ith node at the jth step of
backpropagation; and ci;jk is the vector of backpropagated derivatives of
44 2 PARAMETER-BASED KALMAN FILTER TRAINING

network outputs with respect to the ith node’s net input at the jth step of
backpropagation. Here, we have chosen arbitrarily to have j increase as we
step back in time.
Finally, consider multi-stream training, where we assume that the
training problem involves a recurrent network architecture, with deriva-
tives computed by BPTT(h) (feedforward networks are subsumed by the
case of h ¼ 1). We again assume an No-component cost function with Ns
streams, and define l ¼ k þ Ns � 1. Then, each submatrix Hik: l becomes a
concatenation of a series of submatrices, each of which is expressed as the
sum of a series of outer products:
Hik: l ¼
Phj¼1
Hi;j;1k
Phj¼1
Hi;j;2k
Phj¼1
Hi;j;Ns
k
" #ð2:36Þ
¼Phj¼1
ui;j;1k ðci;j;1
k ÞT Ph
j¼1
ui;j;2k ðci;j;2
k ÞT Phj¼1
ui;j;Ns
k ðci;j;Ns
k ÞT
" #: ð2:37Þ
Here we have expressed each submatrix Hik: l as an Mi � ðNoNsÞ matrix,
where Mi is the number of weights corresponding to the networks ith
node. The submatrices Hi;j;mk are of size Mi � No, corresponding to a
single training stream. For purposes of a compact representation, we
express each matrix Hik: l as a sum of matrices (as opposed to a
concatenation) by forming vectors Ci;j;mk from the vectors ci;j;m
k in the
following fashion. The vector Ci;j;mk is of length NoNs with components
set to zero everywhere except for in the mth (out of Ns) block of length No,
where this subvector is set equal to the vector ci;j;mk . Then,
Hik: l ¼
Phj¼1
PNs
m¼1
ui;j;mk ðCi;j;m
k ÞT :
Note that the matrix is expressed in this fashion for notational convenience
and consistency, and that we would make use of the sparse nature of the
vector Ci;j;mk in implementation.
2.6.2 Computationally Efficient Formulations forMultiple-Output Problems
We now consider implications for the computational complexity of EKF
training due to expressing the derivative calculations as a series of vector
2.6 COMPUTATIONAL CONSIDERATIONS 45

outer products as shown above. We consider the simple case of feed-
forward networks trained by node-decoupled EKF (NDEKF) in which
each node’s weights comprise a unique group for purposes of the error
covariance update. The NDEKF recursion can then be written as
Ak ¼ Rk þPGj¼1
a jkc
jkðc
jkÞ
T
" #�1
; ð2:38Þ
Kik ¼ vi
kðgikÞ
T ; ð2:39Þ
wwikþ1 ¼ wwi
k þ ½ðcikÞ
TðAkjkÞ�v
ik; ð2:40Þ
Pikþ1 ¼ Pi
k � bikvi
kðvikÞ
Tþ Qi
k; ð2:41Þ
where we have used the following equations in intermediate steps:
vik ¼ Pi
kuik; ð2:42Þ
gik ¼ Akc
ik; ð2:43Þ
aik ¼ ðui
kÞT vi
k; ð2:44Þ
bik ¼ ðgi
kÞTci
k : ð2:45Þ
Based upon this partitioning of the derivative matrix Hk , we find that the
computational complexity of NDEKF is reduced from OðN2o Mþ
No
PGi¼1 M2
i Þ to OðN2o G þ
PGi¼1 M2
i Þ, indicating a distinct advantage for
feedforward networks with multiple output nodes. On the other hand, the
partitioning of the derivative matrix does not provide any computational
advantage for GEKF training of feedforward networks.
2.6.3 Avoiding Matrix Inversions
A complicating factor for effective implementation of EKF training
schemes is the need to perform matrix inversions for those problems
with multiple cost function components. We typically perform these types
of calculations with matrix inversion routines based on singular-value
decomposition [15]. Although these techniques have served us well over
the years, we recognize that this often discourages ‘‘quick-and-dirty’’
implementations and may pose a large obstacle to hardware implementa-
tion.
Two classes of methods have been developed that allow EKF training to
be performed for multiple-output problems without explicitly resorting to
matrix inversion routines. The first class [16] depends on the partitioning
46 2 PARAMETER-BASED KALMAN FILTER TRAINING

of the derivative matrices described above. This method computes the
global scaling matrix Ak by recursively applying the matrix inversion
lemma. This procedure provides results that are mathematically identical
to conventional matrix inversion procedures, regardless of the degree of
decoupling employed. In addition, it can be employed for training of any
form of network, static or dynamic, as well as for the multistream
procedure. On the other hand, we have found that this method often
requires the use of double-precision arithmetic to produce results that are
statistically identical to EKF implementations based on explicit matrix
inversion methods.
The second class, developed by Plumer [17], treats each output
component individually in an iterative procedure. This sequential update
procedure accumulates the weight vector update as each output compo-
nent is processed, and only applies the weight vector update after all
output signals have been processed. The error covariance matrix is
updated in a sequential fashion. Plumer’s sequential-update form of
EKF turns out to be exactly equivalent to the batch form of GFKF
given above in which all output signals are processed simultaneously.
However, for decoupled EKF training, it turns out that sequential updates
only approximate the updates obtained via the simultaneous DEKF
recursion of Eqs. (2.12)–(2.15), though this has been reported to not
pose any problems during training.
The sequential DEKF method is compactly given by a set of equations
that are similar to the simultaneous DEKF equations. We again assume a
decoupling with g mutually exclusive groups of weights, with a limit of
g ¼ 1 reducing to the global version, and use the superscript i to refer to
the individual weight groups. We handle the multistream case by labeling
each cost function component from l ¼ 1 to NoNs, where No and Ns refer
to the number of network outputs and number of processing streams,
respectively. A single weight vector update with the sequential multi-
stream DEKF procedure requires an initialization step of Dwwik;0 ¼ 0 and
Pik;0 ¼ Pi
k , where Dwwik;l is used to accumulate the update to the weight
vector. Then, the sequential multistream DEKF procedure is compactly
represented by the following equations:
ak;l ¼ rk;l þPgj¼1
ðhik;lÞ
T Pik;l�1hi
k;l
" #�1
; ð2:46Þ
kik;l ¼ Pi
k;l�1hik;lak;l; ð2:47Þ
Dwwik;l ¼ Dwwi
k;l�1 þ kik;lxk;l � ki
k;l½ðhik;lÞ
TDwwik;l�1�; ð2:48Þ
Pik;l ¼ Pi
k;l�1 � kik;lðh
ik;lÞ
T Pik;l�1: ð2:49Þ
2.6 COMPUTATIONAL CONSIDERATIONS 47

Note that the scalar rk;l is the lth diagonal element of the measurement
covariance matrix Rk in the simultaneous form of DEKF, that the scalar
xk;l is the lth error signal, and that the vector hik;l is the lth column of the
augmented derivative matrix Hik . After all output signals of all training
streams have been processed, the weight vectors and error covariance
matrices for all weight groups are updated by
wwikþ1 ¼ wwi
k þ Dwwik;NoNs
; ð2:50Þ
Pikþ1 ¼ Pi
k;NoNsþ Qi
k : ð2:51Þ
Structurally, these equations for sequential updates are nearly identical to
those of the simultaneous update, with the exception of an additional
correction term in the delta-weight update equation; this term is necessary
to account for the fact that the weight estimate changes at each step of this
sequential multiple-output recursion.
2.6.4 Square-Root Filtering
2.6.4.1 Without Artificial Process Noise Sun and Marko [18] have
described the use of square-root filtering as a numerically stable, alternative
method to performing the approximate error covariance matrix update
given by the Riccati equation (2.6). The square-root filter methods are well
known in the signal processing community [19], and were developed so as
to guarantee that the positive-definiteness of the matrix is maintained
throughout training. However, this insurance is accompanied by increased
computational complexity. Below, we summarize the square-root formula-
tion for the case of no artificial process noise, with proper treatment of the
EKF learning rate as given in Eq. (2.7) (we again assume Sk ¼ IÞ.
The square-root covariance filter update is based on the matrix
factorization lemma, which states that for any pair of J � K matrices
B1 and B2, with J � K, the relation B1B1T ¼ B2B2
T holds if and only if
there exists a unitary matrix Y such that B2 ¼ B1Y. With this in mind, the
covariance update equations (2.3) and (2.6) can be written in matrix
form as
R1=2k HT
k P1=2k
0 P1=2k
" #R
1=2k 0
P1=2k Hk P
1=2k
" #
¼A
�1=2k 0
PkHkA1=2k P
1=2kþ1
" #A
�1=2k A
1=2k HT
k Pk
0 P1=2kþ1
" #: ð2:52Þ
48 2 PARAMETER-BASED KALMAN FILTER TRAINING

Now, the idea is to find a unitary transformation Y such that
A�1=2k 0
PkHkA1=2k P
1=2kþ1
" #¼
R1=2k HT
k P1=2k
0 P1=2k
" #Y: ð2:53Þ
This is easily accomplished by applying a series of 2 � 2 Givens rota-
tions to annihilate the elements of the submatrix HTk P
1=2k , thereby yielding
the left-hand-side matrix. Given this result of the square-root filtering
procedure, we can perform the network weight update via the following
additional steps: (1) compute A1=2k by inverting A
�1=2k ; (2) compute the
Kalman gain matrix by Kk ¼ ðPkHkA1=2k ÞA
1=2k ; (3) perform the weight
update via Eq. (2.5).
2.6.4.2 With Artificial Noise In our original work [3] on EKF-based
training, we introduced the use of artificial process noise as a simple and
easily controlled mechanism to help assure that the approximate error
covariance matrix Pk would retain the necessary property of nonnegative-
definiteness, thereby allowing us to avoid the more computationally
complicated square-root formulations. In addition to controlling the
proper evolution of Pk , we have also found that artificial process noise,
when carefully applied, helps to accelerate the training process and, more
importantly, leads to solutions superior to those found without artificial
process noise. We emphasize that the use of artificial process noise is not
ad hoc, but appears due to the process noise term in Eq. (2.1) (i.e., the
covariance matrix Qk in Eq. (2.6) disappears only when vk ¼ 0 for all k).
We have continued to use this feature in our implementations as an
effective means for escaping poor local minima, and have not experienced
problems with divergence. Other researchers with independent implemen-
tations of various forms of EKF [13, 17, 20] for neural network training
have also found the use of artificial process noise to be beneficial.
Furthermore, other gradient-based training algorithms have effectively
exploited weight noise (e.g., see [21]).
We now demonstrate that the square-root filtering formulation of Eq.
(2.53) is easily extended to include artificial process noise, and that the use
of artificial process noise and square-root filtering are not mutually
exclusive. Again, we wish to express the error covariance update in a
2.6 COMPUTATIONAL CONSIDERATIONS 49
factorized form, but we now augment the left-hand-side of Eq. (2.52) to
include the square root of the process-noise covariance matrix:
Rk þ HTk PkHk HT
k Pk
PkHk Pk þ Qk
" #
¼R
1=2k HT
k P1=2k 0
0 P1=2k Q
1=2k
" # R1=2k 0
P1=2k Hk P
1=2k
0 Q1=2k
2664
3775:
ð2:54Þ
Similarly, the right-hand side of Eq. (2.52) is augmented by blocks of
zeroes, so that the matrices are of the same size as those of the right-hand
side of Eq. (2.54):
A�1k HT
k Pk
PkHk Pkþ1 þ PkHkAkHTk Pk
" #
¼A
�1=2k 0 0
PkHkA1=2k P
1=2kþ1 0
" # A1=2k A
1=2k HT
k Pk
0 P1=2kþ1
0 0
264
375: ð2:55Þ
Here, Eqs. (2.54) and (2.55) are equivalent to one another, and Eq. (2.53)
is appropriately modified to
A1=2k 0 0
PkHkA1=2k P
1=2kþ1 0
" #¼
R1=2k HT
k P1=2k 0
0 P1=2k Q
1=2k
" #Y: ð2:56Þ
Thus, square-root filtering can easily accommodate the artificial process-
noise extension, where the matrices HTk P
1=2k and Q
1=2k are both annihilated
via a sequence of Givens rotations. Note that this extension involves
substantial additional computational costs beyond those incurred when
Qk ¼ 0. For a network with M weights and No outputs, the use of artificial
process noise introduces OðM3Þ additional computations for the annihila-
tion of Q1=2k , whereas the annihilation of the matrix HT
k P1=2k only involves
OðM2NoÞ computations (here we assume M �MoÞ.
50 2 PARAMETER-BASED KALMAN FILTER TRAINING

2.7 OTHER EXTENSIONS AND ENHANCEMENTS
2.7.1 EKF Training with Constrained Weights
Due to the second-order properties of the EKF training procedure, we
have observed that, for certain problems, networks trained by EKF tend to
develop large weight values (e.g., between 10 and 100 in magnitude). We
view this capability as a double-edged sword: on the one hand, some
problems may require that large weight values be developed, and the EKF
procedures are effective at finding solutions for these problems. On the
other hand, trained networks may need to be deployed with execution
performed in fixed-point arithmetic, which requires that limits be imposed
on the range of values of network inputs, outputs and weights. For
nonlinear sigmoidal nodes, the node outputs are usually limited to
values between �1 and þ1, and input signals can usually be linearly
transformed so that they fall within this range. On the other hand, the EKF
procedures as described above place no limit on the weight values. We
describe here a natural mechanism, imposed during training, that limits the
range of weight values. In addition to allowing for fixed-point deployment
of trained networks, this weight-limiting mechanism may also promote
better network generalization.
We wish to set constraints on weight values during the training process
while maintaining rigorous consistency with the EKF recursion. We can
accomplish this by converting the unconstrained nonlinear optimization
problem into one of optimization with constraints. The general idea is to
treat each of the network’s weight values as the output of a monotonically
increasing function fðÞ with saturating limits at the function’s extremes
(e.g., a sigmoid function). Thus, the EKF recursion is performed in an
unconstrained space, while the network’s weight values are nonlinear
transformations of the corresponding unconstrained values that evolve
during the training process. This transformation requires that the
EKF recursion be modified to take into account the function fðÞ as
applied to the parameters (i.e., unconstrained weight values) that evolve
during training.
Assume that the vector of network’s weights wk is constrained to take
on values in the range �a to þa and that each component wi;jk (the jth
weight of the ith node) of the constrained weight vector is related to an
unconstrained value ~wwi;jk via a function w
i;jk ¼ fð ~wwi;j
k ; aÞ. We formulate the
EKF recursion so that weight updates are performed in the unconstrained
weight space, while the steps of forward propagation and backpropagation
of derivatives are performed in the constrained weight space.
2.7 OTHER EXTENSIONS AND ENHANCEMENTS 51

The training steps are carried out as follows. At time step k, an input
vector is propagated through the network, and the network outputs are
computed and stored in the vector yyk. The error vector jk is also formed as
defined above. Subsequently, the derivatives of each component of yyk with
respect to each node’s weight vector wik are computed and stored into the
matrices Hik , where the component H
i;j;lk contains the derivative of the lth
component of yyk with respect to the jth weight of the ith node. In order to
perform the EKF recursion in the unconstrained space, we must perform
three steps in addition to those that are normally carried out. First, we
transform weight values from the constrained space via ~wwi;jk ¼ f�1
ðwi;jk ; aÞ
for all trainable weights of all nodes of the network, which yields the
vectors ~wwik . Second, the derivatives that have been previously computed
with respect to weights in the constrained space must be transformed to
derivatives with respect to weights in the unconstrained space. This is
easily performed by the following transformation for each derivative
component:
~HHi;j;lk ¼ H
i;j;lk
@oi;jk
@ ~wwi;jk
¼ Hi;j;lk
@fð ~wwi;jk ; aÞ
@ ~wwi;jk
: ð2:57Þ
The EKF weight update procedure of Eqs. (2.8)–(2.11) is then applied
using the unconstrained weights and derivatives with respect to uncon-
strained weights. Note that no transformation is applied to either the
scaling matrix Sk or the error vector jk before they are used in the update.
Finally, after the weight updates are performed, the unconstrained weights
are transformed back to the constrained space by wi;jk ¼ fð ~wwi;j
k ; aÞ for all
weights of all nodes in the network.
We now consider specific forms for the function fð ~wwi;jk ; aÞ that trans-
forms weight values from an unconstrained space to a constrained space.
We require that the function obey the following properties:
1. fð ~wwi;jk ; aÞ is monotonically increasing.
2. fð0; aÞ ¼ 0.
3. fð�1; aÞ ¼ �a.
4. fðþ1; aÞ ¼ þa.
5.@w
i;jk
@ ~wwi;jk
j ~wwi;jk¼0 ¼ 1:
6. lima!1 fð ~wwi;jk ; aÞ ¼ ~ww
i;jk ¼ w
i;jk .
52 2 PARAMETER-BASED KALMAN FILTER TRAINING

Property 5 imposes a constraint on the gain of the transformation, while
property 6 imposes the constraint that in the limit of large a, the
constrained optimization problem operates identically to the unconstrained
problem. This last constraint also implies that lima!1ð@wi;jk =@ ~ww
i;jk Þ ¼ 1.
One candidate function is a symmetric saturating linear transformation
where wi;jk ¼ ~ww
i;jk when �a � ~ww
i;jk � a, and is otherwise equal to either
saturating value. The major disadvantage with this constraint function is
that its inverse is multivalued outside the linear range. Thus, once the
training process pushes the constrained weight value into the saturated
region, the derivative of constrained weight with respect to unconstrained
weight becomes zero, and no further training of that particular weight
value will occur due to the zero-valued derivative.
Alternatively, we may consider various forms of symmetric sigmoid
functions that are everywhere differentiable and have well-defined
inverses. The Elliott sigmoid [22] conveniently does not involve trans-
cendental functions. We choose to consider a generalization of this
monotonic and symmetric saturating function given by
wi;jk ¼ fð ~wwi;j
k ; aÞ ¼a ~wwi;j
k
bþ j ~wwi;jk j
¼~ww
i;jk
b=aþ j ~wwi;jk j=a
; ð2:58Þ
where b is a positive quantity that determines the function’s gain. We must
choose the value of b so that the derivative of fð ~wwi;jk ; aÞ with respect to
~wwi;jk , evaluated at ~ww
i;jk ¼ 0, is equal to 1. This condition can be shown to be
satisfied by the choice b ¼ a. Thus, the constraint function we choose is
given by
wi;jk ¼ fð ~wwi;j
k ; aÞ ¼a ~wwi;j
k
aþ j ~wwi;jk j
¼~ww
i;jk
1 þ j ~wwi;jk j=a
: ð2:59Þ
By inspection, we see that this function satisfies the various requirements.
For example, for large a (i.e., as a ! 1Þ, wi;jk ! ~ww
i;jk ; for smaller values
of a, when j ~wwi;jk j � a;w
i;jk ! a sgnð ~ww
i;jk Þ. The inverse of this function is
easily found to be given by
~wwi;jk ¼ f�1
ðwi;jk ; aÞ ¼
awi;jk
a� jwi;jk j
¼w
i;jk
1 � jwi;jk j=a
: ð2:60Þ
In this case, for a � wi;jk , ~ww
i;jk ! w
i;jk ; similarly, as w
i;jk ! a; ~wwi;j
k ! 1. As
a final note, the derivative of constrained weight with respect to uncon-
2.7 OTHER EXTENSIONS AND ENHANCEMENTS 53

strained weight, which is needed for computing the proper derivatives in
the EKF recursion, can be expressed in many different ways, some of
which are given by
@wi;jk
@ ~wwi;jk
¼a
aþ j ~wwi;jk j
!2
¼a� jw
i;jk j
a
!2
¼ 1 �jw
i;jk j
a
!2
¼w
i;jk
~wwi;jk
!2
: ð2:61Þ
2.7.2 EKF Training with an Entropic Cost Function
As defined above, the EKF training algorithm assumes that a quadratic
function of some error signal is being minimized over all network outputs
and all training patterns. However, other cost functions are often useful or
necessary. One such function that has been found to be particularly
appropriate for pattern classification problems, and for which a sound
statistical basis exists, is a cost function based on minimizing cross-
entropy [23]. We consider a prototypical problem in which a network is
trained to act as a pattern classifier; here network outputs encode binary
pattern classifications. We assume that target values of �1 are provided for
each training pattern. Then the contribution to the total entropic cost
function at time step n is given by
ek ¼PNo
l¼1
elk ¼
PNo
l¼1
ð1 þ ylkÞ log
1 þ ylk
1 þ yylk
þ ð1 � ylkÞ log
1 � ylk
1 � yylk
� �: ð2:62Þ
Since the components of the vector yk are constrained to be either þ1 or
�1, we note that only one of the two components for each output l will be
nonzero. This allows the cost function to be expressed as
ek jylk¼�1 ¼
PNo
l¼1
elk ¼
PNo
l¼1
2 log2
1 þ ylk yyl
k
: ð2:63Þ
The EKF training procedure assumes that at each time step k a
quadratic cost function is being minimized, which we write as
Ck ¼PNo
l¼1ðzlk � zzl
kÞ2¼PNo
l¼1ðxlkÞ
2, where zlk and zzl
k are target and
output values, respectively. (We assume here the case of Sk ¼ I; this
procedure is easily extended to nonuniform weighting matrices.) At this
point, we would like to find appropriate transformations between the
fzlk; zzl
kg and fylk; yyl
kg so that Ck and ek are equivalent, thereby allowing us
54 2 PARAMETER-BASED KALMAN FILTER TRAINING

to use the EKF procedure to minimize the entropic cost function. We first
note that both the quadratic and entropic cost functions are calculated by
summing individual cost function components from all targets and output
nodes. We immediately see that this leads to the equality ðxlkÞ
2¼ el
k for all
No outputs, which implies zlk � zzl
k ¼ ðelkÞ
1=2. At this point, we assume that
we can assign all target values zlk ¼ 0;3 so that xl
k ¼ �zzlk ¼ ðel
kÞ1=2. Now
the EKF recursion can be applied to minimize the entropic cost function,
since Ck ¼ SNo
l¼1ðxlkÞ
2¼ SNo
l¼1½ðelkÞ
1=2�2¼ SNo
l¼1elk ¼ ek .
The remainder of the derivation is straightforward. The EKF recursion
in the case of the entropic cost function requires that derivatives of
zzlk ¼ ð�el
kÞ1=2 be computed for all No outputs and all weight parameters,
which are subsequently stored in the matrices Hik . Applying the chain rule,
these derivatives are expressed as a function of the derivatives of network
outputs with respect to weight parameters:
Hi;j;lk ¼
@zzlk
@wi;jk
�����yl
k¼�1
¼ �@ðel
kÞ1=2
@wi;jk
¼1
ðelkÞ
1=2ðyl
k þ yylkÞ
@yylk
@wi;jk
: ð2:64Þ
Note that the effect of the relative entropy cost function on the calculation
of derivatives is handled entirely in the initialization of the backpropaga-
tion process, where the term 1=½ðelkÞ
1=2ðyl
k þ yylkÞ� is used for each of the No
output nodes to start the backpropagation process, rather than starting with
a value of unity for each output node as in the nominal formulation.
In general, the EKF procedure can be modified in the manner just
described for a wide range of cost functions, provided that they meet at
least three simple requirements. First, the cost function must be a
differentiable function of network outputs. Second, the cost function
should be expressed as a sum of contributions, where there is a separate
target value for each individual component. Third, each component of the
cost function must be non-negative.
2.7.3 EKF Training with Scalar Errors
When applied to a multiple-output training problem, the EKF formulation
in Eqs. (2.3)–(2.6) requires a separate backpropagation for each output
and a matrix inversion. In this section, we describe an approximation to
3The idea of using a modified target value of zero with the actual targets appearing in
expressions for system outputs can be applied to the EKF formulation of Eqs. (2.3)–(2.6)
without any change in its underlying behavior.
2.7 OTHER EXTENSIONS AND ENHANCEMENTS 55

the EKF neural network training procedure that allows us to treat such
problems with single-output training complexity. In this approximation,
we require only the computation of derivatives of a scalar quantity with
respect to trainable weights, thereby reducing the backpropagation compu-
tation and eliminating the need for a matrix inversion in the multiple-
output EKF recursion.
For the sake of simplicity, we consider here the prototypical network
training problem for which network outputs directly encode signals for
which targets are defined. The square root of the contribution to the total
cost function at time step k is given by
~yyk ¼ C1=2k ¼
PNo
l¼1
jylk � yyl
k j2
� �1=2
; ð2:65Þ
where we are again treating the simple case of uniform scaling of network
errors (i.e., Sk ¼ I). The goal here is to train a network so that the sum of
squares of this scalar error measure is minimized over time. As in the case
of the entropic cost function, we consider the target for training to be zero
for all training instances, and the scalar error signal used in the Kalman
recursion to be given by xk ¼ 0 � ~yyk. The EKF recursion requires that the
derivatives of the scalar observation ~yyk be computed with respect to all
weight parameters. The derivative of the scalar error with respect to the jth
weight of the ith node is given by
Hi;j;1k ¼
@~yyk
@wi;jk
¼PNo
l¼1
@~yyk
@yylk
@yylk
@wi;jk
¼PNo
l¼1
ylk � yyl
k
xk
@yylk
@wi;jk
: ð2:66Þ
In this scalar formulation, the derivative calculations via backpropagation
are initialized with the terms ðylk � yyl
kÞ=xk for all No network output nodes
(as opposed to initializing the backpropagation calculations with values of
unity for the nominal EKF recursion of Eqs. (2.3)–(2.6)). Furthermore,
only one quantity is backpropagated, rather than No quantities for the
nominal formulation. Note that this scalar approximation reduces exactly
to the nominal EKF algorithm in the limit of a single-output problem:
~yyk ¼ ðjy1k � yy1
k j2Þ
1=2¼ jy1
k � yy1k j; ð2:67Þ
xk ¼ 0 � jy1k � yy1
k j; ð2:68Þ
Hi;j;1k ¼
@~yyk
@wi;jk
¼ �sgnðy1k � yy1
kÞ@yy1
k
@wi;jk
: ð2:69Þ
56 2 PARAMETER-BASED KALMAN FILTER TRAINING

Consider the case y1k � yy1
k . Then, the error signal is given by xk ¼ y1k � yy1
k.
Similarly, @~yyk=@w ¼ @yy1k=@w, since @~yyk=@y1
k ¼ 1. Otherwise, when y1k > yy1
k ,
the error signal is given by xk ¼ �ðy1k � yy1
kÞ, and @~yyk=@w ¼ �@yy1k=@w,
since @~yyk=@yy1k ¼ �1. Since both the error and the derivatives are the
negatives of what the nominal EKF recursion provides, the effects of
negation cancel one another. Thus, in either case, the scalar formulation
for a single-output problem is exactly equivalent to that of the EKF
procedure of Eqs. (2.3)–(2.6).
Because the procedure described here is an approximation to the base
procedure, we suspect that classes of problems exist for which it is not as
effective; further work will be required to clarify this question. In this
regard, we note that once criteria are available to guide the decision of
whether to scalarize or not, one may also consider a hybrid approach to
problems with many outputs. In this approach, selected outputs would be
combined as described above to produce scalar error variables; the latter
would then be treated with the original procedure.
2.8 AUTOMOTIVE APPLICATIONS OF EKF TRAINING
The general area of automotive powertrain control, diagnosis, and model-
ing has offered substantial opportunity for the application of neural
network methods. These opportunities are driven by the steadily increas-
ing demands that are placed on the performance of vehicle control and
diagnostic systems as a consequence of global competition and govern-
ment mandates. Modern automotive powertrain control systems involve
several interacting subsystems, any one of which can involve significant
engineering challenges. We summarize the application of EKF training to
three signal processing problems related to automotive diagnostics and
emissions modeling, as well as its application to two automotive control
problems. In all five cases, we have found EKF training of recurrent neural
networks to be an enabler for developing effective solutions to these
problems.
Figure 2.7 provides a diagrammatic representation of these five neural
network applications and how they potentially interact with one another.
We observe that the neural network controllers for engine idle speed and
air=fuel (A=F) ratio control produce signals that affect the operation of the
engine, while the remaining neural network models are used to describe
various aspects of engine operation as a function of measurable engine
outputs.
2.8 AUTOMOTIVE APPLICATIONS OF EKF TRAINING 57
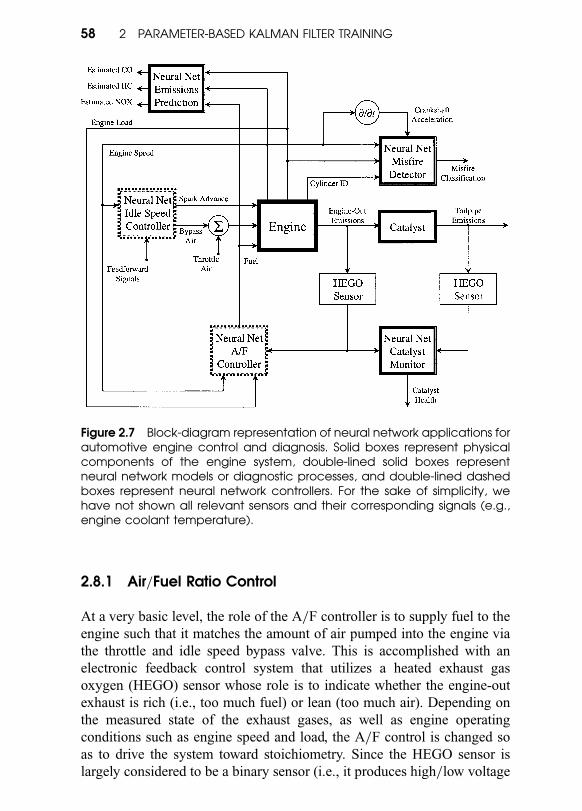
2.8.1 Air=Fuel Ratio Control
At a very basic level, the role of the A=F controller is to supply fuel to the
engine such that it matches the amount of air pumped into the engine via
the throttle and idle speed bypass valve. This is accomplished with an
electronic feedback control system that utilizes a heated exhaust gas
oxygen (HEGO) sensor whose role is to indicate whether the engine-out
exhaust is rich (i.e., too much fuel) or lean (too much air). Depending on
the measured state of the exhaust gases, as well as engine operating
conditions such as engine speed and load, the A=F control is changed so
as to drive the system toward stoichiometry. Since the HEGO sensor is
largely considered to be a binary sensor (i.e., it produces high=low voltage
Figure 2.7 Block-diagram representation of neural network applications forautomotive engine control and diagnosis. Solid boxes represent physicalcomponents of the engine system, double-lined solid boxes representneural network models or diagnostic processes, and double-lined dashedboxes represent neural network controllers. For the sake of simplicity, wehave not shown all relevant sensors and their corresponding signals (e.g.,engine coolant temperature).
58 2 PARAMETER-BASED KALMAN FILTER TRAINING

levels for rich=lean operations, respectively), and since there are time-
varying transport delays, the closed-loop A=F control strategy often takes
the form of a jump=ramp strategy, which effectively causes the HEGO
output to oscillate between the two voltage levels. We have demonstrated
that an open-loop recurrent neural network controller can be trained to
provide a correction signal to the closed-loop A=F control in the face of
transient conditions (i.e., dynamic changes in engine speed and load),
thereby eliminating large deviations from stoichiometry. This is accom-
plished by using an auxiliary universal EGO (UEGO) sensor, which
provides a continuous measure of A=F ratio (as opposed to the rich= lean
indication provided by the HEGO), during the in-vehicle training process.
Deviations of measured A=F ratio from stoichiometric A=F ratio provide
the error signal for the EKF training process; however, the measured A=F
ratio is not used as an input, and since the A=F control does not have a
major effect on engine operating conditions when operated near stoichio-
metry, then this can be viewed as a problem of training an open-loop
controller. Nevertheless, we use recurrent network controllers to provide
the capability of representing the condition-dependent dynamics asso-
ciated with the operation of the engine system under A=F control, and
must take care to properly compute derivatives with BPTT(h).
2.8.2 Idle Speed Control
A second engine control task is that of maintaining smooth engine
operation at idle conditions. In this case, no air is provided to the intake
manifold of the engine via the throttle; in order to keep the engine
running, a bypass air valve is used to regulate the flow of air into the
engine. The role of the idle speed control system is to maintain a relatively
low (for purposes of fuel economy) and constant engine speed, in the face
of disturbances that place and remove additional loads on the engine (e.g.,
shifting from neutral to drive, activating the air conditioning system, and
locking up the power steering); feedforward signals encoding these events
are provided as input to the idle speed controller. The control range of the
bypass air signal is large (more than 1000 rpm under idle conditions), but
its effect is delayed by a time inversely proportional to engine speed. The
spark advance command, which regulates the timing of ignition, has an
immediate effect on engine speed, but over a small range (on order of
100 rpm). Thus, an effective engine idle speed controller coordinates the
two controls to maintain a constant engine speed. The error signals for the
EKF training process are a weighted sum of squared deviations of engine
2.8 AUTOMOTIVE APPLICATIONS OF EKF TRAINING 59

speed from a desired speed, combined with constraints on the controls
expressed as squared error signals. We have used recurrent neural
networks, trained by on-line EKF methods, to develop effective idle
speed control strategies, and have documented this work in [5]. Note
that unlike the case of the A=F controller, this is an example of a closed-
loop controller, since the bypass air and spark advance controls affect
engine speed, which is used as a controller input.
2.8.3 Sensor-Catalyst Modeling
A particularly critical component of a vehicle’s emissions control system is
the catalytic converter. The role of the catalytic converter is to chemically
transform noxious and environmentally damaging engine-out emissions,
which are the byproduct of the engine’s combustion process, to environ-
mentally benign chemical compounds. An ideal three-way catalytic
converter should completely perform the following three tasks during
continuous vehicle operation: (1) oxidation of hydrocarbon (HC) exhaust
gases to carbon dioxide (CO2) and water (H2O); (2) oxidation of carbon
monoxide (CO) to CO2; and (3) reduction of nitrogen oxides (NOx) to
nitrogen (N2) and oxygen (O2). In practice, it is possible to achieve high
conversion efficiencies for all three types of exhaust gases only when the
engine is operating near stoichiometry. An effective A=F control strategy
enables such conversion.
However, even in the presence of effective A=F control, vehicle-out
(i.e., tailpipe) emissions may be unreasonably high if the catalytic
converter has been damaged. Government regulations require that the
performance of a vehicle’s catalytic converter be continuously monitored
to detect when conversion efficiencies have dropped below some thresh-
old. Unfortunately, it is currently infeasible to equip vehicles with sensors
that can measure the various exhaust gas species directly. Instead, catalytic
converter monitors are based on comparing the output of a HEGO sensor
that is exposed to engine-out emissions with the output of a second sensor
that is mounted downstream of the catalytic converter and is exposed to
the tailpipe emissions. This approach is based on the observation that the
postcatalyst HEGO sensor switches infrequently, relative to the precatalyst
HEGO sensor, when the catalyst is operating efficiently. Similarly, the
average rate of switching of the postcatalyst sensor increases as catalyst
efficiency decreases (due to decreasing oxygen storage capability).
A catalyst monitor can be developed based on a neural network model
of the dynamic operation of the postcatalyst HEGO sensor as a function of
60 2 PARAMETER-BASED KALMAN FILTER TRAINING
the precatalyst HEGO sensor and engine operating conditions [12] for a
catalyst of nominal conversion efficiency. This is a difficult task, espe-
cially given the nonlinear responses of the various components and the
condition-dependent time delays, which can range from less than 0.1 s at
high engine speeds to more than 1 s at low speeds. We employed a RMLP
network with structure 15-20R-15R-10R-1 and a sparse tapped delay line
representation to directly capture the long-term temporal characteristics of
the precatalyst HEGO sensor. Because of the size of the network (over
1,500 weights) and the number of training samples (63,000), we chose to
employ decoupled EKF training. The trained network effectively repre-
sented the condition-dependent time delays and nonlinearities of the
system, as shown in [12].
2.8.4 Engine Misfire Detection
Engine misfire is broadly defined as the condition in which a substantial
fraction of a cylinder’s air–fuel mixture fails to ignite. Frequent misfire
will lead to a deterioration of the catalytic converter, ultimately resulting in
unacceptable levels of emitted pollutants. Consequently, government
mandates require that onboard misfire detection capability be provided
for nearly all engine operating conditions.
While there are many ways of detecting engine misfire, all currently
practical methods rely on observing engine crankshaft dynamics with a
position sensor located at one end of the shaft. Briefly stated, one looks for
a crankshaft acceleration deficit following a cylinder firing and attempts to
determine whether such a deficit is attributable to a lack of power provided
on the most recent firing stroke.
Since every engine firing must be evaluated, the natural ‘‘clock’’ for
misfire detection is based on crankshaft rotation, rather than on time. For
an n-cylinder engine, there are n engine firings, or events, per engine
cycle, which requires two engine revolutions. The actual time interval
between events varies considerably, from 20 ms at 750 rpm to 2.5 ms at
6000 rpm for an eight-cylinder engine. Engine speed, as required for
control, is typically derived from measured intervals between marks on a
timing wheel. As used in misfire detection, an acceleration value is
calculated from the difference between successive intervals.
A serious problem associated with measuring crankshaft acceleration is
the presence of complex torsional dynamics of the crankshaft, even in the
absence of misfire. This is due to the finite stiffness of the crankshaft. The
magnitude of acceleration induced by such torsional vibrations may be
2.8 AUTOMOTIVE APPLICATIONS OF EKF TRAINING 61

large enough to dwarf acceleration deficits from misfire. Further, the
torsional vibrations are themselves altered by misfire, so that normal
engine firings followed by misfire may be misinterpreted.
We have approached the misfire detection problem with recurrent
neural networks trained by GEKF [12] to act as dynamic pattern
classifiers. We use as inputs engine speed, engine load, crankshaft
acceleration, and a binary flag to identify the beginning of the cylinder
firing sequence. The training target is a binary signal, according to
whether a misfire had been artificially induced for the current cylinder
during the previous engine cycle. This phasing enables the network to
make use of information contained in measured accelerations that follow
the engine event being classified. We find that trained networks make
remarkably few classification errors, most of which occur during moments
of rapid acceleration or deceleration.
2.8.5 Vehicle Emissions Estimation
Increasing levels of pollutants in the atmosphere – observed despite the
imposition of stricter emission standards and technological improvements
in emissions control systems – have led to models being developed to
predict emissions inventories. These are typically based on the emissions
levels that are mandated by the government for a particular driving
schedule and a given model year. It has been found that the emissions
inventories based on these mandated levels do not accurately reflect those
that are actually found to exist. That is, actual emission rates depend
heavily upon driving patterns, and real-world driving patterns are not
comprehensively represented by the mandated driving schedules. To better
assess the emissions that occur in practice and to predict emissions
inventories, experiments have been conducted using instrumented vehicles
that are driven in actual traffic. Unfortunately, such vehicles are costly and
are difficult to operate and maintain.
We have found that recurrent neural networks can be trained to estimate
instantaneous engine-out emissions from a small number of easily
measured engine variables. Under the assumption of a properly operating
fuel control system and catalytic converter, this leads to estimates of
tailpipe emissions as well. This capability then allows one to estimate the
sensitivity of emissions to driving style (e.g., aggressive versus conserva-
tive). Once trained, the network requires only information already avail-
able to the powertrain processor. Because of engine dynamics, we have
found the use of recurrent networks trained by EKF methods to enable
62 2 PARAMETER-BASED KALMAN FILTER TRAINING

accurate estimation of instantaneous emissions levels. We provide a
detailed description of this application in [24].
2.9 DISCUSSION
We have presented in this chapter an overview of neural network training
methods based on the principles of extended Kalman filtering. We
summarize our findings by considering the virtues and limitations of
these methods, and provide guidelines for implementation.
2.9.1 Virtues of EKF Training
The EKF family of training algorithms develops and employs second-
order information during the training process using only first-order
approximations. The use of second-order information, as embedded in
the approximate error covariance matrix, which co-evolves with the weight
vector during training, provides enhanced capabilities relative to first-order
methods, both in terms of training speed and quality of solution. The
amount of second-order information utilized is controlled by the level of
decoupling, which is chosen on the basis of computational considerations.
Thus, the computational complexity of the EKF methods can be scaled to
meet the needs of specific applications.
We have found that EKF methods have enabled the training of recurrent
neural networks, for both modeling and control of nonlinear dynamical
systems. The sequential nature of the EKF provides advantages relative to
batch second-order methods, since weight updates can be performed on an
instance-by-instance basis with EKF training. On the other hand, the
ability to batch multiple training instances with multistream EKF training
provides a level of scalability in addition to that provided by decoupling.
The sequential nature of the EKF, in both single- and multistream
operation, provides a stochastic component that allows for more effective
search of the weight space, especially when used in combination with
artificial process noise.
The EKF methods are easily implemented in software, and there is
substantial promise for hardware implementation as well. Methods for
avoiding matrix inversions in the EKF have been developed, thereby
enabling easy implementations. Finally, we believe that the greatest virtue
of EKF training of neural networks is its established and proven applic-
ability to a wide range of difficult modeling and control problems.
2.9 DISCUSSION 63

2.9.2 Limitations of EKF Training
Perhaps the most significant limitation of EKF training is its limited
applicability to cost functions other then minimizing sum of squared error.
Although we have shown that other cost functions can be used (e.g.
entropic measures), we are nevertheless restricted to those optimization
problems that can be converted to minimizing a sum of squared error
criterion. On the other hand, many problems, particularly in control,
require other optimization criteria. For example, in a portfolio optimiza-
tion problem, we should like to maximize the total return over time.
Converting such an optimization criterion to a sum of squared errors
criterion is usually not straightforward. However, we do not view the sum
of squared-error optimization criterion as a limitation for most problems
that can be viewed as belonging to the class of traditional supervised
training problems.
The EKF procedures described in this chapter are derived on the basis
of a first-order linearization of the nonlinear system; this may provide a
limitation in the form of large errors in the weight estimates and
covariance matrix, since the second-order information is effectively
developed by taking outer products of the gradients. Chapter 7 introduces
the unscented Kalman filter (UKF) as an alternative to the EKF. The UKF
is expected to provide a more accurate means of developing the required
second-order information than the EKF, without increasing the computa-
tional complexity.
2.9.3 Guidelines for Implementation and Use
1. Decoupling should be used when computation is a concern (e.g., for
on-line applications). Node and layer decoupling are the two most
appropriate choices. Otherwise, we recommend the use of global
EKF, regardless of network architecture, as it should be expected to
find better solutions than any of the decoupled versions because of
the use of full second-order information.
2. Effectively, two parameter values need to be chosen for training of
networks with EKF methods. We assume that the approximate error
covariance matrices are always initialized with diagonal value of 100
and 1,000 for weights corresponding to nonlinear and linear nodes,
respectively. Then, the user of these methods must set values for the
learning rate and process-noise term according to characteristics of
the training problem.
64 2 PARAMETER-BASED KALMAN FILTER TRAINING

3. Training of recurrent networks, either as supervised training tasks or
for controller training, can often be improved by multistreaming.
The choice of the number of streams is dictated by problem
characteristics.
4. Matrix inversions can be avoided by use of sequential EKF update
procedures. In the case of decoupling, the order in which outputs are
processed can affect training performance in detail. We recommend
that outputs be processed in random order when these methods are
used.
5. Square-root filtering can be employed to insure computational
stability for the error covariance update equation. However, the
use of square-root filtering with artificial process noise for covar-
iance updates results in a substantial increase in computational
complexity. We have noted that nonzero artificial process noise
benefits training, by providing a mechanism to escape poor local
minima and a mechanism that maintains stable covariance updates
when using the Riccati update equation. We recommend that square-
root filtering only be employed when no artificial process noise is
used (and only for GEKF).
6. The EKF procedures can be modified to allow for alternative cost
functions (e.g., entropic cost functions) and for weight constraints to
be imposed during training, which thereby allow networks to be
deployed in fixed-point arithmetic.
REFERENCES
[1] D.E. Rumelhart, G.E. Hinton, and R.J. Williams, ‘‘Learning representations
of back-propagation errors,’’ Nature 323, 533–536 (1986).
[2] S. Singhal and L. Wu, ‘‘Training multilayer perceptrons with the extended
Kalman algorithm,’’ in D.S. Touretzky, Eds., Advances in Neural Information
Processing Systems 1, San Mateo, CA: Morgan Kaufmann, 1989, pp. 133–
140.
[3] G.V. Puskorius and L. A. Feldkamp, ‘‘Decoupled extended Kalman filter
training of feedforward layered networks,’’ in Proceedings of International
Joint Conference of Neural Networks, Seattle, WA, 1991, Vol. 1, pp. 771–
777.
[4] G.V. Puskorius and L.A. Feldkamp, ‘‘Automotive engine idle speed control
with recurrent neural networks,’’ in Proceedings of the 1993 American
Control Conference, San Francisco, CA, pp. 311–316.
REFERENCES 65

[5] G.V. Puskorius, L.A. Feldkamp, and L.I. Davis, Jr., ‘‘Dynamic neural
network methods applied to on-vehicle idle speed control,’’ Proceedings of
the IEEE, 84, 1407–1420 (1996).
[6] R.J. Williams and D. Zipser, ‘‘A learning algorithm for continually running
fully recurrent neural networks,’’ Neural Computation, 1, 270–280 (1989).
[7] G.V. Puskorius and L.A. Feldkamp, ‘‘Neurocontrol of nonlinear dynamical
systems with Kalman filter-trained recurrent networks,’’ IEEE Transactions
on Neural Networks, 5, 279–297 (1994).
[8] P.J. Werbos, ‘‘Backpropagation through time: What it does and how to do it,’’
Proceedings of the IEEE, 78, 1550–1560 (1990).
[9] G.V. Puskorius and L.A. Feldkamp, ‘‘Extensions and enhancements of
decoupled extended Kalman filter training,’’ in Proceedings of the 1997
International Conference on Neural Networks, Houston, TX, Vol. 3, pp.
1879–1883.
[10] L.A. Feldkamp and G.V. Puskorius, ‘‘Training controllers for robustness:
multi-stream DEKF,’’ in Proceedings of the IEEE International Conference
on Neural Networks, Orlando, FL, 1994, Vol. IV, pp. 2377–2382.
[11] L.A. Feldkamp and G.V. Puskorius, ‘‘Training of robust neurocontrollers,’’ in
Proceedings of the 33rd IEEE InternationaI Conference on Decision and
Control, Orlando, FL, 1994, Vol. III, pp. 2754–2760.
[12] L.A. Feldkamp and G.V. Puskorius, ‘‘A signal processing framework based
on dynamic neural networks with application to problems in adaptation,
filtering and classification,’’ Proceedings of the IEEE, 86, 2259–2277 (1998).
[13] F. Heimes, ‘‘Extended Kalman filter neural network training: experimental
results and algorithm improvements,’’ in Proceedings of the 1998 IEEE
Conference on Systems, Man and Cybernetics, Orlando, FL., pp. 1639–1644.
[14] L.A. Feldkamp and G.V. Puskorius, ‘‘Fixed weight controller for multiple
systems,’’ in Proceedings of the 1997 IEEE International Conference on
Neural Networks, Houston, TX, Vol. 2, pp 773–778.
[15] G.H. Golub and C.F. Van Loan, Matrix Computations, 2nd ed. Baltimore,
MD: The John Hopkins University Press, 1989.
[16] G.V. Puskorius and L.A. Feldkamp, ‘‘Avoiding matrix inversions for the
decoupled extended Kalman filter training algorithm,’’ in Proceedings of the
World Congress on Neutral Networks, Washington, DC, 1995, pp. I-704–I-
709.
[17] E.S. Plumer, ‘‘Training neural networks using sequential extended Kalman
filtering,’’ in Proceedings of the World Congress on Neural Networks,
Washington DC, 1995 pp. I-764–I-769.
[18] P. Sun and K. Marko, ‘‘The square root Kalman filter training of recurrent
neural networks,’’ in Proceedings of the 1998 IEEE Conference on Systems,
Man and Cybernetics, Orlando, FL, pp. 1645–1651.
66 2 PARAMETER-BASED KALMAN FILTER TRAINING
[19] S. Haykin, Adaptive Filter Theory, 3rd ed. Englewood Cliffs, NJ: Prentice-
Hall.
[20] E.W. Saad, D.V. Prokhorov, and D.C. Wunsch III, ‘‘Comparative study of
stock trend prediction using time delay, recurrent and probabilistic neural
networks,’’ IEEE Transactions on Neural Networks, 9, 1456–1470 (1998).
[21] K.-C. Jim, C.L. Giles, and B.G. Horne, ‘‘An analysis of noise in recurrent
neural networks: convergence and generalization,’’ IEEE Transactions on
Neural Networks, 7, 1424–1438 (1996).
[22] D.L. Elliot, ‘‘A better activation function for artificial neural networks,’’
Institute for Systems Research, University of Maryland, Technical Report
TR93-8, 1993.
[23] J. Hertz, A. Krogh, and R.G. Palmer, Introduction to the Theory of Neural
Computation, Redwood City, CA: Addison-Wesley, 1991.
[24] G. Jesion, C.A. Gierczak, G.V. Puskorius, L.A. Feldkamp, and J.W. Butler,
‘‘The application of dynamic neural networks to the estimation of feedgas
vehicle emissions,’’ in Proceedings of the 1998 International Joint Confer-
ence on Neural Networks, Anchorage, AK, pp. 69–73.
REFERENCES 67


3
LEARNING SHAPE ANDMOTION FROM IMAGE
SEQUENCES
Gaurav S. PatelDepartment of Electrical and Computer Engineering, McMaster University,
Hamilton, Ontario, Canada
Sue Becker and Ron RacineDepartment of Psychology, McMaster University, Hamilton, Ontario, Canada
3.1 INTRODUCTION
In Chapter 2, Puskorius and Feldkamp described a procedure for the
supervised training of a recurrent multilayer perceptron – the node-
decoupled extended Kalman filter (NDEKF) algorithm. We now use this
model to deal with high-dimensional signals: moving visual images. Many
complexities arise in visual processing that are not present in one-
dimensional prediction problems: the scene may be cluttered with back-
69
Kalman Filtering and Neural Networks, Edited by Simon HaykinISBN 0-471-36998-5 # 2001 John Wiley & Sons, Inc.

ground objects, the object of interest may be occluded, and the system
may have to deal with tracking differently shaped objects at different
times. The problem we have dealt with initially is tracking objects that
vary in both shape and location. Tracking differently shaped objects is
challenging for a system that begins by performing local feature extrac-
tion, because the features of two different objects may appear identical
locally even though the objects differ in global shape (e.g., squares versus
rectangles). However, adequate tracking may still be achievable without a
perfect three-dimensional model of the object, using locally extracted
features as a starting point, provided there is continuity between image
frames.
Our neural network model is able to make use of short-term continuity
to track a range of different geometric shapes (circles, squares, and
triangles). We evaluate the model’s abilities in three experiments. In the
first experiment, the model was trained on images of two different moving
shapes, where each shape had its own characteristic movement trajectory.
In the second experiment, the training set was made more difficult by
adding a third object, which also had a unique motion trajectory. In the
third and final experiment, the restriction of one direction of motion per
shape was lifted. Thus, the model experienced the same shape traveling in
different trajectories, as well as different shapes traveling in the same
trajectory. Even under these conditions, the model was able to learn to
track a given shape for many time steps and anticipate both its shape and
location many time steps into the future.
3.2 NEUROBIOLOGICAL AND PERCEPTUAL FOUNDATIONS
The architecture of our model is motivated by two key anatomical features
of the mammalian neocortex, the extensive use of feedback connections,
and the hierarchical multiscale structure. We discuss briefly the evidence
for, and benefits of, each of these in turn.
Feedback is a ubiquitous feature of the brain, both between and within
cortical areas. Whenever two cortical areas are interconnected, the
connections tend to be bidirectional [1]. Additionally, within every
neocortical area, neurons within the superficial layers are richly inter-
connected laterally via a network of horizontal connections [2]. The dense
web of feedback connections within the visual system has been shown to
be important in suppressing background stimuli and amplifying salient or
foreground stimuli [3]. Feedback is also likely to play an important role in
processing sequences. Clearly, we view the world as a continuously
70 3 LEARNING SHAPE AND MOTION FROM IMAGE SEQUENCES

varying sequence rather than as a disconnected collection of snapshots.
Seeing the world in this way allows recent experience to play a role in the
anticipation or prediction of what will come next. The generation of
predictions in a perceptual system may serve at least two important
functions: (1) To the extent that an incoming sensory signal is consistent
with expectations, intelligent filtering may be done to increase the signal-
to-noise ratio and resolve ambiguities using context. (2) When the signal
violates expectations, an organism can react quickly to such changing or
salient conditions by de-emphasizing the expected part of the signal and
devoting more processing capacity to the unexpected information. Top-
down connections between processing layers, or lateral connections within
layers, or both, might be used to accomplish this. Lateral connections
allow for local constraints about moving contours to guide one’s expecta-
tions, and this is the basis for our model.
Prediction in a high-dimensional space is computationally complex in a
fully connected network architecture. The problem requires a more
constrained network architecture that will reduce the number of free
parameters. The visual system has done just that. In the earliest stages
of processing, cells’ receptive fields span only a few degrees of visual
angle, while in higher visual areas, cells’ receptive fields span almost the
entire visual field (for a review, see [4]). Therefore, we designed our model
network with a similar hierarchical architecture, in which the first layer of
units were connected to relatively small, local regions of the image and a
subsequent layer spanned the entire visual field (see Figure 3.1).
3.3 NETWORK DESCRIPTION
Prediction in a high-dimensional space such as a 50 � 50 pixel image,
using a fully connected recurrent network is not feasible, because the
number of connections is typically one or more orders of magnitude larger
than the dimensionality of the input, and the NDEKF training procedure
requires adapting these parameters for typically hundreds to thousands of
iterations. The problem requires a more constrained network architecture
that will reduce the number of free parameters. Motivated by the
hierarchical architecture of real visual systems, we designed our model
network with a similar hierarchical architecture in which the first layer of
units were connected to relatively small, local 5 � 5 pixel regions of the
image and a subsequent layer spanned the entire visual field (see Figure
3.1).
3.3 NETWORK DESCRIPTION 71

A four-layer network of size 100-16-8R-100, as depicted in Figures
3.1a and 3.1b, was used in the following experiments. Training images of
size 10 � 10, which are arranged in a vector format of size 100 � 1, were
used to form the input to the networks. As depicted in Figure 3.1a, the
input image is divided into four non-overlapping receptive fields of size
5 � 5. Further, the 16 units in the first hidden layer are divided into four
banks of four units each. Each of the four units within a bank receive
inputs from one of the four receptive fields. This describes how the
10 � 10 image is connected to the 16 units in the first hidden layer. Each
of these 16 units feed into a second hidden layer of 8 units. The second
hidden layer has recurrent connections (note that recurrence is only within
the layer and not between layers).
Figure 3.1 A diagram of the network used. The numbers in the boxesindicate the number of units in each layer or module, except in the inputlayer, where the receptive fields are numbered 1; . . . ; 4. Local receptivefields of size 5 � 5 at the input are fed to the four banks of four units in the firsthidden layer. The second layer of eight units then combines these localfeatures learned by the first hidden layer. Note the recurrence in the secondhidden layer.
72 3 LEARNING SHAPE AND MOTION FROM IMAGE SEQUENCES

Thus, the input layer of the network is connected to small and local
regions of the image. The first layer processes these local receptive fields
separately, in an effort to extract relevant local features. These features are
then combined by the second hidden layer to predict the next image in the
sequence. The predicted image is represented at the output layer. The
prediction error is then used in the EKF equations to update the weights.
This process is repeated over several epochs through the training image
sequences until a sufficiently small incremental mean-squared error is
obtained.
3.4 EXPERIMENT 1
In the first experiment, the model is trained on images of two different
moving shapes, where each shape has its own characteristic movement,
that is, shape and direction of movement are perfectly correlated. The
sequence of eight 10 � 10 pixel images in Figure 3.2a is used to train a
four-layered (100-16-8R-100) network to make one-step predictions of the
image sequence. In the first four time steps, a circle moves upward within
the image; and in the last four time steps, a triangle moves downward
Figure 3.2 Experiment 1: one-step and iterated prediction of imagesequence. (a) Training sequence used. (b) One-step prediction. (c) multi-step prediction. In (b) and (c), the three rows correspond to input, predic-tion, and error, respectively.
3.4 EXPERIMENT 1 73

within the image. At each time step, the network is presented with one of
the eight 10 � 10 images as input (divided into four 5 � 5 receptive fields
as described above), and generates in its output layer a prediction of the
input at the next time step, but it is always given the correct input at the
next time step. Training was stopped after 20 epochs through the training
sequence. Figure 3.2b shows the network operating in one-step prediction
mode on the training sequence after training. It makes excellent predic-
tions of the object shape and also its motion. Figure 3.2c shows the
network operating in an autonomous mode after being shown only the first
image of the sequence. In this multistep prediction case, the network is
only given external input at the first time step in the sequence. Beyond the
first time step, the network is given its prediction from time t � 1 as its
input at time t, which could potentially lead to a buildup of prediction
errors over many time steps. This shows that the network has recon-
structed the entire dynamics, to which it was exposed during training,
when provided with only the first image. This is indeed a difficult task. It
is seen that as the iterative prediction proceeds, the residual errors (the
third row in Figure 3.2c) are amplified at each step.
3.5 EXPERIMENT 2
Next, an ND-EKF network with the same 100-16-8R-100 architecture
used in Experiment 1 was trained with three sequences, each consisting of
four images, in the following order:
� circle moving right and up;
� triangle moving right and down;
� square moving right and up.
During training, at the beginning of each sequence, the network states
were initialized to zero, so that the network would not learn the order of
presentation of the sequences. The network was therefore expected to
learn the motions associated with each of the three shapes, and not the
order of presentation of the shapes.
During testing, the order of presentation of the three sequences varied,
as shown in Figure 3.3a. The trained network does well at the task of one-
step prediction, only failing momentarily at transition points where we
switch between sequences. It is important to note that one-step prediction,
in this case, is a difficult and challenging task because the network has to
determine (1) what shape is present and (2) which direction it is moving
in, without direct knowledge of inputs some time in the past. In order to
74 3 LEARNING SHAPE AND MOTION FROM IMAGE SEQUENCES

make good predictions, it must rely on its recurrent or feedback connec-
tions, which play a crucial role in the present model.
We also tested the model on a set of occluded images – images with
regions that are intentionally zeroed. Remarkably, the network makes
correct one-step predictions, even in the presence of occlusions as shown
in Figure 3.3b. In addition, the predictions do not contain occlusions; that
is, they are correctly filled in, demonstrating the robustness of the model
to occlusions. In Figure 3.3c, when the network is presented with
Figure 3.3 Experiment 2: one-step prediction of image sequences usingthe trained network. (a) Various combinations of sequences used in training.(b) Same sequences as in (a), but with occlusions. (c) Prediction on somesequences not seen during training. The three rows in each image corre-spond to input, prediction, and error, respectively.
3.5 EXPERIMENT 2 75

sequences that it had not been exposed to during training, a larger residual
error is obtained, as expected. However, the network is still capable of
identifying the shape and motion, although not as accurately as before.
3.6 EXPERIMENT 3
In Experiment 1, the network was presented with short sequences (four
images) of only two shapes (circle and triangle), and in experiment 2 an
extra shape (square) was added. In Experiment 3, to make the learning
task even more challenging, the length of the sequences was increased to
10 and the restriction of one direction of motion per shape was lifted.
Specifically, each shape was permitted to move right and either up or
down. Thus, the network was exposed to different shapes traveling in
similar directions and also the same shape traveling in different directions,
increasing the total number of images presented to the network from 8
images in Experiment 1 and 12 images in Experiment 2 to 100 images in
this experiment. In effect, there is a substantial increase in the number of
learning patterns, and thus a substantial increase in the complexity of the
learning task. However, since the number of weights in the network is
limited and remains the same as in the other experiments, the network
cannot simply memorize the sequences.
We trained a network of the same 100-16-8R-100 architecture on six
sequences, each consisting of 10 images (see Fig. 3.4) in the following order:
� circle moving right and up;
� square moving right and down;
� triangle moving right and up;
� circle moving right and down;
� square moving right and up;
� triangle moving right and down.
Training was performed in a similar manner as Experiment 2. During
testing, the order of presentation of the six sequences was varied; several
examples are shown in Figure 3.5. As in the previous experiments, even
with the larger number of training patterns, the network is able to predict
the correct motion of the shapes, only failing during transitions between
shapes. It is able to distinguish between the same shapes moving in
different directions as well as different shapes moving in the same
direction, using context available via the recurrent connections.
76 3 LEARNING SHAPE AND MOTION FROM IMAGE SEQUENCES

The failure of the model to make accurate predictions at transitions
between shapes can also be seen in the residual error that is obtained
during prediction. The residual error in the predicted image is quantified
by calculating the mean-squared prediction error, as shown in Figure 3.6.
The figure shows how the mean-squared prediction error varies as the
prediction continues. Note the transient increase in error at transitions
between shapes.
3.7 DISCUSSION
In this chapter, we have dealt with time-series prediction of high-dimen-
sional signals: moving visual images. This situation is much more
Figure 3.4 Experiment 3: six image sequences used for training.
3.7 DISCUSSION 77

complicated than a one-dimensional case, in that the system has to deal
with simultaneous shape and motion prediction. The network was trained
by the EKF method to perform one-step prediction of image sequences in
a specific order. Then, during testing, the order of the sequences was
varied and the network was asked to predict the correct shape and location
of the next image in the sequence. The complexity of the problem was
increased from Experiment 1 to 3 as we introduced occlusions, increased
both the length of the training sequences and the number of shapes
presented, and allowed shape and motion to vary independently. In all
Figure 3.5 Experiment 3: one-step prediction of image sequences usingthe trained network. The three rows in each image correspond to input,prediction, and error, respectively.
78 3 LEARNING SHAPE AND MOTION FROM IMAGE SEQUENCES

cases, the network was able to predict the correct motion of the shapes,
failing only momentarily at transitions between shapes.
The network described here is a first step toward modeling the
mechanisms by which the human brain might simultaneously recognize
and track moving stimuli. Any attempt to model both shape and motion
processing simultaneously within a single network may seem to be at odds
with the well-established finding that shape and spatial information are
processed in separate pathways of the visual system [5]. An extreme
version of this view posits that form-related features are processed strictly
by the ventral ‘‘what’’ pathway and motion features are processed strictly
Figure 3.6 Mean-squared prediction error in one-step prediction of imagesequences using the trained network. The three rows in each imagecorrespond to input, prediction, and error, respectively. The graphs showhow the mean-squared prediction error varies as the prediction progresses.Notice the increase in error at transitions between shapes.
3.7 DISCUSSION 79

by the dorsal ‘‘where’’ pathway. Anatomically, however, there are cross-
connections between the two pathways at several points [6]. Furthermore,
there is ample behavioral evidence that the processes of shape and motion
perception are not completely separate. For example, it has long been
established that we are able to infer shape from motion (see e.g., [7]).
Conversely, under certain conditions, object recognition can be shown to
drive motion perception [8]. In addition, Stone [9] has shown that viewers
are much better at recognizing objects when they are moving in char-
acteristic, familiar trajectories as compared with unfamiliar trajectories.
These data suggest that when shape and motion are tightly correlated,
viewers will learn to use them together to recognize objects. This is
exactly what happens in our model.
To accomplish temporal processing in our model, we have incorporated
within-layer recurrent connections in the architecture used here. Another
possibility would be to incorporate top-down recurrent connections. A key
anatomical feature of the visual system is top-down feedback between
visual areas [3]. Top-down connections could allow global expectations
about the three-dimensional shape of a moving object to guide predictions.
Thus, an important direction for future work is to extend the model to
allow top-down feedback. Rao and Ballard [10] have proposed an
alternative neural network implementation of the EKF that employs top-
down feedback between layers, and have applied their model to both static
images and time-varying image sequences [10, 11]. Other models of
cortical feedback for modeling the generation of expectations have also
been proposed (see, e.g., [12, 13]).
Natural visual systems can deal with an enormous space of possible
images, under widely varying viewing conditions. Another important
direction for future work is to extend our model to deal with more realistic
images. Many additional complexities arise in natural images that were not
present in the artificial image sequences used here. For example, the
simultaneous presence of both foreground and background objects may
hinder the prediction accuracy. Natural visual systems likely use atten-
tional filtering and binding strategies to alleviate this problem; for
example, Moran and Desimone [14] have observed cells that show a
suppressed neural response to a preferred stimulus if unattended and in the
presence of an attended stimulus. Another simplification of our images is
that shape remained constant for many time frames, whereas for real three-
dimensional objects, the shape projected onto a two-dimensional image
may change dramatically over time, because of rotations as well as non-
rigid motions (e.g. bending). Humans are able to infer three-dimensional
shape from non-rigid motion, even from highly impoverished stimuli such
80 3 LEARNING SHAPE AND MOTION FROM IMAGE SEQUENCES

as moving light displays [7]. It is likely that the architecture described here
could handle changes in shape, provided shape changes predictably and
gradually over time.
REFERENCES
[1] D.J. Felleman and D.C. Van Essen, ‘‘Distributed hierarchical processing in
the primate cerebral cortex’’, Cerebral Cortex, 1, 1–47 (1991).
[2] J.S. Lund, Q. Wu and J.B. Levitt, ‘‘Visual cortex cell types and connections’’,
in M.A. Arbib, Ed., Handbook of Brain Theory and Neural Networks,
Cambridge, MA: MIT Press, 1995.
[3] J.M. Hupe, A.C. James, B.R. Payne, S.G. Lomber, P. Girard and J. Bullier,
‘‘Cortical feedback improves discrimination between figure and background
by V1, V2 and V3 neurons’’, Nature, 394, 784–787 (1998).
[4] M.W. Oram and D.I. Perrett, ‘‘Modeling visual recognition from neurobio-
logical constraints’’, Neural Networks, 7, 945–972 (1994).
[5] M. Mishkin, L.G. Ungerleider and K.A. Macko, ‘‘Object vision and spatial
vision: Two cortical pathways’’, Trends in Neurosciences, 6, 414–417
(1983).
[6] E.A. De Yoe and D.C. Van Essen, ‘‘Concurrent processing streams in
monkey visual cortex’’, Trends in Neurosciences, 11, 219–226, (1988).
[7] G. Johanssen, ‘‘Visual perception of biological motion and a model for its
analysis’’, Perception and Psychophysics, 14, 201–211 (1973).
[8] V.S. Ramachandran, C. Armel, C. Foster and R. Stoddard, ‘‘Object recogni-
tion can drive motion perception’’, Nature, 395, 852–853 (1998).
[9] J.V. Stone, ‘‘Object recognition: View-specificity and motion-specificity’’,
Vision Research, 39, 4032–4044, (1999).
[10] R.P.N. Rao and D.H. Ballard, ‘‘Dynamic model of visual recognition predicts
neural response properties in the visual cortex’’, Neural Computation, 9(4),
721–763 (1997)
[11] R.P.N. Rao, ‘‘Correlates of attention in a model of dynamic visual recogni-
tion’’, in M.I. Jordan, M.J. Kearns and S.A. Solla, Eds., Advances in Neural
Information Processing Systems, Vol. 10. Cambridge, MA: MIT Press, 1998.
[12] E. Harth, K.P. Unnikrishnan and A.S. Panday, ‘‘The inversion of sensory
processing by feedback pathways: A model of visual cognitive functions’’,
Science, 237, 184–187 (1987).
[13] D. Mumford, ‘‘On the computational architecture of the neocortex’’, Biolo-
gical Cybernetics, 65, 135–145 (1991).
[14] J. Moran and R. Desimone, ‘‘Selective attention gates visual processing in
the extrastriate cortex’’, Science, 229, 782–784, (1985).
REFERENCES 81


4
CHAOTIC DYNAMICS
Gaurav S. PatelDepartment of Electrical and Computer Engineering, McMaster University,
Hamilton, Ontario, Canada
Simon HaykinCommunications Research Laboratory, McMaster University, Hamilton,
Ontario, Canada
4.1 INTRODUCTION
In this chapter, we consider another application of the extended Kalman
filter recurrent multilayer perceptron (EKF-RMLP) scheme: the modeling
of a chaotic time series or one that could be potentially chaotic.
The generation of a chaotic process is governed by a coupled set of
nonlinear differential or difference equations. The hallmark of a chaotic
process is sensitivity to initial conditions, which means that if the starting
point of motion is perturbed by a very small increment, the deviation in
83
Kalman Filtering and Neural Networks, Edited by Simon HaykinISBN 0-471-36998-5 # 2001 John Wiley & Sons, Inc.

the resulting waveform, compared to the original waveform, increases
exponentially with time. Consequently, unlike an ordinary deterministic
process, a chaotic process is predictable only in the short term.
Specifically, we consider five data sets categorized as follows:
� The logistic map, Ikeda map, and Lorenz attractor, whose dynamics
are governed by known equations; the corresponding time series can
therefore be numerically generated by using the known equations of
motion.
� Laser intensity pulsations and sea clutter (i.e., radar backscatter from
an ocean surface) whose underlying equations of motion are
unknown; in this second case, the data are obtained from real-life
experiments.
Table 4.1 shows a summary of the data sets used for model validation.
The table also shows the lengths of the data sets used, and their division
into the training and test sets, respectively. Also shown is a partial
summary of the dynamic invariants for each of the data sets used and
the size of network used for modeling the dynamics for each set.
4.2 CHAOTIC (DYNAMIC) INVARIANTS
The correlation dimension is a measure of the complexity of a chaotic
process [1]. This chaotic invariant is always a fractal number, which is one
reason for referring to a chaotic process as a ‘‘strange’’ attractor. The other
Table 4.1 Summary of data sets used in the study
Network
size
Training
length
Testing
length
Sampling
frequency
fsðHzÞ
Largest
Lyapunov
exponent
lmax
(nats=sample)
Correlation
dimension
DML
Logistic 6-4R-2R-1 5,000 25,000 1 0.69 1.04
Ikeda 6-6R-5R-1 5,000 25,000 1 0.354 1.51
Lorenz 3-8R-7R-1 5,000 25,000 40 0.040 2.09
NH3 laser 9-10R-8R-1 1,000 9,000 1a 0.147 2.01
Sea clutter 6-8R-7R-1 40,000 10,000 1000 0.228 4.69
aThe sampling frequency for the laser data was not known. It was assumed to be 1 Hz for the
Lyapunov exponent calculations.
84 4 CHAOTIC DYNAMICS
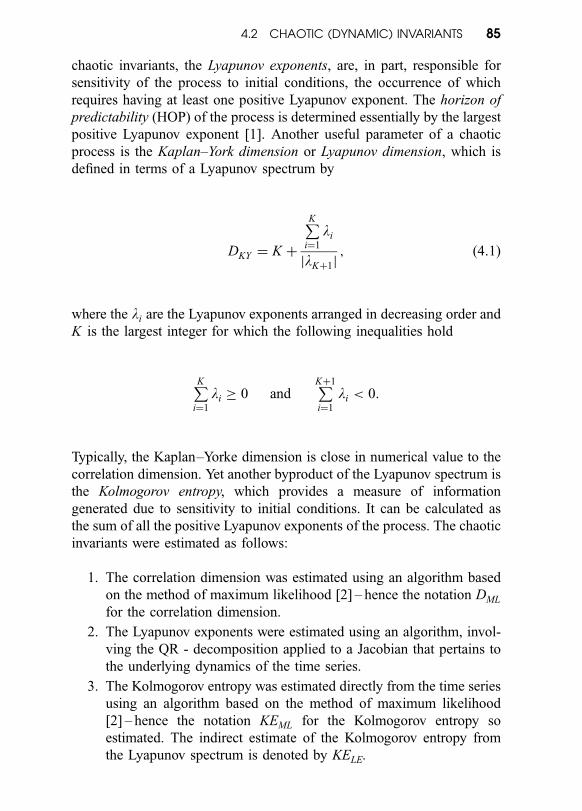
chaotic invariants, the Lyapunov exponents, are, in part, responsible for
sensitivity of the process to initial conditions, the occurrence of which
requires having at least one positive Lyapunov exponent. The horizon of
predictability (HOP) of the process is determined essentially by the largest
positive Lyapunov exponent [1]. Another useful parameter of a chaotic
process is the Kaplan–York dimension or Lyapunov dimension, which is
defined in terms of a Lyapunov spectrum by
DKY ¼ K þ
PK
i¼1
li
jlKþ1j; ð4:1Þ
where the li are the Lyapunov exponents arranged in decreasing order and
K is the largest integer for which the following inequalities hold
PK
i¼1
li � 0 andPKþ1
i¼1
li < 0:
Typically, the Kaplan–Yorke dimension is close in numerical value to the
correlation dimension. Yet another byproduct of the Lyapunov spectrum is
the Kolmogorov entropy, which provides a measure of information
generated due to sensitivity to initial conditions. It can be calculated as
the sum of all the positive Lyapunov exponents of the process. The chaotic
invariants were estimated as follows:
1. The correlation dimension was estimated using an algorithm based
on the method of maximum likelihood [2] – hence the notation DML
for the correlation dimension.
2. The Lyapunov exponents were estimated using an algorithm, invol-
ving the QR - decomposition applied to a Jacobian that pertains to
the underlying dynamics of the time series.
3. The Kolmogorov entropy was estimated directly from the time series
using an algorithm based on the method of maximum likelihood
[2] – hence the notation KEML for the Kolmogorov entropy so
estimated. The indirect estimate of the Kolmogorov entropy from
the Lyapunov spectrum is denoted by KELE.
4.2 CHAOTIC (DYNAMIC) INVARIANTS 85

4.3 DYNAMIC RECONSTRUCTION
The attractor of a dynamical system is constructed by plotting the
evolution of the state vector in state space. This construction is possible
when we have access to every state variable of the system. In practical
situations dealing with dynamical systems of unknown state-space equa-
tions, however, all that we have available is a set of measurements taken
from the system. Given such a situation, we may raise the following
question: Is it possible to reconstruct the attractor of a system (with many
state variables) using a single time series of measurements? The answer to
this question is an emphatic yes; it was first illustrated by Packard et al.
[3], and then given a firm mathematical foundation by Takens [4] and
Mane [5]. In essence, the celebrated Takens embedding theorem guaran-
tees that by applying the delay coordinate method to the measurement
time series, the original dynamics could be reconstructed, under certain
assumptions. In the delay coordinate method (sometimes referred to as the
method of delays), delay coordinate vectors are formed using time-delayed
values of the measurements, as shown here:
sðnÞ ¼ ½sðnÞ; sðn tÞ; . . . ; sðn ðdE 2ÞtÞ; sðn ðdE 1ÞtÞT ;
where dE is called the embedding dimension and t is known as the
embedding delay, taken to be some suitable multiple of the sampling time
ts. By means of such an embedding, it is possible to reconstruct the true
dynamics using only one measurement. Takens’ theorem assumes the
existence of dE and t such that mapping from sðnÞ to sðn þ tÞ is possible.
The concept of dynamic reconstruction using delay coordinate embedding
is very elegant, because we can use it to build a model of a nonlinear
dynamical system, given a set of measured data on the system. We can use
it to ‘‘reverse-engineer’’ the dynamics, i.e., use the time series to deduce
characteristics of the physical system that was responsible for its genera-
tion. Put it another way, the reconstruction of the dynamics from a time
series is in reality an ill-posed inverse problem. The direct problem is:
given the dynamics, describe the iterates; and the inverse problem is: given
the iterates, describe the dynamics. The inverse problem is ill-posed
because, depending on the quality of the data, a solution may not be
stable, may not be unique, or may not even exist. One way to make the
problem well-posed is to include prior knowledge about the input–output
mapping. In effect, the use of delay coordinate embedding inserts some
prior knowledge into the model, since the embedding parameters are
determined from the data.
86 4 CHAOTIC DYNAMICS

To estimate the embedding delay t, we used the method of mutual
information proposed by Fraser [6]. According to this method, the
embedding delay is determined by finding the particular delay for which
the mutual information between the observable time series and its delayed
version is minimized for the first time. Given such an embedding delay, we
can construct a delay coordinate vector whose adjacent samples are as
statistically independent as possible.
To estimate the embedding dimension dE, we use the method of false
nearest neighbors [1]; the embedding dimension is the smallest integer
dimension that unfolds the attractor.
4.4 MODELING NUMERICALLY GENERATED CHAOTICTIME SERIES
4.4.1 Logistic Map
In this experiment, the EKF-RMLP-based modeling scheme is applied to
the logistic map (also known as the quadratic map), which was first used
as a model of population growth. The logistic map is described by the
difference equation:
xðk þ 1Þ ¼ axðkÞ½1 xðkÞ; ð4:2Þ
where the nonlinearity parameter a is chosen to be 4.0 so that the
produced behavior is chaotic. The logistic map exhibits deterministic
chaos in the interval a 2 (3.5699, 4]. An initial value of xð0Þ ¼ 0:5 was
used, and 35,000 points were generated, of which the first 5000 points
were discarded, leaving a data set of 30,000 samples. A training set,
consisting of the first 5000 samples, was used to train an RMLP on a one-
step prediction task by means of the EKF method. An RMLP configura-
tion of 6-4R-2R-1, which has a total of 61 weights including the bias
terms, was selected for this modeling problem. The training converged
after only 5 epochs and a sufficiently low MSE was achieved as shown in
Figure 4.1.
Open-Loop Evaluation A test set, consisting of the unexposed
25,000 samples, was used to evaluate the performance of the network at
the task of one-step prediction as well as recursive prediction. Figure 4.2a
shows the one-step prediction performance of the network on a short
portion of the test data. It is visually observed that the two curves are
4.4 MODELING NUMERICALLY GENERATED CHAOTIC TIME SERIES 87

almost identical. Also, for numerical one-step performance evaluation,
signal-to-error ratio (SER) is used. This measure, expressed in decibels, is
defined by
SER ¼ 10 log10
MSS
MSE; ð4:3Þ
where MSS is the mean-squared value of the actual test data and MSE is
the mean-squared value of the prediction error at the output. MSS is found
to be 0.374 for the 25,000-testing sequence and MSE is found to be
1:09 � 105 for the trained RMLP network prediction error. This gives an
SER of 45.36 dB, which is certainly impressive because it means that the
power of the one-step prediction error over 25,000 test samples is many
times smaller than the power of the signal.
Closed-Loop Evaluation To evaluate the autonomous behavior of
the network, its node outputs are first initialized to zero, it is then seeded
with points selected from the test data, and then passed through a priming
phase where it operates in the one-step mode for pl ¼ 30 steps. At the end
of priming, the network’s output is fed back to its input, and autonomous
Figure 4.1 Training MSE versus epochs for the logistic map.
88 4 CHAOTIC DYNAMICS

Fig
ure
4.2
Re
sults
for
the
dyn
am
icre
co
nst
ruc
tio
no
fth
elo
gis
tic
ma
p.
(a)
On
e-s
tep
pre
dic
tio
n.
(b)
Ite
rate
dp
red
ictio
n.
(c)
Att
rac
tor
of
orig
ina
lsi
gn
al.
(d)
Att
rac
tor
of
ite
rativ
ely
rec
on
stru
cte
dsi
gn
al.
89

operation begins. At this point, the network is operating on its own
without further inputs, and the task that is asked of the network is indeed
challenging. The autonomous behavior of the network, which begins after
priming, is shown in Figure 4.2b, and it is observed that the predictions
closely follow the actual data for about 5 steps on average [which is close
to the theoretical horizon of predictability (HOP) of 5 calculated from the
Lyapunov spectrum], after which they start to deviate significantly. Figure
4.3 plots the one-step prediction of the logistic map for three different
starting points
The overall trajectory of the predicted signal, in the long term, has a
structure that is very similar to the actual logistic map. The similarity is
clearly seen by observing their attractors, which are shown in Figures 4.2c
and 4.2d. For numerical autonomous performance evaluation, the dyna-
mical invariants of both the actual data and the model-generated data are
compared in Table 4.2. For the logistic map, dL ¼ 1; it therefore has only
one Lyapunov exponent, which happens to be 0.69 nats=sample. This
means that the sum of Lyapunov exponents is not negative, thus violating
one of the conditions in the Kaplan–Yorke method, and it is for this reason
that the Kaplan–Yorke dimension DKY could not be calculated. However,
by comparing the other calculated invariants, it is seen that the Lyapunov
exponent and the correlation dimension of the two signals are in close
agreement with each other. In addition, the Kolmogorov entropy values for
the two signals also match very closely. The theoretical horizons of
predictability of the two signals are also in agreement with each other.
These results demonstrate very convincingly that the original dynamics
have been accurately modeled by the trained RMLP. Furthermore, the
robustness of the model is tested by starting the predictions from various
locations on the test data, corresponding to indices of N0 ¼ 3060, 5060,
and 10,060. The results, shown in Figure 4.4, clearly indicate that the
RMLP network is able to reconstruct the logistic series beginning from
any location, chosen at random.
Table 4.2 Comparison of chaotic invariants of logistic map
KELE KEML
l1
Time series dE t dL DML DKY (nats=sample) (nats=sample) HOP
(samples)
Actual logistic 6 5 1 1.04 —a 0.69 0.69 0.64 5
Reconstructed 6 12 1 1.00 —a 0.61 0.61 0.65 6
aSince the sum of Lyapunov exponents is not negative, DKY could not be calculated.
90 4 CHAOTIC DYNAMICS

4.4.2 Ikeda Map
This second experiment uses the Ikeda map (which is substantially more
complicated than the logistic map) to test the performance of the EKF-
RMLP modeling scheme. The Ikeda map is a complex-valued map and is
generated using the following difference equations:
mðkÞ ¼ 0:4 6:0
1 þ x21ðkÞ þ x2
2ðkÞ; ð4:4Þ
x1ðk þ 1Þ ¼ 1:0 þ mfx1ðkÞ cos½mðkÞ x2ðkÞ sin½mðkÞg; ð4:5Þ
x2ðk þ 1Þ ¼ 1:0 þ mfx1ðkÞ þ x2ðkÞ cos½mðkÞg; ð4:6Þ
where x1 and x2 are the real and imaginary components, respectively, of x
and the parameter m is carefully chosen to be 0.7 so that the produced
behavior is chaotic. The initial values of x1ð0Þ ¼ 0:5 and x2ð0Þ ¼ 0:5 were
selected and, as pointed out earlier, a data set of 30,000 samples was
Figure 4.3 One-step prediction of logistic map from different startingpoints. Note that A ¼ initialization and B ¼ one-step phase.
4.4 MODELING NUMERICALLY GENERATED CHAOTIC TIME SERIES 91

generated. In this experiment, only the x1 component of the Ikeda map is
used, for which the embedding parameters of dE ¼ 6 and t ¼ 10 were
determined. The first 5000 samples of this data set were used to train an
RMLP with the EKF algorithm at one-step prediction. During training, a
truncation depth td ¼ 10 was used for the backpropagation through-time
(BPTT) derivative calculations. The RMLP configuration of 6-6R-5R-1,
which has a total of 144 weights including the bias terms, was chosen to
model the Ikeda series. The training converged after only 15 epochs, and a
sufficiently low incremental training mean-squared error was achieved, as
shown in Figure 4.5.
Open-Loop Evaluation The test set, consisting of the unexposed
25,000 samples of data, is used for performance evaluation, and Figure
4.6a shows one-step performance of the network on a short portion of the
test data. It is indeed difficult to distinguish between the actual and
predicted signals, thus visually verifying the goodness of the predictions.
Figure 4.4 Iterative prediction of logistic map from different starting points,corresponding to N0 ¼ 3060, 5060, and 10,060, respectively, with pl ¼ 30.Note that A ¼ initialization, B ¼ priming phase, and C ¼ autonomous phase.
92 4 CHAOTIC DYNAMICS

For a numerical measure, the mean-squared value of the 25,000 sample
Ikeda test series was calculated to be MSS ¼ 0:564 and the mean-squared
prediction error of MSE ¼ 1:4 � 104 was produced by the trained
RMLP network, thus giving an SER of 36.02 dB.
Closed-Loop Evaluation To begin autonomous prediction, a delay
vector consisting of 6 taps spaced by 10 samples apart is constructed as
dictated by the embedding parameters dE and t. The RMLP is initialized
with a delay vector, constructed from the test samples, and passed through
a priming phase with pl ¼ 60, after which the network operates in closed-
loop mode. The autonomous continuation from where the training data
end is shown in Figure 4.6b. Note that the predictions follow closely for
about 10 steps on average, which is in agreement with the theoretical
horizon of predictability of 11 calculated by from the Lyapunov spectrum.
A length of 25,000 autonomous samples were generated using the trained
EKF-RMLP model, and the reconstructed attractor is plotted in Figure
4.6d. The reconstructed attractor has exactly the same form as the original
attractor, which is plotted in Figure 4.6c using the actual Ikeda samples.
These figures clearly demonstrate that the RMLP network has captured the
underlying dynamics of the Ikeda map series. For numerical performance
Figure 4.5 Training MSE versus epochs for the Ikeda map.
4.4 MODELING NUMERICALLY GENERATED CHAOTIC TIME SERIES 93

Fig
ure
4.6
Re
sults
for
the
dyn
am
icre
co
nst
ruc
tio
no
fth
eIk
ed
am
ap
.(a
)O
ne
-ste
pp
red
ictio
n.
(b)
Ite
rate
dp
red
ictio
n.
(c)
Att
rac
tor
of
orig
ina
lsi
gn
al.
(d)
Att
rac
tor
of
ite
rativ
ely
rec
on
stru
cte
dsi
gn
al.
94

evaluation, the correlation dimension, Lyapunov exponents and Kolmo-
gorov entropy of both the actual Ikeda series and the autonomously
generated samples are calculated. Table 4.3, which summarizes the results,
shows that the dynamic invariants of both the actual and reconstructed
signals are in very close agreement with each other. This illustrates that the
true dynamics of the data were captured by the trained network. Figure 4.7
plots the one-step prediction of the Ikeda map for three different starting
points. The reconstruction produced here is robust and stable, regardless
of the position of the initializing delay vector on the test data, as
demonstrated in Figure 4.8, which shows autonomous operation starting
at indices of N0 ¼ 3120, 10,120, and 17,120, respectively.
Noisy Ikeda Series It was shown above that the noise-free Ikeda
series can be modeled by the RMLP scheme. In a real environment,
observables signals are usually corrupted by additive noise, which makes
the problem more difficult. Thus, to make the modeling task more
challenging than it already is, computer-generated noise is added to the
Ikeda series such that the resulting signal-to-noise ratios (SNRs) of two
sets of the noisy observables signals are 25 dB and 10 dB, respectively.
Figure 4.7 One-step prediction of Ikeda series from different starting points.Note that A ¼ initialization and B ¼ one-step phase.
4.4 MODELING NUMERICALLY GENERATED CHAOTIC TIME SERIES 95

The attractors of the noisy signals are shown in the left-hand parts of
Figures 4.9a and 4.9b, respectively. The increase in noise level was more
substantial for the 10 dB case, and this corrupted the signal very
significantly. It is apparent from Figure 4.9b that the intricate details of
the attractor trajectories are lost owing to the high level of noise.
The noisy signals were used to train two distinct 6-6R-5R-1 networks
using the first 5000 samples in the same fashion as in the noise-free case.
The right-hand plots of Figures 4.9a and 4.9b show the attractors of the
autonomously generated Ikeda series produced by the two trained RMLP
networks. Whereas the network trained with a 25 dB SNR was able to
capture the Ikeda dynamics, the network trained with a 10 dB SNR was
unable to do so. This shows that because of the substantial amount of
noise in the 10 dB case, the network was unable to capture dynamics of the
Ikeda series. However, for the 25 dB case, the network was not only able
to capture the predictable part of the Ikeda series but also filtered the
noise. Table 4.3 displays the chaotic invariants of the original and
Figure 4.8 Iterative prediction of Ikeda series from different starting points,corresponding to indices of N0 ¼ 3120, 10,120 and 17,120, respectively, withpl ¼ 60. Note that A ¼ initialization, B ¼ priming phase and C ¼ auto-nomous phase.
96 4 CHAOTIC DYNAMICS

Tab
le4.
3C
om
pa
riso
no
fc
ha
otic
inva
rian
tso
fIk
ed
am
ap
un
de
rn
ois
ele
ssa
nd
no
isy
co
nd
itio
ns
l 1l 2
l 3l 4
l 5l 6
KE
LE
KE
ML
HO
P
Tim
ese
ries
dE
td
LD
ML
DK
Y(n
ats=
sam
ple
)(n
ats=
sam
ple
)(s
amp
les)
Act
ual
Iked
a6
10
21
.51
1.4
40
.35
4
0.8
02
——
——
0.3
54
0.3
16
11
Rec
on
stru
cted
61
92
1.6
81
.33
0.2
48
0
.73
6—
——
—0
.24
80
.34
71
6
25
dB
SN
RIk
eda
61
51
.92
3.9
0.3
54
0.0
76
0
.08
1
0.2
96
0
.76
5—
0.3
54
80
.31
41
4
Rec
on
stru
cted
61
53
1.5
42
.15
0.2
48
0
.14
0
.79
2—
——
0.2
62
0.3
04
15
10
dB
SN
RIk
eda
66
63
.46
—a
1.1
45
0.9
48
0.7
78
0.5
43
0.2
15
0.4
95
0.3
63
0.6
62
3
Rec
on
stru
cted
62
30
.26
—a
3
.47
6
.01
3
.47
——
——
a—
a—
a
aQ
uan
titi
esth
atco
uld
no
tb
eca
lcu
late
d.
97

reconstructed signals for both levels of noise. The addition of noise has the
effect of increasing the number of active degrees of freedom, and thus the
number of Lyapunov exponents increases in a corresponding way. The
invariants of the reconstructed signal corresponding to the 25 dB SNR
case match more closely with the original noise-free Ikeda invariants as
compared with the noisy invariants. However, for the failed reconstruction
in the 10 dB case, there is a large disagreement between the reconstructed
invariants and the actual invariants, which is to be expected. In fact, some
of the invariants could not even be calculated.
Figure 4.9 Dynamic reconstruction of the noisy Ikeda map. (a) Autono-mous performance for Ikeda map with 25 dB SNR. (b) Autonomous perfor-mance for Ikeda map with 10 dB SNR. Plots on the left to noisy originalsignals, and those on the right to reconstructed signals.
98 4 CHAOTIC DYNAMICS

Evaluation of one-step prediction for the more challenging noisy cases
was also done. Table 4.4 summarizes the one-step SER results collected
over a number of distinct test cases. For example, the first column of the
table shows how a network trained with clean training data performs on
test data with various levels of noise. It is important to note that it is
difficult to achieve an SER larger than the SNR of the test data. The best
overall generalization results are obtained when the network is trained
with 25 dB SNR.
4.4.3 Lorenz Attractor
The Lorenz attractor is more challenging than the Ikeda or logistic map; it
is described by a coupled set of three nonlinear differential equations:
_xx ¼ s½ yðnÞ xðnÞ; ð4:7aÞ
_yy ¼ xðnÞ½r zðnÞ yðnÞ; ð4:7bÞ
_zz ¼ xðnÞyðnÞ bzðnÞ; ð4:7cÞ
where the fixed parameters r ¼ 45:92, s ¼ 16, and b ¼ 4 are used, and _xxmeans the derivative of x with respect to time t. As before, a data set of
30,000 samples was generated at 40 Hz, of which the first 5000 samples
were used to train the RMLP model and the remaining 25,000 were used
for testing. For the experimental Lorenz series, an embedding dimension
of dE ¼ 3 and a delay of t ¼ 4 were calculated. An RMLP network
configuration of 3-8R-7R-1, consisting of 216 weights including the
biases, was trained with the EKF algorithm, and the convergence of the
training MSE is shown in Figure 4.10.
Open-Loop Evaluation The results shown in Figure 4.11 were
arrived at in only 10 epochs of working through the training set. The
Table 4.4 SER results for several test cases for the Ikeda series
Training noise
Testing noise Clean 25 dB SNR 10 dB SNR
Clean 36.0 27.1 16.3
25 dB SNR 14.1 18.1 14.9
10 dB SNR 1.7 5.8 6.6
4.4 MODELING NUMERICALLY GENERATED CHAOTIC TIME SERIES 99

plot of one-step prediction over a portion of the test data is depicted in
Figure 4.11a. The one-step MSE over 25,000 samples of test data was
calculated to be 1:57 � 105, which corresponds to an SER value of
40.2 dB.
Closed-Loop Evaluation The autonomous continuation, from where
the test data end, is shown in Figure 4.11b, which demonstrates that the
network has learned the dynamics of the Lorenz attractor very well. The
iterated predictions follow the trajectory very closely for about 80 time
steps on average, and then demonstrate chaotic divergence, as expected.
This is in close agreement with the theoretical horizon of predictability of
97 calculated from the Lyapunov spectrum. A further testament to the
success of the EKF-RMLP model is that the reconstructed attractor, shown
in Figure 4.11d, is similar in shape to the attractor of the original series,
which is shown in Figure 4.11c, demonstrating that the network has
indeed captured the dynamics well. In addition, the dynamic invariants of
the original and reconstructed series are compared in Table 4.5, which
shows close agreement between their respective correlation dimension,
Lyapunov spectrum, and Kolmogorov entropy, thus indicating the strong
presence of the original dynamics in the reconstructed signal. Figure 4.12
Figure 4.10 Training MSE versus epochs for the Lorenz series.
100 4 CHAOTIC DYNAMICS

Fig
ure
4.11
Re
sults
for
the
dyn
am
icre
co
nst
ruc
tio
no
fth
eLo
ren
zse
ries.
(a)
On
e-s
tep
pre
dic
tio
n.
(b)
Ite
rate
dp
red
ictio
n.
(c)
Att
rac
tor
of
orig
ina
lsi
gn
al.
(d)
Att
rac
tor
of
ite
rativ
ely
rec
on
stru
cte
dsi
gn
al.
101

Tab
le4.
5C
om
pa
riso
no
fc
ha
otic
inva
rian
tso
fLo
ren
zse
ries
l 1l 2
l 3l 4
l 5l 6
l 7K
EL
EK
EM
L
HO
P
Tim
ese
ries
dE
td
LD
ML
DK
Y(n
ats=
sam
ple
)(n
ats=
sam
ple
)(s
amp
les)
Act
ual
Lo
ren
z3
43
2.0
92
.03
0.0
40
0
.00
05
1
.28
6—
——
—0
.04
00
.04
29
7
Rec
on
stru
cted
34
31
.99
2.2
60
.05
0
0.0
00
9
0.1
82
8—
——
—0
.05
00
.03
77
8
25
dB
SN
RL
ore
nz
54
42
.84
3.7
50
.48
90
.24
9
0.0
92
0
.85
0—
——
0.7
38
0.1
51
8
Rec
on
stru
cted
34
32
.00
2.1
10
.03
9
0.0
06
0
.30
3—
——
—0
.03
90
.02
29
9
10
dB
SN
RL
ore
nz
71
47
7.1
86
.71
1.5
54
0.4
19
0.2
69
0.1
09
0
.10
0
.44
2
1.1
28
1.3
51
.06
7
Rec
on
stru
cted
35
31
.84
2.1
80
.06
20
.00
3
0.3
60
——
——
0.0
65
0.0
24
63
102

plots one-step predictions of the Lorenz time series for three different
starting points. The reconstruction of the Lorenz series was indeed very
robust and stable, regardless of the starting position on the test series, as
demonstrated in Figure 4.13, which shows autonomous operation starting
at indices of N0 ¼ 3042, 10,042, and 17,042, respectively.
Noisy Lorenz Series To make the problem even more challenging than
it already is, a significant level of noise was added to the clean Lorenz
series just as was done for the Ikeda map. An RMLP network architecture
was selected similar to the noise-free case, and two distinct networks were
trained using the noisy Lorenz signals with 25 dB SNR and 10 dB SNR,
respectively. The networks were trained with a learning rate of pr ¼ 0:001
for 15 epochs through the first 5000 samples, as was done for the noise-
free case. Then, both one-step prediction and autonomous prediction
results were obtained with the remaining unexposed 25,000 samples.
Figures 4.14a and 4.15b show that excellent dynamic reconstruction of the
Lorenz series was possible even in the presence of 25 dB and 10 dB SNR,
Figure 4.12 One-step prediction of Lorenz series from different startingpoints. Note that A ¼ initialization and B ¼ one-step phase.
4.4 MODELING NUMERICALLY GENERATED CHAOTIC TIME SERIES 103

respectively, despite the fact that the additive noise corrupts the attractors
considerably. Moreover, comparison of the dynamic invariants of the noisy
and reconstructed signals in Table 4.5 reveals that the reconstructed
signals and their invariants are reasonably close to the noise-free signal
and the iterated predictions are smoother in comparison to the noisy
signals, as shown in Figs. 4.15a and 4.15b.
It was shown earlier that dynamic reconstruction of the Ikeda map was
not possible for the case of 10 dB SNR. In order to explain this, the
normalized frequency spectra of both the Ikeda map and Lorenz series are
plotted in Figure 4.16. This figure illustrates how much more significantly
the Ikeda spectrum is corrupted by 10 dB noise as compared with the
Lorenz spectrum. Whereas the Ikeda spectrum is completely drowned at
10 dB SNR, the Lorenz spectrum is still discernible, and as such its
dynamic reconstruction was possible. Another way of explaining the
Figure 4.13 Iterative prediction of Lorenz series from different startingpoints, corresponding to indices of N0 ¼ 3042, 10,042, and 17,042, respec-tively with pl ¼ 30. Note that A ¼ initialization, B ¼ priming phase, andC ¼ autonomous phase.
104 4 CHAOTIC DYNAMICS

reason for the robust behavior of the Lorenz attractor to the presence of
additive noise is to recall that the correlation dimension of the Lorenz
attractor is greater than that of the Ikeda map; see Table 4.1. Accordingly,
the Lorenz attractor is more complex than the Ikeda map – hence the
greater robustness of the Lorenz attractor to noise.
Evaluation of one-step performance for the more challenging noisy
cases was also done. Table 4.6 summarizes the one-step SER results
collected over a number of distinct test cases. For example, the first
column of the table shows how a network trained with clean training data
performs on test data with various levels of noise. The best overall
generalization results are obtained when the network is trained with
25 dB SNR.
Figure 4.14 Dynamic reconstruction of the noisy Lorenz series. (a) Autono-mous performance for Lorenz series with 25 dB SNR. (b) Autonomousperformance for Lorenz series with 10 dB SNR. Plots on the left pertain tothe original data, and those on the right to reconstructed data.
4.4 MODELING NUMERICALLY GENERATED CHAOTIC TIME SERIES 105

4.5 NONLINEAR DYNAMIC MODELING OF REAL-WORLDTIME SERIES
4.5.1 Laser Intensity Pulsations
In the first experiment with real-world data, a series recorded from a far-
infrared laser in a chaotic state is used. This data set was provided as part
of a data package used in the Santa Fe Institute Time Series Prediction and
Analysis Competition [7]. During the time of the competition, only the
first 1000 samples were provided, and the goal was to predict the following
Figure 4.15 Iterative prediction of noisy Lorenz series with (a) 25 dB and (b)10 dB SNR. Note that A ¼ initialization, B ¼ priming phase and C ¼ auto-nomous phase.
106 4 CHAOTIC DYNAMICS

100 samples as accurately as possible. Now, however, the full data set
consisting of 10,000 samples is available. The first 1100 samples are
plotted in Figure 4.17. The data consist of high-frequency pulsations,
which gradually rise in amplitude and suddenly collapse from a high to
low amplitude. The rapid decays of oscillations in this data set occur with
no periodicity, and are a challenge to model. During these collapses, the
Figure 4.16 Lorenz and Ikeda series: normalized frequency spectra.
Table 4.6 SER results for several test cases for the Lorenz series
Training noise
Testing noise Clean 25 dB SNR 10 dB SNR
Clean 40.2 30.5 36.8
25 dB SNR 17.8 23.1 17.2
10 dB SNR 3.5 9.3 3.8
4.5 NONLINEAR DYNAMIC MODELING 107

signal abruptly jumps from one region of the attractor to another distinct
region, and these transitions are the most difficult parts of this series to
model.
To remain consistent with what was done in the SFI competition, only
the first 1000 samples were presented to the network, while the remaining
9000 samples of data were reserved for testing purposes and not shown to
the network. The optimal embedding delay was found to be t ¼ 2 and the
embedding dimension to be dE ¼ 9. A network architecture of 9-10R-8R-
1, consisting of 361 weights including the biases, was used to model this
data. The network was trained through the first 1000 points for 50 epochs.
Open-Loop Evaluation The network makes excellent one-step
predictions as shown in Figure 4.18a, with very low prediction errors in
most regions. The accuracy of prediction drops slightly during the sudden
signal collapses, but then increases quickly as the network adapts. The
SER value for the one-step prediction performance on the unexposed 9000
samples of the test set was calculated to be 26.05 dB.
Closed-Loop Evaluation The iterated predictions of the network are
also very remarkable. The autonomous continuation from sample 1000,
where the training data end, is shown in Figure 4.18b. This was achieved
by first initializing the network with a delay vector, consisting of 9 taps,
each spaced 2 samples apart, from the beginning of the training set and
then priming for pl ¼ 982 steps, after which the network operates in an
autonomous mode. Since the network was initialized with the first samples
of the actual data, autonomous operation does not begin until the point
ð9 � 2Þ þ 982 ¼ 1000, as shown in Figure 4.19. The autonomous output
of the network closely follows the original series for about 60 steps (which
is higher than the average horizon of predictability of 26 calculated from
the Lyapunov spectrum) after which it begins to diverge. Figure 4.20
shows the one-step prediction of the laser time series with three different
starting points.
Figure 4.17 First 1100 samples of original laser series.
108 4 CHAOTIC DYNAMICS

Fig
ure
4.18
Re
sults
of
the
dyn
am
icre
co
nst
ruc
tio
no
fth
ela
ser
serie
s.(a
)O
ne
-ste
pp
red
ictio
n.
(b)
Ite
rate
dp
red
ictio
n.
(c)
Att
rac
tor
of
orig
ina
lsi
gn
al.
(d)
Att
rac
tor
of
ite
rativ
ely
rec
on
stru
cte
dsi
gn
al.
109

Figure 4.21 shows that the network is capable of stable and robust
reconstruction even when it is initialized from different starting points on
the test set, corresponding to indices of N0 ¼ 48, 1048, and 4048,
respectively. Note that the network has not seen this data set before, and
is still able to predict the signal collapses up to an impressive degree of
accuracy. Figure 4.22, which shows the 9000-sample iterated output of the
network, demonstrates that the chaotic pulsations have been learned by the
Figure 4.19 Iterated prediction of the laser data beginning at sample 1000,using pl ¼ 982. Note that A ¼ initialization, B ¼ priming phase, and C¼
autonomous phase. Phase C is enlarged in Figure 4.18b.
Figure 4.20 One-step prediction of laser series with different starting points.Note that A ¼ initialization and B ¼ one-step phase.
110 4 CHAOTIC DYNAMICS

network from just the first 1000 samples. The attractor of the original
series is plotted in Figure 4.18c using the actual laser data. The attractor in
Figure 4.18d is plotted using the reconstructed points as produced by the
trained RMLP network. It is clear from the attractor of the reconstructed
signal that the dynamics of the laser data has been faithfully captured by
the EKF trained RMLP network. Table 4.7 shows that the correlation
dimension, Lyapunov exponents, and Kolmogorov entropy of the recon-
structed signal are in close agreement with those obtained from the
original data, thus indicating a faithful reconstruction of the original
dynamics. The correlation dimension of NH3 laser pulsations calculated
here is consistent with what is reported by Hubner et al. [8].
Longer Training Length In another experiment, the same-sized
network was trained on the first 5000 points, as compared with the first
1000 used above. The iterated output produced by the network is shown
in Figure 4.23. Since the network was exposed to more of the signal
Figure 4.21 Iterative prediction of laser series from different starting points,corresponding to indices of N0 ¼ 48, 1048, and 4048, respectively, withpl ¼ 30. Note that A ¼ initialization, B ¼ printing phase, and C ¼ auto-nomous phase.
4.5 NONLINEAR DYNAMIC MODELING 111

Figure 4.22 9000 samples of iterated output of the RMLP trained on the first1000 samples.
Table 4.7 Comparison of chaotic invariants of laser series
l1 l2 l3 KELE KEML
HOP
Time series dE t dL DML DKY (nats=sample) (nats=sample) (samples)
Actual laser 9 2 3 2.01 2.19 0.147 0.039 0.547 0.147 0.195 26
Reconstructed 9 2 3 1.90 2.13 0.115 0.037 0.602 0.115 0.133 34
Figure 4.23 9000 samples of iterated output of the RMLP trained on the first5000 samples.
Figure 4.24 Last 9000 samples of the actual laser series.
112 4 CHAOTIC DYNAMICS

dynamics, in this case, the iterated output of the network demonstrates
more frequent chaotic collapses and is closer in appearance to the actual
signal shown in Figure 4.24.
4.5.2 Sea Clutter Data
Sea clutter, or sea echo, refers to the radar backscatter from an ocean
surface. Radars operating in a maritime environment have a serious
limitation imposed on their performance by unwanted sea clutter. There-
fore, a problem of fundamental interest in the radar literature is the
modeling of sea clutter to design optimum target detectors.
For many years, clutter echoes in radar systems were modeled as a
stochastic process. However, in recent years, some researchers have
concluded that the generation of sea clutter is governed by deterministic
chaos [9 – 13]. These claims, in varying degrees, have been largely based
on the estimation of chaotic invariants of sea clutter, namely, the correla-
tion dimension, Lyapunov exponents, Kaplan-Yorke dimension, and the
Kolmogorov entropy, the latter two are derived from the Lyapunov
exponents. But, recently, serious concerns have been raised on the
discriminative power of the state-of-the-art algorithms currently available
for distinguishing between sea clutter and different forms of surrogate data
derived from the original data; the surrogate data are known to be
stochastic by purposely introducing randomization into their generation.
By estimating the correlation dimension and Lyapunov exponents, it is
found that there is little difference between the chaotic invariants of sea
clutter and those of their surrogate counterparts [14, 15], which casts doubt
on deterministic chaos being the nonlinear dynamical model foe sea clutter.
In [14], it is pointed out physical realities dictate the presence of noise
not just in the measurement equation (owing to instrument errors) but also
in the process equation (owing to the rate of variability of the forces
affecting the ocean dynamics). According to Sugihara [16], there is
unavoidable practical difficulty in disentangling the process noise from
the measurement noise when we try to reconstruct an invariant measure
such as the Lyapunov exponents. This may explain the reason for the
inability of chaotic-invariant estimation algorithms to distinguish between
sea clutter and its surrogates.
Our primary interest in this chapter is in dynamic reconstruction. In this
context, we may raise the following question: Can the EKF-RMLP be
configured to perform dynamic reconstruction on sea clutter in a robust
manner? In what follows, an attempt to answer this question is presented;
4.5 NONLINEAR DYNAMIC MODELING 113

Tab
le4.
8C
om
pa
riso
no
fc
ha
otic
inva
rian
tso
fse
ac
lutt
er
l 1l 2
l 3l 4
l 5K
EL
EK
EM
L
HO
P
Tim
ese
ries
dE
td
LD
ML
DK
Y(n
ats=
sam
ple
)(n
ats=
sam
ple
)(s
amp
les)
Act
ual
sea
clu
tter
61
05
4.6
94
.42
0.2
28
0.1
02
0.0
05
0
.11
8
0.4
48
0.3
35
0.3
69
17
Rec
on
stru
cted
fro
m6
95
3.1
24
.51
0.2
14
0.0
78
0.0
10
0
.08
3
0.4
27
0.3
02
0.2
92
18
N2¼
0
Rec
on
stru
cted
fro
m7
65
3.5
84
.75
0.2
16
0.1
29
0.0
49
0
.11
2
0.3
73
0.3
94
0.3
03
18
N0¼
51
60
Rec
on
stru
cted
fro
m6
85
4.4
34
.62
0.2
32
0.1
36
0.0
23
0
.11
3
0.4
34
0.3
91
0.3
17
17
N0¼
61
60
Rec
on
stru
cted
fro
m6
65
3.6
74
.23
0.1
91
0.0
88
0.0
29
0
.14
2
0.7
13
0.3
08
0.2
20
20
N0¼
71
60
114

the answer has bearing on whether sea clutter is chaotic or not. Figure 4.25
shows the in-phase component of typical sea clutter, recorded by an
instrument-quality radar on the East Coast of Canada, with the radar
operating in a dwelling mode at a low grazing angle. The data consist of
50,000 samples, of which the first 40,000 are used for network training,
while the remaining 10,000 samples are reserved for testing. An embed-
ding dimension of dE ¼ 6 and embedding delay of t ¼ 10 were calculated
for sea clutter.
Open-Loop Evaluation The results for the modeling of sea clutter by
the EKF-RMLP method are shown in Figure 4.26. A 6-8R-7R-1 network
trained with pr ¼ 0:5 was used. The SER over the unexposed 10,000 test
samples was found to be 36.65 dB, which is certainly impressive, since in
the EKF-RMLP based method presented here, the synaptic weights
remain fixed after the training was completed.
Closed-Loop Evaluation The iterated continuation from where the
training data end, corresponding to an index of N0 ¼ 0, is shown in Figure
Figure 4.25 In-phase component of typical sea-clutter data.
4.5 NONLINEAR DYNAMIC MODELING 115

Fig
ure
4.26
Re
sults
for
the
dyn
am
icre
co
nst
ruc
tio
no
fse
ac
lutt
er.
(a)
On
e-s
tep
pre
dic
-tio
n.
(b)
Ite
rate
dp
red
ictio
n.
(c)
Att
rac
tor
of
orig
ina
lsi
gn
al.
(d)
Att
rac
tor
of
ite
rativ
ely
rec
on
stru
cte
dsi
gn
al.
116

4.26b. Observe that the prediction is close to the actual data for roughly
less than 10 steps (which is significantly less than the average theoretical
horizon of predictability of 17 calculated from the Lyapunov spectrum),
after which it diverges into a distinct trajectory of its own. The network,
when iterated in this fashion for several thousand steps, produces an
output whose attractor is plotted in Figure 4.26d. It is difficult to compare
the reconstructed attractor with the original attractor in Figure 4.26c
because we are looking at a five-dimensional attractor in three dimensions.
Since it is impossible to plot attractors in five dimensions, we may
determine the success of dynamic reconstruction by a numerical compar-
ison of the dynamic invariants of the reconstructed signal with those of the
actual signal. As shown in Table 4.8, the Lyapunov exponents of the
reconstructed signal are in close agreement with those obtained from the
actual data. In addition, the correlation dimension and Kolmogorov
entropy of both signals are also close, except for the slightly lower than
expected value of DML for the reconstructed signal. Furthermore, DKY and
Figure 4.27 One-step prediction of sea clutter from different starting points.Note that A ¼ initialization and B ¼ one-step mode of operation.
4.5 NONLINEAR DYNAMIC MODELING 117

KELE are close to DML and KEML, respectively. Figure 4.27 plots one-step
predictions of sea clutter for three different starting points.
Stability and Robustness Furthermore, the more difficult case of
autonomous prediction from different starting points chosen from the test
data is shown in Figure 4.28. This shows that stable reconstruction is also
possible from indices of N0 ¼ 5160, 6160, and 7160 on the test data. The
dynamic invariants calculated from signals reconstructed at these indices
are in close agreement with the actual Table 4.8. Again, there seems to be
a slight disagreement in the values of DML.
This shows that the EKF-RMLP scheme was able to reconstruct sea-
clutter dynamics on several occasions in a reasonable manner, depending
on the data used. However, it is important to point out that robust
reconstruction was not possible from all initialization points – for this
and other types of networks used. The different types of reconstruction
Figure 4.28 Iterative prediction of sea clutter from different starting points,corresponding to indices of N0 ¼ 5160, 6160, and 7160, respectively, withpl ¼ 100. Note that A ¼ initialization, B ¼ priming phase, and C ¼ auto-nomous phase.
118 4 CHAOTIC DYNAMICS

failures encountered are illustrated in Figure 4.29. In the first type of
reconstruction failure, the output becomes constant after a few steps. In
other words, the output behaves as a fixed-point attractor. In the second
type of failure, the output becomes periodic after a few time steps. In the
third type of failure, the output breaks down after a few steps of good
prediction. How do we explain the reconstruction failures of Figure 4.29?
Dynamic reconstruction, in accordance with Taken’s embedding theorem
tolerates a moderate level of measurement noise, but the process equation
has to be noise-free. The presence of dynamical noise in the process
equation is therefore in violation of Taken’s theorem — hence the
difficulty in devising a robust dynamic reconstruction system for sea
clutter.
4.6 DISCUSSION
Takens’ theorem provides the theoretical basis for an experimental
approach for the autoregressive modeling of a nonlinear dynamical
system. Specifically, the state evolution of the system with a d-dimen-
sional state space can be reconstructed by observing 2d þ 1 time lags of a
single output of the system for an arbitrary delay. The theorem requires
that the observable time series be noiseless and of infinite length.
Unfortunately, neither of these two conditions can be satisfied in practice.
To mitigate these difficulties, the recommended procedure is to do the
following:
� Use an ‘‘optimum’’ time delay for the delay coordinate method, for
which the adjacent samples are as statistically independent as
practically possible.
For the experimental study presented here, we minimized the mutual
information between the observable time series and its delayed version as
the basis for estimating the optimum time delay.
In this chapter, we have presented experimental results demonstrating
the ability of the EKF-RMLP scheme to reconstruct the dynamics of
chaotic processes in accordance with Takens’ embedding theorem. The
results presented for (1) the numerically generated logistic map, Ikeda
map, and Lorenz attractor, and (2) the experimentally generated laser
pulsations are indeed remarkable in that the reconstructed data closely
match all the important chaotic characteristics of the original time series.
Moreover, the dynamic reconstruction performed here is not only stable
4.6 DISCUSSION 119

120 4 CHAOTIC DYNAMICS

but also robust with respect to the choice of initial conditions and the
presence of additive noise.
The results of this study also show that dynamic reconstruction of sea
clutter is possible using the EKF-RMLP-based method depending on the
data set used, but unfortunately as the results obtained with the EKF-MLP
method were prone to numerous failures and therefore not as robust as one
would expect from a good model. The results of this study clearly
demonstrate that the dynamics of sea clutter is difficult to reconstruct.
We attribute the difficulty to the unavoidable presence of dynamical noise
in the process equation.
REFERENCES
[1] H.D.I. Abarbanel, Analysis of Observed Chaotic Data. New York: Springer-
Verlag, 1995.
[2] J.C. Schouten, F. Takens, and C.M. Van den Bleek, ‘‘Estimation of the
Dimension of a Noisy Attractor,’’ Physical Review A, 33, 1134 – 1140
(1994).
[3] N.H. Packard, J.P. Crutchfield, J.D. Farmer, and R.S. Shaw, ‘‘Geometry from
a time series,’’ Physical Review Letters, 45, 712 – 716 (1980).
[4] F. Takens, ‘‘Detecting Strange Actuators in Turbulence,’’ in D.A. Rand and
L.S. Young, Eds. Dynamical Systems and Turbulence, Warwick, 1980,
Lecture Notes in Mathematics, Vol. 898.
[5] R. Mane, ‘‘On the dimension of compact invariant sets of certain nonlinear
maps,’’ in D.A. Rand and L.S. Young, Eds. Dynamical Systems and
Turbulence, Warwick 1980, Lecture Notes in Mathematics Vol. 898. 1981,
p. 230. Berlin: Springer-Verlag.
[6] A.M. Fraser, ‘‘Information and entropy in strange attractors,’’ IEEE Transac-
tions on Information Theory 35, 245 – 262 (1989).
[7] A.S. Weigend, ‘‘Paradigm change in prediction,’’ Philosophical Transactions
of the Royal Society of London, Ser. A, 405 – 420 (1994).
[8] U. Hubner, W. Klische, and C.O. Weiss, ‘‘Generalized dimensions of laser
attractors,’’ Physical Review A, 45, 2128 – 2130 (1992).
Figure 4.29 Illustrative failure modes in iterative prediction of sea clutter byvarious networks. (a) Output converges to a constant (fixed point attractor);N0 ¼ 4160 and 160, respectively. (b) Output becomes periodic; N0 ¼ 7160.(c) Output breaks down after a few time steps; N0 ¼ 160 and 7160,respectively. Note that A ¼ initialization, B ¼ priming phase, and C ¼ auto-nomous phase.
<
REFERENCES 121

[9] S. Haykin and S. Puthusserypady, ‘‘Chaotic dynamics of sea clutter’’ Chaos,
7, 777 – 802 (1997).
[10] S. Haykin and Xiao bo Li, ‘‘Detection of signals in chaos,’’ Proceedings of
the IEEE, 83 (1995).
[11] H. Leung and S. Haykin, ‘‘Is there a Radar Clutter Attractor?’’ Appl. Phys.
Letters, 56, 393 – 395 (1990).
[12] H. Leung and T. Lo, ‘‘Chaotic Radar Signal-Processing Over the Sea,’’ IEEE
J. Oceanic Engineering, 18, 287 – 295 (1993).
[13] A.J. Palmer, R.A. Kropfli, and C.W. Fairall, ‘‘Signature of Deterministic
Chaos in Radar Sea Clutter and Ocean Surface Waves,’’ Chaos, 6, 613 – 616
(1995).
[14] S. Haykin, R. Bakker, and B. Currie, ‘‘Uncovering Nonlinear Dynamics: The
Case Study of Sea Clutter,’’ Proc. IEEE, under review.
[15] C.P. Unsworth, M.R. Cowper, B. Mulgrew, and S. McLaughlin, ‘‘False
Detection of Chaotic Behaviour in Stochastic Computed K-distribution
Model of Radar Sea Clutter,’’ IEEE Workshop on Statistical Signal and
Array Processing, pp. 296 – 300 (2000).
[16] G. Sugihara, ‘‘Nonlinear Forecasting for the Classification of Natural Time
Series,’’ Phil. Trans. R. Soc. London, A348, pp. 477 – 495 (1994).
122 4 CHAOTIC DYNAMICS

5
DUAL EXTENDED KALMANFILTER METHODS
Eric A. Wan and Alex T. NelsonDepartment of Electrical and Computer Engineering, Oregon Graduate Institute of
Science and Technology, Beaverton, Oregon, U.S.A.
5.1 INTRODUCTION
The Extended Kalman Filter (EKF) provides an efficient method for
generating approximate maximum-likelihood estimates of the state of a
discrete-time nonlinear dynamical system (see Chapter 1). The filter
involves a recursive procedure to optimally combine noisy observations
with predictions from the known dynamic model. A second use of the
EKF involves estimating the parameters of a model (e.g., neural network)
given clean training data of input and output data (see Chapter 2). In this
case, the EKF represents a modified-Newton type of algorithm for on-line
system identification. In this chapter, we consider the dual estimation
problem, in which both the states of the dynamical system and its
parameters are estimated simultaneously, given only noisy observations.
123
Kalman Filtering and Neural Networks, Edited by Simon HaykinISBN 0-471-36998-5 # 2001 John Wiley & Sons, Inc.

To be more specific, we consider the problem of learning both the
hidden states xk and parameters w of a discrete-time nonlinear dynamical
system,
xkþ1 ¼ Fðxk;uk;wÞ þ vk;
yk ¼ Hðxk;wÞ þ nk;ð5:1Þ
where both the system states xk and the set of model parameters w for the
dynamical system must be simultaneously estimated from only the
observed noisy signal yk . The process noise vk drives the dynamical
system, observation noise is given by nk, and uk corresponds to observed
exogenous inputs. The model structure, Fð�Þ and Hð�Þ, may represent
multilayer neural networks, in which case w are the weights.
The problem of dual estimation can be motivated either from the need
for a model to estimate the signal or (in other applications) from the need
for good signal estimates to estimate the model. In general, applications
can be divided into the tasks of modeling, estimation, and prediction. In
estimation, all noisy data up to the current time is used to approximate the
current value of the clean state. Prediction is concerned with using all
available data to approximate a future value of the clean state. Modeling
(sometimes referred to as identification) is the process of approximating
the underlying dynamics that generated the states, again given only the
noisy observations. Specific applications may include noise reduction
(e.g., speech or image enhancement), or prediction of financial and
economic time series. Alternatively, the model may correspond to the
explicit equations derived from first principles of a robotic or vehicle
system. In this case, w corresponds to a set of unknown parameters.
Applications include adaptive control, where parameters are used in the
design process and the estimated states are used for feedback.
Heuristically, dual estimation methods work by alternating between
using the model to estimate the signal, and using the signal to estimate the
model. This process may be either iterative or sequential. Iterative
schemes work by repeatedly estimating the signal using the current
model and all available data, and then estimating the model using the
estimates and all the data (see Fig. 5.1a). Iterative schemes are necessarily
restricted to off-line applications, where a batch of data has been
previously collected for processing. In contrast, sequential approaches
use each individual measurement as soon as it becomes available to update
both the signal and model estimates. This characteristic makes these
algorithms useful in either on-line or off-line applications (see Fig. 5.1b).
124 5 DUAL EXTENDED KALMAN FILTER METHODS

The vast majority of work on dual estimation has been for linear
models. In fact, one of the first applications of the EKF combines both the
state vector xk and unknown parameters w in a joint bilinear state-space
representation. An EKF is then applied to the resulting nonlinear estima-
tion problem [1, 2]; we refer to this approach as the joint extended Kalman
filter. Additional improvements and analysis of this approach are provided
in [3, 4]. An alternative approach, proposed in [5], uses two separate
Kalman filters: one for signal estimation, and another for model estima-
tion. The signal filter uses the current estimate of w, and the weight filter
uses the signal estimates xxk to minimize a prediction error cost. In [6], this
dual Kalman approach is placed in a general family of recursive prediction
error algorithms. Apart from these sequential approaches, some iterative
methods developed for linear models include maximum-likelihood
approaches [7–9] and expectation-maximization (EM) algorithms [10–
13]. These algorithms are suitable only for off-line applications, although
sequential EM methods have been suggested.
Fewer papers have appeared in the literature that are explicitly
concerned with dual estimation for nonlinear models. One algorithm
(proposed in [14]) alternates between applying a robust form of the
Figure 5.1 Two approaches to the dual estimation problem. (a ) Iterativeapproaches use large blocks of data repeatedly. (b) Sequential ap-proaches are designed to pass over the data one point at a time.
5.1 INTRODUCTION 125

EKF to estimate the time-series and using these estimates to train a neural
network via gradient descent. A joint EKF is used in [15] to model
partially unknown dynamics in a model reference adaptive control frame-
work. Furthermore, iterative EM approaches to the dual estimation
problem have been investigated for radial basis function networks [16]
and other nonlinear models [17]; see also Chapter 6. Errors-in-variables
(EIV) models appear in the nonlinear statistical regression literature [18],
and are used for regressing on variables related by a nonlinear function,
but measured with some error. However, errors-in-variables is an iterative
approach involving batch computation; it tends not to be practical for
dynamical systems because the computational requirements increase in
proportion to N2, where N is the length of the data. A heuristic method
known as Clearning minimizes a simplified approximation to the EIV cost
function. While it allows for sequential estimation, the simplification can
lead to severely biased results [19]. The dual EKF [19] is a nonlinear
extension of the linear dual Kalman approach of [5], and recursive
prediction error algorithm of [6]. Application of the algorithm to speech
enhancement appears in [20], while extensions to other cost functions
have been developed in [21] and [22]. The crucial, but often overlooked
issue of sequential variance estimation is also addressed in [22].
Overview The goal of this chapter is to present a unified probabilistic
and algorithmic framework for nonlinear dual estimation methods. In the
next section, we start with the basic dual EKF prediction error method.
This approach is the most intuitive, and involves simply running two EKF
filters in parallel. The section also provides a quick review of the EKF for
both state and weight estimation, and introduces some of the complica-
tions in coupling the two. An example in noisy time-series prediction is
also given. In Section 5.3, we develop a general probabilistic framework
for dual estimation. This allows us to relate the various methods that have
been presented in the literature, and also provides a general algorithmic
approach leading to a number of different dual EKF algorithms. Results on
additional example data sets are presented in Section 5.5.
5.2 DUAL EKF–PREDICTION ERROR
In this section, we present the basic dual EKF prediction error algorithm.
For completeness, we start with a quick review of the EKF for state
estimation, followed by a review of EKF weight estimation (see Chapters
126 5 DUAL EXTENDED KALMAN FILTER METHODS

1 and 2 for more details). We then discuss coupling the state and weight
filters to form the dual EKF algorithm.
5.2.1 EKF–State Estimation
For a linear state-space system with known model and Gaussian noise, the
Kalman filter [23] generates optimal estimates and predictions of the state
xk . Essentially, the filter recursively updates the (posterior) mean xxk and
covariance Pxkof the state by combining the predicted mean xx�
k and
covariance P�xk
with the current noisy measurement yk . These estimates are
optimal in both the MMSE and MAP senses. Maximum-likelihood signal
estimates are obtained by letting the initial covariance Px0approach
infinity, thus causing the filter to ignore the value of the initial state xx0.
For nonlinear systems, the extended Kalman filter provides approxi-
mate maximum-likelihood estimates. The mean and covariance of the state
are again recursively updated; however, a first-order linearization of the
dynamics is necessary in order to analytically propagate the Gaussian
random-variable representation. Effectively, the nonlinear dynamics are
approximated by a time-varying linear system, and the linear Kalman
filters equations are applied. The full set of equations are given in Table
5.1. While there are more accurate methods for dealing with the nonlinear
dynamics (e.g., particle filters [24, 25], second-order EKF, etc.), the
standard EKF remains the most popular approach owing to its simplicity.
Chapter 7 investigates the use of the unscented Kalman filter as a
potentially superior alternative to the EKF [26–29].
Another interpretation of Kalman filtering is that of an optimization
algorithm that recursively determines the state xk in order to minimize a
cost function. It can be shown that the cost function consists of a weighted
prediction error and estimation error components given by
J ðxk1Þ ¼
Pkt¼1
½yt � Hðxt;wÞ�TðRnÞ
�1½yt � Hðxt;wÞ�
�þ ðxt � x�t Þ
TðRvÞ
�1ðxt � x�
t Þg ð5:10Þ
where x�t ¼ Fðxt�1;wÞ is the predicted state, and Rn and Rv are the
additive noise and innovations noise covariances, respectively. This inter-
pretation will be useful when dealing with alternate forms of the dual EKF
in Section 5.3.3.
5.2 DUAL EKF–PREDICTION ERROR 127

5.2.2 EKF–Weight Estimation
As proposed initially in [30], and further developed in [31] and [32], the
EKF can also be used for estimating the parameters of nonlinear models
(i.e., training neural networks) from clean data. Consider the general
problem of learning a mapping using a parameterized nonlinear function
Gðxk;wÞ. Typically, a training set is provided with sample pairs consisting
of known input and desired output, fxk; dkg. The error in the model is
defined as ek ¼ dk � Gðxk;wÞ, and the goal of learning involves solving
for the parameters w in order to minimize the expected squared error. The
EKF may be used to estimate the parameters by writing a new state-space
representation
wkþ1 ¼ wk þ rk; ð5:11Þ
dk ¼ Gðxk;wkÞ þ ek; ð5:12Þ
where the parameters wk correspond to a stationary process with identity
state transition matrix, driven by process noise rk . The output dk
Table 5.1 Extended Kalman filter (EKF) equations
Initialize with:
xx0 ¼ E½x0�; ð5:2Þ
Px0¼ E½ðx0 � xx0Þðx0 � xx0Þ
T�: ð5:3Þ
For k 2 1; . . . ;1gf , the time-update equations of the extended Kalman filter are
xx�k ¼ Fðxxk�1; uk;wÞ; ð5:4Þ
P�xk¼ Ak�1Pxk�1
ATk�1 þ Rv; ð5:5Þ
and the measurement-update equations are
Kxk ¼ P�
xkCT
k ðCkP�xk
CTk þ RnÞ
�1; ð5:6Þ
xxk ¼ xx�k þ Kx
k ½yk � Hðxx�k ;wÞ�; ð5:7Þ
Pxk¼ ðI � Kx
kCkÞP�xk; ð5:8Þ
where
Ak ¼D @Fðx; uk;wÞ
@x
����xxk
; Ck ¼D @Hðx;wÞ
@x
����xxk
; ð5:9Þ
and where Rv and Rn are the covariances of vk and nk, respectively.
128 5 DUAL EXTENDED KALMAN FILTER METHODS

corresponds to a nonlinear observation on wk . The EKF can then be
applied directly, with the equations given in Table 5.2. In the linear case,
the relationship between the Kalman filter (KF) and the popular recursive
least-squares (RLS) is given [33] and [34]. In the nonlinear case, the EKF
training corresponds to a modified-Newton optimization method [22].
As an optimization approach, the EKF minimizes the prediction error
cost:
J ðwÞ ¼Pkt¼1
½dt � Gðxt;wÞ�TðReÞ
�1½dt � Gðxt;wÞ�: ð5:21Þ
If the ‘‘noise’’ covariance Re is a constant diagonal matrix, then, in fact, it
cancels out of the algorithm (this can be shown explicitly), and hence can
be set arbitrarily (e.g., Re ¼ 0:5I). Alternatively, Re can be set to specify a
weighted MSE cost. The innovations covariance E½rkrTk � ¼ Rr
k , on the
other hand, affects the convergence rate and tracking performance.
Roughly speaking, the larger the covariance, the more quickly older
data are discarded. There are several options on how to choose Rrk :
Set Rrk to an arbitrary diagonal value, and anneal this towards zeroes
as training continues.
Table 5.2 The extended Kalman weight filter equations
Initialize with:
ww0 ¼ E½w� ð5:13Þ
Pw0¼ E½ðw � ww0Þðw � ww0Þ
T� ð5:14Þ
For k 2 1; . . . ;1f g, the time update equations of the Kalman filter are:
ww�k ¼ wwk�1 ð5:15Þ
P�wk
¼ Pwk�1þ Rr
k�1 ð5:16Þ
and the measurement update equations:
Kwk ¼ P�
wkðCw
k ÞTðCw
k P�wkðCw
k ÞTþ ReÞ
�1ð5:17Þ
wwk ¼ ww�k þ Kw
k ðdk � Gðww�k ; xk�1ÞÞ ð5:18Þ
Pwk¼ ðI � Kw
k Cwk ÞP
�wk: ð5:19Þ
where
Cwk ¼
D @Gðxk�1;wÞT
@w
����w¼ww�
k
ð5:20Þ
5.2 DUAL EKF–PREDICTION ERROR 129

Set Rrk ¼ ðl�1
� 1ÞPwk, where l 2 ð0; 1� is often referred to as the
‘‘forgetting factor.’’ This provides for an approximate exponentially
decaying weighting on past data and is described more fully in [22].
Set Rrk ¼ ð1 � aÞRr
k�1 þ aKwk ½dk � Gðxk; wwÞ�½dk�Gðxk; wwÞ�
TðKw
k ÞT ,
which is a Robbins–Monro stochastic approximation scheme for
estimating the innovations [6]. The method assumes that the covari-
ance of the Kalman update model is consistent with the actual update
model.
Typically, Rrk is also constrained to be a diagonal matrix, which implies an
independence assumption on the parameters.
Study of the various trade-offs between these different approaches is
still an area of open research. For the experiments performed in this
chapter, the forgetting factor approach is used.
Returning to the dynamic system of Eq. (5.1), the EKF weight filter can
be used to estimate the model parameters for either F or H. To learn the
state dynamics, we simply make the substitutions G ! F and dk ! xkþ1.
To learn the measurement function, we make the substitutions G ! H
and dk ! yk . Note that for both cases, it is assumed that the noise-free
state xk is available for training.
5.2.3 Dual Estimation
When the clean state is not available, a dual estimation approach is
required. In this section, we introduce the basic dual EKF algorithm,
which combines the Kalman state and weight filters. Recall that the task is
to estimate both the state and model from only noisy observations.
Essentially, two EKFs are run concurrently. At every time step, an EKF
state filter estimates the state using the current model estimate wwk , while
the EKF weight filter estimates the weights using the current state estimate
xxk . The system is shown schematically in Figure 5.2. In order to simplify
the presentation of the equations, we consider the slightly less general
state-space model:
xkþ1 ¼ Fðxk;uk;wÞ þ vk; ð5:22Þ
yk ¼ Cxk þ nk; C ¼ ½1 0 . . . 0�; ð5:23Þ
in which we take the scalar observation yk to be one of the states. Thus, we
only need to consider estimating the parameters associated with a single
130 5 DUAL EXTENDED KALMAN FILTER METHODS

nonlinear function F. The dual EKF equations for this system are
presented in Table 5.3. Note that for clarity, we have specified the
equations for the additive white-noise case. The case of colored measure-
ment noise nk is treated in Appendix B.
Recurrent Derivative Computation While the dual EKF equations
appear to be a simple concatenation of the previous state and weight EKF
equations, there is actually a necessary modification of the linearization
Cwk ¼ C@xx�
k =@ww�k associated with the weight filter. This is due to the fact
that the signal filter, whose parameters are being estimated by the weight
filter, has a recurrent architecture, i.e., xxk is a function of xxk�1, and both
are functions of w.1 Thus, the linearization must be computed using
recurrent derivatives with a routine similar to real-time recurrent learning
xk-1 MeasurementUpdate EKFx
MeasurementUpdate EKFw
x xk
yk
k
www kk-1
Time Update EKFx
Time Update EKFw
(measurement)
k
−
−
∧ ∧ ∧
∧∧∧
Figure 5.2 The dual extended Kalman filter. The algorithm consists of twoEKFs that run concurrently. The top EKF generates state estimates, andrequires wwk�1 for the time update. The bottom EKF generates weightestimates, and requires xxk�1 for the measurement update.
1 Note that a linearization is also required for the state EKF, but this derivative,
@Fðxxk�1; ww�k Þ=@xxk�1, can be computed with a simple technique (such as backpropagation)
because ww�k is not itself a function of xxk�1.
5.2 DUAL EKF–PREDICTION ERROR 131

(RTRL) [35]. Taking the derivative of the signal filter equations results in
the following system of recursive equations:
@xx�kþ1
@ww¼
@Fðxx; wwÞ
@xxk
@xxk
@wwþ@Fðxx; wwÞ
@wwk
; ð5:35Þ
@xxk
@ww¼ ðI � Kx
kCÞ@xx�
k
@wwþ@Kx
k
@wwðyk � Cxx�k Þ; ð5:36Þ
Table 5.3 The dual extended Kalman filter equations. The definitions of k
and Cwk depend on the particular form of the weight filter being used. See
the text for details
Initialize with:
ww0 ¼ E½w�; Pw0¼ E½ðw � ww0Þðw � ww0Þ
T�;
xx0 ¼ E½x0�; Px0¼ E½ðx0 � xx0Þðx0 � xx0Þ
T�:
For k 2 1; . . . ;1gf , the time-update equations for the weight filter are
ww�k ¼ wwk�1; ð5:24Þ
P�wk
¼ Pwk�1þ Rr
k�1 ¼ l�1Pwk�1; ð5:25Þ
and those for the state filter are
xx�k ¼ Fðxxk�1uk ; ww�
k Þ; ð5:26Þ
P�xk¼ Ak�1Pxk�1
ATk�1 þ Rv: ð5:27Þ
The measurement-update equations for the state filter are
Kxk ¼ P�
xkCT
ðCP�xk
CTþ RnÞ
�1; ð5:28Þ
xxk ¼ xx�k þ Kx
kðyk � Cxx�k Þ; ð5:29Þ
Pxk¼ ðI � Kx
kCÞP�xk; ð5:30Þ
and those for the weight filter are
Kwk ¼ P�
wkðCw
k ÞT½Cw
k P�wkðCw
k ÞTþ Re�
�1; ð5:31Þ
wwk ¼ ww�k þ Kw
k �
where
Ak�1 ¼D @Fðx; ww�
k Þ
@x
����xxk�1
; k ¼ ðyk � Cxx�k Þ; Cw
k ¼D�@ k
@w¼ C
@xx�k
@w
����w¼ww�
k
:
ð5:34Þ
132 5 DUAL EXTENDED KALMAN FILTER METHODS

where @Fðxx; wwÞ=@xxk and @Fðxx; wwÞ=@wwk are evaluated at wwk and contain
static linearizations of the nonlinear function.
The last term in Eq. (5.36) may be dropped if we assume that the
Kalman gain Kxk is independent of w. Although this greatly simplifies the
algorithm, the exact computation of @Kxk=@ww may be computed, as shown
in Appendix A. Whether the computational expense in calculating the
recursive derivatives (especially that of calculating @Kxk=@ww) is worth the
improvement in performance is clearly a design issue. Experimentally,
the recursive derivatives appear to be more critical when the signal is
highly nonlinear, or is corrupted by a high level of noise.
Example As an example application, consider the noisy time-series
fxkgN1 generated by a nonlinear autoregression:
xk ¼ f ðxk�1; . . . xk�M ;wÞ þ vk;
yk ¼ xk þ nk 8k 2 f1; . . . ;Ng:ð5:37Þ
The observations of the series yk contain measurement noise nk in addition
to the signal. The dual EKF requires reformulating this model into a state-
space representation. One such representation is given by
xk ¼ Fðxk�1;wÞ þ Bvk; ð5:38Þ
xk
xk�1
..
.
xk�Mþ1
266664
377775 ¼
f ðxk�1; . . . ; xk�M ;wÞ
1 0 0 0
0 . ..
0 ...
0 0 1 0
264
375 �
xk�1
..
.
xk�M
2664
3775
266664
377775þ
1
0
..
.
0
266664
377775vk;
yk ¼ Cxk þ nk;
¼ ½1 0 . . . 0�xk þ nk; ð5:39Þ
where the state xk is chosen to be lagged values of the time series, and the
state transition function Fð�Þ has its first element given by f ð�Þ, with the
remaining elements corresponding to shifted values of the previous state.
The results of a controlled time-series experiment are shown in Figure
5.3. The clean signal, shown by the thin curve in Figure 5.3a, is generated
by a neural network (10-5-1) with chaotic dynamics, driven by white
Gaussian-process noise (s2v ¼ 0:36). Colored noise generated by a linear
autoregressive model is added at 3 dB signal-to-noise ratio (SNR) to
produce the noisy data indicated by þ symbols. Figure 5.3b shows the
5.2 DUAL EKF–PREDICTION ERROR 133

Figure 5.3 The dual EKF estimate (heavy curve) of a signal generated by aneural network (thin curve) and corrupted by adding colored noise at 3 dB(þ). For clarity, the last 150 points of a 20,000-point series are shown. Only thenoisy data are available: both the signal and weights are estimated by thedual EKF. (a ) Clean neural network signal and noisy measurements. (b) DualEKF estimates versus EKF estimates. (c ) Estimates with full and static deriva-tives. (d ) MSE profiles of EKF versus dual EKF.
134 5 DUAL EXTENDED KALMAN FILTER METHODS

time series estimated by the dual EKF. The algorithm estimates both the
clean time series and the neural network weights. The algorithm is run
sequentially over 20,000 points of data; for clarity, only the last 150 points
are shown. For comparison, the estimates using an EKF with the known
neural network model are also shown. The MSE for the dual EKF,
computed over the final 1000 points of the series, is 0.2171, whereas
the EKF produces an MSE of 0.2153, indicating that the dual algorithm
has successfully learned both the model and the states estimates.2
Figure 5.3c shows the estimate when the static approximation to
recursive derivatives is used. In this example, this static derivative actually
provides a slight advantage, with an MSE of 0.2122. The difference,
however, is not statistically significant. Finally, Figure 5.3d assesses the
convergence behavior of the algorithm. The mean-squared error (MSE) is
computed over 500 point segments of the time series at 50 point intervals
to produce the MSE profile (dashed line). For comparison, the solid line is
the MSE profile of the EKF signal estimation algorithm, which uses the
true neural network model. The dual EKF appears to converge to the
optimal solution after only about 2000 points.
5.3 A PROBABILISTIC PERSPECTIVE
In this section, we present a unified framework for dual estimation. We
start by developing a probabilistic perspective, which leads to a number of
possible cost functions that can be used in the estimation process. Various
approaches in the literature, which may differ in their actual optimization
procedure, can then be related based on the underlying cost function. We
then show how a Kalman-based optimization procedure can be used to
provide a common algorithmic framework for minimizing each of the cost
functions.
MAP Estimation Dual estimation can be cast as a maximum a poster-
iori (MAP) solution. The statistical information contained in the sequence
of data fykgN1 about the signal and parameters is embodied by the joint
conditional probability density of the sequence of states fxkgN1 and weights
2 A surprising result is that the dual EKF sometimes actually outperforms the EKF, even
though the EKF appears to have an unfair advantage of knowing the true model. Our
explanation is that the EKF, even with the known model, is still an approximate estimation
algorithm. While the dual EKF also learns an approximate model, this model can actually
be better matched to the state estimation approximation.
5.3 A PROBABILISTIC PERSPECTIVE 135

w, given the noisy data fykgN1 . For notational convenience, define the
column vectors xN1 and yN
1 , with elements from fxkgN1 and fykg
N1 ,
respectively. The joint conditional density function is written as
rxN1
wjyN1ðX ¼ xN
1 ; W ¼ wjY ¼ yN1 Þ; ð5:40Þ
where X, Y, and W are the vectors of random variables associated with
xN1 , yN
1 , and w, respectively. This joint density is abbreviated as rxN1
wjyN1.
The MAP estimation approach consists of determining instances of the
states and weights that maximize this conditional density. For Gaussian
distributions, the MAP estimate also corresponds to the minimum mean-
squared error (MMSE) estimator. More generally, as long as the density is
unimodal and symmetric around the mean, the MAP estimate provides the
Bayes estimate for a broad class of loss functions [36].
Taking MAP as the starting point allows dual estimation approaches to
be divided into two basic classes. The first, referred to here as joint
estimation methods, attempt to maximize rxN1
wjyN1
directly. We can write
this optimization problem explicitly as
ðxxN1 ; wwÞ ¼ arg max
xN1;wrxN
1wjyN
1: ð5:41Þ
The second class of methods, which will be referred to as marginal
estimation methods, operate by expanding the joint density as
rxN1
wjyN1¼ rxN
1jwyN
1rwjyN
1ð5:42Þ
and maximizing the two terms separately, that is,
xxN1 ¼ arg max
xN1
rxN1jwyN
1; ww ¼ arg max
wrwjyN
1: ð5:43Þ
The cost functions associated with joint and marginal approaches will be
discussed in the following sections.
136 5 DUAL EXTENDED KALMAN FILTER METHODS

5.3.1 Joint Estimation Methods
Using Bayes’ rule, the joint conditional density can be expressed as
rxN1
wjyN1¼
ryN1jxN
1wrxN
1w
ryN1
¼ryN
1jxN
1wrxN
1jwrw
ryN1
: ð5:44Þ
Although fykgN1 is statistically dependent on fxkg
N1 and w, the prior ryN
1is
nonetheless functionally independent of fxkgN1 and w. Therefore, rxN
1wjyN
1
can be maximized by maximizing the terms in the numerator alone.
Furthermore, if no prior information is available on the weights, rw can be
dropped, leaving the maximization of
ryN1
xN1jw ¼ ryN
1jxN
1wrxN
1jw ð5:45Þ
with respect to fxkgN1 and w.
To derive the corresponding cost function, we assume vk and nk are
both zero-mean white Gaussian noise processes. It can then be shown (see
[22]), that
ryN1
xN1jw ¼
1ffiffiffiffiffiffiffiffiffiffiffiffiffiffiffiffiffiffiffiffiffiffið2pÞN ðs2
nÞN
q exp �PNk¼1
ðyk � CxkÞ2
2s2n
" #
�1ffiffiffiffiffiffiffiffiffiffiffiffiffiffiffiffiffiffiffiffiffiffiffi
ð2pÞN jRvjNq exp �
PNk¼1
1
2ðxk � x�
k ÞTðRvÞ
�1ðxk � x�k Þ
� �;
ð5:46Þ
where
x�k ¼
DE½xk jfxtg
k�11 ;w� ¼ Fðxk�1;wÞ: ð5:47Þ
5.3 A PROBABILISTIC PERSPECTIVE 137

Here we have used the structure given in Eq. (5.37) to compute the
prediction x�k using the model Fð�;wÞ. Taking the logarithm, the corre-
sponding cost function is given by
J ¼PNk¼1
logð2ps2nÞ þ
ðyk � CxkÞ2
s2n
"ð5:48Þ
þ logð2pjRvjÞ þ ðxk � x�k ÞTðRvÞ
�1ðxk � x�
k Þ
�: ð5:49Þ
This cost function can be minimized with respect to any of the unknown
quantities (including the variances, which we will consider in Section 5.4).
For the time being, consider only the optimization of fxkgN1 and w.
Because the log terms in the above cost are independent of the signal
and weights, they can be dropped, providing a more specialized cost
function:
J jðxN1 ;wÞ ¼
PNk¼1
ðyk � CxkÞ2
s2n
þ ðxk � x�k ÞTðRvÞ
�1ðxk � x�
k Þ
" #: ð5:50Þ
The first term is a soft constraint keeping fxkgN1 close to the observations
fykgN1 . The smaller the measurement noise variance s2
n, the stronger this
constraint will be. The second term keeps the state estimates and model
estimates mutually consistent with the model structure. This constraint
will be strong when the state is highly deterministic (i.e., Rv is small).
J jðxN1 ;wÞ should be minimized with respect to both fxkg
N1 and w to find
the estimates that maximize the joint density ryN1
xN1jw. This is a difficult
optimization problem because of the high degree of coupling between the
unknown quantities fxkgN1 and w. In general, we can classify approaches as
being either direct or decoupled. In direct approaches, both the signal and
the state are determined jointly as a multivariate optimization problem.
Decoupled approaches optimize one variable at a time while the other
variable is fixed, and then alternating. Direct algorithms include the joint
EKF algorithm (see Section 5.1), which attempts to minimize the cost
sequentially by combining the signal and weights into a single (joint) state
vector. The decoupled approaches are elaborated below.
Decoupled Estimation To minimize J jðxN1 ;wÞ with respect to the
signal, the cost function is evaluated using the current estimate ww of the
138 5 DUAL EXTENDED KALMAN FILTER METHODS

weights to generate the predictions. The simplest approach is to substitute
the predictions xx�k ¼D Fðxk�1; wwÞ directly into Eq. (5.50), obtaining
J jðxN1 ; wwÞ ¼
PNk¼1
ðyk � CxkÞ2
s2n
þ ðxk � xx�k ÞTðRvÞ
�1ðxk � xx�
k Þ
" #: ð5:51Þ
This cost function is then minimized with respect to fxkgN1 . To minimize
the joint cost function with respect to the weights, J jðxN1 ;wÞ is evaluated
using the current signal estimate fxxkgN1 and the associated (redefined)
predictions xx�k ¼D Fðxxk�1;wÞ. Again, this results in a straightforward
substitution in Eq. (5.50):
J jðxxN1 ;wÞ ¼
PNk¼1
ðyk � CxxkÞ2
s2n
þ ðxxk � xx�k ÞTðRvÞ
�1ðxxk � xx�
k Þ
" #: ð5:52Þ
An alternative simplified cost function can be used if it is assumed that
only xx�k is a function of the weights:
Jji ðxx
N1 ;wÞ ¼
PNk¼1
ðxxk � xx�k ÞTðRvÞ
�1ðxxk � xx�
k Þ: ð5:53Þ
This is essentially a type of prediction error cost, where the model is
trained to predict the estimated state. Effectively, the method maximizes
rxN1jw, evaluated at xN
1 ¼ xxN1 . A potential problem with this approach is
that it is not directly constrained by the actual data fykgN1 . An inaccurate
(yet self-consistent) pair of estimates ðxxN1 ; wwÞ could conceivably be
obtained as a solution. Nonetheless, this is essentially the approach used
in [14] for robust prediction of time series containing outliers.
In the decoupled approach to joint estimation, by separately minimizing
each cost with respect to its argument, the values are found that maximize
(at least locally) the joint conditional density function. Algorithms that fall
into this class include a sequential two-observation form of the dual EKF
algorithm [21], and the errors-in-variables (EIV) method applied to batch-
style minimization [18, 19]. An alternative approach, referred to as error
coupling, makes the extra step of taking the errors in the estimates into
account. However, this error-coupled approach (investigated in [22]) does
not appear to perform reliably, and is not described further in this chapter.
5.3 A PROBABILISTIC PERSPECTIVE 139

5.3.2 Marginal Estimation Methods
Recall that in marginal estimation, the joint density function is expanded
as
rxN1
wjyN1¼ rxN
1jwyN
1rwjyN
1; ð5:54Þ
and xxN1 is found by maximizing the first factor on the right-hand side,
while ww is found by maximizing the second factor. Note that only the first
factor (rxN1jwyN
1) is dependent on the state. Hence, maximizing this factor
for the state will yield the same solution as when maximizing the joint
density (assuming the optimal weights have been found). However,
because both factors also depend on w, maximizing the second (rwjyN1)
alone with respect to w is not the same as maximizing the joint density
rxN1
wjyN1
with respect to w. Nonetheless, the resulting estimates ww are
consistent and unbiased, if conditions of sufficient excitation are met [37].
The marginal estimation approach is exemplified by the maximum-
likelihood approaches [8, 9] and EM approaches [11, 12]. Motivation for
these methods usually comes from considering only the marginal density
rwjyN1
to be the relevant quantity to maximize, rather than the joint density
rxN1
wjyN1. However, in order to maximize the marginal density, it is
necessary to generate signal estimates that are invariably produced by
maximizing the first term rxN1jwyN
1.
Maximum-Likelihood Cost To derive a cost function for weight
estimation, we further expand the marginal density as
rwjyN1¼
ryN1jwrw
ryN1
: ð5:55Þ
If there is no prior information on w, maximizing this posterior density is
equivalent to maximizing the likelihood function ryN1jw. Assuming Gaus-
sian statistics, the chain rule for conditional probabilities can be used to
express this likelihood function as:
ryN1jw ¼
QNk¼1
1ffiffiffiffiffiffiffiffiffiffiffi2ps2
ek
q exp �ðyk � ykjk�1Þ
2
2s2ek
" #; ð5:56Þ
140 5 DUAL EXTENDED KALMAN FILTER METHODS

where
ykjk�1 ¼D
E½yk j yt
� �k�1
1;w� ð5:57Þ
is the conditional mean (and optimal prediction), and s2ek
is the predic-
tion error variance. Taking the logarithm yields the following maximum-
likelihood cost function:
J mlðwÞ ¼PNk¼1
logð2ps2ekÞ þ
ðyk � ykjk�1Þ2
s2ek
" #: ð5:58Þ
Note that the log-likelihood function takes the same form whether the
measurement noise is colored or white. In evaluating this cost function,
the term ykjk�1 ¼ Cxx�k must be computed. Thus, the signal estimate must
be determined as a step to weight estimation. For linear models, this can
be done exactly using an ordinary Kalman filter. For nonlinear models,
however, the expectation is approximated by an extended Kalman filter,
which equivalently attempts to minimize the joint cost J jðxk1; wwÞ defined in
Section 5.3.1 by Eq. (5.51).
An iterative maximum-likelihood approach for linear models is
described in [7] and [8]; this chapter presents a sequential maximum-
likelihood approach for nonlinear models, developed in [21].
Prediction Error Cost Often the variance s2ek
in the maximum-like-
lihood cost is assumed (incorrectly) to be independent of the weights w
and the time index k. Under this assumption, the log likelihood can be
maximized by minimizing the squared prediction error cost function:
J peðwÞ ¼PNk¼1
ðyk � ykjk�1Þ2: ð5:59Þ
The basic dual EKF algorithm described in the previous section minimizes
this simplified cost function with respect to the weights w, and is an
example of a recursive prediction error algorithm [6, 19]. While ques-
tionable from a theoretical perspective, these algorithms have been shown
in the literature to be quite useful. In addition, they benefit from reduced
computational cost, because the derivative of the variance s2ek
with respect
to w is not computed.
5.3 A PROBABILISTIC PERSPECTIVE 141

EM Algorithm Another approach to maximizing rwjyN1
is offered by the
expectation-maximization (EM) algorithm [10, 12, 38]. The EM algorithm
can be derived by first expanding the log-likelihood as
log ryN1jw ¼ log ryN
1xN
1jw � log rxN
1jwyN
1: ð5:60Þ
Taking the conditional expectation of both sides using the conditional
density rxN1jwyN
1gives
logryN1jw ¼ EXjYW½logryN
1xN
1jwjy
N1 ; ww� � EXjYW½logrxN
1jwyN
1jyN
1 ; ww�;
ð5:61Þ
where the expectation over X of the left-hand side has no effect, because X
does not appear in logryN1jw. Note that the expectation is conditional on a
previous estimate of the weights, ww. The second term on the right is
concave by Jensen’s inequality [39],3 so choosing w to maximize the first
term on the right-hand side alone will always increase the log-likelihood
on the left-hand side. Thus, the EM algorithm repeatedly maximizes
EXjYW½log ryN1
xN1jwjy
N1 ; ww� with respect to w, each time setting ww to the new
maximizing value. The procedure results in maximizing the original
marginal density ryN1jw .
For the white-noise case, it can be shown (see [12, 22]) that the EM cost
function is
J em ¼ EXjYW
PNk¼1
logð2ps2nÞ þ
ðyk � CxkÞ2
s2n
("
þ logð2pjRvjÞ þ ðxk � x�k ÞTðRvÞ
�1ðxk � x�
k Þ
)z
�����yN1 ; ww
#; ð5:62Þ
where x�k ¼
D Fðxk�1;wÞ, as before. The evaluation of this expectation is
computable on a term-by-term basis (see [12] for the linear case).
However, for the sake of simplicity, we present here the resulting
3 Jensen’s inequality states that E½gðxÞ� � gðE½x�Þ for a concave function gð�Þ.
142 5 DUAL EXTENDED KALMAN FILTER METHODS

expression for the special case of time-series estimation, represented in
Eq. (5.37). As shown in [22], the expectation evaluates to
J em ¼ N logð4p2s2vs
2nÞ þ
PNk¼1
ðyk � xxkjN Þ2þ pkjN
s2n
"
þðxxkjN � xx�kjN Þ
2þ pkjN � 2p
y
kjN þ p�kjN
s2v
#; ð5:63Þ
where xxkjN and pkjN are defined as the conditional mean and variance of xk
given ww and all the data, fykgN1 . The terms xx�kjN and p�kjN are the conditional
mean and variance of x�k ¼ f ðxk�1;wÞ, given all the data. The additional
term py
kjN represents the cross-variance of xk and x�k , conditioned on all the
data. Again we see that determining state estimates is a necessary step to
determining the weights. In this case, the estimates xxkjN are found by
minimizing the joint cost J jðxN1 ; wwÞ, which can be approximated using an
extended Kalman smoother. A sequential version of EM can be imple-
mented by replacing xxkjN with the usual causal estimates xxk , found using
the EKF.
Summary of Cost Functions The various cost functions given in this
section are summarized in Table 5.4. No explicit signal estimation cost is
given for the marginal estimation methods, because signal estimation is
only an implicit step of the marginal approach, and uses the joint cost
J jðxN1 ; wwÞ. These cost functions, combined with specific optimization
methods, lead to the variety of algorithms that appear in the literature.
Table 5.4 Summary of dual estimation cost functions
Symbol Name of cost Density Eq.
Joint J jðxN1 ;wÞ Joint rxN
1wjyN
1(5.50)
J jðxN1 ; wwÞ Joint signal rxN
1wjyN
1(5.51)
J jðxxN1 ;wÞ Joint weight rxN
1wjyN
1(5.52)
Jji ðxx
N1 ;wÞ Joint weight (independent) rxN
1jw (5.53)
Marginal J peðwÞ Prediction error �rwjyN1
(5.59)
J mlðwÞ Maximum likelihood rwjyN1
(5.58)
J emðwÞ EM n.a. (5.62)
5.3 A PROBABILISTIC PERSPECTIVE 143

In the next section, we shall show how each of these cost functions can be
minimized using a general dual EKF-based approach.
5.3.3 Dual EKF Algorithms
In this section, we show how the dual EKF algorithm can be modified to
minimize any of the cost functions discussed earlier. Recall that the basic
dual EKF as presented in Section 5.2.3 minimized the prediction error cost
of Eq. (5.59). As was shown in the last section, all approaches use the
same joint cost function for the state-estimation component. Thus, the
state EKF remains unchanged. Only the weight EKF must be modified.
We shall show that this involves simply redefining the error term k .
To develop the method, consider again the general state-space formula-
tion for weight estimation (Eq. (5.11)):
wkþ1 ¼ wk þ rk; ð5:64Þ
dk ¼ Gðxk;wkÞ þ ek : ð5:65Þ
We may reformulate this state-space representation as
wk ¼ wk�1 þ rk; ð5:66Þ
0 ¼ � k;þek; ð5:67Þ
where k ¼ dk � Gðxk;wkÞ and the target ‘‘observation’’ is fixed at zero.
This observed error formulation yields the exact same set of Kalman
equations as before, and hence minimizes the same prediction error cost,
J ðwÞ ¼Pk
t¼1½dt � Gðxt;wÞ�TðReÞ
�1½dt � Gðxt;wÞ� ¼
Pkt¼1 Jt. However,
if we consider the modified-Newton algorithm interpretation, it can be
shown [22] that the EKF weight filter is also equivalent to the recursion
wwk ¼ ww�k þ Pwk
ðCwk Þ
TðReÞ
�1ð0 þ kÞ; ð5:68Þ
where
Cwk ¼
4 @ð� kÞ
@w
����T
w¼wk
ð5:69Þ
144 5 DUAL EXTENDED KALMAN FILTER METHODS

and
P�1wk
¼ ðl�1Pwk�1Þ�1
þ ðCwk Þ
TðReÞ
�1Cwk : ð5:72Þ
The weight update in Eq. (5.68) is of the form
wwk ¼ ww�k � SkHwJ ðww�
k ÞT ; ð5:73Þ
where HwJ is the gradient of the cost J with respect to w, and Sk is a
symmetric matrix that approximates the inverse Hessian of the cost. Both
the gradient and Hessian are evaluated at the previous value of the weight
estimate. Thus, we see that by using the observed error formulation, it is
possible to redefine the error term k , which in turn allows us to minimize
an arbitrary cost function that can be expressed as a sum of instantaneous
terms Jk ¼ Tk k . This basic idea was presented by Puskorius and Feld-
kamp [40] for minimizing an entropic cost function; see also Chapter 2.
Note that Jk ¼ Tk k does not uniquely specify k, which can be vector-
valued. The error must be chosen such that the gradient and inverse
Hessian approximations (Eqs. (5.70) and (5.72)) are consistent with the
desired batch cost.
In the following sections, we give the exact specification of the error
term (and corresponding gradient Cwk ) necessary to modify the dual EKF
algorithm to minimize the different cost functions. The original set of dual
EKF equations given in Table 5.3 remains the same, with only k being
redefined. Note that for each case, the full evaluation of Cwk requires taking
recursive gradients. The procedure for this is analogous to that taken in
Section 5.2.3. Furthermore, we restrict ourselves to the autoregressive
time-series model with state-space representation given in Eqs. (5.38) and
(5.39).
Joint Estimation Forms The corresponding weight cost function (see
also Eq. (5.52)) and error terms are given in Table 5.5. Note that this
represents a special two-observation form of the weight filter, where
xx�t ¼ f ðxxt�1;wÞ; ek ¼4ðyk � xxkÞ;
~xxxxk ¼4ðxxk � xxÞ
�k ;
Note that this dual EKF algorithm represents a sequential form of the
decoupled approach to joint optimization; that is, the two EKFs minimize
the overall joint cost function by alternately optimizing one argument at a
5.3 A PROBABILISTIC PERSPECTIVE 145

time while the other argument is fixed. A direct approach found using the
joint EKF is described later in Section 5.3.4.
Marginal Estimation Forms–Maximum-Likelihood Cost The
corresponding weight cost function (see Eq. (5.58)) and error terms are
given in Table 5.6, where
ek ¼ yk � xx�k ; le;k ¼s2e;k
3e2k � 2s2
e;k:
Note that the prediction error variance is given by
s2ek¼ E½ðyk � ykjk�1Þ
2jfytg
k�11 ;w� ð5:75aÞ
¼ E½ðnk þ xk � xx�k Þ2jfytg
k�11 ;w� ð5:75bÞ
¼ s2n þ CP�
k CT ; ð5:75cÞ
where P�k is computed by the Kalman signal filter (see [22] for a
discussion of the selection and interpretation of le;k).
Table 5.6 Maximum-likelihood cost function observederror terms for dual EKF weight filter
J mlðwÞ ¼PNk¼1
logð2ps2ekÞ þ
ðyk � xx�k Þ2
s2ek
" #;
ek ¼4 ðle;kÞ
1=2
s�1ekek
" #; Cw
k ¼� 1
2
ðle;k Þ�1=2
s2ek
HTwðs
2ekÞ
� 1sek
HTwek þ
ek
2ðs2ekÞ3=2 HT
wðs2ekÞ
264
375:
Table 5.5 Joint cost function observed error terms for the dual EKFweight filter
J jðxxk1;wÞ ¼
Pkt¼1
ðyt � xxtÞ2
s2n
þðxxt � xx�t Þ
2
s2v
" #; ð5:74Þ
k ¼4 s�1
n ek
s�1v
~xxxxk
" #; with Cw
k ¼ �s�1
n HTwek
s�1v HT
w~xxxxk �
" #:
146 5 DUAL EXTENDED KALMAN FILTER METHODS

Marginal Estimation Forms–Prediction Error Cost If s2ek
is
assumed to be independent of w, then we are left with the formulas
corresponding to the original basic dual EKF algorithm (for the time-series
case); see Table 5.7.
Marginal Estimation Forms–EM Cost The dual EKF can be modi-
fied to implement a sequential EM algorithm. Note that the M-step, which
relates to the weight filter, corresponds to a generalized M-step, in which
the cost function is decreased (but not necessarily minimized) at each
iteration. The formulation is given in Table 5.8, where ~xxxxkjk ¼ xxk � xx�kjk .
Note that J emk ðwÞ was specified by dropping terms in Eq. (5.63) that are
independent of the weights (see [22]). While xxk are found by the usual
state EKF, the variance terms py
kjk , and p�kjk, as well as xx�kjk (a noncausal
prediction), are not typically computed in the normal implementation of
the state EKF. To compute these, the state vector is augmented by one
additional lagged value of the signal:
xþk ¼xk
xk�M
� �¼
xk
xk�1
� �; ð5:78Þ
Table 5.7 Prediction error cost function observed error terms for the dualEKF weight filter
J peðwÞ ¼PNk¼1
e2k ¼ ðyk � xx�k Þ
2; ð5:76Þ
k ¼4ek ¼ ðyk � xx�k Þ; Cw
k ¼ �Hwek ¼ C@xx�
k
@w
����w¼ww�
k
:
Table 5.8 EM cost function observed error terms for the dual EKF weightfilter
J emk ðwÞ ¼
ðxxk � xx�kjkÞ2� 2p
y
kjk þ p�kjk
s2v
; ð5:77Þ
k ¼
s�1v
~xxxxkjkffiffiffiffiffiffiffi�2
ps�1v ð p
y
kjkÞ1=2
s�1v ð p�
kjkÞ1=2
2664
3775; Cw
k ¼
� 1svHT
w~xxxxkjk
�
ffiffiffiffiffiffiffi�2
pð p
y
kjk�1=2
2svHT
wpy
kjk
�ð p�
kjk�1=2
2svHT
wp�kjk
266666664
377777775:
5.3 A PROBABILISTIC PERSPECTIVE 147

The state Kalman filter is then modified by adding a final zero element to
the vectors B and C (see Eqs. (5.38) and (5.39)), and the linearized state
transition matrix is redefined as
Ak ¼4 HT
x f
I 0
" #:
Now the estimate xxþk will contain xxk�1jk in its last M elements. As shown
in [22], the variance terms are then approximated by
p�kjk ¼ CAk�1jkðPk�1jkÞATk�1jkCT ; p
y
kjk ¼ CðP]kÞA
Tk�1jkCT ; ð5:79Þ
where the covariance Pk�1jk is provided as the lower right block of the
augmented covariance Pþk , and P
]k is the upper right block of Pþ
k . The
usual error covariance Pk is provided in the upper left block of Pþk .
Furthermore, Ak�1jk is found by linearizing f ð�Þ at xxk�1jk . The noncausal
prediction xx�kjk ¼ E½ f ðxk�1;wÞjfytgk1; ww� � f ðxxk�1jk;wÞ.
Finally, the necessary gradient terms in the dual EKF algorithm can be
evaluated as follows:
HTw~xxxxkjk ¼ �Hwxx�kjk ¼ �Hw f ðxxk�1jk;wÞ; ð5:80Þ
which is evaluated at wwk . The ith element of the gradient vector Hwp�kjk is
constructed from the expression
@p�kjk
@wðiÞ¼ C
@Ak�1jk
@wðiÞðPk�1jkÞA
Tk�1jk þ Ak�1jkðPk�1jkÞ
@ATk�1jk
@wðiÞ
" #CT ; ð5:81Þ
and the elements of the gradient Hwpy
kjk are given by
@py
kjk
@wðiÞ¼ C
@Ak�1jk
@wðiÞðP
]kÞ
T
� �CT : ð5:82Þ
Note that all components in the cost function are recursive functions of ww,
but not of w. Hence, no recurrent derivative computations are required for
the EM algorithm. Furthermore, it can be shown that the actual error
variances p�kjk and p
y
kjk (not their gradients) cancel out in the formula for
Cwk , and thus should be replaced with large constant values to obtain a
good Hessian approximation.
148 5 DUAL EXTENDED KALMAN FILTER METHODS

5.3.4 Joint EKF
In the previous section, the dual EKF was modified to minimize the joint
cost function. This implementation represented a decoupled type of
approach, in which separate state-space representations were used to
estimate xk and w. An alternative direct approach is given by the joint
EKF, which generates simultaneous MAP estimates of xk and w. This is
accomplished by defining a new joint state-space representation with
concatenated state:
zk ¼xk
wk
� �: ð5:83Þ
It is clear that maximizing the density rzk jyk1
is equivalent to maximizing
rxk wjyk1. Hence, the MAP-optimal estimate of zk will contain the values of
xk and wk that minimize the batch cost J ðxk1;wÞ. Running the single EKF
with this state vector provides a sequential estimation algorithm. The joint
EKF first appeared in the literature for the estimation of linear systems (in
which there is a bilinear relation between the states and weights) [1, 2].
The general equations for nonlinear systems are given in Table 5.9.
Note that because the gradient of f ðzÞ with respect to w is taken with the
other elements (namely, xxk) fixed, it will not involve recursive derivatives of
xxk with respect to w. This fact is cited in [3] and [6] as a potential source of
convergence problems for the joint EKF. Additional results and citations in
[5] corroborate the difficulties of the approach, although the cause of
divergence is linked there to the linearization of the coupled system, rather
than the lack of recurrent derivatives (note that no divergence problems
were encountered in preparing the experimental results in this chapter).
Although the use of recurrent derivatives is suggested in [3] and [6], there
is no theoretical justification for this. In summary, the joint EKF provides
an alternative to the dual EKF for sequential minimization of the joint cost
function. Note that the joint EKF cannot be readily adapted to minimize
other cost functions discussed in this chapter.
5.4 DUAL EKF VARIANCE ESTIMATION
The implementation of the EKF requires the noise variance, s2v and s2
n as
parameters in the algorithm. Often these can be determined from physical
knowledge of the problem (e.g., sensor accuracy or ambient noise
5.4 DUAL EKF VARIANCE ESTIMATION 149

measurements). However, if the variances are unknown, their values can
be estimated within the dual EKF framework using cost functions similar
to those derived in Section 5.3. A full treatment of the variance estimation
filter is presented in [22]; here we focus on the maximum-likelihood cost
function
J mlðs2Þ ¼PNk¼1
logð2ps2ekÞ þ
ðyk � ykjk�1Þ2
s2ek
" #: ð5:94Þ
Note that this cost function is identical to the weight-estimation cost
function, except that the argument is changed to emphasize the estimation
of the unknown variances.
Table 5.9 The joint extended Kalman filter equations (time-series case)
Initialize with
zz0 ¼ E½z0�; ð5:84Þ
P0 ¼ E½ðz0 � zz0Þðz0 � zz0ÞT�: ð5:85Þ
For k 2 1; . . . ;1gf , the time-update equations of the Kalman filter are
zz�k ¼ �FFðzzk�1Þ; ð5:86Þ
P�k ¼ �AAk�1Pk�1
�AATk�1 þ
�VVk; ð5:87Þ
and the measurement update equations are
�KKk ¼ P�k�CCT ð �CCP�
k�CCT þ s2
nÞ�1; ð5:88Þ
zzk ¼ zz�k þ �KKkðyk ��CCzz�k Þ; ð5:89Þ
Pk ¼ ðI � �KKk�CCÞP�
k ; ð5:90Þ
where
�VVk ¼4
CovBvk
uk
� �¼
Bs2vB
T 0
0 Rr
" #; ð5:91Þ
�FFðzk�1Þ ¼4 Fðxk�1;wk�1Þ
I � wk�1
� �; �CC ¼
D½C 0 . . . 0�; ð5:92Þ
�AAk ¼4 @ �FFðzÞ
@z
����z¼zzk
¼
@f ðxxk;wÞT
@xI 0
24
35 @f ðxxk ;wÞ
T
@w0 0
24
35
0 I
2664
3775: ð5:93Þ
150 5 DUAL EXTENDED KALMAN FILTER METHODS

As with the weight filter, a modified-Newton algorithm can be found for
each variance by using an observed error form of the Kalman filter and
modeling the variances as
s2kþ1 ¼ s2
k þ rk; ð5:95Þ
0 ¼ k þ ek; ð5:96Þ
which gives a one-dimensional state-space representation. However, a
peculiar difficulty in the estimation of variances is that these quantities
must be positive-valued. Because this constraint is not built explicitly into
the cost functions, it is conceivable that negative values can be obtained.
One solution to this problem (inspired by [41]) is to estimate l ¼4
logðs2Þ
instead. Negative values of l map to small positive values of s2, and
l ¼ �1 maps to s2 ¼ 0. The logarithm is a monotonic function, so a one-
to-one mapping exists between the optimal value of l and the optimal
value of s2. An additional benefit of the logarithmic function is that it
expands the dynamic range near s2 ¼ 0, where the solution is more likely
to reside; this can improve the numerical properties of the optimization.
Of course, this new formulation requires computing the gradients and
Hessians of the cost J with respect to l. Fortunately, the change is fairly
straightforward; these expressions are simple functions of the derivatives
with respect to s2. The variance estimation filter is given in Table 5.10.
Note that the dimension of the state space is 1 in the case of variance
estimation, while the observation k is generally multidimensional. For
this reason, the covariance form of the KF is more efficient than the forms
shown earlier for signal or weight estimation, which employ the matrix
inversion lemma and use a Kalman gain term. This form of the variance
filter is used in the experiments in the next section.
In Table 5.10, the mean ykjk�1kand variance s2
ekare computed in the
same way as before (see Eq. (5.75)), except that the unknown variance s2
is now an additional conditioning argument in the expectations. Hence, the
derivatives are
@ykjk�1k
@s2¼ �
@xx�k@s2
; ð5:103Þ
@s2ek
@s2¼
@s2n
@s2þ@Pk�ð1; 1Þ
@s2; ð5:104Þ
where P�k ð1; 1Þ is the upper left element of the matrix, and @s2
n=@s2 is
either 1 or 0, depending on whether s2 is s2n or s2
v. The other derivatives
5.4 DUAL EKF VARIANCE ESTIMATION 151

are computed by taking the derivative of the Kalman filter equations with
respect to either variance term (represented by s2). This results in the
following system of recursive equations:
@xx�kþ1
@s2¼
@Fðxx; wwÞ
@xxk
@xxk
@s2; ð5:105Þ
@xxk
@s2¼ ðI � Kx
kCÞ@xx
�
k
@s2þ@Kx
k
@s2ð yk � Cxx�k Þ; ð5:106Þ
where @Fðxx; wwÞ=@xxk is evaluated at wwk , and represents a static linearization
of the neural network. Note that ½@Fðxx; wwÞ=@wwk �½@ww=@s2� does not appear
in Eq. (5.105), under the assumption that @ww=@s2 ¼ 0. The last term in
Table 5.10 Variance estimation filter of the dual EKF
Initialize with
ss20 ¼ E½s2�; ps0
¼ E½ðs2 � ss20Þðs
2 � ss20Þ
T�:
For k 2 1; . . . ;1f g, the time-update equations for the variance filter are
ss2�k ¼ ss2
k�1; ð5:97Þ
p�sk
¼ psk�1þ s2
u; s2u ¼
1
l� 1
� �psk�1
; ð5:98Þ
and the measurement equations are
psk¼ ð p�
sk�1
þ ðCsk Þ
Ts�2r Cs
k ðss2�k Þ
2þ ðCs
k ÞTs�2
r k ss2�k
h i�1
; ð5:99Þ
ll�k ¼ logðss2�k Þ; ð5:100Þ
llk ¼ ll�k þ pskðCs
k ÞTs�2
r k ss2�k ; ð5:101Þ
ss2k ¼ ellk : ð5:102Þ
The observed error term and gradient are
k ¼4 ðle;kÞ
1=2
s�1ekek
� �; Cs
k ¼
�1
2
ðle;kÞ�1=2
s2ek
@s2ek
@s2
�1
sek
@ek
@s2þ
ek
2ðs2ekÞð3=2Þ
@s2ek
@s2
26664
37775;
where s2 represents either s2n or s2
v, and where@ek
@s2¼ �
@ykjk�1k
@s2:
152 5 DUAL EXTENDED KALMAN FILTER METHODS
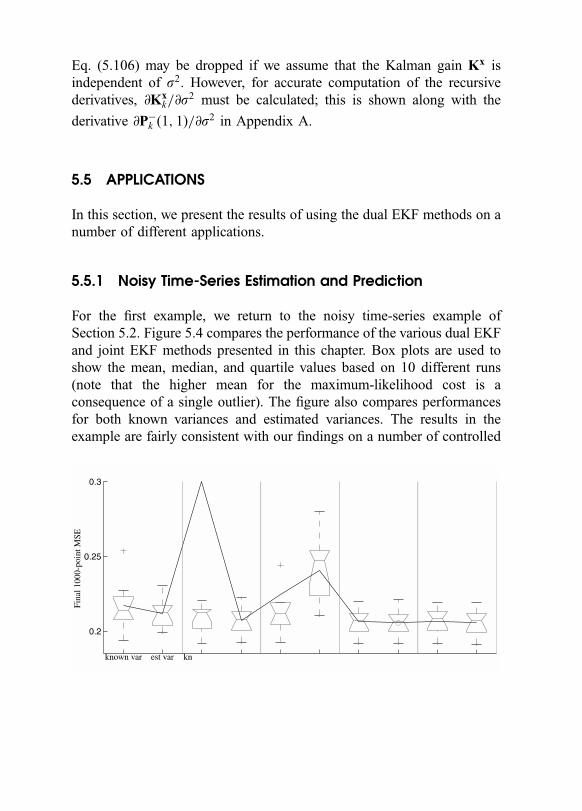
Eq. (5.106) may be dropped if we assume that the Kalman gain Kx is
independent of s2. However, for accurate computation of the recursive
derivatives, @Kxk=@s
2 must be calculated; this is shown along with the
derivative @P�k ð1; 1Þ=@s2 in Appendix A.
5.5 APPLICATIONS
In this section, we present the results of using the dual EKF methods on a
number of different applications.
5.5.1 Noisy Time-Series Estimation and Prediction
For the first example, we return to the noisy time-series example of
Section 5.2. Figure 5.4 compares the performance of the various dual EKF
and joint EKF methods presented in this chapter. Box plots are used to
show the mean, median, and quartile values based on 10 different runs
(note that the higher mean for the maximum-likelihood cost is a
consequence of a single outlier). The figure also compares performances
for both known variances and estimated variances. The results in the
example are fairly consistent with our findings on a number of controlled
Figure 5.4Perfor mance of the dual EKF and joint EKF on a chaotic neuralnetwork time series described by Eqs. (5.37). MSE values are computed fortheÞnal 1000 points of the series. For each cost function, the horizontal linesindicate the median, upper and lower quartile values, and range of theoverall NMSE. The mean values are linked by thin lines, and the algorithmwith the lowest mean MSE is indicated by a superimposed circle.
5.5 APPLICATIONS153

experiments using different time series and parameter settings [22]. For
both white and colored noises, the maximum-likelihood weight-estimation
cost J mlðwÞ generally produces the best results, but often exhibits
instability. This fact is analyzed in [22], and reduces the desirability of
using this cost function. The joint cost function J jðwÞ has better stability
properties and produces excellent results for colored measurement noise.
For white noise, the prediction error cost performs nearly as well as
J mlðwÞ, but without stability problems. Hence, the dual EKF cost func-
tions J peðwÞ and J jðwÞ are generally the best choices for white and colored
measurement noise, respectively. The joint EKF and dual EKF perform
similarly in many cases, although the joint EKF is considerably less robust
to inaccuracies in the assumed model structure and noise variances.
Chaotic Henon Map As a second time-series example, we consider
modeling the long-term behavior of the chaotic Henon map:
akþ1 ¼ 1 � 1:4a2k þ bk; ð5:107Þ
bkþ1 ¼ 0:3bk : ð5:108Þ
To obtain a one-dimensional time series for the following experiment, the
signal is defined as xk ¼ ak . The phase plot of xkþ1 versus xk (Fig. 5.5a)
shows the chaotic attractor. A neural network (5-7-1) can easily be trained
as a single-step predictor on this clean signal. The network is then
iterated–feeding back the predictions of the network as future inputs–to
produce the attractor shown in Figure 5.5b. However, if the signal is
corrupted by white noise at 10 dB SNR (Fig. 5.5c), and a neural network
with the same architecture is trained on these noisy data, the dynamics are
not adequately captured. The iterated predictions exhibit limit-cycle
behavior with far less complexity.
In contrast, using the dual EKF to train the neural network on the noisy
data captures significantly more of the chaotic dynamics, as shown in
Figure 5.5d. Here, J peðwÞ is used for weight estimation, and the maxi-
mum-likelihood cost is used for estimating s2v . The measurement-noise
variance is assumed to be known. Parameter covariances are initialized at
0.1, and the initial signal covariance is Px0¼ I. Forgetting factors are
lw ¼ 0:9999 and ls2v¼ 0:9993. Although the attractor is not reproduced
with total fidelity, its general structure has been extracted from the noisy
data.
This example also illustrates an interesting interpretation of dual EKF
prediction training. During the training process, estimations from the
output of the predictor are fed back as inputs, which are optimally
154 5 DUAL EXTENDED KALMAN FILTER METHODS

weighted by the Kalman gain with the next noisy observation. The
effective recurrent learning that takes place is analogous to compromise
methods [42], which use the same principle of combining new observa-
tions with output predictions during training, in order to improve robust-
ness of iterated performance.
5.5.2 Economic Forecasting–Index of Industrial Production
Economic and financial data are inherently noisy. As an example, we
consider the index of industrial production (IP). As with most macro-
-1 0 1-1.5
-1
-0.5
0
0.5
1
1.5
-1 0 1-1.5
-1
-0.5
0
0.5
1
1.5
-1 0 1-1.5
-1
-0.5
0
0.5
1
1.5
-1 0 1-1.5
-1
-0.5
0
0.5
1
1.5
(a)
(c) (d )
(b)
Figure 5.5 Phase plots of xkþ1 versus xk for the original Henon series (a ), theseries generated by a neural network trained on xk (b), the series generatedby a neural network trained on yk (c ), and the series generated by a neuralnetwork trained on yk , using the dual EKF (d ).
5.5 APPLICATIONS 155

economic series, the IP is a composite index of many different economic
indicators, each of which is generally measured by a survey of some kind.
The monthly IP data are shown in Figure 5.6a for January 1950 to January
1990. To remove the trend, the differences between the log2 values for
Figure 5.6 (a ) Index of industrial production (IP) in the United States fromJanuary 1940 through March 2000. Data available from Federal Reserve[43]. (b) Monthly rate of return of the IP in the United States, 1950–1990. (c )The dual KF prediction for a typical run (middle), along with the signalestimates (dotted line). (d ) The prediction residual.
156 5 DUAL EXTENDED KALMAN FILTER METHODS

adjacent months are computed; this is called the IP monthly rate of return,
and is shown in Figure 5.6b.
An important baseline approach is to predict the IP from its past values,
using a standard linear autoregressive model. Results with an AR-14
model are reported by Moody et al. [44]. For comparison, both a linear
AR-14 model and neural network (14 input, 4 hidden unit) model are
tested using the dual EKF methods. Consistent with experiments reported
in [44], data from January 1950 to December 1979 are used for a training
set, and the remainder of the data is reserved for testing. The dual KF (or
dual EKF) is iterated over the training set for several epochs, and the
resultant model–consisting of ww; ss2v , and ss2
n–is used with a standard KF
(or EKF) to produce causal predictions on the test set.
All experiments are repeated 10 times with different initial weights ww0
to produce the boxplots in Figure 5.7a. The advantage of dual estimation
on linear models in comparison to the benchmark AR-14 model trained
with least-squares (LS) is clear. For the nonlinear model, overtraining is a
serious concern, because the algorithm is being run repeatedly over a very
short training set (only 360 points). This effect is shown in Figure 5.7.
Based on experience with other types of data (which may not have been
optimal in this case) all runs were halted after only 5 training epochs.
Nevertheless, the dual EKF with J jðwÞ cost produces significantly better
results.
Although better results are reported on this problem in [44] using
models with external inputs from other series, the dual EKF single-time-
series results are quite competitive. Future work to incorporate additional
inputs would, of course, be a straightforward extension within the dual
EKF framework.
5.5.3 Speech Enhancement
Speech enhancement is concerned with the processing of noisy speech in
order to improve the quality or intelligibility of the signal. Applications
range from front-ends for automatic speech recognition systems, to
telecommunications in aviation, military, teleconferencing, and cellular
environments. While there exist a broad array of traditional enhancement
techniques (e.g., spectral subtraction, signal-subspace embedding, time-
domain iterative approaches, etc. [45]), such methods frequently result in
audible distortion of the signal, and are somewhat unsatisfactory in real-
world noisy environments. Different neural-network-based approaches are
reviewed in [45].
5.5 APPLICATIONS 157

The dual estimation algorithms presented in this chapter have the
advantage of generating estimates using only the noisy signal itself. To
address its nonstationarity, the noisy speech is segmented into short
overlapping windows. The dual estimation algorithms are then iterated
over each window to generate the signal estimate. Parameters learned from
one window are used to initialize the algorithm for the next window.
Effectively, a sequence of time-series models is trained on the specific
Figure 5.7 (a ) Boxplots of the prediction NMSE on the test set (1980-1990).(b) and (c ) show the average convergence behavior of linear and neuralnetwork model structures, respectively.
158 5 DUAL EXTENDED KALMAN FILTER METHODS

noisy speech signal of interest, resulting in a nonstationary model that can
be used to remove noise from the given signal.
A number of controlled experiments using 8 kHz sampled speech have
been performed in order to compare the different algorithms (joint EKF
versus dual EKF with various costs). It was generally concluded that the
best results were obtained with the dual EKF with J mlðwÞ cost, using a 10-
4-1 neural network (versus a linear model), and window length set at 512
samples (overlap of 64 points). Preferred nominal settings were found to
be: Px0¼ I; Pw0
¼ 0:01I; ps0¼ 0:1; lw ¼ 0:9997, and ls2
v¼ 0:9993.
The process-noise variance s2v is estimated with the dual EKF using
J mlðs2vÞ, and is given a lower limit (e.g., 10�8) to avoid potential
divergence of the filters during silence periods. While, in practice, the
additive-noise variance s2n could be estimated as well, we used the
common procedure of estimating this from the start of the recording
(512 points) where no speech is assumed present. In addition, linear AR-
12 (or 10) filters were used to model colored additive noise. Using the
settings found from these controlled experiments, several enhancement
applications are reviewed below.
SpEAR Database The dual-EKF algorithm was applied to a portion of
CSLU’s Speech Enhancement Assessment Resource (SpEAR [47]). As
opposed to artificially adding noise, the database is constructed by
acoustically combining prerecorded speech (e.g., TIMIT) and noise
(e.g., SPIB database [48]). Synchronous playback and recording in a
room is used to provide exact time-aligned references to the clean speech
such that objective measures can still be calculated. Table 5.11 presents
sample results in terms of average segmental SNR.4
Car Phone Speech In this example, the dual EKF is used to process
an actual recording of a woman talking on her cellular telephone while
driving on the highway. The signal contains a significant level of road and
engine noise, in addition to the distortion introduced by the telephone
channel. The results appear in Figure 5.8, along with the noisy signal.
4 Segmental SNR is considered to be a more perceptually relevant measure than standard
SNR, and is computed as the average of the SNRs computed within 240-point windows, or
frames of speech: SSNR¼ (# frames)�1P
i max (SNRi, �10 dB). Here, SNRi is the SNR
of the ith frame (weighted by a Hanning window), which is thresholded from below at
�10 dB. The thresholding reduces the contribution of portions of the series where no
speech is present (i.e., where the SNR is strongly negative) [49], and is expected to
improve the measure’s perceptual relevance.
5.5 APPLICATIONS 159

Spectrograms of both the noisy speech and estimated speech are included
to aid in the comparison. The noise reduction is most successful in
nonspeech portions of the signal, but is also apparent in the visibility of
formants of the estimated signal, which are obscured in the noisy signal.
The perceptual quality of the result is quite good, with an absence of the
‘‘musical noise’’ artifacts often present in spectral subtraction results.
Seminar Recording The next example comes from an actual record-
ing made of a lecture at the Oregon Graduate Institute. In this instance, the
audio recording equipment was configured improperly, resulting in a very
loud buzzing noise throughout the entire recording. The noise has a
fundamental frequency of 60 Hz (indicating that improper grounding was
the likely culprit), but many other harmonics and frequencies are present
as well owing to some additional nonlinear clipping. As suggested by
Figure 5.9, the SNR is extremely low, making for an unusually difficult
audio enhancement problem.
Digit Recognition As the final example, we consider the application
of speech enhancement for use as a front-end to automatic speech
recognition (ASR) systems. The effectiveness of the dual EKF in this
Table 5.11 Dual EKF enhancement results using a portion of the SpEARdatabasea
Male voice
(segmental SNR)
Female voice
(segmental SNR)
Noise Before After Static Before After Static
F-16 �2.27 2.65 1.69 0.16 4.51 3.46
Factory �1:63 2.58 2.48 1.07 4.19 4.24
Volvo 1.60 5.60 6.42 4.10 6.78 8.10
Pink �2.59 1.44 1.06 �0.23 4.39 3.54
White �1:35 2.87 2.68 1.05 4.96 5.05
Bursting 1.60 5.05 4.24 7.82 9.36 9.61
a Different noise sources are used for the same male and female speaker. All results are in
dB, and represent the segmental SNR averaged over the length of the waveform. Results
labeled ‘‘static’’ were obtained using the static approximation to the derivatives. For
reference, in this range of values, an improvement of 3 dB in segmental SNR relates to
approximately an improvement of 5 dB in normal SNR.
5 The authors wish to thank Edward Kaiser for his invaluable assistance in this experiment.
160 5 DUAL EXTENDED KALMAN FILTER METHODS

application is demonstrated using a speech corpus and ASR system5
developed at the Oregon Graduate Institute’s Center for Spoken Language
Understanding (CSLU). The speech corpus consists of zip-codes,
addresses, and other digits read over the telephone by various people; the
Figure 5.8 Enhancement of car phone speech. The noisy waveformappears in (a ), with its spectrogram in (b). The spectrogram and waveformof the dual EKF result are shown in (c ) and (d ), respectively. To make thespectrograms easier to view, the spectral tilt is removed, and their histo-grams are equalized according to the range of intensities of the enhancedspeech spectrogram.
5.5 APPLICATIONS 161

ASR system is a speaker-independent digit recognizer, trained exclusively
to recognize numbers from zero to nine when read over the phone.
A subset of 599 sentences was used in this experiment. As seen in Table
5.12, the recognition rates on the clean telephone speech are quite good.
However, adding white Gaussian noise to the speech at 6 dB significantly
reduces the performance. In addition to the dual EKF, a standard spectral
subtraction routine and an enhancement algorithm built into the speech
codec TIA=EIA=IS-718 for digital cellular phones (published by the
Figure 5.9 Enhancement of high-noise seminar recording. The noisy wave-form appears in (a ), with its spectrogram in (b). The spectrogram andwaveform of the dual EKF result are shown in (c ) and (d ), respectively.
162 5 DUAL EXTENDED KALMAN FILTER METHODS

Telecommunications Industry Association) was used for comparison. As
shown by Table 5.12, the dual EKF outperforms both the IS-718 and
spectral subtraction recognition rates by a significant amount.
5.6 CONCLUSIONS
This chapter has detailed a unified approach to dual estimation based on a
maximum a posteriori perspective. By maximizing the joint conditional
density rxN1;wjyN
1, the most probable values of the signal and parameters are
sought, given the noisy observations. This probabilistic perspective
elucidates the relationships between various dual estimation methods
proposed in the literature, and allows their categorization in terms of
methods that maximize the joint conditional density function directly, and
those that maximize a related marginal conditional density function.
Cost functions associated with the joint and marginal densities have
been derived under a Gaussian assumption. This approach offers a number
of insights about previously developed methods. For example, the predic-
tion error cost is viewed as an approximation to the maximum-likelihood
cost; moreover, both are classified as marginal estimation cost functions.
Thus, the recursive prediction error method of [5] and [6] is quite different
from the joint EKF approach of [1] and [2], which minimizes a joint
estimation cost.6 Furthermore, the joint EKF and errors-in-variables algo-
rithms are shown to offer two different ways of minimizing the same joint
cost function; one is a sequential method and the other is iterative.
The dual EKF algorithm has been presented, which uses two extended
Kalman filters run concurrently–one for state estimation and one for
Table 5.12 Automatic speech recognition rates for cleanrecordings of telephone speech (spoken digits), as comparedwith the same speech corrupted by white noise, and subse-quently processed by spectral subtraction (SSUB), a cellularphone enhancement standard (IS-718), and the dual EKF
Correct words Correct sentences
Clean 96.37% 85.81% (514=599)
Noisy 59.21% 21.37% (128=599)
SSUB 77.45% 38.06% (228=599)
IS-718 67.32% 29.22% (175=599)
Dual EKF 82.19% 52.92% (317/599)
6 This fact is overlooked in [6], which emphasizes the similarity of these two algorithms.
5.6 CONCLUSIONS 163

weight estimation. By modification of the weight filter into an observed
error form, it is possible to minimize each of the cost functions that are
developed.7 This provided a common algorithmic platform for the
implementation of a broad variety of methods. In general, the dual EKF
algorithm represents a sequential approach, which is applicable to both
linear and nonlinear models, and which can be used in the presence of
white or colored measurement noise. In addition, the algorithm has been
extended to provide estimation of noise variance parameters within the
same theoretical framework; this contribution is crucial in applications for
which this information is not otherwise available.
Finally, a number of examples have been presented to illustrate the
performance of the dual EKF methods. The ability of the dual EKF to
capture the underlying dynamics of a noisy time series has been illustrated
using the chaotic Henon map. The application of the algorithm to the IP
series demonstrates its potential in a real-world prediction context. On
speech enhancement problems, the lack of musical noise in the enhanced
speech underscores the advantages of a time-domain approach; the
usefulness of the dual EKF as a front-end to a speech recognizer has
also been demonstrated. In general, the state-space formulation of the
algorithm makes it applicable to a much wider variety of contexts than has
been explored here. The intent of this chapter was to show the utility of the
dual EKF as a fundamental method for solving a range of problems in
signal processing and modeling.
ACKNOWLEDGMENTS
This work was sponsored in part by the NSF under Grants ECS-0083106
and IRI-9712346.
APPENDIX A: RECURRENT DERIVATIVE OF THE KALMAN GAIN
(1) With Respect to the Weights
In the state-estimation filter, the derivative of the Kalman gain with respect
to the weights w is computed as follows. Denoting the derivative of Kxk
7 Note that Kalman algorithms are approximate MAP optimization procedures for
nonlinear systems. Hence, future work considers alternative optimization procedures
(e.g., unscented Kalman filters [29]), which can still be cast within the same theoretically
motivated dual estimation framework.
164 5 DUAL EXTENDED KALMAN FILTER METHODS

with respect to the ith element of ww by @Kxk=@wwðiÞ (the ith column of
@Kxk=@ww) gives
@Kxk
@wwðiÞ¼
I � KxkC
CP�xk
CTþ s2
n
@P�xk
@wwðiÞCT ; ð5:109Þ
where the derivatives of the error covariances are
@P�xk
@wwðiÞ¼
@Ak�1
@wwðiÞPxk�1
ATk�1 þ Ak�1
@Pxk�1
@wwðiÞAT
k�1 þ Ak�1Pxk�1
@ATk�1
@wwðiÞ; ð5:110Þ
@Pxk�1
@wwðiÞ¼ �
@Kxk�1
@wwðiÞCP�
k�1 þ ðI � Kxk�1CÞ
@P�xk�1
@wwðiÞ: ð5:111Þ
Note that Ak�1 depends not only on the weights ww, but also on the point of
linearization, xxk�1. Therefore,
@Ak�1
@wwðiÞ¼
@2F
@xxk�1@wwðiÞþ
@2F
ð@xxk�1Þ2
@xxk�1
@wwðiÞ; ð5:112Þ
where the first term is the static derivative of Ak�1 ¼ @F=@xk�1 with xxk�1
fixed, and the second term includes the recurrent derivative of xxk�1. The
term @2F=ð@xxk�1Þ2 actually represents a three-dimensional tensor (rather
than a matrix), and care must be taken with this calculation. However,
when Ak�1 takes on a sparse structure, as with time-series applications, its
derivative with respect to x contains mostly zeroes, and is in fact entirely
zero for linear models.
(2) With Respect to the Variances
In the variance-estimation filter, the derivatives @Kxk=@s
2 may be calcu-
lated as follows:
@Kxk
@s2¼
I � KxkC
CP�k CT
þ s2n
@P�xk
@s2CT ; ð5:113Þ
APPENDIX A 165

where
@P�xk
@s2¼
@Ak�1
@s2Pk�1AT
k�1 þ Ak�1
@Pxk�1
@s2AT
k�1 þ Ak�1Pk�1
@Ak�1
@s2; ð5:114Þ
@Pxk�1
@s2¼ �
@Kxk�1
@s2CP�
k�1 þ ðI � Kxk�1CÞ
@P�xk�1
@s2: ð5:115Þ
Because Ak�1 depends on the linearization point, xxk�1, its derivative is
@Ak�1
@s2¼
@Ak�1
@xxk�1
@xxk�1
@s2; ð5:116Þ
where again the derivative @ww=@s2 is assumed to be zero.
APPENDIX B: DUAL EKF WITH COLORED MEASUREMENT NOISE
In this appendix, we give dual EKF equations for additive colored noise.
Colored noise is modeled as a linear AR process:
nk ¼PMn
i¼1
aðiÞn nk�i þ vn;k; ð5:128Þ
where the parameters aðiÞn are assumed to be known, and vnk is a white
Gaussian process with (possibly unknown) variance s2vn
. The noise nk can
now be thought of as a second signal added to the first, but with the
distinction that it has been generated by a known system. Note that the
constraint yk ¼ xk þ nk , requires that the estimates xxk and nnk must also
sum to yk . To enforce this constraint, both the signal and noise are
incorporated into a combined state-space representation:
k ¼ Fcð k�1;w; anÞ þ Bcvc;k; ð5:129Þ
xk
nk
� �¼
Fðxk�1;wÞ
An � nk�1
� �þ
B 0
0 Bn
� �vk
vn;k
� �; ð5:130Þ
yk ¼ Ccjk;
yk ¼ ½C Cn�xk
nk
� �;
166 5 DUAL EXTENDED KALMAN FILTER METHODS

where
An ¼4
að1Þn a
ð2Þn . . . a
ðMnÞn
1 0 0 0
0 . ..
0 ...
0 0 1 0
26664
37775; Cn ¼ BT
n ¼ ½1 0 . . . 0�:
The effective measurement noise is zero, and the process noise vc;k is
white, as required, with covariance
Vc ¼s2v 0
0 s2vn
� �:
Because nk can be viewed as a second signal, it should be estimated on
an equal footing with xk . Consider, therefore, maximizing rxN1
nN1
wjyN1
(where nN1 is a vector comprising elements in fnkg
N1 ) instead of rxN
1wjyN
1.
We can write this term as
rxN1
nN1
wjyN1¼
ryN1
xN1
nN1jwrw
ryN1
; ð5:131Þ
and (in the absence of prior information about w) maximize ryN1
xN1
nN1jw
alone. As before, the cost functions that result from this approach can be
categorized as joint or marginal costs, and their derivations are similar to
those for the white noise case. The associated dual EKF algorithm for
colored noise is given in Table 5.13. Minimization of different cost
function is again achieved by simply redefining the error term. These
modifications are presented without derivation below.
Joint Estimation Forms
The corresponding weight cost function and error terms for a decoupled
approach is given in Table 5.14.
APPENDIX B 167

Marginal Estimation–Maximum-Likelihood Cost
The corresponding weight cost function, and error terms are given in
Table 5.15, where
ek ¼4
yk � ðxx�k þ nn�k Þ; le;k ¼s2e;k
3e2k � 2s2
e;k
Table 5.13 The dual extended Kalman filter equations for coloredmeasurement noise. The definitions of k and Cw
k will depend on the costfunction used for weight estimation
Initialize with
ww0 ¼ E½w�; Pw0¼ E½ðw � ww0Þðw � ww0Þ
T�;
jj0 ¼ E½j0�; Pj0¼ E½ðj0 � jj0Þðj0 � jj0Þ
T�:
For k 2 1; . . . ;1f g, the time-update equations for the weight filter are
ww�k ¼ wwk�1; ð5:117Þ
P�wk
¼ Pwk�1þ Rr
k�1; ð5:118Þ
and those for the signal filter are
jj�k ¼ Fðjjk�1; ww�k Þ; ð5:119Þ
P�jk¼ Ak�1Pjk�1
ATk�1 þ BcRv
cBTc : ð5:120Þ
The measurement-update equations for the signal filter are
Kjk ¼ P�
jkCT
c ðCcP�jk
CTc Þ
�1; ð5:121Þ
jjk ¼ jj�k þ Kjkðyk � Ccjj
�k Þ; ð5:122Þ
Pjk¼ ðI � K
jkCÞP�
jk; ð5:123Þ
and those for the weight filter are
Kwk ¼ P�
wkðCw
k ÞT½Cw
k P�wkðCw
k ÞTþ Re�
�1; ð5:124Þ
wwk ¼ ww�k þ Kw
k � k; ð5:125Þ
Pwk¼ ðI � Kw
k Cwk ÞP
�wk; ð5:126Þ
where
Ak�1 ¼4 @Fðj; ww�
k ; anÞ
@j
����jjk�1
; k ¼ yk � Ccjj�k ; Cw
k ¼4
�@ k
@w¼ Cc
@jj�k@w
����w¼ww�
k:
ð5:127Þ
168 5 DUAL EXTENDED KALMAN FILTER METHODS

Marginal Estimation Forms–Prediction Error Cost
If s2ek
is assumed to be independent of w, then we have the prediction error
cost shown in Table 5.16. Note that an alternative prediction error form
may be derived by including Hwnn�k in the calculation of Cw
k . However, the
performance appears superior if this term is neglected.
Table 5.15 Maximum-likelihood cost function: observed errorterms for the dual EKF weight filter
J mlc ðwÞ ¼
PNk¼1
logð2ps2ekÞ þ
ðyk � xx�k � nn�k Þ
2
s2ek
" #;
k ¼4 ðle;kÞ
s�1ekek
" #1=2
; Cwk ¼
�1
2
ðle;kÞ�1=2
s2ek
HTwðs
2ekÞ
�1
sek
HTwek þ
ek
2ðs2ekÞ3=2
HTwðs
2ekÞ
26664
37775:
Table 5.16 Colored-noise prediction-error cost function:observed error terms for the dual EKF weight filter
J pec ðwÞ ¼
PNk¼1
e2k ¼
PNk¼1
ðyk � xx�k � nn�k Þ
2; ð5:133Þ
k ¼4
yk � nnk � xx�k ; Cwk ¼ �Hwxx�k :
Table 5.14 Colored-noise joint cost function: observed error termsfor the dual EKF weight filter
J ðxxk1; nnk
1;wÞ þPkt¼1
ðxxt � xx�t Þ2
s2v
þðnnt � nn�
t Þ2
s2vn
" #; or Jk ¼
Pkt¼1
~xxxx2k
s2v
þ~nnnn2
k
s2vn
!;
k ¼4
s�1v
~xxxxk
s�1vn
~nnnnk
24
35; Cw
k ¼ �s�1v HT
w~xxxxk
s�1vnHT
w~nnnnk
24
35:
ð5:132Þ
APPENDIX B 169

Marginal Estimation–EM Cost
The cost and observed error terms for weight estimation with colored
noise are identical to those for the white-noise case, shown in Table 5.8. In
this case, the on-line statistics are found by augmenting the combined state
vector with one additional lagged value for both the signal and noise.
Specifically,
jþk ¼
xk
xk�M
nk
nk�Mn
2664
3775 ¼
xk
xk�1
nk
nk�1
2664
3775; ð5:134Þ
so that the estimate jjþk produced by a Kalman filter will contain xxk�1jk in
elements 2; . . . ; 1 þ M , and nnk�1jk in its last Mn elements. Furthermore,
the error variances p�kjk and p
y
kjk can be obtained from the covariance Pþc;k
of jþk produced by the KF.
REFERENCES
[1] R.E. Kopp and R.J. Orford, ‘‘Linear regression applied to system identifica-
tion for adaptive control systems,’’ AIAA Journal, 1, 2300–2006 (1963).
[2] H. Cox, ‘‘On the estimation of state variables and parameters for noisy
dynamic systems,’’ IEEE Transactions on Automatic Control, 9, 5–12
(1964).
[3] L. Ljung, ‘‘Asymptotic behavior of the extended Kalman filter as a parameter
estimator for linear systems,’’ IEEE Transactions on Automatic Control, 24,
36–50 (1979).
[4] M. Niedzwiecki and K. Cisowski, ‘‘Adaptive scheme of elimination of
broadband noise and impulsive disturbances from AR and ARMA signals,’’
IEEE Transactions on Signal Processing, 44, 528–537 (1996).
[5] L.W. Nelson and E. Stear, ‘‘The simultaneous on-line estimation of para-
meters and states in linear systems,’’ IEEE Transactions on Automatic
Control, Vol. AC-12, 438–442 (1967).
[6] L. Ljung and T. Soderstrom, Theory and Practice of Recursive Identification.
Cambridge, MA: MIT Press, 1983.
[7] H. Akaike, ‘‘Maximum likelihood identification of Gaussian autoregressive
moving average models,’’ Biometrika, 60, 255–265 (1973).
170 5 DUAL EXTENDED KALMAN FILTER METHODS

[8] N.K. Gupta and R.K. Mehra, ‘‘Computational aspects of maximum like-
lihood estimation and reduction in sensitivity function calculations,’’ IEEE
Transaction on Automatic Control, 19, 774–783 (1974).
[9] J.S. Lim and A.V. Oppenheim, ‘‘All-pole modeling of degraded speech,’’
IEEE Transactions on Acoustics, Speech and Signal Processing, 26, 197–
210 (1978).
[10] A. Dempster, N.M. Laird, and D.B. Rubin, ‘‘Maximum-likelihood from
incomplete data via the EM algorithm,’’ Journal of the Royal Statistical
Society, Ser. B, 39, 1–38 (1977).
[11] B.R. Musicus and J.S. Lim, ‘‘Maximum likelihood parameter estimation
of noisy data,’’ in Proceedings of the International Conference on
Acoustics, Speech, and Signal Processing, IEEE, April 1979, pp.
224–227.
[12] R.H. Shumway and D.S. Stoffer, ‘‘An approach to time series smoothing and
forecasting using the EM algorithm,’’ Journal of Time Series Analysis, 3,
253–264 (1982).
[13] E. Weinstein, A.V. Oppenheim, M. Feder, and J.R. Buck, ‘‘Iterative and
sequential algorithms for multisensor signal enhancement,’’ IEEE Transac-
tions on Signal Processing, 42, 846–859 (1994).
[14] J.T. Connor, R.D. Martin, and L.E. Atlas, ‘‘Recurrent neural networks and
robust time series prediction,’’ IEEE Transactions on Neural Networks, 5(2),
240–254 (1994).
[15] S.C. Stubberud and M. Owen, ‘‘Artificial neural network feedback loop with
on-line training, in Proceedings of International Symposium on Intelligent
Control, IEEE, September 1996, pp. 514–519.
[16] Z. Ghahramani and S.T. Roweis, ‘‘Learning nonlinear dynamical systems
using an EM algorithm,’’ in Advances in Neural Information Processing
Systems 11: Proceedings of the 1998 Conference. Cambridge, MA: MIT
Press, 1999.
[17] T. Briegel and V. Tresp, ‘‘Fisher scoring and a mixture of modes approach for
approximate inference and learning in nonlinear state space models,’’ in
Advances in Neural Information Processing Systems 11: Proceedings of the
1998 Conference. Cambridge, MA: MIT Press, 1999.
[18] G. Seber and C. Wild, Nonlinear Regression. New York: Wiley, 1989, pp.
491–527.
[19] E.A. Wan and A.T. Nelson, ‘‘Dual Kalman filtering methods for nonlinear
prediction, estimation, and smoothing,’’ in Advances in Neural Information
Processing Systems 9. Cambridge, MA: MIT Press, 1997.
[20] E.A. Wan and A.T. Nelson, ‘‘Neural dual extended Kalman filtering:
Applications in speech enhancement and monaural blind signal separation,’’
in Proceedings of IEEE Workshop on Neural Networks for Signal Proces-
sing, 1997.
REFERENCES 171

[21] A.T. Nelson and E.A. Wan, ‘‘A two-observation Kalman framework for
maximum-likelihood modeling of noisy time series,’’ in Proceedings of
International Joint Conference on Neural Networks, IEEE/INNS, May 1998.
[22] A.T. Nelson, ‘‘Nonlinear Estimation and Modeling of Noisy Time-Series by
Dual Kalman Filter Methods,’’ PhD thesis, Oregon Graduate Institute of
Science and Technology, 2000.
[23] R.E. Kalman, ‘‘A new approach to linear filtering and prediction problems,’’
Transactions of the ASME, Ser. D, Journal of Basic Engineering, 82, 35–45
(1960).
[24] J.F.G. de Freitas, M. Niranjan, A.H. Gee, and A. Doucet, ‘‘Sequential Monte
Carlo methods for optimisation of neural network models,’’ Technical Report
TR-328, Cambridge University Engineering Department, November 1998.
[25] R. van der Merwe, N. de Freitas, A. Doucet, and E. Wan, ‘‘The unscented
particle filter,’’ Technical Report CUED=F-INFENG=TR 380, Cambridge
University Engineering Department, August 2000.
[26] S.J. Julier, J.K. Uhlmann, and H. Durrant-Whyte, ‘‘A new approach for
filtering nonlinear systems,’’ in Proceedings of the American Control
Conference, 1995, pp. 1628–1632.
[27] S.J. Julier and J.K. Uhlmann, ‘‘A general method for approximating nonlinear
transformations of probability distributions,’’ Technical Report, RRG, Depart-
ment of Engineering Science, University of Oxford, November 1996. http://
www.robots.ox.ac.uk/~siju/work/publications/letter_size/Unscented.zip.
[28] E.A. Wan and R. van der Merwe, ‘‘The unscented Kalman filter for nonlinear
estimation,’’ in Proceedings of Symposium 2000 on Adaptive Systems for
Signal Processing, Communication and Control (AS-SPCC), Lake Louise,
Alberta, Canada, IEEE, October 2000.
[29] E.A. Wan, R. van der Merwe, and A.T. Nelson, ‘‘Dual estimation and the
unscented transformation,’’ in Advances in Neural Information Processing
Systems 12: Proceedings of the 1999 Conference. Cambridge, MA: MIT
Press, 2000.
[30] S. Singhal and L. Wu, ‘‘Training multilayer perceptrons with the extended
Kalman filter,’’ in Advances in Neural Information Processing Systems 1.
San Mateo, CA: Morgan Kauffman, 1989, pp. 133–140.
[31] G.V. Puskorius and L.A. Feldkamp, ‘‘Neural control of nonlinear dynamic
systems with Kalman filter trained recurrent networks,’’ IEEE Transactions
on Neural Networks, 5 (1994).
[32] E.S. Plumer, ‘‘Training neural networks using sequential-update forms of the
extended Kalman filter,’’ Informal Report LA-UR-95-422, Los Alamos
National Laboratory, January 1995.
[33] A.H. Sayed and T. Kailath, ‘‘A state-space approach to adaptive RLS
filtering,’’ IEEE Signal Processing Magazine, 11(3), 18–60 (1994).
172 5 DUAL EXTENDED KALMAN FILTER METHODS

[34] S. Haykin, Adaptive Filter Theory, 3rd ed. Upper Saddle River, NJ: Prentice-
Hall, 1996.
[35] R. Williams and D. Zipser, ‘‘A learning algorithm for continually running
fully recurrent neural networks,’’ Neural Computation, 1, 270–280 (1989).
[36] F.L. Lewis, Optimal Estimation. New York: Wiley, 1986.
[37] R.K. Mehra, Identification of stochastic linear dynamic systems using
Kalman filter representation. AIAA Journal, 9, 28–31 (1971).
[38] B.D. Ripley, Pattern Recognition and Neural Networks. Cambridge Univer-
sity Press, 1996.
[39] T.M. Cover and J.A. Thomas, Elements of Information Theory. New York:
Wiley, 1991.
[40] G.V. Puskorius and L.A. Feldkamp, ‘‘Extensions and enhancements of
decoupled extended Kalman filter training, in Proceedings of International
Conference on Neural Networks, ICNN’97, IEEE, June 1997, Vol. 3.
[41] N.N. Schraudolph, ‘‘Online local gain adaptation for multi-layer percep-
trons,’’ Technical report, IDSIA, Lugano, Switzerland, March 1998.
[42] P.J. Werbos, Handbook of Intelligent Control. New York: Van Nostrand
Reinhold, 1992, pp. 283–356.
[43] FRED: Federal Reserve Economic Data. Available on the Internet at http://
www.stls.frb.org/fred/. Accessed May 9, 2000.
[44] J. Moody, U. Levin, and S. Rehfuss, ‘‘Predicting the U.S. index of industrial
production,’’ Neural Network World, 3, 791–794 (1993).
[45] J.H.L. Hansen, J.R. Deller, and J.G. Praokis, Discrete-Time Processing of
Speech Signals. New York: Macmillan, 1993.
[46] E.A. Wan and A.T. Nelson, ‘‘Removal of noise from speech using the dual
EKF algorithm,’’ in Proceedings of International Conference on Acoustics,
Speech, and Signal Processing, IEEE, May 1998.
[47] Center for Spoken Language Understanding, Speech Enhancement Assess-
ment Resource (SpEAR). Available on the Internet at http://cslu.ece.ogi.edu/
nsel/data/index.html. Accessed May 2000.
[48] Rice University, Signal Processing Information Base (SPIB). Available on
the Internet at http://spib.ece.rice.edu/signal.html. Accessed September 15,
1999.
[49] J.H.L. Hansen and B.L. Pellom, ‘‘An effective quality evaluation protocol for
speech enhancement algorithms,’’ in Proceedings of International Confer-
ence on Spoken Language Processing, ICSLP-98, Sidney, 1998.
REFERENCES 173


6
LEARNING NONLINEARDYNAMICAL SYSTEMS
USING THE EXPECTATION–MAXIMIZATION ALGORITHM
Sam Roweis and Zoubin GhahramaniGatsby Computational Neuroscience Unit, University College London, London U.K.
6.1 LEARNING STOCHASTIC NONLINEAR DYNAMICS
Since the advent of cybernetics, dynamical systems have been an
important modeling tool in fields ranging from engineering to the physical
and social sciences. Most realistic dynamical systems models have two
essential features. First, they are stochastic – the observed outputs are a
noisy function of the inputs, and the dynamics itself may be driven by
some unobserved noise process. Second, they can be characterized by
175
Kalman Filtering and Neural Networks, Edited by Simon HaykinISBN 0-471-36998-5 # 2001 John Wiley & Sons, Inc.

some finite-dimensional internal state that, while not directly observable,
summarizes at any time all information about the past behavior of the
process relevant to predicting its future evolution.
From a modeling standpoint, stochasticity is essential to allow a model
with a few fixed parameters to generate a rich variety of time-series
outputs.1 Explicitly modeling the internal state makes it possible to
decouple the internal dynamics from the observation process. For exam-
ple, to model a sequence of video images of a balloon floating in the wind,
it would be computationally very costly to directly predict the array of
camera pixel intensities from a sequence of arrays of previous pixel
intensities. It seems much more sensible to attempt to infer the true state of
the balloon (its position, velocity, and orientation) and decouple the
process that governs the balloon dynamics from the observation process
that maps the actual balloon state to an array of measured pixel intensities.
Often we are able to write down equations governing these dynamical
systems directly, based on prior knowledge of the problem structure and
the sources of noise – for example, from the physics of the situation. In
such cases, we may want to infer the hidden state of the system from a
sequence of observations of the system’s inputs and outputs. Solving this
inference or state-estimation problem is essential for tasks such as tracking
or the design of state-feedback controllers, and there exist well-known
algorithms for this.
However, in many cases, the exact parameter values, or even the gross
structure of the dynamical system itself, may be unknown. In such cases,
the dynamics of the system have to be learned or identified from
sequences of observations only. Learning may be a necessary precursor
if the ultimate goal is effective state inference. But learning nonlinear
state-based models is also useful in its own right, even when we are not
explicitly interested in the internal states of the model, for tasks such as
prediction (extrapolation), time-series classification, outlier detection, and
filling-in of missing observations (imputation). This chapter addresses the
problem of learning time-series models when the internal state is hidden.
Below, we briefly review the two fundamental algorithms that form the
basis of our learning procedure. In section 6.2, we introduce our algorithm
1There are, of course, completely deterministic but chaotic systems with this property. If
we separate the noise processes in our models from the deterministic portions of the
dynamics and observations, we can think of the noises as another deterministic (but highly
chaotic) system that depends on initial conditions and exogenous inputs that we do not
know. Indeed, when we run simulations using a psuedo-random-number generator started
with a particular seed, this is precisely what we are doing.
176 6 LEARNING NONLINEAR DYNAMICAL SYSTEMS USING EM

and derive its learning rules. Section 6.3 presents results of using the
algorithm to identify nonlinear dynamical systems. Finally, we present
some conclusions and potential extensions to the algorithm in Sections 6.4
and 6.5.
6.1.1 State Inference and Model Learning
Two remarkable algorithms from the 1960s – one developed in engineer-
ing and the other in statistics – form the basis of modern techniques in
state estimation and model learning. The Kalman filter, introduced by
Kalman and Bucy in 1961 [1], was developed in a setting where the
physical model of the dynamical system of interest was readily available;
its goal is optimal state estimation in systems with known parameters. The
expectation–maximization (EM) algorithm, pioneered by Baum and
colleagues [2] and later generalized and named by Dempster et al. [3],
was developed to learn parameters of statistical models in the presence of
incomplete data or hidden variables.
In this chapter, we bring together these two algorithms in order to learn
the dynamics of stochastic nonlinear systems with hidden states. Our goal
is twofold: both to develop a method for identifying the dynamics of
nonlinear systems whose hidden states we wish to infer, and to develop a
general nonlinear time-series modeling tool. We examine inference and
learning in discrete-time2 stochastic nonlinear dynamical systems with
hidden states xk , external inputs uk , and noisy outputs yk . (All lower-case
characters (except indices) denote vectors. Matrices are represented by
upper-case characters.) The systems are parametrized by a set of tunable
matrices, vectors, and scalars, which we shall collectively denote as y. The
inputs, outputs, and states are related to each other by
xkþ1 ¼ f ðxk; ukÞ þ wk; ð6:1aÞ
yk ¼ gðxk; ukÞ þ vk; ð6:1bÞ
2Continuous-time dynamical systems (in which derivatives are specified as functions of the
current state and inputs) can be converted into discrete-time systems by sampling their
outputs and using ‘‘zero-order holds’’ on their inputs. In particular, for a continuous-time
linear system _xxðtÞ ¼ AcxðtÞ þ BcuðtÞ sampled at interval t, the corresponding dynamics and
input driving matrices so that xkþ1 ¼ Axk þ Buk are A ¼P1
k¼0Ak
ctk=k! ¼ expðActÞ and
B ¼ A�1c ðA� I ÞBc.
6.1 LEARNING STOCHASTIC NONLINEAR DYNAMICS 177

where wk and vk are zero-mean Gaussian noise processes. The state vector
x evolves according to a nonlinear but stationary Markov dynamics3
driven by the inputs u and by the noise source w. The outputs y are
nonlinear, noisy but stationary and instantaneous functions of the current
state and current input. The vector-valued nonlinearities f and g are
assumed to be differentiable, but otherwise arbitrary. The goal is to
develop an algorithm that can be used to model the probability density
of output sequences (or the conditional density of outputs given inputs)
using only a finite number of example time series. The crux of the problem
is that both the hidden state trajectory and the parameters are unknown.
Models of this kind have been examined for decades in systems and
control engineering. They can also be viewed within the framework of
probabilistic graphical models, which use graph theory to represent the
conditional dependencies between a set of variables [4, 5]. A probabilistic
graphical model has a node for each (possibly vector-valued) random
variable, with directed arcs representing stochastic dependences. Absent
connections indicate conditional independence. In particular, nodes are
conditionally independent from their non-descendents, given their parents
– where parents, children, descendents, etc, are defined with respect to the
directionality of the arcs (i.e., arcs go from parent to child). We can
capture the dependences in Eqs. (6.1a,b) compactly by drawing the
graphical model shown in Figure 6.1.
One of the appealing features of probabilistic graphical models is that
they explicitly diagram the mechanism that we assume generated the data.
This generative model starts by picking randomly the values of the nodes
that have no parents. It then picks randomly the values of their children
Figure 6.1 A probabilistic graphical model for stochastic dynamicalsystems with hidden states xk , inputs uk , and observables yk .
3Stationarity means here that neither f nor the covariance of the noise process wk , depend
on time; that is, the dynamics are time-invariant. Markov refers to the fact that given the
current state, the next state does not depend on the past history of the states.
178 6 LEARNING NONLINEAR DYNAMICAL SYSTEMS USING EM

given the parents’ values, and so on. The random choices for each child
given its parents are made according to some assumed noise model. The
combination of the graphical model and the assumed noise model at each
node fully specify a probability distribution over all variables in the model.
Graphical models have helped clarify the relationship between dyna-
mical systems and other probabilistic models such as hidden Markov
models and factor analysis [6]. Graphical models have also made it
possible to develop probabilistic inference algorithms that are vastly
more general than the Kalman filter.
If we knew the parameters, the operation of interest would be to infer
the hidden state sequence. The uncertainty in this sequence would be
encoded by computing the posterior distributions of the hidden state
variables given the sequence of observations. The Kalman filter (reviewed
in Chapter 1) provides a solution to this problem in the case where f and g
are linear. If, on the other hand, we had access to the hidden state
trajectories as well as to the observables, then the problem would be
one of model-fitting, i.e. estimating the parameters of f and g and the
noise covariances. Given observations of the (no longer hidden) states and
outputs, f and g can be obtained as the solution to a possibly nonlinear
regression problem, and the noise covariances can be obtained from the
residuals of the regression. How should we proceed when both the system
model and the hidden states are unknown?
The classical approach to solving this problem is to treat the parameters
y as ‘‘extra’’ hidden variables, and to apply an extended Kalman filtering
(EKF) algorithm (see Chapter 1) to the nonlinear system with the state
vector augmented by the parameters [7, 8]. For stationary models, the
dynamics of the parameter portion of this extended state vector are set to
the identity function. The approach can be made inherently on-line, which
may be important in certain applications. Furthermore, it provides an
estimate of the covariance of the parameters at each time step. Finally, its
objective, probabilistically speaking, is to find an optimum in the joint
space of parameters and hidden state sequences.
In contrast, the algorithm we present is a batch algorithm (although, as
we discuss in Section 6.4.2, online extensions are possible), and does not
attempt to estimate the covariance of the parameters. Like other instances
of the EM algorithm, which we describe below, its goal is to integrate over
the uncertain estimates of the unknown hidden states and optimize the
resulting marginal likelihood of the parameters given the observed data.
An extended Kalman smoother (EKS) is used to estimate the approximate
state distribution in the E-step, and a radial basis function (RBF) network
[9, 10] is used for nonlinear regression in the M-step. It is important not to
6.1 LEARNING STOCHASTIC NONLINEAR DYNAMICS 179

confuse this use of the extended Kalman algorithm, namely, to estimate
just the hidden state as part of the E-step of EM, with the use that we
described in the previous paragraph, namely to simultaneously estimate
parameters and hidden states.
6.1.2 The Kalman Filter
Linear dynamical systems with additive white Gaussian noises are the
most basic models to examine when considering the state-estimation
problem, because they admit exact and efficient inference. (Here, and in
what follows, we call a system linear if both the state evolution function
and the state-to-output observation function are linear, and nonlinear
otherwise.) The linear dynamics and observation processes correspond
to matrix operations, which we denote by A;B and C;D, respectively,
giving the classic state-space formulation of input-driven linear dynamical
systems:
xkþ1 ¼ Axk þ Buk þ wk; ð6:2aÞ
yk ¼ Cxk þ Duk þ vk : ð6:2bÞ
The Gaussian noise vectors w and v have zero mean and covariances Q
and R respectively. If the prior probability distribution pðx1Þ over initial
states is taken to be Gaussian, then the joint probabilities of all states and
outputs at future times are also Gaussian, since the Gaussian distribution is
closed under the linear operations applied by state evolution and output
mapping and under the convolution applied by additive Gaussian noise.
Thus, all distributions over hidden state variables are fully described by
their means and covariance matrices. The algorithm for exactly computing
the posterior mean and covariance for xk given some sequence of
observations consists of two parts: a forward recursion, which uses the
observations from y1 to yk , known as the Kalman filter [11], and a
backward recursion, which uses the observations from yT to ykþ1. The
combined forward and backward recursions are known as the Kalman or
Rauch–Tung–Streibel (RTS) smoother [12]. These algorithms are
reviewed in detail in Chapter 1.
There are three key insights to understanding the Kalman filter. The
first is that the Kalman filter is simply a method for implementing Bayes’
rule. Consider the very general setting where we have a prior pðxÞ on some
180 6 LEARNING NONLINEAR DYNAMICAL SYSTEMS USING EM

state variable and an observation model pðyjxÞ for the noisy outputs given
the state. Bayes’ rule gives us the state-inference procedure:
pðxjyÞ ¼pðyjxÞpðxÞ
pðyÞ¼
pðyjxÞpðxÞ
Z; ð6:3aÞ
Z ¼ pðyÞ ¼
ðx
pðyjxÞpðxÞ dx; ð6:3bÞ
where the normalizer Z is the unconditional density of the observation. All
we need to do in order to convert our prior on the state into a posterior is
to multiply by the likelihood from the observation equation, and then
renormalize.
The second insight is that there is no need to invert the output or
dynamics functions, as long as we work with easily normalizable
distributions over hidden states. We see this by applying Bayes’ rule to
the linear Gaussian case for a single time step.4 We start with a Gaussian
belief nðxk�1, Vk�1Þ on the current hidden state, use the dynamics to
convert this to a prior nðxþ, VþÞ on the next state, and then condition on
the observation to convert this prior into a posterior nðxk, VkÞ. This gives
the classic Kalman filtering equations:
pðxk�1Þ ¼nðxþ;VþÞ; ð6:4aÞ
xþ ¼ Axk�1; Vþ ¼ AVk�1A> þ Q; ð6:4bÞ
pðyk jxkÞ ¼nðCxk;RÞ; ð6:4cÞ
pðxk jykÞ ¼nðxk;VkÞ; ð6:4dÞ
xk ¼ xþ þ Kðyk � CxþÞ; Vk ¼ ðI � KCÞVþ; ð6:4eÞ
K ¼ VþC>ðCVþC> þ RÞ�1: ð6:4f Þ
The posterior is again Gaussian and analytically tractable. Notice that
neither the dynamics matrix A nor the observation matrix C needed to be
inverted.
The third insight is that the state-estimation procedures can be imple-
mented recursively. The posterior from the previous time step is run
through the dynamics model and becomes our prior for the current time
step. We then convert this prior into a new posterior by using the current
observation.
4Some notation: A multivariate normal (Gaussian) distribution with mean m and covariance
matrix S is written as nðm;SÞ. The same Gaussian evaluated at the point z is denoted by
nðm;SÞjz. The determinant of a matrix is denoted by jAj and matrix inversion by A�1. The
symbol means ‘‘distributed according to.’’
6.1 LEARNING STOCHASTIC NONLINEAR DYNAMICS 181

For the general case of a nonlinear system with non-Gaussian noise,
state estimation is much more complex. In particular, mapping through
arbitrary nonlinearities f and g can result in arbitrary state distributions,
and the integrals required for Bayes’ rule can become intractable. Several
methods have been proposed to overcome this intractability, each provid-
ing a distinct approximate solution to the inference problem. Assuming f
and g are differentiable and the noise is Gaussian, one approach is to
locally linearize the nonlinear system about the current state estimate so
that applying the Kalman filter to the linearized system the approximate
state distribution remains Gaussian. Such algorithms are known as
extended Kalman filters (EKF) [13, 14]. The EKF has been used both
in the classical setting of state estimation for nonlinear dynamical systems
and also as a basis for on-line learning algorithms for feedforward neural
networks [15] and radial basis function networks [16, 17]. For more
details, see Chapter 2.
State inference in nonlinear systems can also be achieved by propagat-
ing a set of random samples in state space through f and g, while at each
time step re-weighting them using the likelihood pðyjxÞ. We shall refer to
algorithms that use this general strategy as particle filters [18], although
variants of this sampling approach are known as sequential importance
sampling, bootstrap filters [19], Monte Carlo filters [20], condensation
[21], and dynamic mixture models [22, 23]. A recent survey of these
methods is provided in [24]. A third approximate state-inference method,
known as the unscented filter [25–27], deterministically chooses a set of
balanced points and propagates them through the nonlinearities in order to
recursively approximate a Gaussian state distribution; for more details, see
Chapter 7. Finally, there are algorithms for approximate inference and
learning based on mean field theory and variational methods [28, 29].
Although we have chosen to make local linearization (EKS) the basis of
our algorithms below, it is possible to formulate the same learning algorithms
using any approximate inference method (e.g., the unscented filter).
6.1.3 The EM Algorithm
The EM or expectation–maximization algorithm [3, 30] is a widely
applicable iterative parameter re-estimation procedure. The objective of
the EM algorithm is to maximize the likelihood of the observed data
PðY jyÞ in the presence of hidden5 variables X . (We shall denote the entire
5Hidden variables are often also called latent variables; we shall use both terms. They can
also be thought of as missing data for the problem or as auxiliary parameters of the model.
182 6 LEARNING NONLINEAR DYNAMICAL SYSTEMS USING EM

sequence of observed data by Y ¼ fy1; . . . ; ytg, observed inputs by
U ¼ fu1; . . . ; uT g, the sequence of hidden variables by X ¼ fx1; . . . ; xtg,
and the parameters of the model by y.) Maximizing the likelihood as a
function of y is equivalent to maximizing the log-likelihood:
LðyÞ ¼ log PðY jU ; yÞ ¼ log
ðX
PðX ;Y jU ; yÞ dX: ð6:5Þ
Using any distribution QðX Þ over the hidden variables, we can obtain a
lower bound on L:
log
ðX
PðY ;X jU ; yÞ dX ¼ log
ðX
QðX ÞPðX ; Y jU ; yÞ
QðX ÞdX ð6:6aÞ
ðX
QðX Þ logPðX ; Y jU ; yÞ
QðX ÞdX ð6:6bÞ
¼
ðX
QðX Þ log PðX ; Y jU ; yÞ dX
�
ðX
QðX Þ log QðX Þ dX ð6:6cÞ
¼ FðQ; yÞ; ð6:6d Þ
where the middle inequality (6.6b) is known as Jensen’s inequality and can
be proved using the concavity of the log function. If we define the energy
of a global configuration ðX ;Y Þ to be �log PðX ;Y jU ; yÞ, then the lower
bound FðQ; yÞ � LðyÞ is the negative of a quantity known in statistical
physics as the free energy: the expected energy under Q minus the entropy
of Q [31]. The EM algorithm alternates between maximizing F with
respect to the distribution Q and the parameters y, respectively, holding
the other fixed. Starting from some initial parameters y0 we alternately
apply:
E-step: Qkþ1 arg maxQ
FðQ; ykÞ; ð6:7aÞ
M-step: ykþ1 arg maxyFðQkþ1; yÞ: ð6:7bÞ
It is easy to show that the maximum in the E-step results when Q is exactly
the conditional distribution of X , Q*kþ1ðX Þ ¼ PðX jY ;U ; ykÞ, at which
point the bound becomes an equality: FðQ*kþ1; ykÞ ¼ LðykÞ. The maxi-
6.1 LEARNING STOCHASTIC NONLINEAR DYNAMICS 183

mum in the M-step is obtained by maximizing the first term in (6.6c),
since the entropy of Q does not depend on y:
M-step: y*kþ1 arg maxy
ðX
PðX jY ;U ; ykÞ log PðX ;Y jU ; yÞ dX :
ð6:8Þ
This is the expression most often associated with the EM algorithm, but it
obscures the elegant interpretation [31] of EM as coordinate ascent in F
(see Fig. 6.2). Since F ¼ L at the beginning of each M-step, and since the
E-step does not change y, we are guaranteed not to decrease the likelihood
after each combined EM step. (While this is obviously true of ‘‘complete’’
EM algorithms as described above, it may also be true for ‘‘incomplete’’ or
‘‘sparse’’ variants in which approximations are used during the E- and=or
M-steps so long as F always goes up; see also the earlier work in [32].)
For example, this can take the form of a gradient M- step algorithm (where
we increase PðY jyÞ with respect to y but do not strictly maximize it), or
any E-step which improves the bound F without saturating it [31].)
In dynamical systems with hidden states, the E-step corresponds
exactly to solving the smoothing problem: estimating the hidden state
trajectory given both the observations=inputs and the parameter values.
The M-step involves system identification using the state estimates from
the smoother. Therefore, at the heart of the EM learning procedure is the
following idea: use the solutions to the filtering=smoothing problem to
estimate the unknown hidden states given the observations and the current
Figure 6.2 The EM algorithm can be thought of as coordinate ascent in thefunctional FðQðX Þ, yÞ (see text). The E-step maximizes F with respect to QðX Þgiven fixed y (horizontal moves), while the M-step maximizes F with respectto y given fixed QðX Þ (vertical moves).
184 6 LEARNING NONLINEAR DYNAMICAL SYSTEMS USING EM

model parameters. Then use this fictitious complete data to solve for new
model parameters. Given the estimated states obtained from the inference
algorithm, it is usually easy to solve for new parameters. For example,
when working with linear Gaussian models, this typically involves
minimizing quadratic forms, which can be done with linear regression.
This process is repeated, using these new model parameters to infer the
hidden states again, and so on. Keep in mind that our goal is to maximize
the log-likelihood (6.5) (or equivalently maximize the total likelihood) of
the observed data with respect to the model parameters. This means
integrating (or summing) over all the ways in which the model could have
produced the data (i.e., hidden state sequences). As a consequence of
using the EM algorithm to do this maximization, we find ourselves
needing to compute (and maximize) the expected log-likelihood of the
joint data (6.8), where the expectation is taken over the distribution of
hidden values predicted by the current model parameters and the observa-
tions.
In the past, the EM algorithm has been applied to learning linear
dynamical systems in specific cases, such as ‘‘multiple-indicator multiple-
cause’’ (MIMC) models with a single latent variable [33] or state-space
models with the observation matrix known [34]), as well as more generally
[35]. This chapter applies the EM algorithm to learning nonlinear
dynamical systems, and is an extension of our earlier work [36]. Since
then, there has been similar work applying EM to nonlinear dynamical
systems [37, 38]. Whereas other work uses sampling for the E-step and
gradient M-steps, our algorithm uses the RBF networks to obtain a
computationally efficient and exact M-step.
The EM algorithm has four important advantages over classical
approaches. First, it provides a straightforward and principled method
for handing missing inputs or outputs. (Indeed this was the original
motivation for Shumway and Stoffer’s application of the EM algorithm
to learning partially unknown linear dynamical systems [34].) Second, EM
generalizes readily to more complex models with combinations of discrete
and real-valued hidden variables. For example, one can formulate EM for
a mixture of nonlinear dynamical systems [39, 40]. Third, whereas it is
often very difficult to prove or analyze stability within the classical on-line
approach, the EM algorithm is always attempting to maximize the like-
lihood, which acts as a Lyapunov function for stable learning. Fourth, the
EM framework facilitates Bayesian extensions to learning – for example,
through the use of variational approximations [29].
6.1 LEARNING STOCHASTIC NONLINEAR DYNAMICS 185

6.2 COMBINING EKS AND EM
In the next sections, we shall describe the basic components of our EM
learning algorithm. For the expectation step of the algorithm, we infer an
approximate conditional distribution of the hidden states using Extended
Kalman Smoothing (Section 6.2.1). For the maximization step, we first
discuss the general case (Section 6.2.2), and then describe the particular
case where the nonlinearities are represented using Gaussian radial basis
function (RBF) networks (Section 6.2.3). Since, as with all EM or
likelihood ascent algorithms, our algorithm is not guaranteed to find the
globally optimum solutions, good initialization is a key factor in practical
success. We typically use a variant of factor analysis followed by
estimation of a purely linear dynamical system as the starting point for
training our nonlinear models (Section 6.2.4).
6.2.1 Extended Kalman smoothing (E-step)
Given a system described by Eqs. (6.1a,b), the E-step of an EM learning
algorithm needs to infer the hidden states from a history of observed
inputs and outputs. The quantities at the heart of this inference problem
are two conditional densities
Pðxk ju1; . . . ; uT ; y1; . . . ; yT Þ; 1 � k � T ; ð6:9Þ
Pðxk; xkþ1ju1; . . . ; uT ; y1; . . . ; yT Þ; 1 � k � T � 1: ð6:10Þ
For nonlinear systems, these conditional densities are in general non-
Gaussian, and can in fact be quite complex. For all but a very few
nonlinear systems, exact inference equations cannot be written down in
closed form. Furthermore, for many nonlinear systems of interest, exact
inference is intractable (even numerically), meaning that, in principle, the
amount of computation required grows exponentially in the length of the
time series observed. The intuition behind all extended Kalman algorithms
is that they approximate a stationary nonlinear dynamical system with a
non-stationary (time-varying) but linear system. In particular, extended
Kalman smoothing (EKS) simply applies regular Kalman smoothing to a
local linearization of the nonlinear system. At every point ~xx in x space, the
derivatives of the vector-valued functions f and g define the matrices,
A~xx �@f
@x
����x¼~xx
and C~xx �@g
@x
����x¼~xx
;
186 6 LEARNING NONLINEAR DYNAMICAL SYSTEMS USING EM

respectively. The dynamics are linearized about xxk , the mean of the current
filtered (not smoothed) state estimate at time t. The output equation can be
similarly linearized. These linearizations yield
xkþ1 � f ðxxk; ukÞ þ Axxkðxk � xxkÞ þ w; ð6:11Þ
yk � gðxxk; ukÞ þ Cxxkðxk � xxkÞ þ v: ð6:12Þ
If the noise distributions and the prior distribution of the hidden state at
k ¼ 1 are Gaussian, then, in this progressively linearized system, the
conditional distribution of the hidden state at any time k given the history
of inputs and outputs will also be Gaussian. Thus, Kalman smoothing can
be used on the linearized system to infer this conditional distribution; this
is illustrated in Figure 6.3.
Notice that although the algorithm performs smoothing (in other words,
it takes into account all observations, including future ones, when
inferring the state at any time), the linearization is only done in the
forward direction. Why not re-linearize about the backwards estimates
during the RTS recursions? While, in principle, this approach might give
better results, it is difficult to implement in practice because it requires the
dynamics functions to be uniquely invertible, which it often is not true.
Unlike the normal (linear) Kalman smoother, in the EKS, the error
covariances for the state estimates and the Kalman gain matrices do
Figure 6.3 Illustration of the information used in extended Kalman smooth-ing (EKS), which infers the hidden state distribution during the E-step of ouralgorithm. The nonlinear model is linearized about the current state esti-mate at each time, and then Kalman smoothing is used on the linearizedsystem to infer Gaussian state estimates.
6.2 COMBINING EKS AND EM 187

depend on the observed data, not just on the time index t. Furthermore, it
is no longer necessarily true that if the system is stationary, the Kalman
gain will converge to a value that makes the smoother act as the optimal
Wiener filter in the steady state.
6.2.2 Learning Model Parameters (M-step)
The M-step of our EM algorithm re-estimates the parameters of the model
given the observed inputs, outputs, and the conditional distributions over
the hidden states. For the model we have described, the parameters define
the nonlinearities f and g, and the noise covariances Q and R (as well as
the mean and covariance of the initial state, x1).
Two complications can arise in the M-step. First, fully re-estimating f
and g in each M-step may be computationally expensive. For example, if
they are represented by neural network regressors, a single full M-step
would be a lengthy training procedure using backpropagation, conjugate
gradients, or some other optimization method. To avoid this, one could use
partial M-steps that increase but do not maximize the expected log-
likelihood (6.8) – for example, each consisting of one or a few gradient
steps. However, this will in general make the fitting procedure much
slower.
The second complication is that f and g have to be trained using the
uncertain state-estimates output by the EKS algorithm. This makes it
difficult to apply standard curve-fitting or regression techniques. Consider
fitting f , which takes as inputs xk and uk and outputs xkþ1. For each t, the
conditional density estimated by EKS is a full-covariance Gaussian in ðxk ,
xkþ1Þ space. So f has to be fit not to a set of data points but instead to a
mixture of full-covariance Gaussians in input–output space (Gaussian
‘‘clouds’’ of data). Ideally, to follow the EM framework, this conditional
density should be integrated over during the fitting process. Integrating
over this type of data is nontrivial for almost any form of f . One simple but
inefficient approach to bypass this problem is to draw a large sample from
these Gaussian clouds of data and then fit f to these samples in the usual
way. A similar situation occurs with the fitting of the output function g.
We present an alternative approach, which is to choose the form of the
function approximator to make the integration easier. As we shall show,
using Gaussian radial basis function (RBF) networks [9, 10] to model f
and g allows us to do the integrals exactly and efficiently. With this choice
of representation, both of the above complications vanish.
188 6 LEARNING NONLINEAR DYNAMICAL SYSTEMS USING EM

6.2.3 Fitting Radial Basis Functions to Gaussian Clouds
We shall present a general formulation of an RBF network from which it
should be clear how to fit special forms for f and g. Consider the
following nonlinear mapping from input vectors x and u to an output
vector z:
z ¼PIi¼1
hiriðxÞ þ Axþ Buþ bþ w; ð6:13Þ
where w is a zero-mean Gaussian noise variable with covariance Q, and ri
are scalar valved RBFs defined below. This general mapping can be used
in several ways to represent dynamical systems, depending on which of
the input to hidden to output mappings are assumed to be nonlinear. Three
examples are: (1) representing f using (6.13) with the substitutions
x xk , u uk , and z xkþ1; (2) representing f using x ðxk; ukÞ,
u ;, and z xkþ1; and (3) representing g using the substitutions
x xk , u uk , and z yk . (Indeed, for different simulations, we shall
use different forms.) The parameters are the I coefficients hi of the RBFs;
the matrices A and B multiplying inputs x and u, respectively; and an
output bias vector b, and the noise covariance Q. Each RBF is assumed to
be a Gaussian in x space, with center ci and width given by the covariance
matrix Si:
riðxÞ ¼ j2pSij�1=2 exp½� 1
2ðx� ciÞ
>S�1
i ðx� ciÞ�; ð6:14Þ
where jSij is the determinant of the matrix Si. For now, we assume that the
centers and widths of the RBFs are fixed, although we discuss learning
their locations in Section 6.4.
The goal is to fit this RBF model to data (u; x; z). The complication is
that the data set comes in the form of a mixture of Gaussian distributions.
Here we show how to analytically integrate over this mixture distribution
to fit the RBF model.
Assume the data set is
Pðx; z; uÞ ¼1
J
Pj
njðx; zÞdðu� ujÞ: ð6:15Þ
That is, we observe samples from the u variables, each paired with a
Gaussian ‘‘cloud’’ of data, nj, over ðx; zÞ. The Gaussian nj has mean mj
and covariance matrix Cj.
6.2 COMBINING EKS AND EM 189

Let zzyðx; uÞ ¼PI
i¼1 hiriðxÞ þ Axþ Buþ b, where y is the set of para-
meters. The log-likelihood of a single fully observed data point under the
model would be
� 12½z� zzyðx; uÞ�>Q�1½z� zzyðx; uÞ� � 1
2ln jQj þ const:
Since the ðx; zÞ values in the data set are uncertain, the maximum expected
log-likelihood RBF fit to the mixture of Gaussian data is obtained by
minimizing the following integrated quadratic form:
miny;Q
Pj
ðx
ðz
njðx; zÞ½z� zzyðx; ujÞ�>Q�1½z� zzyðx; ujÞ� dx dzþ J ln jQj
( ):
ð6:16Þ
We rewrite this in a slightly different notation, using angular brackets h�ijto denote expectation over nj, and defining
y � ½h1; h2; . . . ; hI ;A;B; b�;
F � ½r1ðxÞ; r2ðxÞ; . . . ; rI ðxÞ; x>; u>; 1�>:
Then, the objective is written as
miny;Q
Pj
hðz� yFÞ>Q�1ðz� yFÞij þ J ln jQj
( ): ð6:17Þ
Taking derivatives with respect to y, premultiplying by �Q�1, and setting
the result to zero gives the linear equationsP
jhðz� yFÞFT ij ¼ 0, which
we can solve for y and Q:
yy ¼P
j
hzF>ij
! Pj
hFF>ij
!�1
; QQ ¼1
J
Pj
hzz>ij � yyP
j
hFz>ij
!:
ð6:18Þ
In other words, given the expectations in the angular brackets, the optimal
parameters can be solved for via a set of linear equations. In the Appendix,
we show that these expectations can be computed analytically and
efficiently, which means that we can take full and exact M-steps. The
derivation is somewhat laborious, but the intuition is very simple: the
190 6 LEARNING NONLINEAR DYNAMICAL SYSTEMS USING EM

Gaussian RBFs multiply the Gaussian densities nj to form new unnor-
malized Gaussians in (x; y) space. Expectations under these new
Gaussians are easy to compute. This fitting algorithm is illustrated in
Figure 6.4.
Note that among the four advantages we mentioned previously for the
EM algorithm – ability to handle missing observations, generalizability to
extensions of the basic model, Bayesian approximations, and guaranteed
stability through a Lyapunov function – we have had to forgo one. There is
no guarantee that extended Kalman smoothing increases the lower bound
on the true likelihood, and therefore stability cannot be assured. In
practice, the algorithm is rarely found to become unstable, and the
approximation works well: in our experiments, the likelihoods increased
monotonically and good density models were learned. Nonetheless, it may
be desirable to derive guaranteed-stable algorithms for certain special
cases using lower-bound preserving variational approximations [29] or
other approaches that can provide such proofs.
The ability to fully integrate over uncertain state estimates provides
practical benefits as well as being theoretically pleasing. We have
compared fitting our RBF networks using only the means of the state
estimates with performing the full integration as derived above. When
using only the means, we found it necessary to introduce a ridge
Figure 6.4 Illustration of the regression technique employed during the M-step. A fit to a mixture of Gaussian densities is required; if Gaussian RBFnetworks are used, then this fit can be solved analytically. The dashed lineshows a regular RBF fit to the centers of the four Gaussian densities, while thesolid line shows the analytical RBF fit using the covariance information. Thedotted lines below show the support of the RBF kernels.
6.2 COMBINING EKS AND EM 191

regression (weight decay) parameter in the M-step to penalize the very
large coefficients that would otherwise occur based on precise cancella-
tions between inputs. Since the model is linear in the parameters, this ridge
regression regularizer is like adding white noise to the radial basis outputs
riðxÞ (i.e., after the RBF kernels have been applied).6 By linearization, this
is approximately equivalent to Gaussian noise at the inputs x with a
covariance determined by the derivatives of the RBFs at the input
locations. The uncertain state estimates provide exactly this sort of
noise, and thus automatically regularize the RBF fit in the M-step. This
naturally avoids the need to introduce a penalty on large coefficients, and
improves generalization.
6.2.4 Initialization of Models and Choosing Locationsfor RBF Kernels
The practical success of our algorithm depends on two design choices that
need to be made at the beginning of the training procedure. The first is to
judiciously select the placement of the RBF kernels in the representation
of the state dynamics and=or output function. The second is to sensibly
initialize the parameters of the model so that iterative improvement with
the EM algorithm (which finds only local maxima of the likelihood
function) finds a good solution.
In models with low-dimensional hidden states, placement of RBF
kernel centers can be done by gridding the state space and placing one
kernel on each grid point. Since the scaling of the state variables is given
by the covariance matrix of the state dynamics noise wk in Eq. (6.1a)
which, without loss of generality, we have set to I , it is possible to
determine both a suitable size for the gridding region over the state space,
and a suitable scaling of the RBF kernels themselves. However, the
number of kernels in such a grid increases exponentially with the grid
dimension, so, for more than three or four state variables, gridding the
state space is impractical. In these cases, we first use a simple initializa-
tion, such as a linear dynamical system, to infer the hidden states, and then
place RBF kernels on a randomly chosen subset of the inferred state
means.7 We set the widths (variances) of the RBF kernels once we have
6Consider a simple scalar linear regression example yj ¼ yzj, which can be solved by
minimizingP
jðyj � yzjÞ2. If each zj has mean �zzj and variance l, the expected value of this
cost function isP
jðyj � y�zzjÞ2þ Jly2, which is exactly ridge regression with l controlling
the amount of regularization.7In order to properly cover the portions of the state space that are most frequently used, we
require a minimum distance between RBF kernel centers. Thus, in practice, we reject
centers that fall too close together.
192 6 LEARNING NONLINEAR DYNAMICAL SYSTEMS USING EM

the spacing of their centers by attempting to make neighboring kernels
cross when their outputs are half of their peak value. This ensures that,
with all the coefficients set approximately equal, the RBF network will
have an almost ‘‘flat’’ output across the space.8
These heuristics can be used both for fixed assignments of centers and
widths, and as initialization to an adaptive RBF placement procedure. In
Section 6.4.1, we discuss techniques for adapting both the positions of the
RBF centers and their widths during training of the model.
For systems with nonlinear dynamics but approximately linear output
functions, we initialize using maximum-likelihood factor analysis (FA)
trained on the collection of output observations (or conditional factor
analysis for models with inputs). Factor analysis is a very simple model,
which assumes that the output variables are generated by linearly
combining a small number of independent Gaussian hidden state variables
and then adding independent Gaussian noise to each output variable [6].
One can think of factor analysis as a special case of linear dynamical
systems with Gaussian noise where the states are not related in time (i.e.,
A ¼ 0). We used the weight matrix (called the loading matrix) learned by
factor analysis to initialize the observation matrix C in the dynamical
system. By doing time-independent inference through the factor analysis
model, we can also obtain approximate estimates for the state at each time.
These estimates can be used to initialize the nonlinear RBF regressor by
fitting the estimates at one time step as a function of those at the previous
time step. (We also sometimes do a few iterations of training using a
purely linear dynamical system before initializing the nonlinear RBF
network.) Since such systems are nonlinear flows embedded in linear
manifolds, this initialization estimates the embedding manifold using a
linear statistical technique (FA) and the flow using a nonlinear regression
based on projections into the estimated manifold.
If the output function is nonlinear but the dynamics are approximately
linear, then a mixture of factor analyzers (MFA) can be trained on the
output observations [41, 42]. A mixture of factor analyzers is a model that
assumes that the data were generated from several Gaussian clusters with
differing means, with the covariance within each cluster being modeled by
a factor analyzer. Systems with nonlinear output function but linear
dynamics capture linear flows in a nonlinear embedding manifold, and
8One way to see this is to consider Gaussian RBFs in an n-dimensional grid (i.e., a square
lattice), all with heights 1. The RBF centers define a hypercube, the distance between
neighboring RBFs being 2d, where d is chosen such that e�d2=ð2s2Þ ¼ 12. At the centers of
the hypercubes, there are 2n contributions from neighboring Gaussians, each of which is a
distanceffiffiffinp
d, and so contributes ð12Þn to the height. Therefore, the height at the interiors is
approximately equal to the height at the corners.
6.2 COMBINING EKS AND EM 193

the goal of the MFA initialization is to capture the nonlinear shape of the
output manifold. Estimating the dynamics is difficult (since the hidden
states of the individual analyzers in the mixture cannot be combined easily
into a single internal state representation), but is still possible.9 A
summary of the algorithm including these initialization techniques is
shown in Figure 6.5.
Ideally, Bayesian methods would be used to control the complexity of
the model by estimating the internal state dimension and optimal number
of RBF centers. However, in general, only approximate techniques such as
cross-validation or variational approximations can be implemented in
practice (see Section 6.4.4). Currently, we have set these complexity
parameters either by hand or with cross-validation.
6.3 RESULTS
We tested how well our algorithm could learn the dynamics of a nonlinear
system by observing only the system inputs and outputs. We investigated
the behavior on simple one- and two-dimensional state-space problems
whose nonlinear dynamics were known, as well as on a weather time-
series problem involving real temperature data.
6.3.1 One- and Two-Dimensional Nonlinear State-SpaceModels
In order to be able to compare our algorithm’s learned internal state
representation with a ground truth state representation, we first tested it on
Figure 6.5 Summary of the main steps of the NLDS-EM algorithm.
9As an approximate solution to the problem of getting a single hidden state from a MFA,
we can use the following procedure: (1) Estimate the ‘‘similarity’’ between analyzer centers
using average separation in time between data points for which they are active. (2) Use
standard embedding techniques such as multidimensional scaling (MDS) [43] to place the
MFA centers in a Euclidean space of dimension k. (3) Time-independent state inference for
each observation now consists of the responsibility-weighted low-dimensional MFA
centers, where the responsibilities are the posterior probabilities of each analyzer given
the observation under the MFA.
194 6 LEARNING NONLINEAR DYNAMICAL SYSTEMS USING EM

synthetic data generated by nonlinear dynamics whose form was known.
The systems we considered consisted of three inputs and four observables
at each time, with either one or two hidden state variables. The relation of
the state from one time step to the next was given by a variety of nonlinear
functions followed by Gaussian noise. The outputs were a linear function
of the state and inputs plus Gaussian noise. The inputs affected the state
only through a linear driving function. The true and learned state transition
functions for these systems, as well as sample outputs in response to
Gaussian noise inputs and internal driving noise, are shown in Figures
6.6c,d, 6.7c, and 6.8c.
We initialized each nonlinear model with a linear dynamical model
trained with EM, which, in turn, we initialized with a variant of factor
analysis (see Section 6.2.4). The one-dimensional state-space models were
given 11 RBFs in x space, which were uniformly spaced. (The range of
maximum and minimum x values was automatically determined from the
density of inferred points.) Two-dimensional state-space models were
given 25 RBFs spaced in a 5� 5 grid uniformly over the range of inferred
Figure 6.6 Example of fitting a system with nonlinear dynamics and linearobservation function. The panels show the fitting of a nonlinear system witha one-dimensional hidden state and 4 noisy outputs driven by Gaussiannoise inputs and internal state noise. (a) The true dynamics function (line)and states (dots) used to generate the training data (the inset is thehistogram of internal states). (b) The learned dynamics function andstates inferred on the training data (the inset is the histogram of inferredinternal states). (c) The first component of the observable time series fromthe training data. (d) The first component of fantasy data generated fromthe learned model (on the same scale as c).
6.3 RESULTS 195

states. After the initialization was over, the algorithm discovered the
nonlinearities in the dynamics within less than 5 iterations of EM (see
Figs. 6.6a,b, 6.7a,b, and 6.8a,b.
After training the models on input–output observations from the
dynamics, we examined the learned internal state representation and
Figure 6.7 More examples of fitting systems with nonlinear dynamics andlinear observation functions. Each of the five rows shows the fitting of anonlinear system with a one-dimensional hidden state and four noisyoutputs driven by Gaussian noise inputs and internal-state noise. (a) Thetrue dynamics function (line) and states (dots) used to generate the trainingdata. (b) The learned dynamics function and states inferred on the trainingdata. (c) The first component of the observable time series: training data onthe top and fantasy data generated from the learned model on thebottom. The nonlinear dynamics can produce quasi-periodic outputs inresponse to white driving noise.
196 6 LEARNING NONLINEAR DYNAMICAL SYSTEMS USING EM

compared it with the known structure of the generating system. As the
figures show, the algorithm recovers the form of the nonlinear dynamics
quite well. We are also able to generate ‘‘fantasy’’ data from the models
once they have been learned by exciting them with Gaussian noise of
similar variance to that applied during training. The resulting observation
streams look qualitatively very similar to the time series from the true
systems.
We can quantify this quality of fit by comparing the log-likelihood of
the training sequences and novel test sequences under our nonlinear model
with the likelihood under a basic linear dynamical system model or a static
model such as factor analysis. Figure 6.9 presents this comparison. The
nonlinear dynamical system had significantly superior likelihood on both
training and test data for all the example systems. (Notice that for system
E, the linear dynamical system is much better than factor analysis because
of the strong hysteresis (mode-locking) in the system. Thus, the output at
the previous time step is an excellent predictor of the current output.)
6.3.2 Weather Data
As an example of a real system with a nonlinear output function as well as
important dynamics, we trained our model on records of the daily
maximum and minimum temperatures in Melbourne, Australia, over the
period 1981–1990.10 We used a model with two internal state variables,
Figure 6.8 Multidimensional example of fitting a system with nonlineardynamics and linear observation functions. The true system is piecewise-linear across the state space. The plots show the fitting of a nonlinear systemwith a two-dimensional hidden state and 4 noisy outputs driven by Gaussiannoise inputs and internal state noise. (a) The true dynamics vector field(arrows) and states (dots) used to generate the training data. (b) Thelearned dynamics vector field and states inferred on the training data. (c)The first component of the observable time series: training data on the topand fantasy data generated from the learned model on the bottom.
10This data is available on the world wide web from the Australian Bureau of Meteorology
at http:==www.bom.gov.au=climate.
6.3 RESULTS 197

three outputs, and no inputs. During the training phase, the three outputs
were the minimum and maximum daily temperature as well as a real
valued output indicating the time of the year (month) in the range [0, 12].
The model was trained on 1500 days of temperature records, or just over
four seasons. We tested on the remaining 2150 days by showing the model
only the minimum and maximum daily temperatures and attempting to
predict the time of year (month). The prediction was performed by using
the EKS algorithm to do state inference given only the two available
observation streams. Once state inference was performed, the learned
output function of the model could be used to predict the time of year.
This prediction problem inherently requires the use of information from
previous and=or future times, since the static relationship between
temperature and season is ambiguous during spring=fall. Figure 6.10
shows the results of this prediction after training; the algorithm has
discovered a relationship between the hidden state and the observations
that allows it to perform reasonable prediction for this task. Also shown
Figure 6.9 Differences in log-likelihood assigned by various models totraining and test data from the systems in Figures 6.6 and 6.7. Each adjacentgroup of five bars shows the log-likelihood of the five examples (A–E) underfactor analysis (FA), linear dynamical systems (LDS), and our nonlineardynamical system model (NLDS). Results on training data appear on theleft and results on test data on the right; taller bars represent better models.Log-likelihoods are offset so that FA on the training data is zero. Error barsrepresent the 68% quantile about the median across 100 repetitions oftraining or testing. For NLDS, the exact likelihood cannot be computed;what is shown is the pseudo-likelihood computed by EKS.
198 6 LEARNING NONLINEAR DYNAMICAL SYSTEMS USING EM

are the model predictions of minimum and maximum temperatures given
the inferred state.
Although not explicitly part of the generative model, the learned system
implicitly parameterizes a relationship between time of year and tempera-
ture. We can discover this relationship by evaluating the nonlinear output
function at many points in the state space. Each evaluation yields a triple
of month, minimum temperature and maximum temperature. These triples
can then be plotted against each other as in Figure 6.11 to show that the
model has discovered Melbourne’s seasonal temperature variations.
Figure 6.10 Model of maximum and minimum daily temperatures inMelbourne, Australia from 1981 to 1990. Left of vertical line: A system withtwo hidden states governed by linear dynamics and a non-linear outputfunction was trained on observation vectors of a three-dimensional timeseries consisting of maximum and minimum temperatures for each day aswell as the (real-valued) month of the year. Training points are shown astriangles (maximum temperature), squares (minimum temperature) and asolid line (sawtooth wave below). Right of vertical line: After training, thesystem can infer its internal state from only the temperature observations.Having inferred its internal state it can predict the month of the year as amissing output (line below). The solid lines in the upper plots show themodel’s prediction of minimum and maximum temperature given theinferred state at the time.
6.3 RESULTS 199

6.4 EXTENSIONS
6.4.1 Learning the Means and Widths of the RBFs
It is possible to relax the assumption that the Gaussian radial basis
functions have fixed centers and widths, although this results in a some-
what more complicated and slower fitting algorithm. To derive learning
rules for the RBF centers ci and width matrices Si, we need to consider
how they play into the cost function (6.17) through the RBF kernel (6.14).
We take derivatives with respect to the expectation of the cost function c,
and exchange the order of the expectation and the derivative:
@c
@ci
¼
@c
@ri
@ri
@ci
¼ 2hðyF� zÞ
>Q�1hiriðxÞS
�1i ðx� ciÞi: ð6:19Þ
Recalling that F ¼ ½r1ðxÞ r2ðxÞ . . . rI ðxÞ x> u> 1�>, it is clear
that ci figures nonlinearly in several places in this equation, and therefore
it is not possible to solve for ci in closed form. We can, however, use the
above gradient to move the center ci to decrease the cost, which
corresponds to taking a partial M-step with respect to ci. Equation
(6.19) requires the computation of three third-order expectations in
Figure 6.11 Prediction of maximum and minimum daily temperaturesbased on time of year. The model from Figure 6.10 implicitly learns arelationship between time of year and minimum=maximum temperature.This relationship is not directly invertible, but the temporal information usedby extended Kalman smoothing correctly infers month given temperatureas shown in Figure 6.10.
200 6 LEARNING NONLINEAR DYNAMICAL SYSTEMS USING EM

addition to the first- and second-order expectations needed to optimize yand Q: hriðxÞrkðxÞxlij, hriðxÞxkxlij; and hriðxÞzkxlij. Similarly, differentiat-
ing the cost with respect to S�1i gives
@c
@S�1i
¼
@c
@ri
@ri
@S�1i
¼ h½ðyF� zÞ
>Q�1hi�riðxÞ½Si � ðx� ciÞðx� ciÞ
>�i:
ð6:20Þ
We now need three fourth-order expectations as well: hriðxÞrkðxÞxlxmij,
hriðxÞkxlxmij, and hriðxÞzkxlxmij.
These additional expectations increase both the storage and computa-
tion time of the algorithm – a cost that may not be compensated by the
added advantage of moving of centers and widths by small gradient steps.
One heuristic is to place centers and widths using unsupervised techniques
such as the EM algorithm for Gaussian mixtures, which considers solely
the input density and not the output nonlinearity. Alternatively, some of
these higher-order expectations can be approximated using, for example,
hriðxÞi � riðhxiÞ.
6.4.2 On-line Learning
One of the major limitations of the algorithm that we have presented in
this chapter is that it is a batch algorithm; that is, it assumes that we use
the entire sequence of observations to estimate the model parameters.
Fortunately, it is relatively straightforward to derive an on-line version of
the algorithm, which updates parameters as it receives observations. This
is achieved using the recursive least-squares (RLS) algorithm, which is in
fact just a special case of the discrete Kalman filter (see, e.g., [8, 44]).
The key observation is that the cost minimized in the M-step of the
algorithm (6.17) is a quadratic function of the parameters y. RLS is simply
a way of solving quadratic problems on-line. Using k to index time step,
the resulting algorithm for scalar z is as follows:
yk ¼ yk�1 þ ðhzFik � yk�1hFF>ikÞPk; ð6:21Þ
Pk ¼ Pk�1 �Pk�1hFF
>ikPk�1
1þ hF>Pk�1Fik; ð6:22Þ
Qk ¼ Qk�1 þ1
k½hz2ik � ykhFzik � Qk�1�: ð6:23Þ
6.4 EXTENSIONS 201

Let us ignore the expectations for now. Initializing y0 ¼ 0, Q0 ¼ I, and P0
very large, it is easy to show that, after a few iterations, the estimates of yk
will rapidly converge to the exact values obtained by the least-squares
solution. The estimate of Q will converge to the correct values plus a bias
incurred by the fact that the early estimates of Q were based on residuals
from yk rather than limk!1 yk . Pk is a recursive estimate of
ðPk
j¼1hFFijÞ�1, obtained by using the matrix inversion lemma.
There is an important way in which this on-line algorithm is an
approximation to the batch EM algorithm we have described for nonlinear
state-space models. The expectations h�ik in the online algorithm are
computed by running a single step of the extended Kalman filter using the
previous parameters yk�1. In the batch EM algorithm, the expectations are
computed by running an extended Kalman smoother over the entire
sequence using the current parameter estimate. Moreover, these expecta-
tions are used to re-estimate the parameters, the smoother is then re-run,
the parameters are re-re-estimated, and so on, to perform the usual
iterations of EM. In general, we can expect that, unless the time series
is nonstationary, the parameter estimates obtained by the batch algorithm
after convergence will model the data better than those obtained by the on-
line algorithm.
Interestingly, the updates for the RLS on-line algorithm described here
are very similar to the parameter updates used a dual extended Kalman
filter approach to system identification [45] (see Chapter 5 and Section
6.5.5). This similarity is not coincidental, since, as mentioned, the Kalman
filter can be derived as a generalization of the RLS algorithm. In fact, this
similarity can be exploited in an elegant manner to derive an on-line
algorithm for parameter estimation for nonstationary nonlinear dynamical
systems.
6.4.3 Nonstationarity
To handle nonstationary time series, we assume that the parameters can
drift according to a Gaussian random walk with covariance Sy:
yk ¼ yk�1 þ Ek; where Ek nð0;SyÞ:
As before, we have the following function relating the z variables to the
parameters y and nonlinear kernels F:
zk ¼ ykFk þ wk; where wk nð0;QÞ;
202 6 LEARNING NONLINEAR DYNAMICAL SYSTEMS USING EM

which we can view as the observation model for a ‘‘state variable’’ yk with
time-varying ‘‘output matrix’’ Fk . Since both the dynamics and observa-
tion models are linear in y and the noise is Gaussian, we can apply the
following Kalman filter to recursively compute the distribution of drifting
parameters y:
yyk ¼ yyk�1 þðhzFik � yyk�1hFF
>ikÞPkjk�1
Qk�1 þ hF>Pkjk�1Fik
; ð6:24Þ
Pkjk�1 ¼ Pk�1 þ Sy; ð6:25Þ
Pk ¼ Pkjk�1 �Pkjk�1hFF
>ikPkjk�1
Qk�1 þ hF>Pkjk�1Fik
; ð6:26Þ
Qk ¼ Qk�1 þ lðhz2ik � yykhFzik � Qk�1Þ: ð6:27Þ
There are two important things to note. First, these equations describe an
ordinary Kalman filter, except that both the ‘‘output’’ z and ‘‘output
matrix’’ Fk are jointly uncertain with a Gaussian distribution. Second,
we have also assumed that the output noise covariance can drift by
introducing a forgetting factor l in its re-estimation equation. As before,
the expectations are computed by running one step of the EKF over the
hidden variables using yk�1.
While we derived this on-line algorithm starting from the batch EM
algorithm, what we have ended up with appears almost identical to the
dual extended Kalman filter (discussed in Chapter 5). Indeed, we have two
Kalman filters – one extended and one ordinary – running in parallel,
estimating the hidden states and parameters, respectively.
We can also view this on-line algorithm as an approximation to the
Bayesian posterior over parameters and hidden variables. The true poster-
ior would be some complicated distribution over the x; z, and y para-
meters. Here, we have recursively approximated it with two independent
Gaussians – one over (x; z) and one over y. The approximated posterior for
yk has mean yyk and covariance Pk .
6.4.4 Using Bayesian Methods for Model Selection andComplexity Control
Like any other maximum-likelihood procedure, the EM algorithm
described in this chapter has the potential to overfit the data set – that
is, to find spurious patterns in noise in the data, thereby generalizing
6.4 EXTENSIONS 203

poorly. In our implementation, we used some ridge regression, that is, a
weight decay regularizer on the hi parameters, which seemed to work well
in practice but required some heuristics for setting regularization para-
meters. (Although, as mentioned previously, integrating over the hidden
variables acts as a sort of modulated input noise, and so, in effect,
performs ridge regression, which can eliminate the need for explicit
regularization.)
A second closely related problem faced by maximum-likelihood
methods is that there is no built-in procedure for doing model selection.
That is, the value of the maximum of the likelihood is not a suitable way to
choose between different model structures. For example, consider the
problems of choosing the dimensionality of the state space x and choosing
the number of basis functions I . Higher dimensions of x and more basis
functions should always, in principle, result in higher maxima of the
likelihood, which means that more complex models will always be
preferred to simpler ones. But this, of course, leads to overfitting.
Bayesian methods provide a very general framework for simultaneously
handling the overfitting and model selection problems in a consistent
manner. The key idea of the Bayesian approach is to avoid maximization
wherever possible. Instead, possible models, structures, parameters – in
short, all settings of unknown quantities – should be weighted by their
posterior probabilities, and predictions should be made according to this
weighted posterior.
For our nonlinear dynamical system, we can, for example, treat the
parameters y as an unknown. Then the model’s prediction of the output at
time k þ 1 is
pð ykþ1ju1:kþ1; y1:kÞ ¼
ðdy pð ykþ1jukþ1; y1:k; u1:k; yÞpðyj y1:k; u1:kÞ
¼
ðdy pðyj y1:k; u1:kÞ
ðdxkþ1pð ykþ1jukþ1; xkþ1; yÞ
� pðxkþ1ju1:kþ1; y1:k; yÞ;
where the first integral on the last line is over the posterior distribution of
the parameters and the second integral is over the posterior distribution of
the hidden variables.
The posterior distribution over parameters can be obtained recursively
from Bayes’ rule:
pðyj y1:k; u1:kÞ ¼pð yk ju1:k; y1:k�1; yÞpðyjU1:k�1; y1:k�1Þ
pð yk ju1:k; y1:k�1Þ:
204 6 LEARNING NONLINEAR DYNAMICAL SYSTEMS USING EM

The dual extended Kalman filter, the joint extended Kalman filter, and the
nonstationary on-line algorithm from Section 6.4.3 are all coarse approx-
imations of these Bayesian recursions.
The above equations are all implicitly conditioned on some choice of
model structure sm, that is, the dimension of x and the number of basis
functions. Although the Bayesian modeling philosophy advocates aver-
aging predictions of different model structures, if necessary it is also
possible to use Bayes’ rule to choose between model structures according
to their probabilities:
Pðsmj y1:k; u1:kÞ ¼pð y1:k ju1:k; smÞPðsmÞP
n pð y1:k ju1:k; snÞPðsnÞ:
Tractable approximations to the required integrals can be obtained in
several ways. We highlight three ideas, without going into much detail; an
adequate solution to this problem for nonlinear dynamical systems
requires further research. The first idea is the use of Markov-chain
Monte Carlo (MCMC) techniques to sample over both parameters and
hidden variables. Sampling can be an efficient way of computing high-
dimensional integrals if the samples are concentrated in regions where
parameters and states have high probability. MCMC methods such as
Gibbs sampling have been used for linear dynamical systems [46, 47],
while a promising method for nonlinear systems is particle filtering [18,
24], in which samples (‘‘particles’’) can be used to represent the joint
distribution over parameters and hidden states at each time step. The
second idea is the use of so-called ‘‘automatic relevance determination’’
(ARD [48, 49]). This consists of using a zero-mean Gaussian prior on
each parameter with tunable variances. Since these variances are para-
meters that control the prior distribution of the model parameters, they are
referred to as hyperparameters. Optimizing these variance hyperpara-
meters while integrating over the parameters results in ‘‘irrelevant’’
parameters being eliminated from the model. This occurs when the
variance controlling a particular parameter goes to zero. ARD for RBF
networks with a center on each data point has been used by Tipping [50]
successfully for nonlinear regression, and given the name ‘‘relevance
vector machine’’ in analogy to support vector machines. The third idea is
the use of variational methods to lower-bound the model structure
posterior probabilities. In exactly the same way that EM can be thought
of as forming a lower bound on the likelihood using a distribution over the
hidden variables, variational Bayesian methods lower-bound the evidence
using a distribution over both hidden variables and parameters. Variational
Bayesian methods have been used in [51] to infer the structure of linear
6.4 EXTENSIONS 205

dynamical systems, although the generalization to nonlinear systems of
the kind described in this chapter is not straightforward.
Of course, in principle, the Bayesian approach would advocate aver-
aging over all possible choices of ci, Si, I ;Q, etc. It is easy to see how this
can rapidly get very unwieldy.
6.5 DISCUSSION
6.5.1 Identifiability and Expressive Power
As we saw from the experiments described above, the algorithm that we
have presented is capable of learning good density models for a variety of
nonlinear time series. Specifying the class of nonlinear systems that our
algorithm can model well defines its expressive power. A related question
is: What is the ability of this model, in principle, to recover the actual
parameters of specific nonlinear systems? This is the question of model
identifiability. These two questions are intimately tied, since they both
describe the mapping between actual nonlinear systems and model
parameter settings.
There are three trivial degeneracies that make our model technically
unidentifiable, but should not concern us. First, it is always possible to
permute the dimensions in the state space and, by permuting the domain of
the output mapping and dynamics in the corresponding fashion, obtain an
exactly equivalent model. Second, the state variables can be rescaled or, in
fact, transformed by any invertible linear mapping. This transformation
can be absorbed by the output and dynamics functions, yielding a model
with identical input–output behavior. Without loss of generality, we always
set the covariance of the state evolution noise to be the identity matrix,
which both sets the scale of the state space and disallows certain state
transformations without reducing the expressive power of the model.
Third, we take the observation noise to be uncorrelated with the state
noise and both noises to be zero-mean, since, again without loss of
generality, these can be absorbed into the f and g functions.11
There exist other forms of unidentifiability that are more difficult to
overcome. For example, if both f and g are nonlinear, then (at least in the
noise-free case), for any arbitrary invertible transformation of the state,
11Imagine that the joint noise covariance was nonzero: hwkv>k i ¼ S. Replacing A with
A0 ¼ A� SR�1C gives a new noise process w0 with covariance Q0 ¼ Q� SR�1S> that is
uncorrelated with v, leaving the input–output behavior invariant. Similarly, any nonzero
noise means can be absorbed into the b terms in the functions f and g.
206 6 LEARNING NONLINEAR DYNAMICAL SYSTEMS USING EM

there exist transformations of f and g that result in identical input–output
behavior. In this case, it would he very hard to detect that the recovered
model is indeed a faithful model of the actual system, since the estimated
and actual states would appear to be unrelated.
Clearly, not all systems can be modeled by assuming that f is linear and
g is nonlinear. Similarly, not all systems can be modeled by assuming that
f is nonlinear and g is linear. For example, consider the case where the
observations yk and ykþn are statistically independent, but each observa-
tion lies on a curved low-dimensional manifold in a high-dimensional
space. Modeling this would require a nonlinear g as in nonlinear factor
analysis, but an f ¼ 0. Therefore, choosing either f or g to be linear
restricts the expressive power of the model.
Unlike the state noise covariance Q, assuming that the observation
noise covariance R is diagonal does restrict the expressive power of the
model. This is easy to see for the case where the dimension of the state
space is small and the dimension of the observation vector is large. A full
covariance R can capture all correlations between observations at a single
time step, while a diagonal R model cannot.
For nonlinear dynamical systems, the Gaussian-noise assumption is not
as restrictive as it may initially appear. This is because the nonlinearity can
be used to turn Gaussian noise into non-Gaussian noise [6].
Of course, we have restricted our expressive power by using an RBF
network, especially one in which the means and centers of the RBFs are
fixed. One could try to appeal to universal approximation theorems to
make the claim that one could, in principle, model any nonlinear
dynamical system. But this would be misleading in the light of the
noise assumptions and the fact that only a finite and usually small
number of RBFs are going to be used in practice.
6.5.2 Embedded Flows
There are two ways to think about the dynamical models we have
investigated, shown in Figure 6.12. One is as a nonlinear Markov process
(flow) xk that has been embedded (or potentially projected) into a manifold
yk . From this perspective, the function f controls the evolution of the
stochastic process, and the function g specifies the nonlinear embedding
(or projection) operation.12
12To simplify presentation, we shall neglect driving inputs uk in this section, although the
arguments extend as well to systems with inputs.
6.5 DISCUSSION 207

Another way to think of the same model is as a nonlinear version of a
latent-variable model such as factor analysis (but possibly with external
inputs as well) in which the latent variables or factors evolve through time
rather than being drawn independently for each observation. The nonlinear
factor analysis model is represented by g and the time evolution of the
latent variables by f .
If the state space is of lower dimension than the observation space and
the observation noise is additive, then a useful geometrical intuition
applies. In such cases, we have observed a flow inside an embedded
manifold. The observation function g specifies the structure (shape) of the
manifold, while the dynamics f specifies the flow within the manifold.
Armed with this intuition, the learning problem looks as if it might be
decoupled into two separate stages: first find the manifold by doing some
sort of density modeling on the collection of observed outputs (ignoring
their time order); second, find the flow (dynamics) by projecting the
observations into the manifold and doing nonlinear regression from one
time step to the next. This intuition is partly true, and indeed provides the
basis for many of the practical and effective initialization schemes that we
have tried. However, the crucial point as far as the design of learning
algorithms is concerned is that the two learning problems interact in a way
that makes the problem easier. Once we know something about the
dynamics, this information gives some prior knowledge when trying to
learn the manifold shape. For example, if the dynamics suggest that the
next state will be near a certain point, we can use this information to do
better than naive projection when we locate a noisy observation on the
manifold. Conversely, knowing something about the manifold allows us to
estimate the dynamics more effectively.
Figure 6.12 Two interpretations of the graphical model for stochastic(non)linear dynamical systems (see text). (a) A Markov process embeddedin a manifold. (b) Nonlinear factor analysis through time.
208 6 LEARNING NONLINEAR DYNAMICAL SYSTEMS USING EM

We discuss separately two special cases of flows in manifolds: systems
with linear output functions but nonlinear dynamics, and systems with
linear dynamics but nonlinear output function.
When the output function g is linear and the dynamics f is nonlinear
(Fig. 6.13), the observed sequence forms a nonlinear flow in a linear
subspace of the observation space. The manifold estimation is made
easier, even with high levels of observation noise, by the fact that its shape
is known to be a hyperplane. All that is required is to find its orientation
and the character of the output noise. Time-invariant analysis of the
observations by algorithms such as factor analysis is an excellent way to
initialize estimates of the hyperplane and noises. However, during learn-
ing, we may have cause to tilt the hyperplane to make the dynamics fit
better, or conversely cause to modify the dynamics to make the hyperplane
model better.
This setting is actually more expressive than it might seem initially.
Consider a nonlinear output function gðxÞ that is ‘‘invertible’’ in the sense
that it be written in the form gðxÞ ¼ C ~ggðxÞ for invertible ~gg and non-square
matrix C. Any such nonlinear output function can be made strictly linear if
we transform to a new state variable ~xx:
~xx ¼ ~ggðxÞ ) ~xxkþ1 ¼~ff ð~xxk;wkÞ ¼ ~ggð f ð ~gg�1ð~xxÞÞ þ wkÞ; ð6:28aÞ
yk ¼ C ~xxk þ vk ¼ gðxkÞ þ vk; ð6:28bÞ
Figure 6.13 Linear and nonlinear dynamical systems represent flow fieldsembedded in manifolds. For systems with linear output functions, such asthe one illustrated, the manifold is a hyperplane while the dynamics may becomplex. For systems with nonlinear output functions the shape of theembedding manifold is also curved.
6.5 DISCUSSION 209

which gives an equivalent model but with a purely linear output process,
and potentially nonadditive dynamics noise.
For nonlinear output functions g paired with linear dynamics f , the
observation sequence forms a matrix (linear) flow in a nonlinear manifold:
xkþ1 ¼ Axk þ wk; ð6:29aÞ
yk ¼ gðxkÞ þ vk : ð6:29bÞ
The manifold learning is harder now, because we must estimate a thin,
curved subspace of the observation space in the presence of noise.
However, once we have learned this manifold approximately, we project
the observations into it and learn only linear dynamics. The win comes
from the following fact: in the locations where the projected dynamics do
not look linear, we know that we should bend the manifold to make the
dynamics more linear. Thus, not only the shape of the outputs (ignoring
time) but also the linearity of the dynamics give us clues to learning the
manifold.
6.5.3 Stability
Stability is a key issue in the study of any dynamical system. Here we have
to consider stability at two levels: the stability of the learning procedure,
and the stability of the learned nonlinear dynamical system.
Since every step of the EM algorithm is guaranteed to increase the log-
likelihood until convergence, it has a built-in Lyapunov function for stable
learning. However, as we have pointed out, our use of extended Kalman
smoothing in the E-step of the algorithm represents an approximation to
the exact E-step, and therefore we have to forego any guarantees of
stability of learning. While we rarely had problems with stability of
learning, this is sure to be problem-specific, depending both on the quality
of the EKS approximation and on how close the true system dynamics is
to the boundary of stability. In contrast to the EKS approximations, certain
variational approximations [29] transform the intractable Lyapunov func-
tion into a tractable one, and therefore preserve stability of learning. It is
not clear how to apply these variational approximations to nonlinear
dynamics, although this would clearly be an interesting area of research.
Stability of the learned nonlinear dynamical system can be analyzed by
making use of some linear systems theory. We know that, for discrete-time
linear dynamical systems, if all eigenvalues of the A matrix lie inside the
unit circle, then the system is globally stable. The nonlinear dynamics of
210 6 LEARNING NONLINEAR DYNAMICAL SYSTEMS USING EM

our RBF network f can be decomposed into two parts (cf. Eq. (6.13)): a
linear component given by A, and a nonlinear component given byPi hiriðxÞ. Clearly, for the system to be globally stable, A has to satisfy
the eigenvalue criterion for linear systems. Moreover, if the RBF coeffi-
cients for both f and g have bounded norm (i.e., maxi jhij < �hhÞ and the
RBF is bounded, with mini detðSiÞ > smin > 0 and maxij jci � cjj < �cc,
then the nonlinear system is stable in the following sense. The conditions
on Si and h mean that����Pi
hiriðxÞ
���� < I �hh
ð2pÞd=2 ffiffiffiffiffiffiffiffismin
p � k:
Therefore, the noise-free nonlinear component of the dynamics alone will
always maintain the state within a sphere of radius k around �cc. So, if the
linear component is stable, then for any sequence of bounded inputs, the
output sequence of the noise-free system will be bounded. Intuitively,
although unstable behavior might occur in the region of RBF support,
once x leaves this region it is drawn back in by A.
For the on-line EM learning algorithm, the hidden state dynamics and
the parameter re-estimation dynamics will interact, and therefore a
stability analysis would be quite challenging. However, since there is no
stability guarantee for the batch EKS-EM algorithm, it seems very
unlikely that a simple form of the on-line algorithm could be provably
stable.
6.5.4 Takens’ Theorem and Hidden States
It has long been known that for linear systems, there is an equivalence
between so called state-space formulations involving hidden variables and
direct vector autoregressive models of the time series. In 1980, Takens
proved a remarkable theorem [52] that tells us that, for almost any
deterministic nonlinear dynamical system with a d-dimensional state
space, the state can be effectively reconstructed by observing 2d þ 1
time lags of any one of its outputs. In particular, Takens showed that such
a lag vector will be a smooth embedding (diffeomorphism) of the true
state, if one exists. This notion of finding an ‘‘embedding’’ for the state has
been used to justify a nonlinear regression approach to learning nonlinear
dynamical systems. That is, if you suspect that the system is nonlinear and
that it has d state dimensions, then instead of building a state-space model,
you can do away with representing states and just build an autoregressive
(AR) model directly on the observations that nonlinearly relates previous
6.5 DISCUSSION 211

outputs and the current output. (Chapter 4 discusses the case of chaotic
dynamics.) This view begs the question: Do we need our models to have
hidden states at all?
While no constructive realization for Takens’ theorem exists in general,
there are very strong results for linear systems. For purely linear systems,
we can appeal to the Cayley–Hamilton theorem13 to show that the hidden
state can always be eliminated to obtain an equivalent vector autoregres-
sive model by taking only d time lags of the output. Furthermore, there is
a construction that allows this conversion to be performed explicitly.14
Takens’ theorem offers us a similar guarantee for elimination of hidden
states in nonlinear dynamical systems, as long as we take 2d þ 1 output
lags. (However, no similar recipe exists for explicitly converting to an
autoregressive form). These results appear to make hidden states unne-
cessary.
The problem with this view is that it does not generalize well to many
realistic high-dimensional and noisy scenarios. Consider the example
mentioned in the introduction. While it is mathematically true that the
pixels in the video frame of a balloon floating in the wind are a (highly
nonlinear) function of the pixels in the previous video frames, it would be
ludicrous from the modeling perspective to build an AR model of the
video images. This would require a number of parameters of the order of
the number of pixels squared. Furthermore, unlike the noise-free case of
Takens’ theorem, when the dynamics are noisy, the optimal prediction of
the observation would have to depend on the entire history of past
observations. Any truncation of this history throws away potentially
valuable information about the unobserved state. The state-space formula-
tion of nonlinear dynamical systems allows us to overcome both of these
limitations of nonlinear autoregressive models. That is, it allows us to have
compact representations of dynamics, and to integrate uncertain informa-
tion over time. The price paid for this is that it requires inference over the
hidden state.
13Any square matrix A of size n satisfies its own characteristic equation. Equivalently, any
matrix power Am for m n can be written as a linear combination of lower matrix powers
I ;A;A2; . . . ;An�1.14Start with the system xkþ1 ¼ Axk þ wk , yk ¼ Cxk þ vk . Create a d-dimensionl lag vector
zk ¼ ½yk; ykþ1; . . . ; ykþd�1� that holds the current and d � 1 future outputs. Write
zk ¼ Gxk þ nk for G ¼ ½CI;CA;CA2; . . . ;CAd�1� and Gaussian noise n (although with
nondiagonal covariance). The Cayley–Hamilton theorem assures us that G is full rank, and
thus we need not take any more lags. Given the lag vector zk, we can solve the system
zk ¼ Gxk for xk ; write this solution as Gþzk . Using the original observation equation d
times, to solve for yk ; . . . ; ykþd�1 in terms of zk , we can write an autoregression for zk as
zkþ1 ¼ GþAGzk þ mk for Gaussian noise m.
212 6 LEARNING NONLINEAR DYNAMICAL SYSTEMS USING EM

6.5.5 Should Parameters and Hidden States be TreatedDifferently?
The maximum-likelihood framework on which the EM algorithm is based
makes a distinction between parameters and hidden variables: it attempts
to integrate over hidden variables to maximize the likelihood as a function
of parameters. This leads to the two-step approach, which computes
sufficient statistics over the hidden variables in the E-step and optimizes
parameters in the M-step. In contrast, a fully Bayesian approach to
learning nonlinear dynamical state-space models would treat both
hidden variables and parameters as unknown and attempt to compute or
approximate the joint posterior distribution over them – in effect integ-
rating over both.
It is important to compare these approaches to system identification
with more traditional ones. We highlight two such approaches: joint EKF
approaches and dual EKF approaches.
In joint EKF approaches [7, 8], an augmented hidden state space is
constructed that comprises the original hidden state space and the
parameters. Since parameters and hidden states interact, even for linear
dynamical systems this approach results in nonlinear dynamics over the
augmented hidden states. Initializing a Gaussian prior distribution both
over parameters and over states, an extended Kalman filter is then used to
recursively update the joint distribution over states and parameters based
on the observations, pðX ; yjY Þ. This approach has the advantage that it can
model uncertainties in the parameters and correlations between parameters
and hidden variables. In fact, this approach treats parameters and state
variables completely symmetrically, and can be thought of as iteratively
implementing a Gaussian approximation to the recursive Bayes’ rule
computations. Nonstationarity can be easily built in by giving the
parameters (e.g., random-walk) dynamics. Although it has some very
appealing properties, this approach is known to suffer from instability
problems, which is the reason why dual EKF approaches have been
proposed.
In dual EKF approaches (see Chapter 5), two interacting but distinct
extended Kalman filters run simultaneously. One computes a Gaussian
approximation of the state posterior given a parameter estimate and the
observations: pðX jyyold; Y Þ, while the other computes a Gaussian approx-
imation of the parameter posterior given the estimated states pðyjXXold;Y Þ.
The two EKFs interact by each feeding its estimate (i.e., the posterior
means XX and yy) into the other. One can think of the dual EKF as
performing approximate coordinate ascent in pðX ; yjY Þ by iteratively
6.5 DISCUSSION 213

maximizing pðX jyyold;Y Þ and pðyjXXold; Y ) under the assumption that each
conditional is Gaussian. Since the only interaction between parameters
and hidden variables occurs through their respective means, the procedure
has the flavor of mean-field methods in physics and neural networks [53].
Like these methods, it is also likely to suffer from the overconfidence
problem – namely, since the parameter estimate does not take into account
the uncertainty in the states, the parameter covariance will be overly
narrow, and likewise for the states.
For large systems, both joint and dual EKF methods suffer from the fact
that the parameter covariance matrix is quadratic in the number of
parameters. This problem is more pronounced for the joint EKF, since it
considers the concatenated state space. Furthermore, both joint and dual
EKF methods rely on Gaussian approximations to parameter distributions.
This can sometimes be problematic – for example, consider retaining
positive-definiteness of a noise covariance matrix under the assumption
that its parameters are Gaussian-distributed.
6.6 CONCLUSIONS
This chapter has brought together two classic algorithms – one from
statistics and another from systems engineering – to address the learning
of stochastic nonlinear dynamical systems. We have shown that by pairing
the extended Kalman smoothing algorithm for approximate state estima-
tion in the E-step with a radial basis function learning model that permits
exact analytic solution of the M-step, the EM algorithm is capable of
learning a nonlinear dynamical model from data. As a side-effect we have
derived an algorithm for training a radial basis function network to fit data
in the form of a mixture of Gaussians. We have also derived an on-line
version of the algorithm and a version for dealing with nonstationary time
series.
We have demonstrated the algorithm on a series of synthetic and
realistic nonlinear dynamical systems, and have shown that it is able to
learn accurate models from only observations of inputs and outputs.
Initialization of model parameters and placement of the radial basis
kernels are important to the practical success of the algorithm. We have
discussed techniques for making these choices, and have provided gradient
rules for adapting the centers and widths of the basis functions.
The main strength of our algorithm is that by making a specific choice
of nonlinear estimator (Gaussian radial basis networks), we are able to
exactly account for the uncertain state estimates generated during infer-
ence. Furthermore, the parameter-update procedures still only require the
214 6 LEARNING NONLINEAR DYNAMICAL SYSTEMS USING EM

solution of systems of linear equations. However, we rely on the standard,
but potentially inaccurate, extended Kalman smoother for approximate
inference. For certain problems where local linearization is an extremely
poor approximation, greater accuracy may be achieved using other
approximate inference techniques such as the unscented filter (see Chapter
7). Another area worthy of further investigation is how to initialize the
parameters more effectively when the data lie on a nonlinear manifold; in
these cases, factor analysis provides an inadequate static model.
The belief network literature has recently been dominated by two
methods for approximate inference: Markov-chain Monte Carlo [54]
and variational approximations [29]. To the best of our knowledge, [36]
and [45] were the first instances where extended Kalman smoothing was
used to perform approximate inference in the E-step of EM. While EKS
does not have the theoretical guarantees of variational methods (which are
also approximate, but monotonically optimize a computable objective
function during learning), its simplicity has gained it wide acceptance in
the estimation and control literatures as a method for doing inference in
nonlinear dynamical systems. Our practical success in modeling a variety
of nonlinear time series suggests that the combination of extended Kalman
algorithms and the EM algorithm can provide powerful tools for learning
nonlinear dynamical systems.
ACKNOWLEDGMENTS
The authors acknowledge support from the Gatsby Charitable Fund, and
thank Simon Haykin for helpful comments that helped to clarify the
presentation. S.R. is supported in part by a National Science Foundation
PDF Fellowship and a grant from the Natural Sciences and Engineering
Research Council of Canada.
APPENDIX: EXPECTATIONS REQUIRED TO FIT THE RBFs
The expectations that we need to compute for Eq. (6.78) are hxij, hzij,
hxx>ij, hzz>ij, hxz>ij, hriðxÞij, hxriðxÞij, hzpiðxÞij; and hriðxÞrlðxÞij. Start-
ing with some of the easier ones that do not depend on the RBF kernel r,
we have
hxij ¼ mxj ; hzij ¼ mz
j ;
hxx>ij ¼ mxjm
x;>j þ Cxx
j ; hzz>ij ¼ mzjm
z;>n þ Czz
j ;
hxz>ij ¼ mxjm
z;>j þ Cxz
j :
APPENDIX: EXPECTATIONS REQUIRED TO FIT THE RBFS 215

Observe that when we multiply the Gaussian RBF kernel riðxÞ (Eq. (6.14))
and nj, we get a Gaussian density over ðx; zÞ with mean and covariance
mij ¼ Cij C�1j mj þ
S�1i ci
0
� � �; Cij ¼ C�1
j þS�1
i 0
0 0
� � ��1
;
and an extra constant (due to lack of normalization),
bij ¼ ð2pÞ�dx=2jSij�1=2jCjj
�1=2jCijj1=2 expð� 1
2dijÞ;
where
dij ¼ c>i S�1i ci þ m>j C�1
j mj � m>ij C�1ij mij:
Using bij and mij, we can evaluate the other expectations:
hriðxÞij ¼ bij; hxriðxÞij ¼ bijmxij; hzriðxÞij ¼ bijm
zij:
Finally,
hriðxÞrlðxÞij ¼ ð2pÞ�dx jCjj
�1=2jSij�1=2jSlj
�1=2jCiljj1=2 expð1
2giljÞ;
where
Cilj ¼ C�1j þ
S�1i þ S�1
l 0
0 0
" # !�1
;
milj ¼ Cilj C�1j mj þ
S�1i ci þ S�1
l cl
0
" # !;
gilj ¼ c>i S�1i ci þ c>l S�1
l cl þ m>j C�1j mj � m>iljC
�1ilj milj:
REFERENCES
[1] R.E. Kalman and R.S. Bucy, ‘‘New results in linear filtering and prediction,’’
Transactions of the ASME Ser. D, Journal of Basic Engineering, 83, 95–108
(1961).
216 6 LEARNING NONLINEAR DYNAMICAL SYSTEMS USING EM

[2] L.E. Baum and J.A. Eagon, ‘‘An equality with applications to statistical
estimation for probabilistic functions of markov processes and to a model for
ecology,’’ Bulletin of the American Mathematical Society, 73, 360–363
(1967).
[3] A.P. Dempster, N.M. Laird, and D.B. Rubin, ‘‘Maximum likelihood from
incomplete data via the EM algorithm,’’ Journal of the Royal Statistical
Society, Ser. B, 39, 1–38 (1977).
[4] J. Pearl, Probabilistic Reasoning in Intelligent Systems: Networks of Plau-
sible Inference. San Mateo, CA: Morgan Kaufmann, 1988.
[5] S.L. Lauritzen and D.J. Spiegelhalter, ‘‘Local computations with probabil-
ities on graphical structures and their application to expert systems,’’ Journal
of the Royal Statistical Society, Ser. B, 50, 157–224 (1988).
[6] S. Roweis and Z. Ghahramani, ‘‘A unifying review of linear Gaussian
models,’’ Neural Computation, 11, 305–345 (1999).
[7] L. Ljung and T. Soderstrom, Theory and Practice of Recursive Identification.
Cambridge, MA: MIT Press, 1983.
[8] G.C. Goodwin and K.S. Sin, Adaptive Filtering, Prediction and Control.
Englewood Cliffs, NJ: Prentice-Hall, 1984.
[9] J. Moody and C. Darken, ‘‘Fast learning in networks of locally-tuned
processing units,’’ Neural Computation, 1, 281–294 (1989).
[10] D.S. Broomhead and D. Lowe, ‘‘Multivariable functional interpolation and
adaptive networks,’’ Complex Systems, 2, 321–355 (1988).
[11] R.E. Kalman, ‘‘A new approach to linear filtering and prediction problems,’’
Journal of Basic Engineering, 82, 35–45 (1960).
[12] H.E. Rauch, ‘‘Solutions to the linear smoothing problem,’’ IEEE Transac-
tions on Automatic Control, 8, 371–372 (1963).
[13] R.E. Kopp and R.J. Orford, ‘‘Linear regression applied to system identifica-
tion and adaptive control systems,’’ AIEE Journal, 1, 2300–2306 (1963).
[14] H. Cox, ‘‘On the estimation of state variables and parameters for noisy
dynamic systems.’’ IEEE Transactions on Automatic Control, 9, 5–12
(1964).
[15] S. Singhal and L. Wu, ‘‘Training multiplayer perceptrons with the extended
Kalman algorithm,’’ in Advances in Neural Information Processing Systems,
Vol. 1, San Mateo, CA: Morgan Kaufmann, 1989, 133–140.
[16] V. Kadirkamanathan and M. Niranjan, ‘‘A functional estimation approach to
sequential learning with neural networks,’’ Neural Computation, 5, 954–975
(1993).
[17] I.T. Nabney, A. McLachlan, and D. Lowe, ‘‘Practical methods of tracking of
nonstationary time series applied to real-world data,’’ in S. K. Rogers and
D. W. Ruck, Eds. AeroSense ’96: Applications and Science of Artificial
Neural Networks II. SPIE Proceedings, 1996, pp. 152–163.
REFERENCES 217

[18] J.E. Handschin and D.Q. Mayne, ‘‘Monte Carlo techniques to estimate the
conditional expectation in multi-stage non-linear filtering,’’ International
Journal of Control, 9, 547–559 (1969).
[19] N.J. Gordon, D.J. Salmond, and A.F.M. Smith, ‘‘A novel approach to
nonlinear=non-Gaussian Bayesian state space estimation,’’ IEE Proceedings
F: Radar and Signal Processing, 140, 107–113 (1993).
[20] G. Kitagawa, ‘‘Monte Carlo filter and smoother for non-Gaussian nonlinear
state space models,’’ Journal of Computer Graphics and Graphical Statis-
tics, 5, 1–25 (1996).
[21] M. Israd and A. Blake, ‘‘CONDENSATION – conditional density propaga-
tion for visual tracking,’’ International Journal of Computer Vision, 29, 5–28
(1998).
[22] M. West, ‘‘Approximating posterior distributions by mixtures,’’ Journal of
the Royal Statistical Society, Ser, B, 54, 553–568 (1993).
[23] M. West, ‘‘Mixture models, monte carlo, Bayesian updating and dynamic
models,’’ Computing Science and Statistics, 24, 325–333 (1993).
[24] A. Doucet, J.F.G. de Freitas, and N.J. Gordon, Sequential Monte Carlo
Methods in Practice. New York: Springer-Verlag, 2000.
[25] S.J. Julier, J.K. Uhlmann, and H.F. Durrant-Whyte, ‘‘A new approach for
filtering nonlinear systems,’’ in Proceedings of the 1995 American Control
Conference, Seattle, 1995, pp. 1628–1632.
[26] S.J. Julier and J.K. Uhlmann, ‘‘A new extension of the Kalman filter to
nonlinear systems,’’ in Proceedings of AeroSense: The 11th International
Symposium on Aerospace=Defense Sensing, Simulation and Controls,
Orlando, FL, 1997.
[27] E.A. Wan, R. van der Merwe, and A.T. Nelson, ‘‘Dual estimation and the
unscented transformation,’’ in Advances in Neural Information Processing
Systems, Vol. 12, Cambridge, MA: MIT Press, 1999.
[28] Z. Ghahramani and G.E. Hinton, ‘‘Variational learning for switching state-
space models,’’ Neural Computation, 12, 831–864 (2000).
[29] M.I. Jordan, Z. Ghahramani, T.S. Jaakkola, and L.K. Saul, ‘‘An introduction
to variational methods in graphical models,’’ Machine Learning, 37, 183–
233 (1999).
[30] L.E. Baum and T. Petrie, ‘‘Statistical inference for probabilistic functions of
finite state Markov chains,’’ Annals of Mathematical Statistics, 37, 1554–
1563 (1966).
[31] R.M. Neal and G.E. Hinton, ‘‘A view of the EM algorithm that justifies
incremental sparse and other variants,’’ in M.I. Jordan, ed., Learning in
Graphical Models. Dordrecht: Kluwer Academic, 1998, pp. 355–368.
[32] I. Csiszar and G. Tusnady, ‘‘Information geometry and alternating mini-
mization procedures,’’ Statistics & Decisions, Supplement Issue 1, pp. 205–
237, 1984.
218 6 LEARNING NONLINEAR DYNAMICAL SYSTEMS USING EM

[33] C.F. Chen, ‘‘The EM approach to the multiple indicators and multiple causes
model via the estimation of the latent variables.’’ Journal of the American
Statistical Association, 76, 704–708 (1981).
[34] R.H. Shumway and D.S. Stoffer, ‘‘An approach to time series smoothing and
forecasting using the EM algorithm,’’ Journal of Time Series Analysis, 3,
253–264 (1982).
[35] Z. Ghahramani and G. Hinton, ‘‘Parameter estimation for linear dynamical
systems,’’ Technical Report CRG-TR-96-2, Department of Computer
Science, University of Toronto, February 1996.
[36] Z. Ghahramani and S. Roweis, ‘‘Learning nonlinear dynamical systems
using an EM algorithm,’’ in Advances in Neural Information Processing
Systems, Vol. 11. Cambridge, MA: MIT Press, 1999, pp. 431–437.
[37] J.F.G. de Freitas, M. Niranjan, and A.H. Gee, ‘‘Nonlinear state space
estimation with neural networks and the EM algorithm,’’ Technical Report,
Cambridge University Engineering Department, 1999.
[38] T. Briegel and V. Tresp, ‘‘Fisher scoring and a mixture of modes approach for
approximate inference and learning in nonlinear state space models,’’ in
Advances in Neural Information Processing Systems, Vol. 11. Cambridge,
MA, MIT Press, 1999.
[39] Z. Ghahramani and G. Hinton ‘‘Switching state-space models,’’ Technical
Report CRG-TR-96-3, Department of Computer Science, University of
Toronto, July 1996.
[40] K. Murphy, ‘‘Switching Kalman filters,’’ Technical Report, Department of
Computer Science, University of California, Berkeley, August, 1998.
[41] G.E. Hinton, P. Dayan, and M. Revow, ‘‘Modeling the manifolds of Images
of handwritten digits,’’ IEEE Transactions on Neural Networks, 8, 65–74
(1997).
[42] Z. Ghahramani and G. Hinton, ‘‘The EM algorithm for mixtures of factor
analyzers,’’ Technical Report CRG-TR-96-1, Department of Computer
Science, University of Toronto, May 1996 (revised February 1997).
[43] W.S. Torgerson, ‘‘Multidimensional scaling I. Theory and method,’’ Psycho-
metrika, 17, 401–419 (1952).
[44] S. Haykin, Adaptive Filter Theory, 3rd ed. Upper Saddle River, NJ: Prentice-
Hall, 1996.
[45] E.A. Wan and A.T. Nelson, ‘‘Dual Kalman filtering methods for nonlinear
prediction,’’ in Advances in Neural Information Processing Systems, Vol. 9.
Cambridge, MA: MIT Press, 1997.
[46] C.K. Carter and R. Kohn, ‘‘On Gibbs sampling for state space models,’’
Biometrika, 81, 541–553 (1994).
[47] S. Fruwirth-Schnatter, ‘‘Bayesian model discrimination and Bayes factors for
linear Gaussian state space models.’’ Journal of the Royal Statistical Society,
Ser. B, 57, 237–246 (1995).
REFERENCES 219

[48] D.J.C. MacKay, ‘‘Bayesian non-linear modelling for the prediction competi-
tion,’’ ASHRAE Transcations, 100, 1053–1062 (1994).
[49] R.M. Neal, ‘‘Assessing relevance determination methods using DELVE,’’ in
C.M. Bishop, Ed. Neural Networks and Machine Learning. New York:
Springer-Verlag, 1998, pp. 97–129.
[50] M.E. Tipping, ‘‘The relevance vector machine,’’ in Advances in Neural
Information Processiing Systems, Vol. 12. Cambridge, MA: MIT Press,
2000, pp. 652–658.
[51] Z. Ghahramani and M.J. Beal, ‘‘Propagation algorithms for variational
Bayesian learning.’’ in Advances in Neural Information Processing Systems,
Vol. 13. Cambridge, MA: MIT Press, 2001.
[52] F. Takens, ‘‘Detecting strange attractors in turbulence,’’ in D.A. Rand and
L.-S. Young, Eds., Dynamical Systems and Turbulence, Warwick 1980,
Lecture Notes in Mathematics, Vol. 898. Berlin: Springer-Verlag, 1981,
pp. 365–381.
[53] J. Hertz, A. Krogh, and R.G. Palmer, Introduction to the Theory of Neural
Computation. Redwood City, CA: Addison-Wesley, 1991.
[54] R.M. Neal, ‘‘Probablistic inference using Markov chain Monte Carlo
methods,’’ Technical Report CRG-TR-93-1, Department of Computer
Science, University of Toronto, 1993.
220 6 LEARNING NONLINEAR DYNAMICAL SYSTEMS USING EM

7
THE UNSCENTEDKALMAN FILTER
Eric A. Wan and Rudolph van der MerweDepartment of Electrical and Computer Engineering, Oregon Graduate Institute of
Science and Technology, Beaverton, Oregon, U.S.A.
7.1 INTRODUCTION
In this book, the extended Kalman filter (EKF) has been used as the
standard technique for performing recursive nonlinear estimation. The
EKF algorithm, however, provides only an approximation to optimal
nonlinear estimation. In this chapter, we point out the underlying assump-
tions and flaws in the EKF, and present an alternative filter with
performance superior to that of the EKF. This algorithm, referred to as
the unscented Kalman filter (UKF), was first proposed by Julier et al.
[1–3], and further developed by Wan and van der Merwe [4–7].
The basic difference between the EKF and UKF stems from the manner
in which Gaussian random variables (GRV) are represented for propagat-
ing through system dynamics. In the EKF, the state distribution is
221
Kalman Filtering and Neural Networks, Edited by Simon HaykinISBN 0-471-36998-5 # 2001 John Wiley & Sons, Inc.

approximated by a GRV, which is then propagated analytically through the
first-order linearization of the nonlinear system. This can introduce large
errors in the true posterior mean and covariance of the transformed GRV,
which may lead to suboptimal performance and sometimes divergence of
the filter. The UKF address this problem by using a deterministic sampling
approach. The state distribution is again approximated by a GRV, but is
now represented using a minimal set of carefully chosen sample points.
These sample points completely capture the true mean and covariance of
the GRV, and, when propagated through the true nonlinear system,
captures the posterior mean and covariance accurately to second order
(Taylor series expansion) for any nonlinearity. The EKF, in contrast, only
achieves first-order accuracy. No explicit Jacobian or Hessian calculations
are necessary for the UKF. Remarkably, the computational complexity of
the UKF is the same order as that of the EKF.
Julier and Uhlman demonstrated the substantial performance gains of
the UKF in the context of state estimation for nonlinear control. A number
of theoretical results were also derived. This chapter reviews this work,
and presents extensions to a broader class of nonlinear estimation
problems, including nonlinear system identification, training of neural
networks, and dual estimation problems. Additional material includes the
development of an unscented Kalman smoother (UKS), specification of
efficient recursive square-root implementations, and a novel use of the
UKF to improve particle filters [6].
In presenting the UKF, we shall cover a number of application areas of
nonlinear estimation in which the EKF has been applied. General
application areas may be divided into state estimation, parameter estima-
tion (e.g., learning the weights of a neural network), and dual estimation
(e.g., the expectation–maximization (EM) algorithm). Each of these areas
place specific requirements on the UKF or EKF, and will be developed in
turn. An overview of the framework for these areas is briefly reviewed
next.
State Estimation The basic framework for the EKF involves estima-
tion of the state of a discrete-time nonlinear dynamical system,
xkþ1 ¼ Fðxk; uk; vkÞ; ð7:1Þ
yk ¼ Hðxk; nkÞ; ð7:2Þ
where xk represents the unobserved state of the system, uk is a known
exogeneous input, and yk is the observed measurement signal. The process
222 7 THE UNSCENTED KALMAN FILTER

noise vk drives the dynamic system, and the observation noise is given by
nk . Note that we are not assuming additivity of the noise sources. The
system dynamical model F and H are assumed known. A simple block
diagram of this system is shown in Figure 7.1. In state estimation, the EKF
is the standard method of choice to achieve a recursive (approximate)
maximum-likelihood estimate of the state xk . For completeness, we shall
review the EKF and its underlying assumptions in Section 7.2 to help
motivate the presentation of the UKF for state estimation in Section 7.3.
Parameter Estimation Parameter estimation, sometimes referred to
as system identification or machine learning, involves determining a
nonlinear mapping
yk ¼ Gðxk;wÞ; ð7:3Þ
where xk is the input, yk is the output, and the nonlinear map Gð�Þ is
parameterized by the vector w. The nonlinear map, for example, may be a
feedforward or recurrent neural network (w are the weights), with
numerous applications in regression, classification, and dynamic model-
ing. Learning corresponds to estimating the parameters w. Typically, a
training set is provided with sample pairs consisting of known input and
desired outputs, fxk , dkg. The error of the machine is defined as ek ¼
dk � Gðxk;wÞ, and the goal of learning involves solving for the para-
meters w in order to minimize the expectation of some given function of
the error.
While a number of optimization approaches exist (e.g., gradient descent
using backpropagation), the EKF may be used to estimate the parameters
by writing a new state-space representation,
wkþ1 ¼ wk þ rk; ð7:4Þ
dk ¼ Gðxk;wkÞ þ ek; ð7:5Þ
Input
Process noise Measurement noise
Output
State
Figure 7.1 Discrete-time nonlinear dynamical system.
7.1 INTRODUCTION 223

where the parameters wk correspond to a stationary process with identity
state transition matrix, driven by process noise rk (the choice of variance
determines convergence and tracking performance and will be discussed
in further detail in Section 7.4). The output dk corresponds to a nonlinear
observation on wk . The EKF can then be applied directly as an efficient
‘‘second-order’’ technique for learning the parameters. The use of the EKF
for training neural networks has been developed by Singhal and Wu [8]
and Puskorious and Feldkamp [9], and is covered in Chapter 2 of this
book. The use of the UKF in this role is developed in Section 7.4.
Dual Estimation A special case of machine learning arises when the
input xk is unobserved, and requires coupling both state estimation and
parameter estimation. For these dual estimation problems, we again
consider a discrete-time nonlinear dynamical system,
xkþ1 ¼ Fðxk;uk; vk;wÞ; ð7:6Þ
yk ¼ Hðxk;nk;wÞ; ð7:7Þ
where both the system states xk and the set of model parameters w for the
dynamical system must be simultaneously estimated from only the
observed noisy signal yk . Example applications include adaptive nonlinear
control, noise reduction (e.g., speech or image enhancement), determining
the underlying price of financial time series, etc. A general theoretical and
algorithmic framework for dual Kalman-based estimation has been
presented in Chapter 5. An expectation–maximization approach has also
been covered in Chapter 6. Approaches to dual estimation utilizing the
UKF are developed in Section 7.5.
In the next section, we review optimal estimation to explain the basic
assumptions and flaws with the EKF. This will motivate the use of the
UKF as a method to amend these flaws. A detailed development of the
UKF is given in Section 7.3. The remainder of the chapter will then be
divided based on the application areas reviewed above. We conclude the
chapter in Section 7.6 with the unscented particle filter, in which the UKF
is used to improve sequential Monte-Carlo-based filtering methods.
Appendix A provides a derivation of the accuracy of the UKF. Appendix
B details an efficient square-root implementation of the UKF.
7.2 OPTIMAL RECURSIVE ESTIMATION AND THE EKF
Given observations yk , the goal is to estimate the state xk . We make no
assumptions about the nature of the system dynamics at this point. The
224 7 THE UNSCENTED KALMAN FILTER

optimal estimate in the minimum mean-squared error (MMSE) sense is
given by the conditional mean:
xxk ¼ E½xk jYk0�; ð7:8Þ
where Yk0 is the sequence of observations up to time k. Evaluation of this
expectation requires knowledge of the a posteriori density pðxk jYk0Þ.
1
Given this density, we can determine not only the MMSE estimator, but
any ‘‘best’’ estimator under a specified performance criterion. The
problem of determining the a posteriori density is in general referred to
as the Bayesian approach, and can be evaluated recursively according to
the following relations:
pðxk jYk0Þ ¼
pðxk jYk�10 Þpðyk jxkÞ
pðyk jYk�10 Þ
; ð7:9Þ
where
pðxk jYk�10 Þ ¼
ðpðxk jxk�1Þpðxk�1jY
k�10 Þ dxk�1; ð7:10Þ
and the normalizing constant pðyk jYk0Þ is given by
pðyk jYk�10 Þ ¼
ðpðxk jY
k�10 Þpðyk jxkÞ dxk : ð7:11Þ
This recursion specifies the current state density as a function of the
previous density and the most recent measurement data. The state-space
model comes into play by specifying the state transition probability
pðxk jxk�1Þ and measurement probability or likelihood, pðyk jxxÞ. Specifi-
cally, pðxk jxk�1Þ is determined by the process noise density pðvkÞ with the
state-update equation
xkþ1 ¼ Fðxk; uk; vkÞ: ð7:12Þ
For example, given an additive noise model with Gaussian density,
pðvkÞ ¼ nð0;RvÞ, then pðxk jxk�1Þ ¼ nðFðxk�1, uk�1Þ, Rv). Similarly,
1Note that we do not write the implicit dependence on the observed input uk , since it is not
a random variable.
7.2 OPTIMAL RECURSIVE ESTIMATION AND THE EKF 225

pðyk jxxÞ is determined by the observation noise density pðnkÞ and the
measurement equation
yk ¼ Hðxk; nkÞ: ð7:13Þ
In principle, knowledge of these densities and the initial condition
pðx0jy0Þ ¼ pðy0jx0Þpðx0Þ=pðy0Þ determines pðxk jYk0Þ for all k. Unfortu-
nately, the multidimensional integration indicated by Eqs. (7.9)–(7.11)
makes a closed-form solution intractable for most systems. The only
general approach is to apply Monte Carlo sampling techniques that
essentially convert integrals to finite sums, which converge to the true
solution in the limit. The particle filter discussed in the last section of this
chapter is an example of such an approach.
If we make the basic assumption that all densities remain Gaussian,
then the Bayesian recursion can be greatly simplified. In this case, only the
conditional mean xxk ¼ E½xk jYk0� and covariance Pxk
need to be evaluated.
It is straightforward to show that this leads to the recursive estimation
xxk ¼ ðprediction of xkÞ þ Kk ½yk � ðprediction of ykÞ�; ð7:14Þ
Pxk¼ P�
xk�KkP~yyk
KTk : ð7:15Þ
While this is a linear recursion, we have not assumed linearity of the
model. The optimal terms in this recursion are given by
xx�k ¼ E½Fðxk�1; uk�1; vk�1Þ�; ð7:16Þ
Kk ¼ Pxk ykP�1~yyk ~yyk
; ð7:17Þ
yy�k ¼ E½Hðx�k ; nkÞ�; ð7:18Þ
where the optimal prediction (i.e., prior mean) of xk is written as xx�k , and
corresponds to the expectation of a nonlinear function of the random
variables xk�1 and vk�1 (with a similar interpretation for the optimal
prediction yy�k ). The optimal gain term Kk is expressed as a function of
posterior covariance matrices (with ~yyk ¼ yk � yy�k Þ. Note that evaluation of
the covariance terms also require taking expectations of a nonlinear
function of the prior state variable. P�xk
is the prediction of the covariance
of xk , and P~yykis the covariance of ~yyk .
The celebrated Kalman filter [10] calculates all terms in these equations
exactly in the linear case, and can be viewed as an efficient method for
226 7 THE UNSCENTED KALMAN FILTER

analytically propagating a GRV through linear system dynamics. For
nonlinear models, however, the EKF approximates the optimal terms as
xx�k Fðxxk�1;uk�1; �vvÞ; ð7:19Þ
Kk PPxk ykPP�1~yyk ~yyk
; ð7:20Þ
yy�k Hðxx�k ; �nnÞ; ð7:21Þ
where predictions are approximated simply as functions of the prior
mean value (no expectation taken).2 The covariances are determined by
linearizing the dynamical equations ðxkþ1 Axk þ Buuk þ Bvk , yk
Cxk þ Dnk), and then determining the posterior covariance matrices
analytically for the linear system. In other words, in the EKF, the state
distribution is approximated by a GRV, which is then propagated analy-
tically through the ‘‘first-order’’ linearization of the nonlinear system. The
explicit equations for the EKF are given in Table 7.1. As such, the EKF
2The noise means are denoted by n ¼ E½n� and v ¼ E½v�, and are usually assumed to equal
zero.
Table 7.1 Extended Kalman filter (EKF) equations
Initialize with
xx0 ¼ E½x0�; ð7:22Þ
Px0¼ E½ðx0 � xx0Þðx0 � xx0Þ
T�: ð7:23Þ
For k 2 f1; . . . ;1g, the time-update equations of the extended Kalman filter are
xx�k ¼ Fðxxk�1; uk�1; �vvÞ; ð7:24Þ
P�xk¼ Ak�1Pxk�1
ATk�1 þ BkRvBT
k ; ð7:25Þ
and the measurement-update equations are
Kk ¼ P�xk
CTk ðCkP�
xkCT
k þ DkRnDTk Þ
�1; ð7:26Þ
xxk ¼ xx�k þKk ½yk � Hðxx�k ; �nnÞ�; ð7:27Þ
Pxk¼ ðI �KkCkÞP
�xk; ð7:28Þ
where
Ak ¼D @Fðx; uk; �vvÞ
@x
����xxk
; Bk ¼D @Fðxx�k ; uk ; vÞ
@v
�����vv
;
Ck ¼D @Hðx; �nnÞ
@x
����xxk
; Dk ¼D @Hðxx�k ; nÞ
@n
�����nn
;
ð7:29Þ
and where Rv and Rn are the covariances of vk and nk, respectively.
7.2 OPTIMAL RECURSIVE ESTIMATION AND THE EKF 227

can be viewed as providing ‘‘first-order’’ approximations to the optimal
terms.3 These approximations, however, can introduce large errors in the
true posterior mean and covariance of the transformed (Gaussian) random
variable, which may lead to suboptimal performance and sometimes
divergence of the filter.4 It is these ‘‘flaws’’ that will be addressed in the
next section using the UKF.
7.3 THE UNSCENTED KALMAN FILTER
The UKF addresses the approximation issues of the EKF. The state
distribution is again represented by a GRV, but is now specified using a
minimal set of carefully chosen sample points. These sample points
completely capture the true mean and covariance of the GRV, and when
propagated through the true nonlinear system, capture the posterior mean
and covariance accurately to the second order (Taylor series expansion)
for any nonlinearity. To elaborate on this, we begin by explaining the
unscented transformation.
Unscented Transformation The unscented transformation (UT) is a
method for calculating the statistics of a random variable which undergoes
a nonlinear transformation [3]. Consider propagating a random variable x
(dimension L) through a nonlinear function, y ¼ f ðxÞ. Assume x has mean
�xx and covariance Px. To calculate the statistics of y, we form a matrix XX of
2L þ 1 sigma vectors X i according to the following:
X0 ¼ �xx;
X i ¼ �xx þ ðffiffiffiffiffiffiffiffiffiffiffiffiffiffiffiffiffiffiffiðL þ lÞPx
pÞi; i ¼ 1; . . . ; L;
X i ¼ �xx � ðffiffiffiffiffiffiffiffiffiffiffiffiffiffiffiffiffiffiffiðL þ lÞPx
pÞi�L; i ¼ L þ 1; . . . ; 2L;
ð7:30Þ
3While ‘‘second-order’’ versions of the EKF exist, their increased implementation and
computational complexity tend to prohibit their use.4A popular technique to improve the ‘‘first-order’’ approach is the iterated EKF, which
effectively iterates the EKF equations at the current time step by redefining the nominal
state estimate and re-linearizing the measurement equations. It is capable of providing
better performance than the basic EKF, especially in the case of significant nonlinearity in
the measurement function [11]. We have not performed a comparison to the UKF at this
time, though a similar procedure may also be adapted to iterate the UKF.
228 7 THE UNSCENTED KALMAN FILTER

where l ¼ a2ðL þ kÞ � L is a scaling parameter. The constant a deter-
mines the spread of the sigma points around �xx, and is usually set to a small
positive value (e.g., 1 � a � 10�4Þ. The constant k is a secondary scaling
parameter, which is usually set to 3 � L (see [1] for details), and b is used
to incorporate prior knowledge of the distribution of x (for Gaussian
distributions, b ¼ 2 is optimal). ðffiffiffiffiffiffiffiffiffiffiffiffiffiffiffiffiffiffiffiffiffiðL þ lÞPxÞ
pi
is the ith column of the
matrix square root (e.g., lower-triangular Cholesky factorization). These
sigma vectors are propagated through the nonlinear function
Yi ¼ f ðX iÞ; i ¼ 0; . . . ; 2L; ð7:31Þ
and the mean and covariance for y are approximated using a weighted
sample mean and covariance of the posterior sigma points,
�yy P2L
i¼0
WðmÞi Yi; ð7:32Þ
Py P2L
i¼0
WðcÞi ðYi � �yyÞðYi � �yyÞT ; ð7:33Þ
with weights Wi given by
WðmÞ0 ¼
lL þ l
;
WðcÞ0 ¼
lL þ l
þ 1 � a2 þ b
WðmÞi ¼ W
ðcÞi ¼
1
2ðL þ lÞ; i ¼ 1; . . . ; 2L:
ð7:34Þ
A block diagram illustrating the steps in performing the UT is shown in
Figure 7.2. Note that this method differs substantially from general Monte
Carlo sampling methods, which require orders of magnitude more sample
points in an attempt to propagate an accurate (possibly non-Gaussian)
distribution of the state. The deceptively simple approach taken with the
UT results in approximations that are accurate to the third order for
Gaussian inputs for all nonlinearities. For non-Gaussian inputs, approx-
imations are accurate to at least the second order, with the accuracy of
third- and higher-order moments being determined by the choice of a and
b. The proof of this is provided in Appendix A. Valuable insight into the
UT can also be gained by relating it to a numerical technique called
7.3 THE UNSCENTED KALMAN FILTER 229

Gaussian quadrature numerical evaluation of integrals. Ito and Xiong [12]
recently showed the relation between the UT and the Gauss–Hermite
quadrature rule5 in the context of state estimation. A close similarity also
exists between the UT and the central difference interpolation filtering
(CDF) techniques developed separately by Ito and Xiong [12] and
Nørgaard, Poulsen, and Ravn [13]. In [7] van der Merwe and Wan show
how the UKF and CDF can be unified in a general family of derivative-
free Kalman filters for nonlinear estimation.
A simple example is shown in Figure 7.3 for a two-dimensional system:
Figure 7.3a shows the true mean and covariance propagation using Monte
Carlo sampling; Figure 7.3b shows the results using a linearization
approach as would be done in the EKF; Figure 7.3c shows the perfor-
mance of the UT (note that only five sigma points are required). The
superior performance of the UT is clear.
Unscented Kalman Filter The unscented Kalman filter (UKF) is a
straightforward extension of the UT to the recursive estimation in Eq.
(7.14), where the state RV is redefined as the concatenation of the original
state and noise variables: xak ¼ ½xT
k vTk nT
k �T . The UT sigma point
selection scheme, Eq. (7.30), is applied to this new augmented state RV
to calculate the corresponding sigma matrix, XXak . The UKF equations are
Figure 7.2 Block diagram of the UT.
5In the scalar case, the Gauss–Hermite rule is given byÐ1�1
f ðxÞð2pÞ�1=2e�x2
dx ¼Pmi¼1 wi f ðxiÞ, where the equality holds for all polynomials, f ð�Þ, of degree up to 2m � 1
and the quadrature points xi and weights wi are determined according to the rule type (see
[12] for details). For higher dimensions, the Gauss–Hermite rule requires on the order of
m L functional evaluations, where L is the dimension of the state. For the scalar case, the
UTwith a ¼ 1, b ¼ 0, and k ¼ 2 coincides with the three-point Gauss–Hermite quadrature
rule.
230 7 THE UNSCENTED KALMAN FILTER

given in Table 7.2. Note that no explicit calculations of Jacobians or
Hessians are necessary to implement this algorithm. Furthermore, the
overall number of computations is of the same order as the EKF.
Implementation Variations For the special (but often encountered)
case where the process and measurement noise are purely additive, the
computational complexity of the UKF can be reduced. In such a case, the
system state need not be augmented with the noise RVs. This reduces the
dimension of the sigma points as well as the total number of sigma points
used. The covariances of the noise source are then incorporated into the
state covariance using a simple additive procedure. This implementation is
given in Table 7.3. The complexity of the algorithm is of order L3, where L
is the dimension of the state. This is the same complexity as the EKF. The
most costly operation is in forming the sample prior covariance matrix P�k .
Depending on the form of F, this may be simplified; for example, for
univariate time series or with parameter estimation (see Section 7.4), the
complexity reduces to order L2.
Figure 7.3 Example of the UT for mean and covariance propagation:(a) actual; (b) first-order linearization (EFK); (c) UT.
7.3 THE UNSCENTED KALMAN FILTER 231

Table 7.2 Unscented Kalman filter (UKF) equations
Initialize with
xx0 ¼ E½x0�; ð7:35Þ
P0 ¼ E½ðx0 � xx0Þðx0 � xx0ÞT�; ð7:36Þ
xxa0 ¼ E½xa� ¼ ½xxT
0 0 0�T ; ð7:37Þ
Pa0 ¼ E½ðxa
0 � xxa0Þðx
a0 � xxa
0ÞT� ¼
P0 0 0
0 Rv 0
0 0 Rn
24
35: ð7:38Þ
For k 2 f1; . . . ;1g,
calculate the sigma points:
XX ak�1 ¼ ½xxa
k�1 xxak�1 þ g
ffiffiffiffiffiffiffiffiffiffiPa
k�1
pxxa
k�1 � gffiffiffiffiffiffiffiffiffiffiPa
k�1
p�: ð7:39Þ
The time-update equations are
XX xkjk�1 ¼ FðXX x
k�1; uk�1; ðXvk�1Þ; ð7:40Þ
xx�k ¼P2L
i¼0
WðmÞi X x
i;kjk�1; ð7:41Þ
P�k ¼
P2L
i¼0
WðcÞi ðX x
i;kjk�1 � xx�k ÞðXxi;kjk�1 � xx�k Þ
T ; ð7:42Þ
YY kjk�1 ¼ HðXX xkjk�1;XX
nk�1Þ; ð7:43Þ
yy�k ¼P2L
i¼0
WðmÞi Yi;kjk�1; ð7:44Þ
and the measurement-update equations are
P~yyk ~yyk¼P2L
i¼0
WðcÞi ðYi;kjk�1 � yy�k ÞðYi;kjk�1 � yy�k Þ
T ; ð7:45Þ
Pxk yk¼P2L
i¼0
WðcÞi ðX i;kjk�1 � xx�k ÞðYi;kjk�1 � yy�k Þ
T ; ð7:46Þ
Kk ¼ Pxk ykP�1~yyk ~yyk
; ð7:47Þ
xxk ¼ xx�k þKkðyk � yy�k Þ; ð7:48Þ
Pk ¼ P�k �KkP~yyk ~yyk
KkT ; ð7:49Þ
where
xa ¼ ½xT vT nT �T ; XX a ¼ ½ðXX xÞ
TðXX vÞ
TðXX nÞ
T�T ; g ¼
ffiffiffiffiffiffiffiffiffiffiffiL þ l
p;
l is the composite scaling parameter, L is the dimension of the augmented state,
Rv is the process-noise covariance, Rn is the measurement-noise covariance, and
Wi are the weights as calculated in Eq. (7.34).
232 7 THE UNSCENTED KALMAN FILTER

Table 7.3 UKF – additive (zero mean) noise case
Initialize with
xx0 ¼ E½x0�; ð7:50Þ
P0 ¼ E½ðx0 � xx0Þðx0 � xx0ÞT�: ð7:51Þ
For k 2 f1; . . . ;1g,
calculate the sigma points:
XX k�1 ¼ ½xxk�1 xxk�1 þ gffiffiffiffiffiffiffiffiffiffiPk�1
pxxk�1 � g
ffiffiffiffiffiffiffiffiffiffiPk�1
p�: ð7:52Þ
The time-update equations are
XX *kjk�1 ¼ FðXX k�1; uk�1Þ; ð7:53Þ
xx�k ¼P2L
i¼0
WðmÞi X*i;kjk�1 ð7:54Þ
P�k ¼
P2L
i¼0
WðcÞi ðX*i;kjk�1 � xx�k ÞðX*i;kjk�1 � xx�k Þ
Tþ Rv; ð7:55Þ
ðaugment sigma pointsÞ6
XX kjk�1 ¼ ½XX *kjk�1 XX *0;kjk�1 þ gffiffiffiffiffiffiRv
pX*0;kjk�1 � g
ffiffiffiffiffiffiRv
p� ð7:56Þ
YY kjk�1 ¼ HðXX kjk�1Þ; ð7:57Þ
yy�k ¼P2L
i¼0
WðmÞi Yi;kjk�1; ð7:58Þ
and the measurement-update equations are
P~yyk ~yyk¼P2L
i¼0
WðcÞi ðYi;kjk�1 � yy�k ÞðYi;kjk�1 � yy�k Þ
Tþ Rn; ð7:59Þ
Pxk yk¼P2L
i¼0
WðcÞi ðX i;kjk�1 � xx�k ÞðYi;kjk�1 � yy�k Þ
Tð7:60Þ
Kk ¼ Pxk ykP�1~yyk ~yyk
ð7:61Þ
xxk ¼ xx�k þKkðyk � yy�k Þ ð7:62Þ
Pk ¼ P�k �KkP~yyk ~yyk
KkT ; ð7:63Þ
where g ¼ffiffiffiffiffiffiffiffiffiffiffiL þ l
p; l is the composite scaling parameter, L is the dimension of
the state, Rv is the process-noise covariance, Rn is the measurement-noise
covariance and Wi are the weights as calculated in Eq. (7.34).
6Here we augment the sigma points with additional points derived from the matrix square
root of the process noise covariance. This requires setting L ! 2L and recalculating the
various weights Wi accordingly. Alternatively, we may redraw a complete new set of sigma
points, i.e., XX kjk�1 ¼ ½xx�k xx�k þ gffiffiffiffiffiffiP�
k
pxx�k � g
ffiffiffiffiffiffiP�
k
p�. This alternative approach results
in fewer sigma points being used, but also discards any odd-moments information captured
by the original propagated sigma points.
7.3 THE UNSCENTED KALMAN FILTER 233

A number of variations for numerical purposes are also possible. For
example, the matrix square root, which can be implemented directly using
a Cholesky factorization, is in general of order 16
L3. However, the
covariance matrices are expressed recursively, and thus the square root
can be computed in only order M � L2 (where M is the dimension of the
output yk) by performing a recursive update to the Cholesky factorization.
Details of an efficient recursive square-root UKF implementation are
given in Appendix B.
7.3.1 State-Estimation Examples
The UKF was originally designed for state estimation applied to nonlinear
control applications requiring full-state feedback [1–3]. We provide an
example for a double inverted pendulum control system. In addition, we
provide a new application example corresponding to noisy time-series
estimation with neural networks.
Double Inverted Pendulum A double inverted pendulum (see Fig.
7.4) has states corresponding to cart position and velocity, and top and
bottom pendulum angle and angular velocity, x ¼ ½x; _xx; y1;_yy1; y2;
_yy2�. The
system parameters correspond to the length and mass of each pendulum,
and the cart mass, w ¼ ½l1; l2;m1;m2;M �. The dynamical equations are
ðM þ m1 þ m2Þ€xx � ðm1 þ 2m2Þl1€yy1 cos y1 � m2l2
€yy2 cos y2
¼ u þ ðm1 þ 2m2Þl1ð_yy1Þ
2 sin y1 þ m2l2ð_yy2Þ
2 sin y2; ð7:64Þ
� ðm1 þ 2m2Þl1 €xx cos y1 þ 4ð13
m1 þ m2Þðl1Þ2 €yy1 þ 2m2l1l2
€yy2 cosðy2 � y1Þ
¼ ðm1 þ 2m2Þgl1 sin y1 þ 2m2l1l2ð_yy2Þ
2 sinðy2 � y1Þ; ð7:65Þ
� m2 €xxl2 cos y2 þ 2m2l1l2€yy1 cosðy2 � y1Þ þ
43
m2ðl2Þ2 €yy2
¼ m2gl2 sin y2 � 2m2l1l2ð_yy1Þ
2 sinðy2 � y1Þ: ð7:66Þ
Figure 7.4 Double inverted pendulum.
234 7 THE UNSCENTED KALMAN FILTER

These continuous-time dynamics are discretized with a sampling period
of 0.02 seconds. The pendulum is stabilized by applying a control force u
to the cart. In this case, we use a state-dependent Ricatti equation (SDRE)
controller to stabilize the system.7 A state estimator is run outside the
control loop in order to compare the EKF with the UKF (i.e., the estimated
states are not used in the feedback control for evaluation purposes). The
observation corresponds to noisy measurements of the cart position, cart
velocity, and angle of the top pendulum. This is a challenging problem,
since no measurements are made for the bottom pendulum, nor for the
angular velocity of the top pendulum. For this experiment, the pendulum
is initialized in a jack-knife position (þ25�=�25�), with a cart offset of
0.5 meters. The resulting state estimates are shown in Figure 7.5. Clearly,
the UKF is better able to track the unobserved states.8 If the estimated
states are used for feedback in the control loop, the UKF system is still
able to stabilize the pendulum, while the EKF system crashes. We shall
return to the double inverted pendulum problem later in this chapter for
both model estimation and dual estimation.
Noisy Time-Series Estimation In this example, the UKF is used to
estimate an underlying clean time series corrupted by additive Gaussian
white noise. The time-series used is the Mackey–Glass-30 chaotic series
[15, 16]. The clean time-series is first modeled as a nonlinear autoregres-
sion
xk ¼ f ðxk�1; . . . xk�M ;wÞ þ vk; ð7:67Þ
where the model f (parameterised by w) was approximated by training a
feedforward neural network on the clean sequence. The residual error after
convergence was taken to be the process-noise variance.
Next, white Gaussian noise was added to the clean Mackey–Glass
series to generate a noisy time series yk ¼ xk þ nk . The corresponding
7An SDRE controller [11] is designed by formulating the dynamical equations as
xkþ1 ¼ AðxkÞxk þ BðxkÞuk : Note, this representation is not a linearization, but rather a
reformulation of the nonlinear dynamics into a pseudo-linear form. Based on this
state-space representation, we design an optimal LQR controller, uk ¼
�R�1BT ðxkÞPðxkÞxk � KðxkÞxk , where PðxkÞ is a solution of the standard Ricatti
equations using state-dependent matrices AðxkÞ and BðxkÞ. The procedure is repeated at
every time step at the current state xk , and provides local asymptotic stability of the plant
[14]. The approach has been found to be far more robust than LQR controllers based on
standard linearization techniques.8Note that if all six states are observed with noise, then the performances of the EKF and
UKF are comparable.
7.3 THE UNSCENTED KALMAN FILTER 235

state-space representation is given by
xkþ1 ¼ Fðxk;wÞ þ Bvk;
xkþ1
xk
..
.
xk�M
266664
377775 ¼
f ðxk; . . . ; xk�Mþ1;wÞ
1 0 0 0
0 . ..
0 ...
0 0 1 0
264
375
xk
..
.
xk�Mþ1
2664
3775
266664
377775þ
1
0
..
.
0
266664
377775vk;
yk ¼ ½1 0 . . . 0�xk þ nk : ð7:68Þ
In the estimation problem, the noisy time-series yk is the only observed
input to either the EKF or UKF algorithms (both utilize the known neural
network model). Figure 7.6 shows a subsegment of the estimates gener-
ated by both the EKF and the UKF (the original noisy time series has a
3 dB SNR). The superior performance of the UKF is clearly visible.
Figure 7.5 State estimation for the double inverted pendulum problem.Only three noisy states are observed: cart position, cart velocity, and theangle of the top pendulum. (10 dB SNR; a ¼ 1, b ¼ 0, k ¼ 0.)
236 7 THE UNSCENTED KALMAN FILTER

7.3.2 The Unscented Kalman Smoother
As has been discussed, the Kalman filter is a recursive algorithm providing
the conditional expectation of the state xk given all observations Yk0 up to
the current time k. In contrast, the Kalman smoother estimates the state
given all observations past and future, YN0 , where N is the final time.
Kalman smoothers are commonly used for applications such as trajectory
planning, noncausal noise reduction, and the E-step in the EM algorithm
200 210 220 230 240 250 260 270 280 290 300-5
0
5
k
xk()
cleannoisyEKF
200 210 220 230 240 250 260 270 280 290 300-5
0
5
k
xk()
cleannoisyUKF
0 100 200 300 400 500 600 700 800 900 10000
0.2
0.4
0.6
0.8
1
k
Nor
mal
ized
MS
E
EKFUKF
( )a
( )b
( )c
Figure 7.6 Estimation of Mackey–Glass time series using a known model: (a)with the EKF; (b) with the UKF. (c) shows a comparison of estimation errors forthe complete sequence.
7.3 THE UNSCENTED KALMAN FILTER 237

[17, 18]. A thorough treatment of the Kalman smoother in the linear case
is given in [19]. The basic idea is to run a Kalman filter forward in time to
estimate the mean and covariance ðxxfk , P
fk Þ of the state, given past data. A
second Kalman filter is then run backward in time to produce a backward-
time predicted mean and covariance ðxx�bk , P�b
k ), given the future data.
These two estimates are then combined, producing the following
smoothed statistics, given all the data:
ðPskÞ�1
¼ ðPfk Þ�1þ ðP�b
k Þ�1; ð7:69Þ
xxsk ¼ Ps
k ½ðP�bk Þ
�1xx�bk þ ðP
fk Þ
�1xxfk �: ð7:70Þ
For the nonlinear case, the EKF replaces the Kalman filter. The use of
the EKF for the forward filter is straightforward. However, implementation
of the backward filter is achieved by using the following linearized
backward-time system:
xk�1 ¼ A�1xk þ A�1Bvk ð7:71Þ
that is, the forward nonlinear dynamics are linearized, and then inverted
for the backward model. A linear Kalman filter is then applied.
Our proposed unscented Kalman smoother (UKS) replaces the EKF
with the UKF. In addition, we consider using a nonlinear backward model
as well, either derived from first principles or by training a backward
predictor using a neural network model, as illustrated for the time-series
case in Figure 7.7. The nonlinear backward model allows us to take full
advantage of the UKF, which requires no linearization step.
To illustrate performance, we reconsider the noisy Mackey–Glass time-
series problem of the previous section, as well as a second time series
generated using a chaotic autoregressive neural network. Table 7.4
compares smoother performance. In this case, the network models are
trained on the clean time series, and then tested on the noisy data using the
standard extended Kalman smoother with linearized backward model
x
Time series
Figure 7.7 Forward=backward neural network prediction training.
238 7 THE UNSCENTED KALMAN FILTER

(EKS1), an extended Kalman smoother with a second nonlinear backward
model (EKS2), and the unscented Kalman smoother (UKS). The forward
(F), backward (B), and smoothed (S) estimation errors are reported.
Again, the performance benefits of the unscented approach are clear.
7.4 UKF PARAMETER ESTIMATION
Recall that parameter estimation involves learning a nonlinear mapping
yk ¼ Gðxk;wÞ, where w corresponds to the set of unknown parameters.
Gð�Þ may be a neural network or another parameterized function. The EKF
may be used to estimate the parameters by writing a new state-space
representation
wkþ1 ¼ wk þ rk; ð7:73Þ
dk ¼ Gðxk;wkÞ þ ek; ð7:74Þ
where wk corresponds to a stationary process with identity state transition
matrix, driven by process noise rk . The desired output dk corresponds to a
nonlinear observation on wk . In the linear case, the relationship between
the Kalman Filter (KF) and the popular recursive least-squares (RLS) is
given in [20] and [25]. In the nonlinear case, the EKF training corresponds
to a modified-Newton method [22] (see also Chapter 2).
Table 7.4 Comparison of smoother performance
Mackey–Glass
Normalized MSE
Algorithm F B S
EKS1 0.20 0.70 0.27
EKS2 0.20 0.31 0.19
UKS 0.10 0.24 0.08
Chaotic AR–NN
Normalized MSE
Algorithm F B S
EKS1 0.35 0.32 0.28
EKS2 0.35 0.22 0.23
UKS 0.23 0.21 0.16
7.4 UKF PARAMETER ESTIMATION 239

From an optimization perspective, the following prediction error cost is
minimized:
J ðwÞ ¼Pkt¼1
½dt � Gðxt;wÞ�TðReÞ�1½dt � Gðxt;wÞ�: ð7:75Þ
Thus, if the ‘‘noise’’ covariance Re is a constant diagonal matrix, then, in
fact, it cancels out of the algorithm (this can be shown explicitly), and
hence can be set arbitrarily (e.g., Re ¼ 0:5I). Alternatively, Re can be set
to specify a weighted MSE cost. The innovations covariance
E½rkrTk � ¼ Rr
k , on the other hand, affects the convergence rate and tracking
performance. Roughly speaking, the larger the covariance, the more
quickly older data is discarded. There are several options on how to
choose Rrk .
� Set Rrk to an arbitrary ‘‘fixed’’ diagonal value, which may then be
‘‘annealed’’ towards zero as training continues.
� Set Rrk ¼ ðl�1
RLS � 1ÞPwk, where lRLS 2 ð0; 1� is often referred to as
the ‘‘forgetting factor,’’ as defined in the recursive least-squares
(RLS) algorithm [21]. This provides for an approximate exponen-
tially decaying weighting on past data, and is described more fully in
[22]. Note that lRLS should not be confused with l used for sigma-
point calculation.
� Set
Rrk ¼ ð1 � aRMÞR
rk�1 þ aRMKw
k ½dk � Gðxk; wwÞ�
� ½dk � Gðxk; wwÞ�T ðKwk Þ
T ;
which is a Robbins–Monro stochastic approximation scheme for
estimating the innovations [23]. The method assumes that the
covariance of the Kalman update model is consistent with the
actual update model. Typically, Rrk is also constrained to be a
diagonal matrix, which implies an independence assumption on
the parameters. Note that a similar update may also be used for Rek.
Our experience indicates that the ‘‘Robbins–Monro’’ method provides the
fastest rate of absolute convergence and lowest final MMSE values (see
the experiments in the next section). The ‘‘fixed’’ Rrk in combination with
annealing can also achieve good final MMSE performance, but requires
more monitoring and a greater prior knowledge of the noise levels. For
problems where the MMSE is zero, the covariance should be lower-
bounded to prevent the algorithm from stalling and potential numerical
240 7 THE UNSCENTED KALMAN FILTER
problems. The ‘‘forgetting-factor’’ and ‘‘fixed’’ Rrk methods are most
appropriate for on-line learning problems in which tracking of time-
varying parameters is necessary. In this case, the parameter covariance
stays lower-bounded, allowing the most recent data to be emphasized. This
leads to some misadjustment, but also keeps the Kalman gain sufficiently
large to maintain good tracking. In general, study of the various trade-offs
between these different approaches is still an area of open research.
The UKF represents an alternative to the EKF for parameter estimation.
However, as the state transition function is linear, the advantage of the
UKF may not be as obvious. Note that the observation function is still
nonlinear. Furthermore, the EKF essentially builds up an approximation to
the expected Hessian by taking outer products of the gradient. The UKF,
however, may provide a more accurate estimate through direct approx-
imation of the expectation of the Hessian. While both the EKF and UKF
can be expected to achieve similar final MMSE performance, their
covergence properties may differ. In addition, a distinct advantage of the
UKF occurs when either the architecture or error metric is such that
differentiation with respect to the parameters is not easily derived, as is
necessary in the EKF. The UKF effectively evaluates both the Jacobian
and Hessian precisely through its sigma-point propagation, without the
need to perform any analytical differentiation.
Specific equations for UKF parameter estimation are given in Table 7.5.
Simplifications have been made relative to the state UKF, accounting for
the specific form of the state transition function. In Table 7.5, we have
provided two options on how the function output ddk is achieved. In the
first option, the output is given as
ddk ¼P2L
i¼0
WðmÞi Di;kjk�1 E½Gðxk;wkÞ�; ð7:89Þ
corresponding to the direct interpretation of the UKF equations. The
output is the expected value (mean) of a function of the random variable
wk . In the second option, we have
ddk ¼ Gðxk; ww�k Þ; ð7:90Þ
corresponding to the typical interpretation, in which the output is the
function with the current ‘‘best’’ set of parameters. This option yields
convergence performance that is indistinguishable from the EKF. The first
option, however, has different convergence characteristics, and requires
7.4 UKF PARAMETER ESTIMATION 241

further explanation. In the state-space approach to parameter estimation,
absolute convergence is achieved when the parameter covariance Pwkgoes
to zero (this also forces the Kalman gain to zero). At this point, the output
for either option is identical. However, prior to this, the finite covariance
provides a form of averaging on the output of the function, which in turn
prevents the parameters from going to the minimum of the error surface.
Thus, the method may help avoid falling into a local minimum. Further-
more, it provides a form of built-in regularization for short or noisy data
Table 7.5 UKF parameter estimation
Initialize with
ww0 ¼ E½w�; ð7:76Þ
Pw0¼ E½ðw � ww0Þðw � ww0Þ
T�: ð7:77Þ
For k 2 f1; . . . ;1g,
The time update and sigma-point calculation are given by
ww�k ¼ wwk�1; ð7:78Þ
P�wk¼ Pwk�1
þ Rrk�1; ð7:79Þ
WWkjk�1 ¼ ½ww�k ww�
k þ gffiffiffiffiffiffiffiP�
wk
qww�
k � gffiffiffiffiffiffiffiP�
wk
q�; ð7:80Þ
DDkjk�1 ¼ Gðxk ;WWkjk�1Þ; ð7:81Þ
option 1: ddk ¼P2L
i¼0
WðmÞi Di;kjk�1; ð7:82Þ
option 2: ddk ¼ Gðxk ; ww�k Þ: ð7:83Þ
and the measurement-update equations are
P ~ddk~ddk¼P2L
i¼0
WðcÞi ðDi;kjk�1 � ddkÞðDi;kjk�1 � ddkÞ
Tþ Re
k; ð7:84Þ
Pwk dk¼P2L
i¼0
WðcÞi ðW i;kjk�1 � ww�
k ÞðDi;kjk�1 � ddkÞT ; ð7:85Þ
Kk ¼ Pwk dkP�1~ddk~ddk; ð7:86Þ
wwk ¼ ww�k þKkðdk � ddkÞ; ð7:87Þ
Pwk¼ P�
wk�KkP ~ddk
~ddkK
Tk ; ð7:88Þ
where g ¼ffiffiffiffiffiffiffiffiffiffiffiL þ l
p; l is the composite scaling parameter, L is the dimension of
the state, Rr is the process-noise covariance, Re is the measurement-noise
covariance, and Wi are the weights as calculated in Eq. (7.34).
242 7 THE UNSCENTED KALMAN FILTER

sets that are prone to overfitting (exact specification of the level of
regularization requires further study).
Note that the complexity of the UKF algorithm is still of order L3 (L is
the number of parameters), owing to the need to compute a matrix square
root at each time step. An order L2 complexity (same as the EKF) can be
achieved by using a recursive square-root formulation as given in
Appendix B.
7.4.1 Parameter Estimation Examples
We have performed a number of experiments to illustrate the performance
of the UKF parameter-estimation approach. The first set of experiments
corresponds to benchmark problems for neural network training, and serve
to illustrate some of the differences between the EKF and UKF, as well as
the different options discussed above. Two parametric optimization
problems are also included, corresponding to model estimation of the
double pendulum, and the benchmark ‘‘Rosenbrock’s Banana’’ optimiza-
tion problem.
Benchmark NN Regression and Time-Series Problems The
Mackay robot-arm dataset [24, 25] and the Ikeda chaotic time series
[26] are used as benchmark problems to compare neural network training.
Figure 7.8 illustrates the differences in learning curves for the EKF versus
UKF (option 1). Note the slightly lower final MSE performance of the
UKF weight training. If option 2 for the UKF output is used (see Eq.
(7.82), then the learning curves for the EKF and UKF are indistinguish-
able; this has been found to be consistent with all experiments; therefore,
we shall not show explicit learning curves for the UKF with option 2.
Figure 7.9 illustrates performance differences based on the choice of
processing noise covariance Rrk . The Mackey–Glass and Ikeda time series
are used. The plots show only comparisons for the UKF (differences are
similar for the EKF). In general, the Robbins–Monro method is the most
robust approach, with the fastest rate of convergence. In some examples,
we have seen faster convergence with the ‘‘annealed’’ approach; however,
this also requires additional insight and heuristic methods to monitor the
learning. We should reiterate that the ‘‘fixed’’ and ‘‘lambda’’ approaches
are more appropriate for on-line tracking problems.
Four-Regions Classification In the next example, we consider a
benchmark pattern classification problem having four interlocking regions
7.4 UKF PARAMETER ESTIMATION 243

[8]. A three-layer feedforward network (MLP) with 2-10-10-4 nodes is
trained using inputs randomly drawn within the pattern space, S ¼
½�1;�1� � ½1; 1�, with the desired output value of þ0:8 if the pattern
fell within the assigned region and �0:8 otherwise. Figure 7.10 illustrates
the classification task, learning curves for the UKF and EKF, and the final
classification regions. For the learning curve, each epoch represents 100
randomly drawn input samples. The test set evaluated on each epoch
corresponds to a uniform grid of 10,000 points. Again, we see the superior
performance of the UKF.
Double Inverted Pendulum Returning to the double inverted pen-
dulum (Section 7.3.1), we consider learning the system parameters,
w ¼ ½l1; l2;m1;m2;M �. These parameter values are treated as unknown
(all initialized to 1.0). The full state, x ¼ ½x; _xx; y1;_yy1; y2;
_yy2�, is observed.
Figure 7.8 (a) MacKay robot-arm problem: comparison of learning curvesfor the EKF and UKF training, 2-12-2 MLP, annealing noise estimation. (b)Ikeda chaotic time series: comparison of learning curves for the EKF and UKFtraining, 10-7-1 MLP, Robbins–Monro noise estimation.
244 7 THE UNSCENTED KALMAN FILTER

Figure 7.11 shows the total model MSE versus iteration comparing EKF
with UKF. Each iteration represents a pendulum crash with different initial
conditions for the state (no control is applied). The final converged
parameter estimates are as follows:
l1 l2 m1 m2 M
True model 0.50 0.75 0.75 0.50 1.50
UKF estimate 0.50 0.75 0.75 0.50 1.49
EKF estimate 0.50 0.75 0.68 0.45 1.35
In this case, the EKF has converged to a biased solution, possibly
corresponding to a local minimum in the error surface.
2 4 6 8 10 12 14 16 18 20
10-1
100
Epochs
Trai
ning
set
err
or :
MS
E fixedlambdaannealRobbins-Monro
2 4 6 8 10 12 14 16 18 2010
-4
10-2
100
Epochs
Trai
ning
set
err
or :
MS
E fixedlambdaannealRobbins-Monro
( )a
( )b
Figure 7.9 Neural network parameter estimation using different methodsfor noise estimation. (a) Ikeda chaotic time series. (b) Mackey–Glass chao-tic time series. (UKF settings: a ¼ 10�4, b ¼ 2, k ¼ 3 � L, where L is the statedimension.)
7.4 UKF PARAMETER ESTIMATION 245

Figure 7.10 Singhal and Wu’s four-region classification problem. (a) Truemapping. (b) Learning curves on the test set. (c) NN classification: EKF-trained. (d ) NN classification: UKF-trained. (UKF settings: a ¼ 10�4, b ¼ 2,k ¼ 3 � L, where L is the state dimension; 2-10-10-4 MLP; Robbins–Monro;1 epoch ¼ 100 random examples.)
5 10 15 20 25 30 35 4010
-5
100
Iteration
Mod
el M
SE
EKFUKF
Figure 7.11 Inverted double pendulum parameter estimation. (UKFsettings: a ¼ 10�4, b ¼ 2, k ¼ 3 � L, where L is the state dimension; Robbins–Monro.)
246 7 THE UNSCENTED KALMAN FILTER

Rosenbrock’s Banana Function For the last parameter estimation
example, we turn to a pure optimization problem. The Banana function
[27] can be thought of as a two-dimensional surface with a saddle-like
curvature that bends around the origin. Specifically, we wish to find the
values of x1 and x2 that minimize the function
f ðx1; x2Þ ¼ 100ðx2 � x21Þ
2þ ð1 � x1Þ
2: ð7:91Þ
The true minimum is at x1 ¼ 1 and x2 ¼ 1. The Banana function is a well-
known test problem used to compare the convergence rates of competing
minimization techniques.
In order to use the UKF or EKF, the basic parameter estimation
equations need to be reformulated to minimize a non-MSE cost function.
To do this we write the state-space equations in observed error form [28]:
wk ¼ wk�1 þ rk; ð7:92Þ
0 ¼ � k þ ek; ð7:93Þ
where the target ‘‘observation’’ is fixed at zero, and k is an error term
resulting in the optimization of the sum of instantaneous costs Jk ¼Tk k .
The MSE cost is optimized by setting k ¼ dk � Gðxk;wkÞ. However,
arbitrary costs (e.g., cross-entropy) can also be minimized simply by
specifying k appropriately. Further discussion of this approach has been
given in Chapter 5. Reformulation of the UKF equations requires chan-
ging only the effective output to k , and setting the desired response to
zero.
For the example at hand, we set k ¼ ½10ðx2 � x1Þ 1 � x1�T . Further-
more, since this optimization problem is a special case of ‘‘noiseless’’
parameter estimation where the actual error can be minimized to zero, we
make use of Eq. (7.89) (option 2) to calculate the output of the UKF
algorithm. This will allow the UKF to reach the true minimum of the error
surface more rapidly.9 We also set the scaling parameter a to a small value,
which we have found to be appropriate again for zero MSE problems.
Under these circumstances, the performances of the UKF and EKF are
indistinguishable, as illustrated in Figure 7.12. Overall, the performances
9Note that the use of option 1, where the expected value of the function is used as the
output, essentially involves averaging of the output based on the current parameter
covariance. This shows convergence in the case where zero MSE is possible, since
convergence of the state covariance to zero would also be necessary through proper
annealing of the state noise innovations Rr.
7.4 UKF PARAMETER ESTIMATION 247

of the two filters are comparable or superior to those of a number of
alternative optimization approaches (e.g., Davidson–Fletcher–Powell,
Levenburg–Marquardt, etc. See ‘‘optdemo’’ in Matlab). The main purpose
of this example was to illustrate the versatility of the UKF to general
optimization problems.
7.5 UKF DUAL ESTIMATION
Recall that the dual estimation problem consists of simultaneously
estimating the clean state xk and the model parameters w from the
noisy data yk (see Eq. (7.7)). A number of algorithmic approaches exist
for this problem, including joint and dual EKF methods (recursive
prediction error and maximum-likelihood versions), and expectation–
maximization (EM) approaches. A thorough coverage of these algorithms
1 2 3 4 5 6 710
-40
10-20
100
1020
k
fX(
)
Function Value
EKFUKF
1 2 3 4 5 6 710
-40
10-20
100
1020
k
MS
E
EKFUKF
( )a
( )b
Figure 7.12 Rosenbrock’s ‘‘Banana’’ optimization problem. (a) Functionvalue. (b) Model error. (UKF settings: a ¼ 10�4, b ¼ 2, k ¼ 3 � L, where L isthe state dimension; Fixed.)
248 7 THE UNSCENTED KALMAN FILTER

is given in Chapters 5 and 6. In this section, we present results for the dual
UKF (prediction error) and joint UKF methods.
In the dual extended Kalman filter [29], a separate state-space repre-
sentation is used for the signal and the weights. Two EKFs are run
simultaneously for signal and weight estimation. At every time step, the
current estimate of the weights is used in the signal filter, and the current
estimate of the signal state is used in the weight filter. In the dual UKF
algorithm, both state and weight estimation are done with the UKF.
In the joint extended Kalman filter [30], the signal-state and weight
vectors are concatenated into a single, joint state vector: ½xTk wT
k �T .
Estimation is done recursively by writing the state-space equations for
the joint state as
xkþ1
wkþ1
� �¼
Fðxk;uk;wkÞ
Iwk
� �þ
Bvk
rk
� �: ð7:94Þ
yk ¼ ½1 0 . . . 0�xk
wk
� �þ nk; ð7:95Þ
and running an EKF on the joint state space to produce simultaneous
estimates of the states xk and w. Again, our approach is to use the UKF
instead of the EKF.
7.5.1 Dual Estimation Experiments
Noisy Time-Series We present results on two time-series to provide a
clear illustration of the use of the UKF over the EKF. The first series is
again the Mackey–Glass-30 chaotic series with additive noise
(SNR 3 dB). The second time series (also chaotic) comes from an
autoregressive neural network with random weights driven by Gaussian
process noise and also corrupted by additive white Gaussian noise
(SNR 3 dB). A standard 6-10-1 MLP with tanh hidden activation
functions and a linear output layer was used for all the filters in the
Mackey–Glass problem. A 5-3-1 MLP was used for the second problem.
The process- and measurement-noise variances associated with the state
were assumed to be known. Note that, in contrast to the state estimation
example in the previous section, only the noisy time series is observed. A
clean reference is never provided for training.
Example training curves for the different dual and joint Kalman-based
estimation methods are shown in Figure 7.13. A final estimate for the
Mackey–Glass series is also shown for the dual UKF. The superior
performance of the UKF-based algorithms is clear.
7.5 UKF DUAL ESTIMATION 249

0 5 10 15 20 25 300.2
0.25
0.3
0.35
0.4
0.45
0.5
0.55
Epoch
Nor
mal
ized
MS
E
Dual UKFDual EKFJoint UKFJoint EKF
( )a
5 10 15 20 25 30 35 40 45 50 55 600
0.1
0.2
0.3
0.4
0.5
0.6
0.7
Epoch
Nor
mal
ized
MS
E
Dual EKFDual UKFJoint EKFJoint UKF
( )b
200 210 220 230 240 250 260 270 280 290 300-5
0
5
k
xk()
cleannoisyDual UKF
( )c
Figure 7.13 Comparative learning curves and results for the dual estima-tion experiments. Curves are averaged over 10 and 3 runs, respectively,using different initial weights. ‘‘Fixed’’ innovation covariances are used inthe joint algorithms. ‘‘Annealed’’ covariances are used for the weight filterin the dual algorithms. (a) Chaotic AR neural network. (b) Mackey–Glasschaotic time series. (c) Estimation of Mackey–Glass time series: dual UKF.
250 7 THE UNSCENTED KALMAN FILTER

Mode Estimation This example illustrates the use of the joint UKF for
estimating the modes of a mass-and-spring system (see Fig. 7.14). This
work was performed at the University of Washington by Mark Campbell
and Shelby Brunke. While the system is linear, direct estimation of the
natural frequencies o1 and o2 jointly with the states is a nonlinear
estimation problem. Figure 7.15 compares the performance of the EKF
and UKF. Note that the EKF does not converge to the true value for o2.
For this experiment, the input process noise SNR is approximately 100 dB,
and the measured positions y1 and y2 have additive noise at a 60 dB SNR
(these settings effectively turn the task into a pure parameter-estimation
Figure 7.14 Mass-and-spring system.
Figure 7.15 Linear mode prediction.
7.5 UKF DUAL ESTIMATION 251

problem). A fixed innovations Rr was used for the parameter estimation in
the joint algorithms. Sampling was done at the Nyquist rate (based on o2),
which emphasizes the effect of linearization in the EKF. For faster
sampling rates, the performance of the EKF and UKF become more
similar.
F15 Flight Simulation In this example (also performed at the Univer-
sity of Washington), joint estimation is done on an F15 aircraft model
[31]. The simulation includes vehicle nonlinear dynamics, and engine and
sensor noise modeling, as well as atmospheric modeling (densities,
pressure, etc.) based on look-up tables. Also incorporated are aerodynamic
forces based on data from Wright Patterson AFB. A closed-loop system
using a gain-scheduled TECS controller is used to control the model [32].
A simulated mission was used to test the UKF estimator, and involved a
quick descent, short tactical run, 180� turn, and ascent, with a possible
failure in the stabilitator (horizontal control surface on the tail of the
aircraft). Measurements consisted of the states with additive noise (20 dB
SNR). Turbulence was approximately 1 m=s RMS. During the mission, the
joint UKF estimated the 12 states (positions, orientations, and their
derivatives) as well as parameters corresponding to aerodynamic forces
and moments. This was done ‘‘off-line’’; that is, the estimated states were
not used within the control loop. Illustrative results are shown in Figure
7.16 for estimation of the altitude, velocity, and lift parameter (overall lift
force on the aircraft). The left column shows the mission without a failure.
The right column includes a 50% stabilitator failure at 65 seconds. Note
that even with this failure, the UKF is still capable of tracking the state and
parameters. It should be pointed out that the ‘‘black-box’’ nature of the
simulator was not conducive to taking Jacobians necessary for running the
EKF. Hence, implementation of the EKF for comparison was not
performed.
Double Inverted Pendulum For the final dual estimation example,
we again consider the double inverted pendulum, but this time we estimate
both the states and system parameters using the joint UKF. Observations
correspond to noisy measurements of the six states. Estimated states are
then fed back for closed-loop control. In addition, parameter estimates are
used at every time step to design the controller using the SDRE approach.
Figure 7.17 illustrates performance of this adaptive control system by
showing the evolution of the estimated and actual states. At the start of the
simulation, both the states and parameters are unknown (the control
system is unstable at this point). However, within one trial, the UKF
252 7 THE UNSCENTED KALMAN FILTER

enables convergence and stabilization of the pendulum without a single
crash.
7.6 THE UNSCENTED PARTICLE FILTER
The particle filter is a sequential Monte Carlo method that allows for a
complete representation of the state distribution using sequential impor-
tance sampling and resampling [33–35]. Whereas the standard EKF and
UKF make a Gaussian assumption to simplify the optimal recursive
Bayesian estimation (see Section 7.2), particle filters make no assumptions
on the form of the probability densities in question; that is, they employ
full nonlinear, non-Gaussian estimation. In this section, we present a
method that utilizes the UKF to augment and improve the standard particle
filter, specifically through generation of the importance proposal distribu-
tion. This chapter will review the background fundamentals necessary to
introduce particle filtering, and the extension based on the UKF. The
Figure 7.16 F15 model joint estimation (note that the estimated and truevalues of the state are indistinguishable at this resolution).
7.6 THE UNSCENTED PARTICLE FILTER 253

material is based on work done by van der Merwe, de Freitas, Doucet, and
Wan in [6], which also provides a more thorough review and treatment of
particle filters in general.
Monte Carlo Simulation and Sequential Importance SamplingParticle filtering is based on Monte Carlo simulation with sequential
importance sampling (SIS). The overall goal is to directly implement
optimal Bayesian estimation (see Eqs. (7.9)–(7.11)) by recursively approx-
imating the complete posterior state density. In Monte Carlo simulation, a
set of weighted particles (samples), drawn from the posterior distribution,
is used to map integrals to discrete sums. More precisely, the posterior
filtering density can be approximated by the following empirical estimate:
ppðxk jYk0Þ ¼
1
N
PNi¼1
dðxk � XXðiÞk Þ;
Figure 7.17 Double Inverted Pendulum joint estimation. Estimated states(a) and parameters (b). Only y1 and y2 are plotted (in radians).
254 7 THE UNSCENTED KALMAN FILTER

where the random samples fXXðiÞk ; i ¼ 1; . . . ;Ng, are drawn from pðxk jY
k0Þ
and dð�Þ denotes the Dirac delta function. The posterior filtering density
pðxk jYk0Þ is a marginal of the full posterior density given by pðXk
0jYk0Þ.
Consequently, any expectations of the form
EðgðxkÞÞ ¼
ðgðxkÞpðxk jY
k0Þ dxk ð7:96Þ
may be approximated by the following estimate:
EðgðxkÞÞ 1
N
PNi¼1
gðXXðiÞk Þ: ð7:97Þ
For example, letting gðxÞ ¼ x yields the optimal MMSE estimate
xxk ¼ E½xk jYk0�. The particles XX
ðiÞk are assumed to be independent and
identically distributed (i.i.d) for the approximation to hold. As N goes
to infinity, the estimate converges to the true expectation almost surely.
Sampling from the filtering posterior is only a special case of Monte Carlo
simulation, which in general deals with the complete posterior density
pðXk0jY
k0Þ. We shall use this more general form to derive the particle filter
algorithm.
It is often impossible to sample directly from the posterior density
function. However, we can circumvent this difficulty by making use of
importance sampling and alternatively sampling from a known proposal
distribution qðXk0jY
k0Þ. The exact form of this distribution is a critical
design issue, and is usually chosen in order to facilitate easy sampling.
The details of this are discussed later. Given this proposal distribution, we
can make use of the following substitution:
EðgkðXk0ÞÞ ¼
ðgkðX
k0Þ
pðXk0jY
k0Þ
qðXk0jY
k0Þ
qðXk0jY
k0Þ dXk
0
¼
ðgkðX
k0Þ
pðYk0jX
k0ÞpðX
k0Þ
pðYk0ÞqðX
k0jY
k0Þ
qðXk0jY
k0Þ dXk
0
¼
ðgkðX
k0Þ
wkðXk0Þ
pðYk0Þ
qðXk0jY
k0Þ dXk
0;
where the variables wkðXk0Þ are known as the unnormalized importance
weights,
wk ¼pðYk
0jXk0ÞpðX
k0Þ
qðXk0jY
k0Þ
: ð7:98Þ
7.6 THE UNSCENTED PARTICLE FILTER 255

We can get rid of the unknown normalizing density pðYk0Þ as follows:
EðgkðXk0ÞÞ ¼
1
pðYk0Þ
ðgkðX
k0ÞwkðX
k0ÞqðX
k0jY
k0Þ dXk
0
¼
ÐgkðX
k0ÞwkðX
k0ÞqðX
k0jY
k0Þ dXk
0ÐpðYk
0jXk0ÞpðX
k0Þ
qðXk0jY
k0Þ
qðXk0jY
k0Þ
dXk0
¼
ÐgkðX
k0ÞwkðX
k0ÞqðX
k0jY
k0Þ dXk
0ÐwkðX
k0ÞqðX
k0jY
k0Þ dXk
0
¼Eqð�jYk
0ÞðwkðX
k0ÞgkðX
k0ÞÞ
Eqð�jYk0ÞðwkðX
k0ÞÞ
;
where the notation Eqð�jYk0Þ
has been used to emphasize that the expecta-
tions are taken over the proposal distribution qð�jYk0Þ.
A sequential update to the importance weights is achieved by expand-
ing the proposal distribution as qðXk0jY
k0Þ ¼ qðXk�1
0 jYk�10 Þqðxk jX
k�10 , Yk
0Þ,
where we are making the assumption that the current state is not
dependent on future observations. Furthermore, under the assumption
that the states correspond to a Markov process and that the observations
are conditionally independent given the states, we can arrive at the
recursive update:
wk ¼ wk�1
pðyk jxkÞpðxk jxk�1Þ
qðxk jXk�10 ;Yk
0Þ: ð7:99Þ
Equation (7.99) provides a mechanism to sequentially update the impor-
tance weights given an appropriate choice of proposal distribution,
qðxk jXk�10 , Yk
0Þ. Since we can sample from the proposal distribution and
evalute the likelihood pðyk jxkÞ and transition probabilities pðxk jxk�1Þ; all
we need to do is generate a prior set of samples and iteratively compute
the importance weights. This procedure then allows us to evaluate the
expectations of interest by the following estimate:
EðgðXk0ÞÞ
N�1PNi¼1
gðXXðiÞ0:kÞwkðXX
ðiÞ0:kÞ
N�1PNi¼1
wkðXXðiÞ0:kÞ
¼PNi¼1
gðXXðiÞ0:kÞ ~wwkðXX
ðiÞ0:kÞ; ð7:100Þ
256 7 THE UNSCENTED KALMAN FILTER

where the normalized importance weights ~wwðiÞk ¼ w
ðiÞk =PN
j¼1 wðjÞk and XX
ðiÞ0:k
denotes the ith sample trajectory drawn from the proposal distribution
qðxk jXk�10 , Yk
0Þ. This estimate asymptotically converges if the expectation
and variance of gðXk0Þ and wk exist and are bounded, and if the support of
the proposal distribution includes the support of the posterior distribution.
Thus, as N tends to infinity, the posterior density function can be
approximated arbitrarily well by the point-mass estimate
ppðXk0jY
k0Þ ¼
PNi¼1
~wwðiÞk dðXk
0 � XXðiÞ0:kÞ ð7:101Þ
and the posterior filtering density by
ppðxk jYk0Þ ¼
PNi¼1
~wwðiÞk dðxk � XX
ðiÞk Þ: ð7:102Þ
In the case of filtering, we do not need to keep the whole history of the
sample trajectories, in that only the current set of samples at time k is
needed to calculate expectations of the form given in Eq. (7.96) and
(7.97). To do this, we simply set, gðXk0Þ ¼ gðxkÞ. These point-mass
estimates can approximate any general distribution arbitrarily well, limited
only by the number of particles used and how well the above-mentioned
importance sampling conditions are met. In contrast, the posterior distri-
bution calculated by the EKF is a minimum-variance Gaussian approx-
imation to the true distribution, which inherently cannot capture complex
structure such as multimodalities, skewness, or other higher-order
moments.
Resampling and MCMC Step The sequential importance sampling
(SIS) algorithm discussed so far has a serious limitation: the variance of
the importance weights increases stochastically over time. Typically, after
a few iterations, one of the normalized importance weights tends to unity,
while the remaining weights tend to zero. A large number of samples are
thus effectively removed from the sample set because their importance
weights become numerically insignificant. To avoid this degeneracy, a
resampling or selection stage may be used to eliminate samples with low
importance weights and multiply samples with high importance weights.
This is often followed by a Markov-chain Monte Carlo (MCMC) move
step, which introduces sample variety without affecting the posterior
distribution they represent.
7.6 THE UNSCENTED PARTICLE FILTER 257

A selection scheme associates to each particle XXðiÞk a number of
‘‘children,’’ Ni, such thatPN
i¼1 Ni ¼ N . Several selection schemes have
been proposed in the literature, including sampling-importance resam-
pling ðSIRÞ [36–38], residual resampling [25, 39], and minimum-variance
sampling [34].
Sampling-importance resampling (SIR) involves mapping the Dirac
random measure fXXðiÞk , ~ww
ðiÞk g into an equally weighted random measure
fXXðjÞk , N�1g. In other words, we produce N new samples all with weighting
1=N . This can be accomplished by sampling uniformly from the discrete
set fXXðiÞk ; i ¼ 1; . . . ;Ng with probabilities f ~ww
ðiÞk ; i ¼ 1; . . . ;Ng. Figure 7.18
gives a graphical representation of this process. This procedure effectively
replicates the original XXðiÞk particle Ni times ðNi may be zero).
In residual resampling [25, 39] a two-step process is used, which makes
use of SIR. In the first step, the number of children are deterministicly set
using the floor function, NAi ¼ bN ~ww
ðiÞt c. Each XX
ðiÞk particle is replicated NA
i
times. In the second step, SIR is used to select the remaining�NNt ¼ N �
PNi¼1 NA
i samples, with new weights w0ðiÞt ¼ �NN�1
t ð ~wwðiÞt N � NA
i Þ.
These samples form a second set NBi , such that �NNt ¼
PNi¼1 NB
i , and are
drawn as described previously. The total number of children of each
particle is then set to Ni ¼ NAi þ NB
i . This procedure is computationally
cheaper than pure SIR, and also has lower sample variance. Thus, residual
resampling is used for all experiments in Section 7.6.2 (in general, we
have found that the specific choice of resampling scheme does not
significantly affect the performance of the particle filter).
After the selection=resampling step at time k, we obtain N particles
distributed approximately according to the posterior distribution. Since the
selection step favors the creation of multiple copies of the ‘‘fittest’’
Figure 7.18 Resampling process, whereby a random measure fxðiÞk , ~wwðiÞk g is
mapped into an equally weighted random measure fxðjÞk , N�1g. The index i isdrawn from a uniform distribution.
258 7 THE UNSCENTED KALMAN FILTER

particle, many particles may end up having no children ðNi ¼ 0Þ, whereas
others might end up having a large number of children, the extreme case
being Ni ¼ N for a particular value i. In this case, there is a severe
depletion of samples. Therefore, an additional procedure is often required
to introduce sample variety after the selection step without affecting the
validity of the approximation inferred. This is achieved by performing a
single MCMC step on each particle. The basic idea is that if the particles
are already distributed according to the posterior pðxk jYk0Þ (which is the
case), then applying a Markov-chain transition kernel with the same
invariant distribution to each particle results in a set of new particles
distributed according to the posterior of interest. However, the new
particles may move to more interesting areas of the state space. Details
of the MCMC step are given in [6]. For our experiments in Section 7.6.2,
we found an MCMC step to be unnecessary. However, this cannot be
assumed in general.
7.6.1 The Particle Filter Algorithm
The pseudo-code of a generic particle filter is presented in Table 7.6. In
implementing this algorithm, the choice of the proposal distribution
qðxk jXk�10 , Yk
0Þ is the most critical design issue. The optimal proposal
distribution (which minimizes the variance on the importance weights) is
given by [40–43]
qðxk jXk�10 ;Yk
0Þ ¼ pðxk jXk�10 ;Yk
0Þ; ð7:103Þ
that is, the true conditional state density given the previous state history
and all observations. Sampling from this is, of course, impractical for
arbitrary densities (recall the motivation for using importance sampling in
the first place). Consequently, the transition prior is the most popular
choice of proposal distribution [35, 44–47]:10
qðxk jXk�10 ;Yk
0޼�
pðxk jxk�1Þ: ð7:104Þ
For example, if an additive Gaussian process noise model is used, the
transition prior is simply
pðxk jxk�1Þ ¼ nðFð�xxk�1; 0Þ;Rvk�1Þ: ð7:105Þ
10The notation ¼�
denotes ‘‘chosen as,’’ to indicate a subtle difference versus ‘‘approxima-
tion’’.
7.6 THE UNSCENTED PARTICLE FILTER 259

The effectiveness of this approximation depends on how close the
proposal distribution is to the true posterior distribution. If there is not
sufficient overlap, only a few particles will have significant importance
weights when their likelihood are evaluated.
The EKF and UKF Particle Filter An improvement in the choice of
proposal distribution over the simple transition prior, which also address
the problem of sample depletion, can be accomplished by moving the
Table 7.6 Algorithm for the generic particle filter
1. Initialization: k ¼ 0
� For i ¼ 1; . . . ;N, draw the states XXðiÞ0 from the prior pðx0Þ.
2. For k ¼ 1; 2; . . .(a) Importance sampling step
� For i ¼ 1; . . . ;N, sample XXðiÞk � qðxk jx
ðiÞ0:k�1, Yk
0).
� For i ¼ 1; . . . ;N, evaluate the importance weights up to a
normalizing constant:
wðiÞk ¼ w
ðiÞk�1
pðyk jXXðiÞk ÞpðXX
ðiÞk jXX
ðiÞk�1Þ
qðXXðiÞk jXX
ðiÞ0:k�1;Yk
0Þ: ð7:106Þ
� For i ¼ 1; . . . ;N, normalize the importance weights:
~wwðiÞk ¼ w
ðiÞk
PNj¼1
wðjÞk
!�1
:
(b) Selection step ðresamplingÞ
� Multiply=suppress samples XXðiÞk with high=low importance weights
~wwðiÞk , respectively, to obtain N random samples XX
ðiÞk approximately
distributed according to pðxðiÞk jY
k0Þ.
� For i ¼ 1; . . . ;N, set wðiÞk ¼ ~ww
ðiÞk ¼ N�1.
(c) MCMC move step ðoptionalÞ
(d) Output: The output of the algorithm is a set of samples that can be used to
approximate the posterior distribution as follows:
ppðxk jYk0Þ ¼
1
N
PNi¼1
dðxk � XXðiÞk Þ:
The optimal MMSE estimator is given as
xxk ¼ Eðxk jYk0Þ
1
N
PNi¼1
XXðiÞk :
Similar expectations of the function gðxkÞ can also be calculated as a
sample average.
260 7 THE UNSCENTED KALMAN FILTER

particles towards the regions of high likelihood, based on the most recent
observations yk (see Fig. 7.19). An effective approach to accomplish this,
is to use an EKF generated Gaussian approximation to the optimal
proposal, that is,
qðxk jXk�10 ;Yk
0޼�
qnðxk jYk0Þ; ð7:107Þ
which is accomplished by using a separate EKF to generate and propagate
a Gaussian proposal distribution for each particle,
qnðxðiÞk jY
k0Þ ¼ nð�xx
ðiÞk ;P
ðiÞk Þ; i ¼ 1; . . . ;N : ð7:108Þ
That is, at time k one uses the EKF equations, with the new data, to
compute the mean and covariance of the importance distribution for each
particle from the previous time step k � 1. Next, we redraw the ith particle
(at time k) from this new updated distribution. While still making a
Gaussian assumption, the approach provides a better approximation to the
optimal conditional proposal distribution and has been shown to improve
performance on a number of applications [33, 48].
By replacing the EKF with the UKF, we can more accurately propagate
the mean and covariance of the Gaussian approximation to the state
distribution. Distributions generated by the UKF will have a greater
support overlap with the true posterior distribution than the overlap
achieved by the EKF estimates. In addition, scaling parameters used for
sigma-point selection can be optimised to capture certain characteristic of
the prior distribution if known; e.g. the algorithm can be modified to work
with distributions that have heavier tails than Gaussian distributions such
as Cauchy or Student-t distributions. The new filter that results from using
a UKF for proposal distribution generation within a particle filter frame-
work is called the unscented particle filter (UPF). Referring to the
Figure 7.19 Including the most current observation into the proposaldistribution, allows us to move the samples in the prior to regions of highlikelihood. This is of paramount importance if the likelihood happens to lie inone of the tails of the prior distribution, or if it is too narrow (low measure-ment error).
7.6 THE UNSCENTED PARTICLE FILTER 261

algorithm in Table 7.6 for the generic particle filter, the first item in the
importance sampling step,
� For i ¼ 1; . . . ;N, sample XXðiÞk � qðxk jx
ðiÞ0:k�1, Yk
0),
is replaced with the following UKF update:
� For i ¼ 1; . . . ;N :
– Update the prior ðk � 1Þ distribution for each particle with the
UKF:
� Calculate sigma points:
XXðiÞak�1 ¼ ½ �XXX
ðiÞak�1
�XXXðiÞak�1 þ g
ffiffiffiffiffiffiffiffiffiffiPðiÞak�1
q�XXXðiÞak�1 � g
ffiffiffiffiffiffiffiffiffiffiPðiÞak�1
q�: ð7:109Þ
� Propagate particle into future (time update):
XXðiÞxkjk�1 ¼ FðXX
ðiÞxk�1; uk;XX
ðiÞvk�1Þ; �XXX
ðiÞkjk�1 ¼
P2L
j¼0
WðmÞj X
ðiÞxj;kjk�1;
ð7:110Þ
PðiÞkjk�1 ¼
P2L
j¼0
WðcÞj ðX
ðiÞxj;kjk�1 � �XXX
ðiÞkjk�1ÞðX
ðiÞxj;kjk�1 � �XXX
ðiÞkjk�1Þ
T
ð7:111Þ
YYðiÞkjk�1 ¼ HðXX
ðiÞxkjk�1;XX
ðiÞnk�1Þ;
�yyðiÞkjk�1 ¼
P2L
j¼0
WðmÞj Y
ðiÞj;kjk�1: ð7:112Þ
� Incorporate new observation (measurement update):
P~yyk ~yyk¼P2L
j¼0
WðcÞj ðY
ðiÞj;kjk�1 � �yy
ðiÞkjk�1ÞðY
ðiÞj;kjk�1 � �yy
ðiÞkjk�1Þ
T ;
ð7:113Þ
Pxk yk¼P2L
J¼0
WðcÞj ðX
ðiÞj;kjk�1 � �XXX
ðiÞkjk�1ÞðY
ðiÞj;kjk�1 � �yy
ðiÞkjk�1Þ
T ;
ð7:114Þ
Kk ¼ Pxk ykP�1~yyk ~yyk
;
�XXXðiÞk ¼ �XXX
ðiÞkjk�1 þ Kkðyk � �yy
ðiÞkjk�1Þ; ð7:115Þ
PðiÞk ¼ P
ðiÞkjk�1 � KkP~yyk ~yyk
KTk : ð7:116Þ
– Sample XXðiÞk � qðx
ðiÞk jx
ðiÞ0:k�1, Yk
0Þ nð �XXXðiÞk , P
ðiÞk Þ.
All other steps in the particle filter formulation remain unchanged.
262 7 THE UNSCENTED KALMAN FILTER
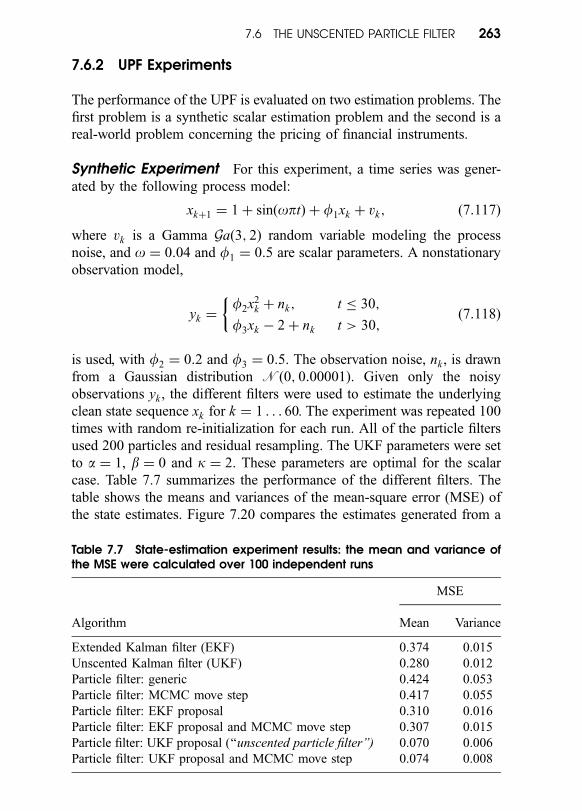
7.6.2 UPF Experiments
The performance of the UPF is evaluated on two estimation problems. The
first problem is a synthetic scalar estimation problem and the second is a
real-world problem concerning the pricing of financial instruments.
Synthetic Experiment For this experiment, a time series was gener-
ated by the following process model:
xkþ1 ¼ 1 þ sinðoptÞ þ f1xk þ vk; ð7:117Þ
where vk is a Gamma Gað3; 2Þ random variable modeling the process
noise, and o ¼ 0:04 and f1 ¼ 0:5 are scalar parameters. A nonstationary
observation model,
yk ¼f2x2
k þ nk; t � 30;
f3xk � 2 þ nk t > 30;
�ð7:118Þ
is used, with f2 ¼ 0:2 and f3 ¼ 0:5. The observation noise, nk , is drawn
from a Gaussian distribution nð0; 0:00001Þ. Given only the noisy
observations yk , the different filters were used to estimate the underlying
clean state sequence xk for k ¼ 1 . . . 60. The experiment was repeated 100
times with random re-initialization for each run. All of the particle filters
used 200 particles and residual resampling. The UKF parameters were set
to a ¼ 1, b ¼ 0 and k ¼ 2. These parameters are optimal for the scalar
case. Table 7.7 summarizes the performance of the different filters. The
table shows the means and variances of the mean-square error (MSE) of
the state estimates. Figure 7.20 compares the estimates generated from a
Table 7.7 State-estimation experiment results: the mean and variance ofthe MSE were calculated over 100 independent runs
MSE
Algorithm Mean Variance
Extended Kalman filter (EKF) 0.374 0.015
Unscented Kalman filter (UKF) 0.280 0.012
Particle filter: generic 0.424 0.053
Particle filter: MCMC move step 0.417 0.055
Particle filter: EKF proposal 0.310 0.016
Particle filter: EKF proposal and MCMC move step 0.307 0.015
Particle filter: UKF proposal (‘‘unscented particle filter’’) 0.070 0.006
Particle filter: UKF proposal and MCMC move step 0.074 0.008
7.6 THE UNSCENTED PARTICLE FILTER 263

single run of the different particle filters. The superior performance of the
unscented particle filter (UPF) is clear.
Pricing Financial Options Derivatives are financial instruments
whose value depends on some basic underlying cash product, such as
interest rates, equity indices, commodities, foreign exchange, or bonds
[49]. A call option allows the holder to buy a cash product, at a specified
date in the future, for a price determined in advance. The price at which
the option is exercised is known as the strike price, while the date in which
the option lapses is often referred to as the maturity time. Put options, on
the other hand, allow the holder to sell the underlying cash product. In
their seminal work [50], Black and Scholes derived the following industry
standard equations for pricing European call and put options:
C ¼ Sncðd1Þ � Xe�rtmncðd2Þ; ð7:119Þ
P ¼ �Sncð�d1Þ þ Xe�rtmncð�d2Þ; ð7:120Þ
0 10 20 30 40 50 601
2
3
4
5
6
7
8
9
Time
Ex
t[
()]
True xPF estimatePF-EKF estimatePF-UKF estimate
Figure 7.20 Plot of estimates generated by the different filters on thesynthetic state-estimation experiment.
264 7 THE UNSCENTED KALMAN FILTER

where C denotes the price of a call option, P the price of a put option, S
the current value of the underlying cash product, X the desired strike
price, tm the time to maturity, and ncð:Þ the cumulative normal distribu-
tion, and d1 and d2 are given by
d1 ¼lnðS=X Þ þ ðr þ s2=2Þtm
sffiffiffiffitm
p ;
d2 ¼ d1 � sffiffiffiffitm
p;
where s is the (unknown) volatility of the cash product and r is the risk-
free interest rate.
The volatility, s; is usually estimated from a small moving window of
data over the most recent 50–180 days [49]. The risk-free interest rate r is
often estimated by monitoring interest rates in the bond markets. Our
approach is to treat r and s as the hidden states, and C and P as the output
t
Figure 7.21 Probability smile for options on the FTSE-100 index (1994).Although the volatility smile indicates that the option with strike priceequal to 3225 is underpriced, the shape of the probability gives us awarning against the hypothesis that the option is under-priced. Posteriormean estimates were obtained with the Black–Scholes model and particlefilter (�), a fourth-order polynomial fit (�), and hypothesized volatility (�).
7.6 THE UNSCENTED PARTICLE FILTER 265

observations. S and tm are treated as known control signals (input
observations). This represents a parameter estimation problem, with the
nonlinear observation given by Eqs. (7.119) or (7.120). This allows us to
compute daily complete probability distributions for r and s and to decide
whether the current value of an option in the market is being either over-
priced or under-priced. See [51] and [52] for details.
As an example, Figure 7.21 shows the implied probability density
function of each volatility against several strike prices using five pairs of
call and put option contracts on the British FTSE-100 index (from
February 1994 to December 1994). Figure 7.22 shows the estimated
volatility and interest rate for a contract with a strike price of 3225. In
Table 7.8, we compare the one-step-ahead normalized square errors on a
pair of options with strike price 2925. The square errors were only
measured over the last 100 days of trading, so as to allow the algorithms
to converge. The experiment was repeated 100 times with 100 particles in
each particle filter (the mean value is reported; all variance were essen-
tially zero). In this example, both the EKF and UKF approaches to
improving the proposal distribution lead to a significant improvement
over the standard particle filters. The main advantage of the UKF over the
Figure 7.22 Estimated interest rate and volatility.
266 7 THE UNSCENTED KALMAN FILTER

EKF is the ease of implementation, which avoids the need to analytically
differentiate the Black–Scholes equations.
7.7 CONCLUSIONS
The EKF has been widely accepted as a standard tool in the control and
machine-learning communities. In this chapter, we have presented an
alternative to the EKF using the unscented Kalman filter. The UKF
addresses many of the approximation issues of the EKF, and consistently
achieves an equal or better level of performance at a comparable level of
complexity. The performance benefits of the UKF-based algorithms have
been demonstrated in a number of application domains, including state
estimation, dual estimation, and parameter estimation.
There are a number of clear advantages to the UKF. First, the mean and
covariance of the state estimate is calculated to second order or better, as
opposed to first order in the EKF. This provides for a more accurate
implementation of the optimal recursive estimation equations, which is the
basis for both the EKF and UKF. While equations specifying the UKF
may appear more complicated than the EKF, the actual computational
complexity is equivalent. For state estimation, both algorithms are in
Table 7.8 One-step-ahead normalized square errors over100 runs. The trivial prediction is obtained by assuming thatthe price on the following day corresponds to the currentprice
Option type Algorithm Mean NSE
Call Trivial 0.078
Extended Kalman filter (EKF) 0.037
Unscented Kalman filter (UKF) 0.037
Particle filter: generic 0.037
Particle filter: EKF proposal 0.009
Unscented particle filter 0.009
Put Trivial 0.035
Extended Kalman filter (EKF) 0.023
Unscented Kalman filter (UKF) 0.023
Particle filter: generic 0.023
Particle filter: EKF proposal 0.007
Unscented particle filter 0.008
7.7 CONCLUSIONS 267

general of order L3 (where L is the dimension of the state). For parameter
estimation, both algorithms are of order L2 (where L is the number of
parameters). An efficient recursive square-root implementation (see
Appendix B) was necessary to achieve the level of complexity in the
parameter-estimation case. Furthermore, a distinct advantage of the UKF
is its ease of implementation. In contrast to the EKF, no analytical
derivatives (Jacobians or Hessians) need to be calculated. The utility of
this is especially valuable in situations where the system is a ‘‘black box’’
model in which the internal dynamic equations are unavailable. In order to
apply an EKF to such systems, derivatives must be found either from a
principled analytical re-derivation of the system, or through costly and
often inaccurate numerical methods (e.g., by perturbation). In contrast, the
UKF relies on only functional evaluations (inputs and outputs) through the
use of deterministically drawn samples from the prior distribution of the
state random variable. From a coding perspective, this also allows for a
much more general and modular implementation.
Even though the UKF has clear advantages over the EKF, there are still
a number of limitations. As in the EKF, it makes a Gaussian assumption
on the probability density of the state random variable. Often this
assumption is valid, and numerous real-world applications have been
successfully implemented based on this assumption. However, for certain
problems (e.g., multimodal object tracking), a Gaussian assumption will
not suffice, and the UKF (or EKF) cannot be applied with confidence. In
such examples, one has to resort to more powerful, but also more
computationally expensive, filtering paradigms such as particle filters
(see Section 7.6). Finally, another implementation limitation leading to
some uncertainty, is the necessity to choose the three unscented transfor-
mation parameters (i.e., a; b, and k). While we have attempted to provide
some guidelines on how to choose these parameters, the optimal selection
clearly depends on the specifics of the problem at hand, and is not fully
understood. In general, the choice of settings does not appear critical for
state estimation, but has a greater affect on performance and convergence
properties for parameter estimation. Our current work focuses on addres-
sing this issue through developing a unified and adaptive way of
calculating the optimal value of these parameters. Other areas of open
research include utilizing the UKF for estimation of noise covariances,
extension of the UKF to recurrent architectures that may require dynamic
derivatives (see Chapter 2 and 5), and the use of the UKF and smoother in
the expectation–maximization algorithm (see Chapter 6). Clearly, we have
only begun to scratch the surface of the numerous applications that can
benefit with use of the UKF.
268 7 THE UNSCENTED KALMAN FILTER

APPENDIX A: ACCURACY OF THE UNSCENTEDTRANSFORMATION
In this appendix, we show how the unscented transformation achieves
second-order accuracy in the prediction of the posterior mean and
covariance of a random variable that undergoes a nonlinear transforma-
tion. For the purpose of this analysis, we assume that all nonlinear
transformations are analytic across the domain of all possible values of
x. This condition implies that the nonlinear function can be expressed as a
multidimensional Taylor series consisting of an arbitrary number of terms.
As the number of terms in the sum tend to infinity, the residual of the
series tends to zero. This implies that the series always converges to the
true value of the function.
If we consider the prior variable x as being perturbed about a mean �xx by
a zero-mean disturbance dx with covariance Px, then the Taylor series
expansion of the nonlinear transformation f ðxÞ about �xx is
f ðxÞ ¼ f ð�xx þ dxÞ ¼P1n¼0
ðdx � HxÞnf ðxÞ
n!
� �x¼�xx
: ð7:121Þ
If we define the operator Dndx f as
Dndx f ¼
D½ðdx � HxÞ
nf ðxÞ�x¼�xx; ð7:122Þ
then the Taylor series expansion of the nonlinear transformation y ¼ f ðxÞ
can be written as
y ¼ f ðxÞ ¼ f ð�xxÞ þ Ddx f þ1
2D2
dx f þ1
3!D3
dx f þ1
4!D4
dx f þ � � � : ð7:123Þ
Accuracy of the Mean
The true mean of y is given by
�yy ¼ E½y� ¼ E½ f ðxÞ� ð7:124Þ
¼ E f ð�xxÞ þ Ddx f þ1
2D2
dx f þ1
3!D3
dx f þ1
4!D3
dx f þ � � �
� �: ð7:125Þ
APPENDIX A 269

If we assume that x is a symmetrically distributed11 random variable, then
all odd moments will be zero. Also note that E½dx dxT � ¼ Px. Given this,
the mean can be reduced further to
�yy ¼ f ð�xxÞ þ1
2½ðHT PxHÞf ðxÞ�x¼�xx þ E
1
4!D4
dx f þ1
6!D6
dx f þ � � �
� �: ð7:126Þ
The UT calculates the posterior mean from the propagated sigma points
using Eq. (7.32). The sigma points are given by
X i ¼ �xx ! ðffiffiffiffiffiffiffiffiffiffiffiL þ l
pÞsi;
¼ �xx ! ~ssi
where si denotes the ith column12 of the matrix square root of Px. This
implies thatPL
i¼1ðsisTi Þ ¼ Px. Given this formulation of the sigma points,
we can again write the propagation of each point through the nonlinear
function as a Taylor series expansion about �xx:
Yi ¼ f ðX iÞ ¼ f ð�xxÞ þ D ~ssif þ
1
2D2
~ssif þ
1
3!D3
~ssif þ
1
4!D4
~ssif þ � � � :
Using Eq. (7.32), the UT predicted mean is
�yyUT ¼l
L þ lf ð�xxÞ þ
1
2ðL þ lÞP2L
i¼1
� f ð�xxÞ þ D ~ssif þ
1
2D2
~ssif þ
1
3!D3
~ssif þ
1
4!D4
~ssif þ � � �
� �
¼ f ð�xxÞ þ1
2ðL þ lÞP2L
i¼1
D ~ssif þ
1
2D2
~ssif þ
1
3!D3
~ssif þ
1
4!D4
~ssif þ � � �
� �:
Since the sigma points are symmetrically distributed around �xx, all the odd
moments are zero. This results in the simplification
�yyUT ¼ f ð�xxÞ þ1
2ðL þ lÞP2L
i¼1
1
2D2
~ssif þ
1
4!D4
~ssif þ
1
6!D6
~ssif þ � � �
� �;
11This includes probability distributions such as Gaussian, Student-t, etc.12See Section 7.3 for details of exactly how the sigma points are calculated.
270 7 THE UNSCENTED KALMAN FILTER

and since
1
2ðL þ lÞP2L
i¼1
1
2D2
~ssif ¼
1
2ðL þ lÞðHf Þ
T P2L
i¼1
ðffiffiffiffiffiffiffiffiffiffiffiL þ l
psis
Ti
ffiffiffiffiffiffiffiffiffiffiffiL þ l
pÞ
� �ðHf Þ
¼L þ l
2ðL þ lÞðHf Þ
T 1
2
P2L
i¼1
sisTi
� �ðHf Þ
¼1
2½ðHT PxHÞ f ðxÞ�x¼�xx;
the UT predicted mean can be further simplified to
�yyUT ¼ f ð�xxÞ þ1
2½ðHT PxHÞ f ðxÞ�x¼�xx
þ1
2ðL þ lÞP2L
i¼1
1
4!D4
~ssif þ
1
6!D6
~ssif þ � � �
� �: ð7:127Þ
When we compare Eqs. (7.127) and (7.126), we can clearly see that the
true posterior mean and the mean calculated by the UT agrees exactly to
the third order and that errors are only introduced in the first and higher-
order terms. The magnitudes of these errors depends on the choice of the
composite scaling parameter l as well as the higher-order derivatives of f .
In contrast, a linearization approach calculates the posterior mean as
�yyLIN ¼ f ð�xxÞ; ð7:128Þ
which only agrees with the true posterior mean up to the first order. Julier
and Uhlman [2] show that, on a term-by-term basis, the errors in the
higher-order terms of the UT are consistently smaller than those for
linearization.
Accuracy of the Covariance
The true posterior covariance is given by
Py ¼ E½ðy � �yyT Þðy � �yyT ÞT� ¼ E½yyT � � �yy�yyT ð7:129Þ
APPENDIX A 271

where the expectation is taken over the distribution of y. Substituting Eqs.
(7.123) and (7.125) into (7.129), and recalling that all odd moments of dx
are zero owing to symmetry, we can write the true posterior covariance as
Py ¼ AxPxATx ¼
1
4f½ðHT PxHÞf ðxÞ�½ðH
T PxHÞfðxÞ�Tgx¼x
þ EP1i¼1
P1j¼1
1
i!j!Di
dx f ðDj
dx f ÞT
" #|fflfflfflfflfflfflfflfflfflfflfflfflfflfflfflfflfflfflfflfflfflffl{zfflfflfflfflfflfflfflfflfflfflfflfflfflfflfflfflfflfflfflfflfflffl}
ij>1
�
�P1i¼1
P1j¼1
1
ð2iÞ!ð2jÞ!E½D2i
x f �E½D2jsx f �T �|fflfflfflfflfflfflfflfflfflfflfflfflfflfflfflfflfflfflfflfflfflfflfflfflfflfflfflfflfflffl{zfflfflfflfflfflfflfflfflfflfflfflfflfflfflfflfflfflfflfflfflfflfflfflfflfflfflfflfflfflffl}
ij>1
;
�ð7:130Þ
where Ax is the Jacobian matrix of f ðxÞ evaluated at �xx. It can be shown
(using a similar approach as for the posterior mean) that the posterior
covariance calculated by the UT is given by
ðPyÞUT ¼ AxPxATx �
1
4½ðHT PxHÞ f ðxÞ�½ðHT PxHÞ f ðxÞ�T� �
x¼�xx
þ1
2ðL þ lÞP2L
k¼1
P1i¼1
P1j¼1
1
i!j!Di
~sskf ðD
j~ssk
f ÞT
" #|fflfflfflfflfflfflfflfflfflfflfflfflfflfflfflfflfflfflfflfflfflfflffl{zfflfflfflfflfflfflfflfflfflfflfflfflfflfflfflfflfflfflfflfflfflfflffl}
ij>1
�P1i¼1
P1j¼1
1
ð2iÞ!ð2jÞ!4ðL þ lÞ2P2L
k¼1
P2L
m¼1
D2i~ssk
f ðD2j
~ssmf Þ
T
" #|fflfflfflfflfflfflfflfflfflfflfflfflfflfflfflfflfflfflfflfflfflfflfflfflfflfflfflfflfflfflfflfflfflfflfflfflfflfflfflfflfflfflfflfflffl{zfflfflfflfflfflfflfflfflfflfflfflfflfflfflfflfflfflfflfflfflfflfflfflfflfflfflfflfflfflfflfflfflfflfflfflfflfflfflfflfflfflfflfflfflffl}
ij>1
: ð7:131Þ
Comparing Eqs. (7.130) and (7.131), it is clear that the UT again
calculates the posterior covariance accurately to the first two terms, with
errors only introduced in the fourth- and higher-order moments. Julier and
Uhlmann [2] show how the absolute term-by-term errors of these higher-
order moments are again consistently smaller for the UT than for the
linearized case that truncates the Taylor series after the first term, that is,
ðPyÞLIN ¼ AxPxATx : ð7:132Þ
For this derivation, we have assumed the value of the b parameter in the
UT to be zero. If prior knowledge about the shape of the prior distribution
of x is known, b can be set to a non-zero value that minimizes the error in
272 7 THE UNSCENTED KALMAN FILTER

some of the higher ð# 4Þ order moments. Julier [53] shows how the error
in the kurtosis of the posterior distribution is minimized for a Gaussian x
when b ¼ 2.
APPENDIX B: EFFICIENT SQUARE-ROOT UKF IMPLEMENTATIONS
In the standard Kalman implementation, the state (or parameter) covar-
iance Pk is recursively calculated. The UKF requires taking the matrix
square-root SkSTk ¼ Pk , at each time step, which is Oð1
6L3Þ using a
Cholesky factorization. In the square-root UKF (SR-UKF), Sk will be
propagated directly, avoiding the need to refactorize at each time step. The
algorithm will in general still be OðL3Þ for state estimation, but with
improved numerical properties (e.g., guaranteed positive-semidefiniteness
of the state covariances), similar to those of standard square-root Kalman
filters [20]. However, for the special state-space formulation of parameter
estimation, an OðL2Þ implementation becomes possible (equivalent
complexity to EKF parameter estimation).
The square-root form of the UKF makes use of three powerful linear-
algebra techniques,13 QR decomposition, Cholesky factor updating, and
efficient least squares, which we briefly review below:
� QR decomposition The QR decomposition or factorization of a
matrix A 2 RL�N is given by, AT ¼ QR, where Q 2 RN�N is
orthogonal, R 2 RN�L is upper-triangular, and N # L. The upper-
triangular part of R, ~RR, is the transpose of the Cholesky factor of
P ¼ AAT , that is, ~RR ¼ ST , such that ~RRT ~RR ¼ AAT . We use the
shorthand notation qrf�g to donate a QR decomposition of a matrix
where only ~RR is returned. The computational complexity of a QR
decomposition is oðNL2Þ. Note that performing a Cholesky factor-
ization directly on P ¼ AAT is Oð16
L3Þ plus OðNL2Þ to form AAT .
� Cholesky factor updating If S is the original lower-triangular
Cholesky factor of P ¼ AAT , then the Cholesky factor of the rank-
1 update (or downdate) P !ffiffiffin
puuT is denoted by S ¼
cholupdatefS; u;!ng. If u is a matrix and not a vector, then the
result is M consecutive updates of the Cholesky factor using the M
columns of u. This algorithm (available in Matlab as cholupdate)
is only OðL2Þ per update.
13See [54] for theoretical and implementation details.
APPENDIX B 273

� Efficient least squares The solution to the equation ðAAT Þx ¼ AT b
also corresponds to the solution of the overdetermined least-squares
problem Ax ¼ b. This can be solved efficiently using a QR decom-
position with pivoting (implemented in Matlab’s ‘‘=’’ operator).
The complete specifications for the new square-root filters are given in
Table 7.9 for state estimation and Table 7.10 for parameter estimation.
Below we describe the key parts of the square-root algorithms, and how
they contrast with the standard implementations. Experimental results and
further discussion are presented in [7] and [55].
Square-Root State Estimation
As in the original UKF, the filter is initialized by calculating the matrix
square root of the state covariance once via a Cholesky factorization, Eq.
(7.133). However, the propagated and updated Cholesky factor is then
used in subsequent iterations to directly form the sigma points. In Eq.
(7.138) the time update of the Cholesky factor, S�, is calculated using a
QR decomposition of the compound matrix containing the weighted
propagated sigma points and the matrix square root of the additive process
noise covariance. The subsequent Cholesky update (or downdate) in Eq.
(7.137) is necessary since the zeroth weight, WðcÞ0 , may be negative. These
two steps replace the time-update of P� in Eq. (7.55), and is also OðL3Þ.
The same two-step approach is applied to the calculation of the
Cholesky factor, S�yy, of the observation error covariance in Eqs. (7.142)
and (7.143). This step is OðLM2Þ, where M is the observation dimension.
In contrast to the way that Kalman gain is calculated in the standard UKF
(see Eq. (7.61)), we now use two nested inverse (or least-squares)
solutions to the following expansion of Eq. (7.60): KkðS~yykST~yykÞ ¼ Pxk yk
.
Since S�yy is square and triangular, efficient ‘‘back-substitutions’’
can be used to solve for Kk directly without the need for a matrix
inversion.
Finally, the posterior measurement update of the Cholesky factor of the
state covariance is calculated in Eq. (7.147) by applying M sequential
Cholesky downdates to S�k . The downdate vectors are the columns of
U ¼ KkS�yyk. This replaces the posterior update of Pk in Eq. (7.63), and is
also OðLM 2Þ.
Square-Root Parameter Estimation
The parameter-estimation algorithm follows a similar framework to that of
the state-estimation square-root UKF. However, an OðML2Þ algorithm, as
274 7 THE UNSCENTED KALMAN FILTER

opposed to OðL3Þ, is possible by taking advantage of the linear state
transition function. Specifically, the time update of the state covariance is
given simply by P�wk¼ Pwk�1
þ Rrk�1 (see Section 7.4 for a discussion on
selecting Rrk�1). In the square-root filters Swk
may thus be updated directly
in Eq. (7.150) using one of two options: (1) S�wk¼ l�1=2
RLS Swk�1, correspond-
Table 7.9 Square-Root UKF for state estimation
Initialize with
xx0 ¼ E½x0�; S0 ¼ chol E½ðx0 � xx0Þðx0 � xx0ÞT�
� �: ð7:133Þ
For k 2 f1; . . . ;1g,
The sigma-point calculation and time update are given by
XX k�1 ¼ ½xxk�1 xxk�1 þ gSk xxk�1 � gSk �; ð7:134Þ
XX*kjk�1 ¼ FðXX k�1; uk�1Þ; ð7:135Þ
xx�k ¼P2L
i¼0
WðmÞi X*i;kjk�1; ð7:136Þ
S�k ¼ qr
ffiffiffiffiffiffiffiffiffiW
ðcÞ1
qðXX*1:2L;kjk�1 � xx�k Þ
ffiffiffiffiffiffiRv
p� �� �
ð7:137Þ
S�k ¼ cholupdatefS�k ;X*0;k � xx�k ;WðcÞ0 g; ð7:138Þ
ðaugment sigma pointsÞ14
XX kjk�1 ¼ ½XX*kjk�1 X*0;kjk�1 þ gffiffiffiffiffiffiRv
pXX*0;kjk�1 � g
ffiffiffiffiffiffiRv
p� ð7:139Þ
YYkjk�1 ¼ HðXX kjk�1Þ ð7:140Þ
yy�k ¼P2L
i¼0
WðmÞi Y i;kjk�1; ð7:141Þ
and the measurement update equations are
S~yyk¼ qr
ffiffiffiffiffiffiffiffiffiW
ðcÞ1
qðYY1:2L;k � yykÞ
ffiffiffiffiffiffiRn
k
p� �� �; ð7:142Þ
S~yyk¼ cholupdatefS~yyk
;Y0;k � yyk ;WðcÞ0 g ð7:143Þ
Pxk yk¼P2L
i¼0
WðcÞi ðX i;kjk�1 � xx�k ÞðYi;kjk�1 � yy�k Þ
T ; ð7:144Þ
Kk ¼ ðPxk yk=ST
~yykÞ=S~yyk
; ð7:145Þ
xxk ¼ xx�k þKkðyk � yy�k Þ;
U ¼ KkS~yyk; ð7:146Þ
Sk ¼ cholupdatefS�k ;U;�1g; ð7:147Þ
14Alternatively, redraw a new set of sigma points that incorporate the additive process
noise, i.e., XX kjk�1 ¼ ½xx�k xx�k þ gS�k xx�k � gS�k �.
APPENDIX B 275

ing to an exponential weighting on past data; (2) S�wk¼ Swk�1
þ Drk�1,
where the diagonal matrix Drk�1; is chosen to approximate the effects of
annealing a diagonal process noise covariance Rrk .15 Both options avoid
the costly OðL3Þ QR and Cholesky-based updates necessary in the state-
estimation filter.
Table 7.10 Square-root UKF for parameter estimation
Initialize with
ww0 ¼ E½w�; Sw0¼ cholfE½ðw � ww0Þðw � ww0Þ
T�g: ð7:148Þ
For k 2 f1; . . . ;1g,
The time update and sigma point calculation are given by
ww�k ¼ wwk�1; ð7:149Þ
S�wk¼ l�1=2
RLS Swk�1or S�wk
¼ Swk�1þ Drk�1
; ð7:150Þ
WWkjk�1 ¼ ½ww�k ww�
k þ gS�wkww�
k � gS�wk�; ð7:151Þ
DDkjk�1 ¼ Gðxk;WWkjk�1Þ; ð7:152Þ
ddk ¼P2L
i¼0
WðmÞi Di;kjk�1; ð7:153Þ
and the measurement-update equations are
Sdk¼ qr
ffiffiffiffiffiffiffiffiffiW
ðcÞ1
qðDD1:2L;k � ddkÞ
ffiffiffiffiffiffiRe
p� �� �
; ð7:154Þ
Sdk¼ cholupdatefSdk
;D0;k � ddk ;WðcÞ0 g; ð7:155Þ
Pwk dk¼P2L
i¼0
WðcÞi ðW i;kjk�1 � ww�
k ÞðDi;kjk�1 � ddkÞT ; ð7:156Þ
Kk ¼ ðPwk dk=ST
dkÞ=Sdk
; ð7:157Þ
wwk ¼ ww�k þKkðdk � ddkÞ; ð7:156Þ
U ¼ KkSdk; ð7:158Þ
Swk¼ cholupdatefS�wk
;U;�1g; ð7:159Þ
where
Drk�1¼ �DiagfSwk�1
g þ
ffiffiffiffiffiffiffiffiffiffiffiffiffiffiffiffiffiffiffiffiffiffiffiffiffiffiffiffiffiffiffiffiffiffiffiffiffiffiffiffiffiffiffiffiffiffiffiffiffiffiffiffiffiffiffiDiagfSwk�1
g2 þ DiagfRrk�1g:
q
15This update ensures that the main diagonal of P�wk
is exact. However, additional off-
diagonal cross-terms Swk�1DT
rk�1þ Drk�1
STwk�1
are also introduced (though the effect appears
negligible).
276 7 THE UNSCENTED KALMAN FILTER

REFERENCES
[1] S.J. Julier, J.K. Uhlmann, and H. Durrant-Whyte, ‘‘A new approach for
filtering nonlinear systems,’’ in Proceedings of the American Control
Conference, 1995, pp. 1628–1632.
[2] S.J. Julier and J.K. Uhlmann, ‘‘A general method for approximating
nonlinear transformations of probability distributions,’’ Technical Report,
RRG, Department of Engineering Science, University of Oxford, November
1996. http:==www.robots.ox.ac.uk=siju=work=publications=letter_size=Unscented.zip.
[3] S.J. Julier and J.K. Uhlmann, ‘‘A new extension of the Kalman filter to
nonlinear systems,’’ in Proceedings of AeroSense: The 11th International
Symposium on Aerospace=Defence Sensing, Simulation and Controls, 1997.
[4] E.A. Wan, R. van der Merwe, and A.T. Nelson, ‘‘Dual estimation and the
unscented transformation,’’ in S.A. Solla, T.K. Leen, and K.-R. Muller, Eds.
Advances in Neural Information Processing Systems 12, Cambridge, MA:
MIT Press, 2000, pp. 666–672.
[5] E.A. Wan and R. van der Merwe, ‘‘The unscented Kalman filter for nonlinear
estimation, in Proceedings of Symposium 2000 on Adaptive Systems for
Signal Processing, Communication and Control (AS-SPCC), IEEE, Lake
Louise, Alberta, Canada, October 2000.
[6] R. van der Merwe, J.F.G. de Freitas, D. Doucet, and E.A. Wan, ‘‘The
unscented particle filter,’’ Technical Report CUED=F-INFENG=TR 380,
Cambridge University Engineering Department, August 2000.
[7] R. van der Merwe and E.A. Wan, ‘‘Efficient derivative-free Kalman filters for
online learning,’’ in Proceedings of European Symposium on Artificial
Neural Networks (ESANN), Bruges, Belgium, April 2001.
[8] S. Singhal and L. Wu, ‘‘Training multilayer perceptrons with the extended
Kalman filter,’’ in Advances in Neural Information Processing Systems 1.
San Mateo, CA: Morgan Kauffman, 1989, pp. 133–140.
[9] G.V. Puskorius and L.A. Feldkamp, ‘‘Decoupled extended Kalman filter
training of feedforward layered networks,’’ in Proceedings of IJCNN, Vol. 1,
International Joint Conference on Neural Networks, 1991, pp. 771–777.
[10] R.E. Kalman, ‘‘A new approach to linear filtering and prediction problems,’’
Transactions of the ASME, Ser. D, Journal of Basic Engineering, 82, 35–45
(1960).
[11] A. Jazwinsky, Stochastic Processes and Filtering Theory. New York:
Academic Press, 1970.
[12] K. Ito and K. Xiong, ‘‘Gaussian filters for nonlinear filtering problems,’’
IEEE Transactions on Automatic Control, 45, 910–927 (2000).
[13] M. Nørgaard, N.K. Poulsen, and O. Ravn, ‘‘Advances in derivative-free state
estimation for nonlinear systems,’’ Technical Report IMM-REP-1998-15,
REFERENCES 277

Department of Mathematical Modelling=Department of Automation, Tech-
nical University of Denmark, Lyngby, April 2000.
[14] J.R. Cloutier, C.N. D’Souza, and C.P. Mracek, ‘‘Nonlinear regulation and
nonlinear H-infinity controls via the state-dependent Riccati equation
technique: Part 1, Theory,’’ in Proceedings of the International Conference
on Nonlinear Problems in Aviation and Aerospace, Daytona Beach, FL, May
1996.
[15] M. Mackey and L. Glass, ‘‘Oscillation and chaos in a physiological control
system,’’ Science, 197, 287–289 1977.
[16] A. Lapedes and R. Farber, ‘‘Nonlinear signal processing using neural
networks: Prediction and system modelling,’’ Technical Report LAUR
872662, Los Alamos National Laboratory, 1987.
[17] R.H. Shumway and D.S. Stoffer, ‘‘An approach to time series smoothing and
forecasting using the EM algorithm,’’ Time Series Analysis, 3, 253–264
(1982).
[18] Z. Ghahramani and S.T. Roweis, ‘‘Learning nonlinear dynamical systems
using an EM algorithm,’’ in M.J. Kearns, S.A. Solla, and D.A. Cohn, Eds.,
Advances in Neural Information Processing Systems 11: Proceedings of the
1998 Conference. Cambridge, MA: MIT Press, 1999.
[19] F.L. Lewis, Optimal Estimation. New York: Wiley, 1986.
[20] A.H. Sayed and T. Kailath, ‘‘A state-space approach to adaptive RLS
filtering,’’ IEEE Signal Processing Magazine, pp. 18–60 (July 1994).
[21] S. Haykin. Adaptive Filter Theory, 3rd ed. Upper Saddle River, NJ: Prentice-
Hall, 1996.
[22] A.T. Nelson, ‘‘Nonlinear estimation and modeling of noisy time-series by
dual Kalman filtering methods,’’ PhD Thesis, Oregon Graduate Institute,
2000.
[23] L. Ljung and T. Soderstrom, Theory and Practice of Recursive Identification.
Cambridge, MA: MIT Press, 1983.
[24] D.J.C. MacKay,
http:==wol.ra.phy.cam.ac.uk=mackay=sourcedata. html.www.
[25] D.J.C. MacKay, ‘‘A practical Bayesian framework for backpropagation
networks,’’ Neural Computation, 4, 448–472 (1992).
[26] K. Ikeda, ‘‘Multiple-valued stationary state and its instability of light by a
ring cavity system,’’ Optics Communications 30, 257–261 (1979).
[27] H.H. Rosenbrock, ‘‘An automatic method for finding the greatest or least
value of a function,’’ Computer Journal, 3, 175–184 (1960).
[28] G.V. Puskorius and L.A. Feldkamp, ‘‘Extensions and enhancements
of decoupled extended Kalman filter training,’’ in Proceedings of ICNN,
Vol. 3, International Conference on Neural Networks 1997, pp. 1879–
1883.
278 7 THE UNSCENTED KALMAN FILTER

[29] E.A. Wan and A.T. Nelson, ‘‘Neural dual extended Kalman filtering:
Applications in speech enhancement and monaural blind signal separation,’’
in Proceedings of Neural Networks for Signal Processing Workshop, IEEE,
1997.
[30] M.B. Matthews, ‘‘A state-space approach to adaptive nonlinear filtering
using recurrent neural networks,’’ in Proceedings of IASTED International
Symposium on Artificial Intelligence Application and Neural Networks,
1990, pp. 197–200.
[31] R.W. Brumbaugh, ‘‘An Aircraft Model for the AIAA Controls Design
Challenge,’’ PRC Inc., Edwards, CA.
[32] J.P. Dutton, ‘‘Development of a Nonlinear Simulation for the McDonnell
Douglas F-15 Eagle with a Longitudinal TECS Control Law,’’ Master Thesis,
Department of Aeronautics and Astronautics, University of Washington,
1994.
[33] A Doucet, ‘‘On sequential simulation-based methods for Bayesian filtering,’’
Technical Report CUED=F-INFENG=TR 310, Cambridge University Engi-
neering Department, 1998.
[34] A. Doucet, J.F.G. de Freitas, and N.J. Gordon, ‘‘Introduction to sequential
Monte Carlo methods,’’ in A. Doucet, J.F.G. de Freitas, and N.J. Gordon,
Eds. Sequential Monte Carlo Methods in Practice. Berlin: Springer-Verlag,
2000.
[35] N.J. Gordon, D.J. Salmond, and A.F.M. Smith, ‘‘Novel approach to non-
linear=non-Gaussian Bayesian state estimation,’’ IEE Proceedings, Part F,
140, 107–113 (1993).
[36] B. Efron, The Bootstrap Jacknife and other Resampling Plans. Philadelphia:
SIAM, 1982.
[37] D.B. Rubin, ‘‘Using the SIR algorithm to simulate posterior distributions,’’ in
J.M. Bernardo, M.H. DeGroot, D.V. Lindley, and A.F.M. Smith, Eds.,
Bayesian Statistics 3. Oxford University Press, 1988, pp. 395–402.
[38] A.F.M. Smith and A.E. Gelfand, ‘‘Bayesian statistics without tears: a
sampling–resampling perspective,’’ American Statistician, 46, 84–88, 1992.
[39] T. Higuchi, ‘‘Monte Carlo filter using the genetic algorithm operators,’’
Journal of Statistical Computation and Simulation, 59, 1–23 (1997).
[40] A. Kong, J.S. Liu, and W.H. Wong, ‘‘Sequential imputations and Bayesian
missing data problems,’’ Journal of the American Statistical Association, 89,
278–288 (1994).
[41] J.S. Liu and R. Chen, ‘‘Blind deconvolution via sequential imputations,’’
Journal of the American Statistical Association, 90, 567–576 (1995).
[42] J.S. Liu and R. Chen, ‘‘Sequential Monte Carlo methods for dynamic
systems,’’ Journal of the American Statistical Association, 93. 1032–1044
(1998).
REFERENCES 279

[43] V.S. Zaritskii, V.V. Svetnik, and L.I. Shimelevich, ‘‘Monte-Carlo techniques
in problems of optimal information processing,’’ Automation and Remote
Control, 36, 2015–2022 (1975).
[44] D. Avitzour, ‘‘A stochastic simulation Bayesian approach to multitarget
tracking,’’ IEE Proceedings on Radar, Sonar and Navigation, 142, 41–44
(1995).
[45] E.R. Beadle and P.M. Djuric, ‘‘A fast weighted Bayesian bootstrap filter for
nonlinear model state estimation,’’ IEEE Transactions on Aerospace and
Elecytronic Systems, 33, 338–343 (1997).
[46] M. Isard and A. Blake, ‘‘Contour tracking by stochastic propagation of
conditional density,’’ in Proceedings of European Conference on Computer
Vision, Cambridge, UK, 1996, pp. 343–356.
[47] G. Kitagawa, ‘‘Monte Carlo filter and smoother for non-Gaussian nonlinear
state space model,’’ Journal of Computational and Graphical Statistics, 5, 1–
25 (1996).
[48] J.F.G. de Freitas, ‘‘Bayesian Methods for Neural Networks,’’ PhD Thesis,
Cambridge University Engineering Department, 1999.
[49] J.C. Hull, Options, Futures, and Other Derivatives, 3rd ed. Upper Saddle
River, NJ: Prentice-Hall, 1997.
[50] F. Black and M. Scholes, ‘‘The pricing of options and corporate liabilities,’’
Journal of Political Economy, 81, 637–659 (1973).
[51] M. Niranjan, ‘‘Sequential tracking in pricing financial options using model
based and neural network approaches,’’ in M.C. Mozer, M.I. Jordan, and T.
Petsche, Eds. Advances in Neural Information Processing Systems 8, 1996,
960–966.
[52] J.F.G. de Freitas, M. Niranjan, A.H. Gee, and A. Doucet, ‘‘Sequential Monte
Carlo methods to train neural network models,’’ Neural Computation, 12,
955–993 (2000).
[53] S.J. Julier, ‘‘The scaled unscented transformation.’’ In preparation.
[54] W.H. Press, S.A. Teukolsky, W.T. Vetterling, and B.P. Flannery, Numerical
Recipes in C: The Art of Scientific Computing, 2nd ed. Cambridge University
Press, 1992.
[55] R. van der Merwe and E.A. Wan, ‘‘The square-root unscented Kalman filter
for state and parameter-estimation,’’ in Proceedings of International Confer-
ence on Acoustics, Speech, and Signal Processing, Salt Lake City, UT, May
2001.
280 7 THE UNSCENTED KALMAN FILTER

INDEX
A priori covariance matrix, 7
Air=fuel ratio control, 58
Approximate error covariance matrix,
24, 29–34, 49, 63
Artificial process-noise, 48–50
Attentional filtering, 80
Automatic relevance determination
(ARD), 205
Automotive applications, 57
Automotive powertrain control
systems, 57
Avoiding matrix inversions, 46
Backpropagation, 30, 39, 44, 51, 56
Backpropagation process, 55
Backward filtering, 12
Bayesian methods, 203
Bayes’ rule, 181
BPTT(h), 45
Cayley–Hamilton theorem, 212
Central difference interpolation, 230
Chaotic (dynamic) invariants, 84
Chaotic dynamics, 83
Cholesky factorization, 11
Closed-loop controller, 60
Closed-loop evaluation, 88, 93, 100,
108, 115
Colored, 166
Comparison of chaotic invariances of
Ikeda map, 97
Comparison of chaotic invariants of
logistic map, 90
Comparison of chaotic invariances of
Lorenz series, 102
Comparison of chaotic invariants of
sea clutter, 114
Computational complexity, 24, 33, 34,
39, 46, 63
Conditional mean estimator, 4
Constrained weights, 51
Correlation dimension, 84
Cortical feedback, 80
Cost functions, 64
Covariance matix of the process noise,
31, 32
Cross-entropy, 54
Decoupled extended Kalman filter
(DEKF), 26, 33, 39, 47
Decoupled extended Kalman filter
(NDEKF) algorithm, 69
DEKF algorithm, 34
Delay coordinate method, 86
Derivative calculations, 43, 56
Derivative matrices, 31, 34, 38
Derivative matrix, 30, 31, 33
Derivatives of network outputs, 44
Divergence phenomenon, 10
281

Double inverted pendulum, 234
Dual EKF, 213
Dual estimation, 123, 130, 224, 249
Dual Kalman, 125
Dynamic pattern classifiers, 62
Dynamic reconstruction, 85
Dynamic reconstruction of the laser
series, 109
Dynamic reconstruction of the Lorenz
series, 101
Dynamic reconstruction of the noisy
Lorenz series, 105
Dynamic reconstruction of the noisy
Ikeda map, 98
EKF, 37, 43, 52, 54, 56, 62
see Extended Kalman filter
EKF procedure, 28
Elliott sigmoid, 53
EM algorithm, 142
Embedding delay, 86
Embedding dimension, 86
Embedding, 211
Engine misfire detection, 61
Entropic cost function, 54, 55
Error covariance propagation, 8
Error covariance matrices, 48
Error covariance matrix, 26
Error covariance update, 49
Error vector, 29–31, 34, 38, 52
Estimation, 124
Expectation–maximization (EM)
algorithm, 177, 182
Extended Kalman filter (EKF), 16, 24,
123, 182, 221, 227
Extended Kalman filtering (EKF)
algorithm, 179
Extended Kalman filter-recurrent
multilayered perceptron, 83
Extended Kalman filter, summary of,
19
Factor analysis (FA), 193
Filtering, 3
Forward filtering, 12
Fully decoupled EKE, 25, 34
Gauss–Hermite quadrature rule, 230
GEKF, 30, 33, 34, 39, 62
see Global EKE
GEKF, decoupled EKE algorithm, 25
Generative model, 178
Givens rotations, 49, 50
Global EKE (GEKF), 24, 26
Global scaling matrix, 29, 31, 38
Global sealing matrix Ak, 34
Global EKF training, 29
Graphical models, 178, 179
Hidden variables, 177
Hierarchical architecture, 71
Identifiability, 206
Idle speed control, 59
Ikeda map, 91
Inference, 176
Innovations, 7
Jensen’s inequality, 183
Joint EKF, 213
Joint estimation, 137
Joint extended Kalman filter, 125
‘‘Joseph’’ version of the covariance
update equation, 8
Kalman filter, 1, 5, 177
Kalman filter, information formulation
of, 13
Kalman gain, 6
Kalman gain matrix, 29, 30, 31, 33, 49
Kalman gain matrices, 34, 38
Kaplan–York dimension, 85
Kernel, 192
Kolmogorov entropy, 85
Laser intensity pulsations, 106
Layer-decoupled EKF, 34
Learning rate, 31, 32, 48
282 INDEX

Least-squares solution, 42
Logistic map, 87
Lorenz attractor, 99
Lyapunov exponents, 84
Lyapunov dimension, 85
MAP estimation, 135
Mammalian neocortex, 70
Marginal estimation, 140
Markov-chain Monte Carlo, 258
Matrices Hik , 52
Matrix of derivatives, 29
Matrix factorization lemma, 48
Matrix inversion lemma, 14
Matrix inversions, 55, 63
Maximum a posteriori (MAP), 135
Maximum-likelihood cost, 140
Measurement covariance, 30
Measurement equation, 3
Measurement error covariance matrix,
38
Mixture of factor analyzers (MFA),
193
MMSE estimator, 225
Modeling, 124
Model selection, 203
Monte Carlo simulation, 255
Moving object, 80
Multistream, 39, 40
Multistream EKF, 26, 38
Multistream EKF training, 63
Multistream Kalman recursion, 42
Multistream training, 34, 36, 45
Neurobiological foundations, 70
Node-decoupled extended Kalman
filter (NDEKF) algorithm, 69
Node-decoupled EKF, 25, 34, 46
Noise, 166
Noisy time-series estimation, 153, 235
Noisy Ikeda series, 95
Noisy Lorenz series, 103
Nonlinear dynamics, 175
Nonlinear dynamic modelling of real-
world time series, 106
Non-rigid motion, 80
Nonstationarity, 202
Occlusions, 75, 78
On-line learning, 201,
Open-loop evaluation, 87, 92, 99, 108,
115
Optimal recursive estiation, 224
Optimization with constraints, 51
Optimum smoothing problem, 11
Overfitting, 204
Parameter estimation, 223, 240
Partial M-step, 200
Particle filters, 182, 259
Perceptual foundations, 70
Prediction error, 126
Prediction, 3, 124
Priming length, 37
Principles of orthogonality, 4
Process equation, 2
Process noise, 29
Proposal distribution, 254
Radial basis function (RBF) networks,
188
Rauch–Tung–Streibel (RTS) smoother,
11, 17, 180
Rauch–Tung–Striebel, 15, 25
Real-time-recurrent learning (RTRL),
25
Recency effect, 36
Recency phenomenon, 25, 26
Reconstruction failures, 119
Recurrent derivative, 131, 164
Recurrent multilayered perceptron
(RMLP), 26, 28, 30, 61, 69
Recurrent network, 28, 44, 59
Recurrent multiplayer perceptron, 69
Recurrent neural networks, 60, 62, 63
Recursive least-squares (RLS)
algorithm, 201
INDEX 283

Rescaled extended Kalman recursion,
31
Sea clutter data, 113
Sensor-catalyst modeling, 60
Sequential DEKF, 47
Sequential importance sampling, 255
Sequential update, 47
Shape and motion perception, 80
Signal-to-ratio (SER), 87
Simultaneous DEKF, 47
Singular-value decomposition, 46
Smoothing, 3
Speech enhancement, 157
Square-root filtering, 10, 48–50
Square-root UKF, 273
Stability, 210
Stability and robustness, 118
State-error vector, 5
State estimation, 127, 176, 222
Sum of squared error, 29, 64
Summary of the Rauch–Tung–Striebel
smoother, 17
Summary of the Kalman filter, 10
Takens embedding, 86
Taken’s theorem, 211
Teacher forcing, 42
Tracking, 70
Training cost function, 31
Trajectory length, 37
Truncated backpropagation through
time (BPTT(h)), 25, 37, 44
Unscented transformation, 228
Unscented filter, 182
Unscented particle filter, 254
Unscented Kalman filter (UKF), 221,
228, 230
Unscented Kalman smoother, 237
Variance estimation, 149
Variational approximations, 210
Vehicle emissions estimation, 62
Weather Data, 197
Weight estimation, 128
Weighting matrix, 31, 32
‘‘What’’ pathway, 79
‘‘Where’’ pathway, 80
284 INDEX