kakuzi limited annual report and financial statements for … · 2015-03-25 · kakuzi limited...
TRANSCRIPT
1
KAKUZI LIMITED ANNUAL REPORT AND FINANCIAL STATEMENTS FOR THE YEAR ENDED 31 DECEMBER 2014
Kakuzi Limited Annual Report and Financial Statements For the year ended 31 December 2014
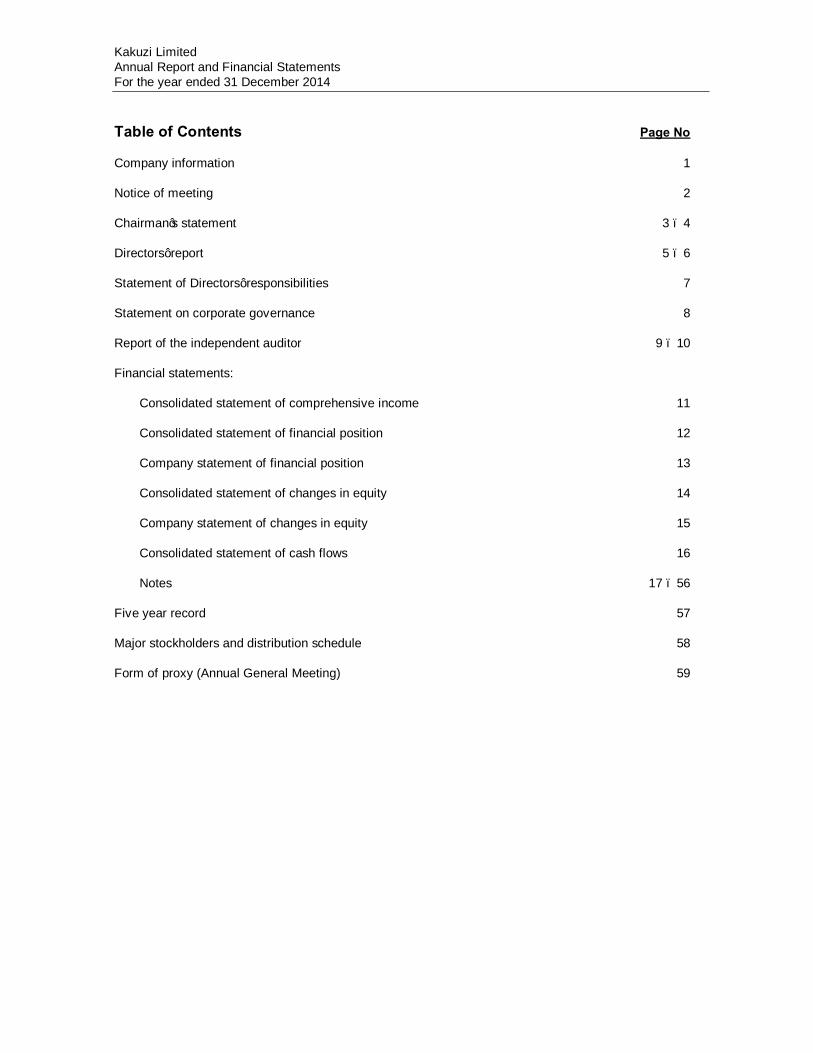
Table of Contents Page No Company information 1 Notice of meeting 2 Chairman’s statement 3 – 4 Directors’ report 5 – 6 Statement of Directors’ responsibilities 7 Statement on corporate governance 8 Report of the independent auditor 9 – 10 Financial statements: Consolidated statement of comprehensive income 11 Consolidated statement of financial position 12 Company statement of financial position 13 Consolidated statement of changes in equity 14 Company statement of changes in equity 15 Consolidated statement of cash flows 16 Notes 17 – 56 Five year record 57 Major stockholders and distribution schedule 58 Form of proxy (Annual General Meeting) 59
1
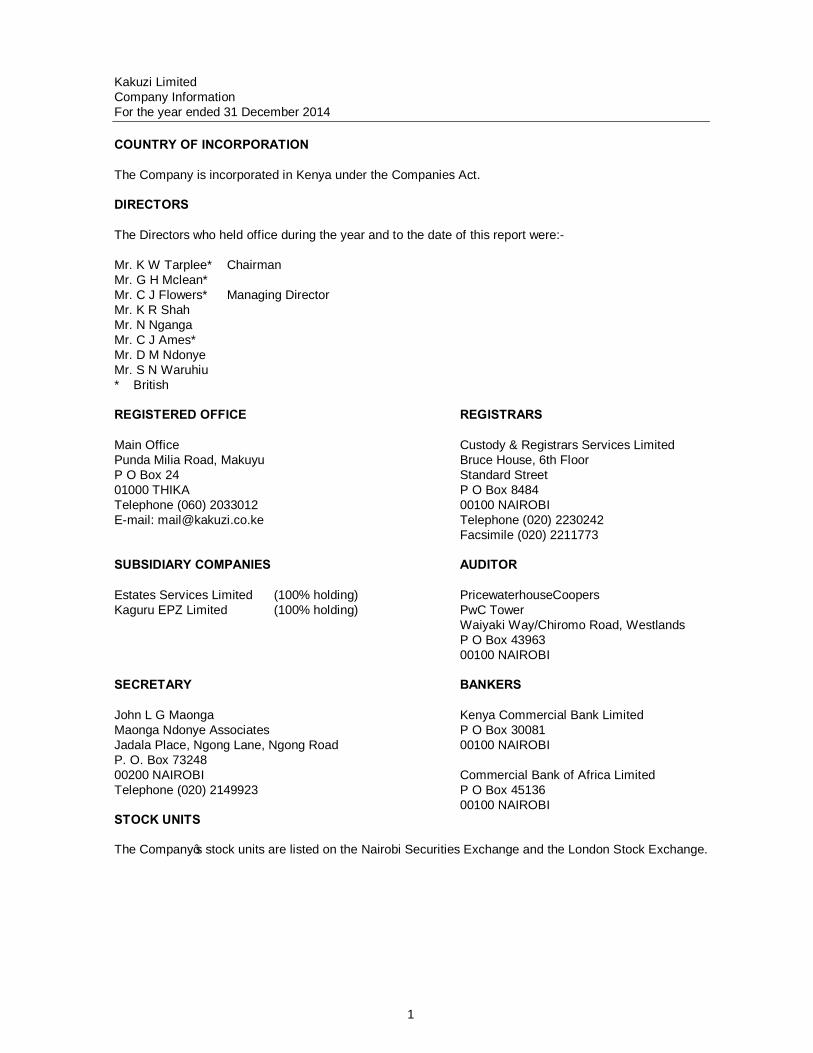
Kakuzi Limited Company Information For the year ended 31 December 2014 COUNTRY OF INCORPORATION The Company is incorporated in Kenya under the Companies Act. DIRECTORS The Directors who held office during the year and to the date of this report were:- Mr. K W Tarplee* Chairman Mr. G H Mclean* Mr. C J Flowers* Managing Director Mr. K R Shah Mr. N Nganga Mr. C J Ames* Mr. D M Ndonye Mr. S N Waruhiu * British REGISTERED OFFICE REGISTRARS Main Office Custody & Registrars Services Limited Punda Milia Road, Makuyu Bruce House, 6th Floor P O Box 24 Standard Street 01000 THIKA P O Box 8484 Telephone (060) 2033012 00100 NAIROBI E-mail: [email protected] Telephone (020) 2230242 Facsimile (020) 2211773 SUBSIDIARY COMPANIES AUDITOR Estates Services Limited (100% holding) PricewaterhouseCoopers Kaguru EPZ Limited (100% holding) PwC Tower Waiyaki Way/Chiromo Road, Westlands P O Box 43963 00100 NAIROBI SECRETARY BANKERS John L G Maonga Kenya Commercial Bank Limited Maonga Ndonye Associates P O Box 30081 Jadala Place, Ngong Lane, Ngong Road 00100 NAIROBI P. O. Box 73248 00200 NAIROBI Commercial Bank of Africa Limited Telephone (020) 2149923 P O Box 45136 00100 NAIROBI STOCK UNITS The Company’s stock units are listed on the Nairobi Securities Exchange and the London Stock Exchange.
2
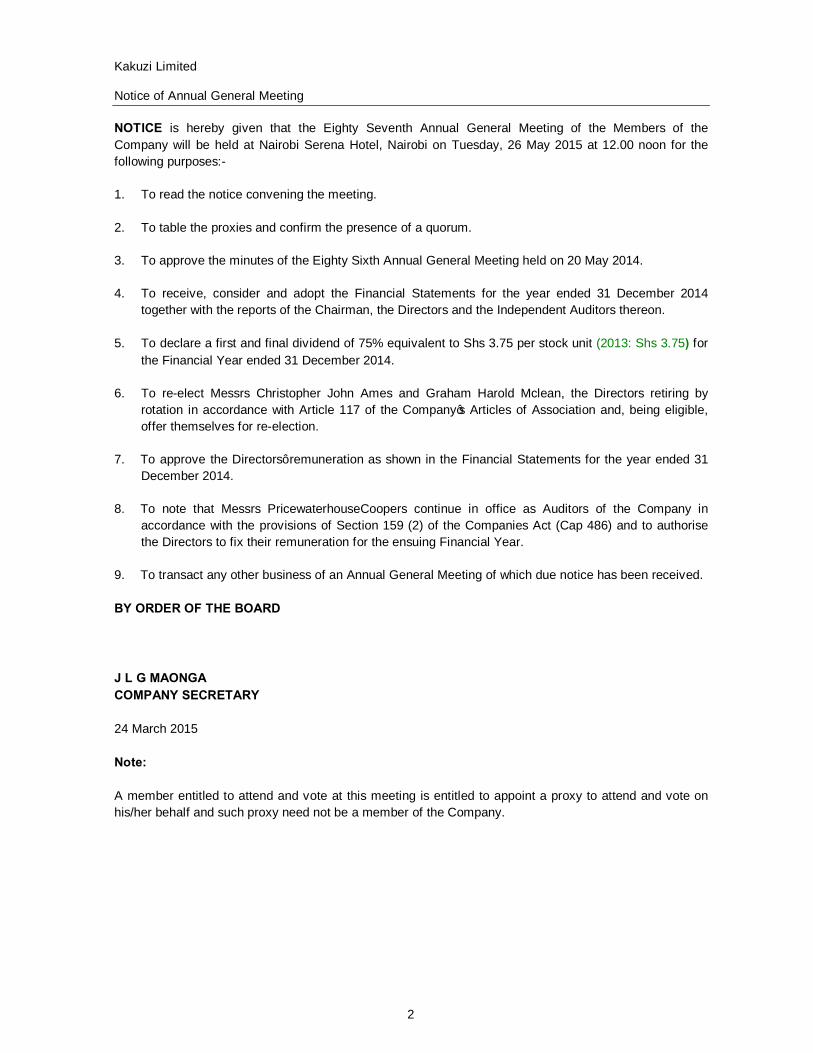
Kakuzi Limited Notice of Annual General Meeting NOTICE is hereby given that the Eighty Seventh Annual General Meeting of the Members of the Company will be held at Nairobi Serena Hotel, Nairobi on Tuesday, 26 May 2015 at 12.00 noon for the following purposes:- 1. To read the notice convening the meeting.
2. To table the proxies and confirm the presence of a quorum.
3. To approve the minutes of the Eighty Sixth Annual General Meeting held on 20 May 2014.
4. To receive, consider and adopt the Financial Statements for the year ended 31 December 2014
together with the reports of the Chairman, the Directors and the Independent Auditors thereon.
5. To declare a first and final dividend of 75% equivalent to Shs 3.75 per stock unit (2013: Shs 3.75) for the Financial Year ended 31 December 2014.
6. To re-elect Messrs Christopher John Ames and Graham Harold Mclean, the Directors retiring by rotation in accordance with Article 117 of the Company’s Articles of Association and, being eligible, offer themselves for re-election.
7. To approve the Directors’ remuneration as shown in the Financial Statements for the year ended 31
December 2014.
8. To note that Messrs PricewaterhouseCoopers continue in office as Auditors of the Company in accordance with the provisions of Section 159 (2) of the Companies Act (Cap 486) and to authorise the Directors to fix their remuneration for the ensuing Financial Year.
9. To transact any other business of an Annual General Meeting of which due notice has been received. BY ORDER OF THE BOARD J L G MAONGA COMPANY SECRETARY 24 March 2015 Note: A member entitled to attend and vote at this meeting is entitled to appoint a proxy to attend and vote on his/her behalf and such proxy need not be a member of the Company.
3
Kakuzi Limited Chairman’s Statement For the year ended 31 December 2014 RESULTS The profit before income tax was Kshs 232.8 million which was similar to the 2013 level (Kshs 239.3 million). The net gain from biological assets within the above figure was Kshs 79.3 million being lower than 2013 (Kshs 96.3 million). The latter figure has no effect on our cash position which remained strong. The earning per stock unit reduced from Kshs 8.42 to Kshs 8.17 (3%). Avocados were the significant contributor to profits mitigating the downward trend on return on tea for 2014. Other operational units produced a positive contribution to cash. OPERATIONS The first half of the year was relatively dry in both Nandi Hills and Makuyu. However, this improved in Nandi Hills during the second half of the year but Makuyu remained relatively dry. Strategic dam levels which support the horticultural operations were at 51% capacity at the year end. Avocado production was up by almost 40% with our own estate and outgrowers showing an encouraging improvement over 2013 levels. Selling price in both Euros and Kshs terms were down overall from last year. Market demand was reasonable but at times we were competing with high exports from both Peru and South Africa which dampened prices. Logistics continue to be problematic. During peak production periods our cold storage facilities reached close to capacity before trucks arrived for collection and prompt shipping continues to be a challenge. We now have 414 hectares of avocado planted. The improvement in outgrowers throughput was encouraging and we continue to give emphasis to this area concentrating on quality, collection and fair returns. On tea, although production was up by 7.5% at 1,730 tonnes, market prices were very poor due to a high supply situation in Kenya. We barely broke even on this operation and there were months when sales returns were below our cost of production. We are now starting to see small yields on our macadamia plantation which now stands at 698 Hectares. We had our own nuts cracked by an outside party but dealt with our own marketing. This resulted in a small profit accruing. On our forestry operation as mentioned in my half year report, we continue with clearing areas of sub optimum stands. Operating profit was thus down but continued to give a small but useful return. We now have 1,512 hectares planted to commercial forestry, at Makuyu, of which some 480 hectares can be considered to be sub optimum stands. This together with indigenous plantations so necessary for the conservation of our water resources gives us cover of 2,025Has or 16.5% of our land covered to Forestry which is ahead of Government guidelines of 10% of forest cover. Our cattle herd remain at over 4,000 heads. We are confident that this level can be sustained given more intensive land management, even with the new arable project. Again a positive contribution to cash flow was made. Our fresh pineapple and those from the Joint Project showed similar returns to last year. Our arable project did not progress as planned during the year mainly due to delays in receiving heavy machinery necessary for preparing the black cotton soil. Some 500 hectares are cleared and 350 hectares ripped in preparation for ploughing at the year end. DEVELOPMENT We will continue with our Macadamia plantings up to 1,006 hectares over the next 3 years and with the encouraging signs we are now getting from our existing plantations, we plan to start work on our cracking facility in 2015 for completion to receive the 2016 crop. This will be a major Capital Expenditure project. An increase in avocado development is planned over coming years and strong emphasis will continue to be placed on encouraging smallholder production yields. We expect to have cleared and ploughed 900 hectares of land during the coming year on our arable development and planted 700 hectares. At this stage malting barley is considered to be the most suitable crop. We continue with the acceleration of our Corporate Social Responsibility initiatives and during the year received an International Award from the E U African Chamber of Commerce for work to improve food security through the Kitchen Garden concept. Kakuzi also won the prestigious Global Gap 2014 Award for work on water conservation. This was presented in Abu Dhabi. As mentioned in previous reports our philosophy is to continue to invest in long term agricultural projects.
4
Kakuzi Limited Chairman’s Statement (continued) For the year ended 31 December 2014 STAFF & DIRECTORS As is expected in Agriculture, we continue to have to manage to the best of our ability within the uncertainties of the weather and market forces. Staff have worked hard in this respect. We have also had to manage the transition of our Managing Director. Graham Mclean left us for a well-deserved Board level position within the Parent Company and Chris Flowers has managed the transition with energy and professionalism. It is appropriate to thank Graham for his positive contribution made to the continuing development of Kakuzi. We also tragically lost a senior level Manager, Paul Epsom, at the start of the year and the transition to take on his role effectively has not been easy. My fellow Directors continue with a high level of Board professionalism. DIVIDEND We continue to have a strong cash flow and balance sheet and with profits similar to levels of last year, the Directors have recommended a dividend of Shs 3.75 per stock unit. PROSPECTS We have experienced very dry conditions in both Nandi and Makuyu since the start of this year but the rains are at last showing signs of breaking which will be a relief particularly in Makuyu where dam levels are very low and cattle pastures poor. Although the avocado crop was good in 2014 this was an ‘on year’ and we do not expect similar levels for 2015. Tea prices have improved due to the shortage of supply but the lower crop negates to some extent the better prices as regards profitability. The Union Agreements both in Nandi and Makuyu are still to be agreed. There are positive signs for the future with lower fuel prices coupled with overall inflation being brought under control which we hope will translate into lower operational costs. However, the markets to which we sell our main products overseas are still somewhat in economic turmoil. This, together with the important factors of weather trends, which are showing significant swings and, at present, the significant weakness of the Euro make it impossible to predict our returns for 2015. K W TARPLEE CHAIRMAN 24 March 2015
5
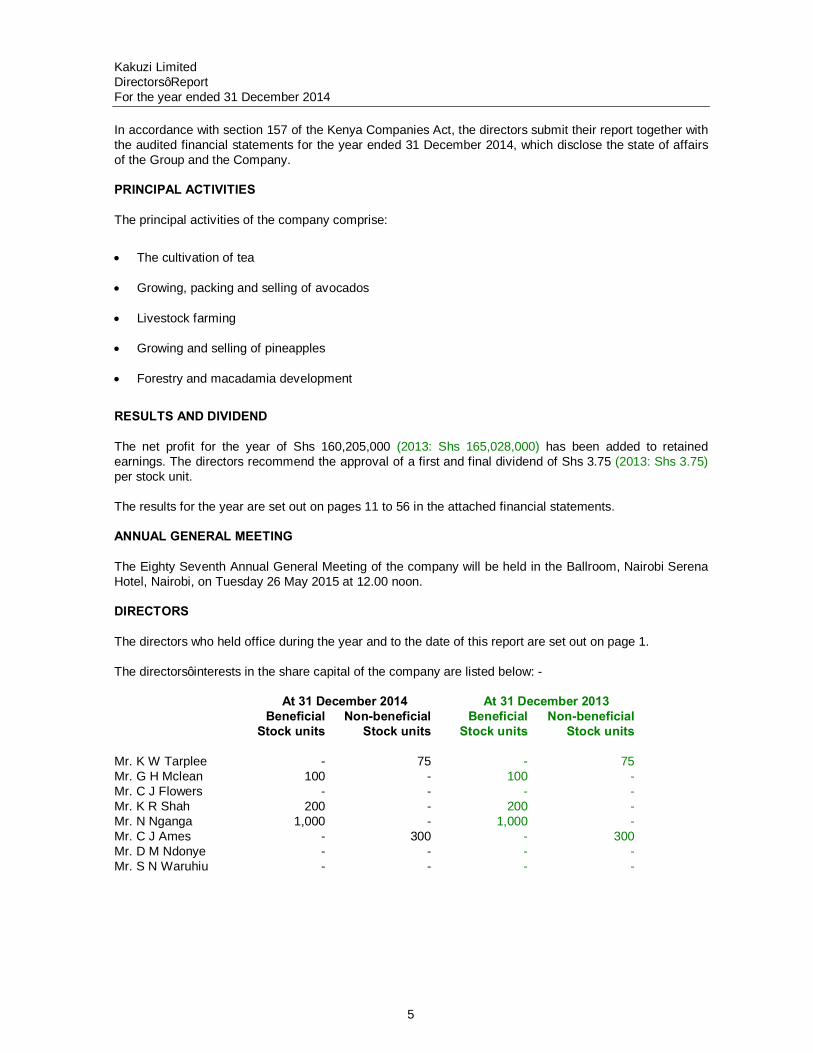
Kakuzi Limited Directors’ Report For the year ended 31 December 2014 In accordance with section 157 of the Kenya Companies Act, the directors submit their report together with the audited financial statements for the year ended 31 December 2014, which disclose the state of affairs of the Group and the Company. PRINCIPAL ACTIVITIES
The principal activities of the company comprise:
• The cultivation of tea
• Growing, packing and selling of avocados
• Livestock farming
• Growing and selling of pineapples
• Forestry and macadamia development
RESULTS AND DIVIDEND The net profit for the year of Shs 160,205,000 (2013: Shs 165,028,000) has been added to retained earnings. The directors recommend the approval of a first and final dividend of Shs 3.75 (2013: Shs 3.75) per stock unit. The results for the year are set out on pages 11 to 56 in the attached financial statements. ANNUAL GENERAL MEETING The Eighty Seventh Annual General Meeting of the company will be held in the Ballroom, Nairobi Serena Hotel, Nairobi, on Tuesday 26 May 2015 at 12.00 noon. DIRECTORS The directors who held office during the year and to the date of this report are set out on page 1. The directors’ interests in the share capital of the company are listed below: - At 31 December 2014 At 31 December 2013 Beneficial Non-beneficial Beneficial Non-beneficial Stock units Stock units Stock units Stock units Mr. K W Tarplee - 75 - 75 Mr. G H Mclean 100 - 100 - Mr. C J Flowers - - - - Mr. K R Shah 200 - 200 - Mr. N Nganga 1,000 - 1,000 - Mr. C J Ames - 300 - 300 Mr. D M Ndonye - - - - Mr. S N Waruhiu - - - -
6
Kakuzi Limited Directors’ Report (continued) For the year ended 31 December 2014 In accordance with Article 117 of the Company’s Articles of Association, Messrs Christopher John Ames and Graham Harold Mclean retire at this meeting by rotation and, being eligible, offer themselves for re-election. AUDITOR The Company’s auditor, PricewaterhouseCoopers, continues in office in accordance with Section 159(2) of the Kenya Companies Act. By order of the Board K R Shah Director 24 March 2015
7
Kakuzi Limited Statement of Directors’ Responsibilities For the year ended 31 December 2014 The Kenyan Companies Act requires the directors to prepare financial statements for each financial year which give a true and fair view of the state of affairs of the Group and of the Company as at the end of the financial year and of the Group’s income statement of comprehensive income. It also requires the directors to ensure that the Company maintains proper accounting records that disclose, with reasonable accuracy, the financial position of the Company. The directors are also responsible for safeguarding the assets of the Company. The directors accept responsibility for the preparation and fair presentation of financial statements that are free from material misstatements whether due to fraud or error. They also accept responsibility for:
(i) Designing, implementing and maintaining internal control as they determine necessary to enable the preparation of financial statements that are free from material misstatements, whether due to fraud or error;
(ii) Selecting and applying appropriate accounting policies; and (iii) Making accounting estimates and judgments that are reasonable in the circumstances.
The Directors are of the opinion that the financial statements give a true and fair view of the financial position of the Company at 31 December 2014 and of the Group’s and Company’s financial performance and cash flows for the period then ended in accordance with International Financial Reporting Standards and the requirements of the Kenyan Companies Act. Nothing has come to the attention of the directors to indicate that the Company will not remain a going concern for at least the next twelve months from the date of this statement. Approved by the board of directors on 24 March 2015 and signed on its behalf by: K R Shah C J Flowers Director Director
8
Kakuzi Limited Statement on Corporate Governance For the year ended 31 December 2014 The directors endorse the spirit of the Guidelines on Corporate Governance Practices by Public Listed Companies in Kenya issued by the Capital Markets Authority. The board currently comprises eight directors. Six are non-executive directors, of which three are considered independent. The remaining two directors are executive directors. The board has established the following committees: 1. The Audit and Risk committee is chaired by Mr. N Nganga. The other members of the committee
are Mr. K W Tarplee, Mr. D M Ndonye and Mr. S N Waruhiu. 2. The Nominating committee, constituted as a committee of the entire board, chaired by Mr. N
Nganga. Every director, with the exception of the managing director, retires by rotation in accordance with the Company’s Articles of Association. In reviewing corporate governance, the directors consider it appropriate to take into account the Company’s status as a subsidiary of Camellia Plc and the size of the Company’s operations. The Company is compliant with the Guidelines on Corporate Governance with the exception of the following non-prescriptive guidelines: Rule 3.1.3 (i) The nominating committee is constituted as a committee of the entire board, and new
board appointments are considered by the full board. Rule 3.1.4 (i) The remuneration of directors is considered by the nominating committee which
comprises the whole board. AUDIT AND RISK COMMITTEE During the year, the Audit and Risk committee met twice. The committee approved the annual internal audit plan which has been monitored by monthly internal audit reports. The committee is satisfied with the Group’s system of internal financial control. The committee also reviews the external auditors plan at the commencement of the annual audit and receives the external auditors report at the conclusion of the annual audit. COMMUNICATION WITH SHAREHOLDERS The Company is committed to equitable treatment of its shareholders including the non controlling and foreign shareholders and ensures that all shareholders receive full and timely information about its performance through the distribution of the annual report and financial statements and half yearly interim financial report and through compliance with the relevant continuing obligations under the Capital Markets Authority Act. The Company’s results are advertised in the press and released to the stock exchange within the prescribed period at each half-year and year end. K R Shah C J Flowers 24 March 2015 24 March 2015
9
REPORT OF THE INDEPENDENT AUDITOR TO THE SHAREHOLDERS OF KAKUZI LIMITED Report on the consolidated financial statements We have audited the accompanying consolidated financial statements of Kakuzi Limited (the Company) and its subsidiaries (together, the Group), as set out on pages 11 to 56. These financial statements comprise the consolidated statement of financial position at 31 December 2014 and the consolidated statement of comprehensive income, statement of changes in equity and statement of cash flows for the year then ended, together with the statement of financial position of the Company standing alone at 31 December 2014 and the statement of changes in equity of the Company for the year then ended, and a summary of significant accounting policies and other explanatory notes. Directors’ responsibility for the financial statements The directors are responsible for the preparation and fair presentation of these financial statements in accordance with International Financial Reporting Standards and with the requirements of the Kenyan Companies Act and for such internal control, as the directors determine necessary, to enable the preparation of financial statements that are free from material misstatements, whether due to fraud or error. Auditor’s responsibility Our responsibility is to express an opinion on the financial statements based on our audit. We conducted our audit in accordance with International Standards on Auditing. Those standards require that we comply with ethical requirements and plan and perform our audit to obtain reasonable assurance that the financial statements are free from material misstatement. An audit involves performing procedures to obtain audit evidence about the amounts and disclosures in the financial statements. The procedures selected depend on the auditor’s judgement, including the assessment of the risks of material misstatement of the financial statements, whether due to fraud or error. In making those risk assessments, the auditor considers internal control relevant to the entity’s preparation and fair presentation of the financial statements in order to design audit procedures that are appropriate in the circumstances, but not for the purpose of expressing an opinion on the effectiveness of the entity’s internal control. An audit also includes evaluating the appropriateness of accounting policies used and the reasonableness of accounting estimates made by the directors, as well as evaluating the overall presentation of the financial statements. We believe that the audit evidence we have obtained is sufficient and appropriate to provide a basis for our opinion. Opinion In our opinion, the accompanying financial statements give a true and fair view of the financial position of the Group and of the Company at 31 December 2014 and of the financial performance and cash flows of the Group for the year then ended in accordance with International Financial Reporting Standards and the Kenya Companies Act.
PricewaterhouseCoopers CPA. PwC Tower, Waiyaki Way/Chiromo Road, Westlands P O Box 43963 – 00100 Nairobi, Kenya T: +254 (20)285 5000 F: +254 (20)285 5001 www.pwc.com/ke
Partners: A Eriksson K Muchiru M Mugasa F Muriu P Ngahu A Njeru R Njoroge B Okundi K Saiti R Shah9
10
REPORT OF THE INDEPENDENT AUDITOR TO THE SHAREHOLDERS OF KAKUZI LIMITED (CONTINUED) Report on other legal requirements As required by the Kenyan Companies Act we report to you, based on our audit, that:
i) we have obtained all the information and explanations which to the best of our knowledge and belief were necessary for the purposes of our audit;
ii) in our opinion proper books of account have been kept by the Company, so far as appears from our examination of those books;
iii) the Company’s statement of financial position and statement of comprehensive income are in
agreement with the books of account.
The engagement partner responsible for the audit resulting in this independent auditor’s report is CPA Michael Mugasa – P/No 1478. Certified Public Accountants Nairobi
24 March 2015
11
Kakuzi Limited Financial Statements For the year ended 31 December 2014
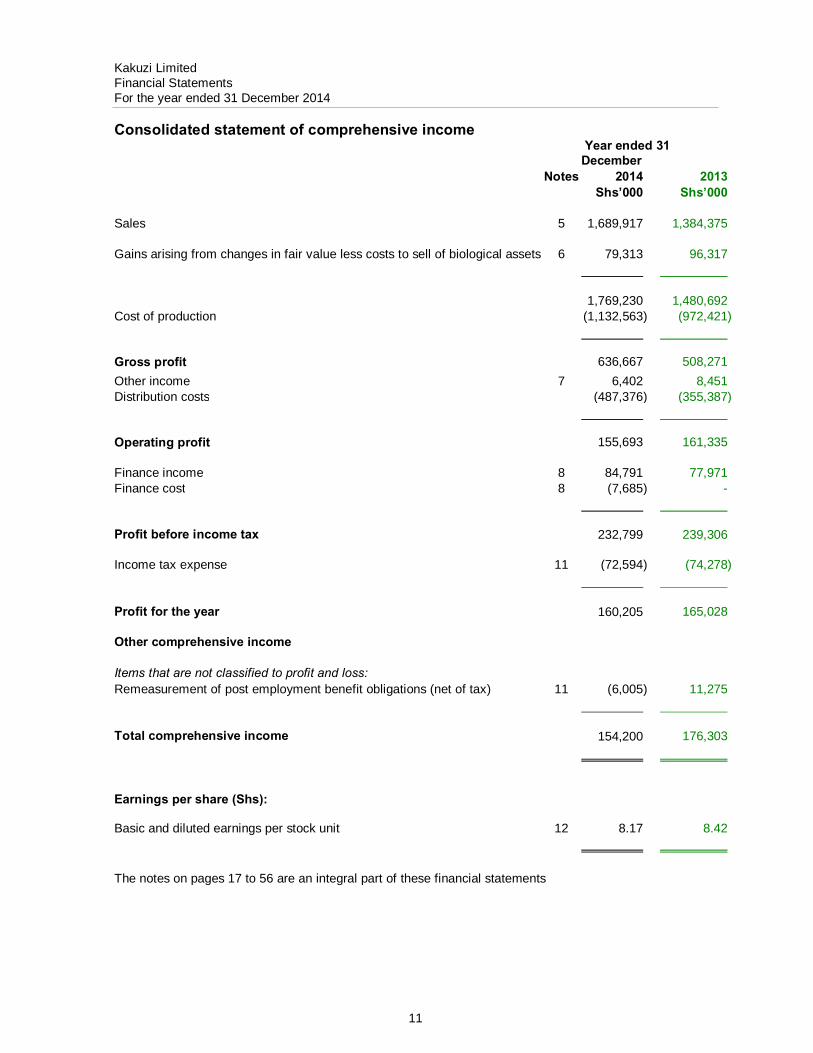
Consolidated statement of comprehensive income
Year ended 31 December
Notes 2014 2013 Shs’000 Shs’000 Sales 5 1,689,917 1,384,375
Gains arising from changes in fair value less costs to sell of biological assets 6 79,313 96,317
1,769,230 1,480,692 Cost of production (1,132,563) (972,421) Gross profit 636,667 508,271 Other income 7 6,402 8,451 Distribution costs (487,376) (355,387) Operating profit 155,693 161,335 Finance income 8 84,791 77,971 Finance cost 8 (7,685) - Profit before income tax 232,799 239,306 Income tax expense 11 (72,594) (74,278) Profit for the year
160,205 165,028
Other comprehensive income Items that are not classified to profit and loss: Remeasurement of post employment benefit obligations (net of tax) 11 (6,005) 11,275 Total comprehensive income 154,200 176,303 Earnings per share (Shs): Basic and diluted earnings per stock unit 12 8.17 8.42 The notes on pages 17 to 56 are an integral part of these financial statements
12
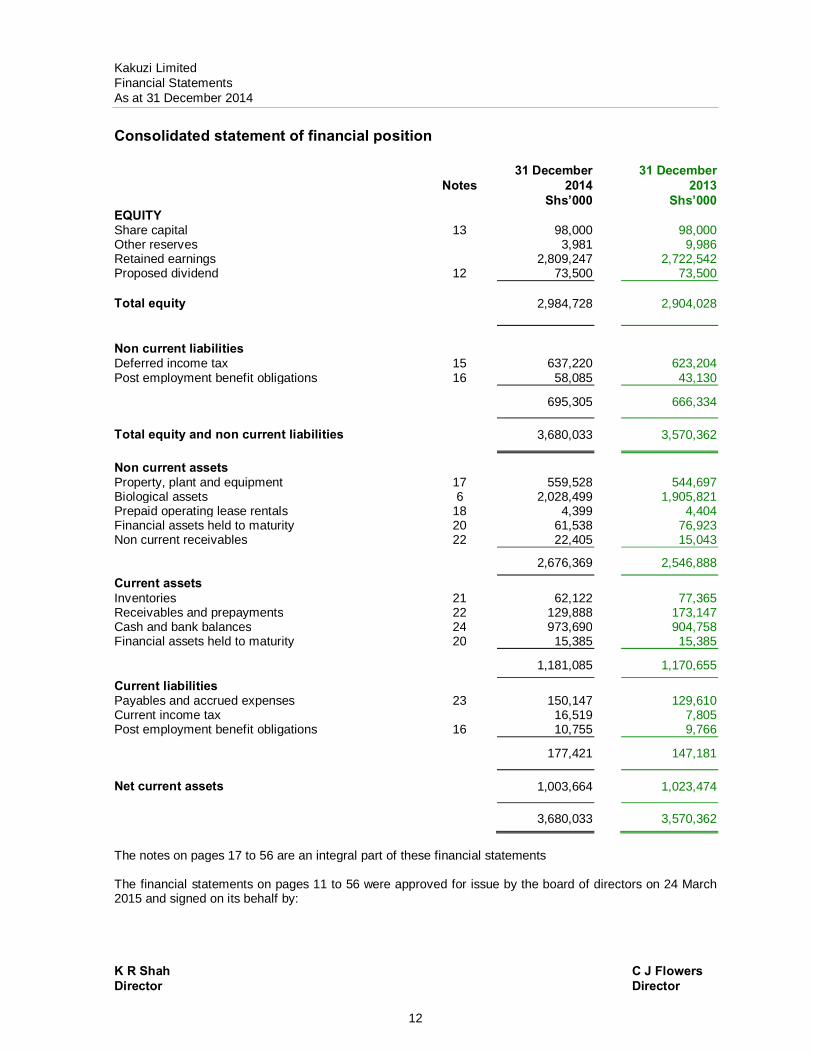
Kakuzi Limited Financial Statements As at 31 December 2014 Consolidated statement of financial position 31 December 31 December Notes 2014 2013 Shs’000 Shs’000 EQUITY Share capital 13 98,000 98,000 Other reserves 3,981 9,986 Retained earnings 2,809,247 2,722,542 Proposed dividend 12 73,500 73,500 Total equity 2,984,728 2,904,028 Non current liabilities Deferred income tax 15 637,220 623,204 Post employment benefit obligations 16 58,085 43,130 695,305 666,334 Total equity and non current liabilities 3,680,033 3,570,362 Non current assets Property, plant and equipment 17 559,528 544,697 Biological assets 6 2,028,499 1,905,821 Prepaid operating lease rentals 18 4,399 4,404 Financial assets held to maturity 20 61,538 76,923 Non current receivables 22 22,405 15,043 2,676,369 2,546,888 Current assets Inventories 21 62,122 77,365 Receivables and prepayments 22 129,888 173,147 Cash and bank balances 24 973,690 904,758 Financial assets held to maturity 20 15,385 15,385 1,181,085 1,170,655 Current liabilities Payables and accrued expenses 23 150,147 129,610 Current income tax 16,519 7,805 Post employment benefit obligations 16 10,755 9,766 177,421 147,181 Net current assets 1,003,664 1,023,474 3,680,033 3,570,362 The notes on pages 17 to 56 are an integral part of these financial statements The financial statements on pages 11 to 56 were approved for issue by the board of directors on 24 March 2015 and signed on its behalf by: K R Shah C J Flowers Director Director
13
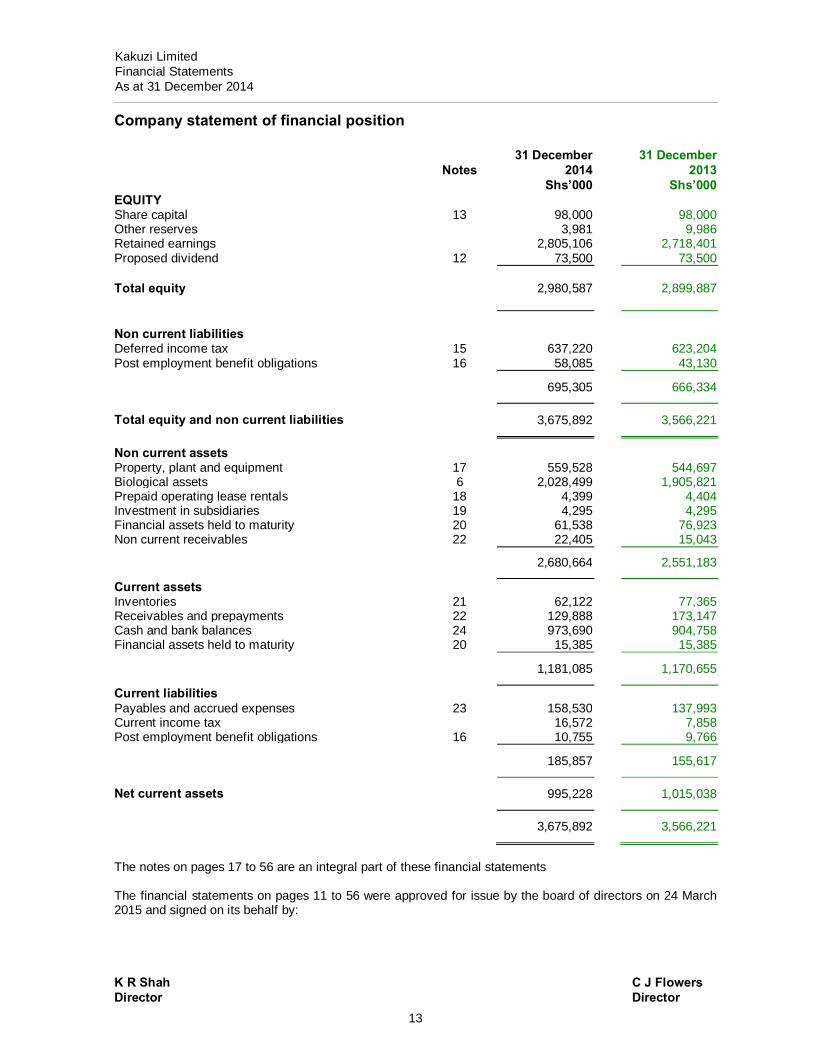
Company statement of financial position 31 December 31 December Notes 2014 2013 Shs’000 Shs’000 EQUITY Share capital 13 98,000 98,000 Other reserves 3,981 9,986 Retained earnings 2,805,106 2,718,401 Proposed dividend 12 73,500 73,500 Total equity 2,980,587 2,899,887 Non current liabilities Deferred income tax 15 637,220 623,204 Post employment benefit obligations 16 58,085 43,130 695,305 666,334 Total equity and non current liabilities 3,675,892 3,566,221 Non current assets Property, plant and equipment 17 559,528 544,697 Biological assets 6 2,028,499 1,905,821 Prepaid operating lease rentals 18 4,399 4,404 Investment in subsidiaries 19 4,295 4,295 Financial assets held to maturity 20 61,538 76,923 Non current receivables 22 22,405 15,043 2,680,664 2,551,183 Current assets Inventories 21 62,122 77,365 Receivables and prepayments 22 129,888 173,147 Cash and bank balances 24 973,690 904,758 Financial assets held to maturity 20 15,385 15,385 1,181,085 1,170,655 Current liabilities Payables and accrued expenses 23 158,530 137,993 Current income tax 16,572 7,858 Post employment benefit obligations 16 10,755 9,766 185,857 155,617 Net current assets 995,228 1,015,038 3,675,892 3,566,221 The notes on pages 17 to 56 are an integral part of these financial statements The financial statements on pages 11 to 56 were approved for issue by the board of directors on 24 March 2015 and signed on its behalf by: K R Shah C J Flowers Director Director
Kakuzi Limited Financial Statements As at 31 December 2014
Kakuzi Limited Financial Statements For the year ended 31 December 2014
14
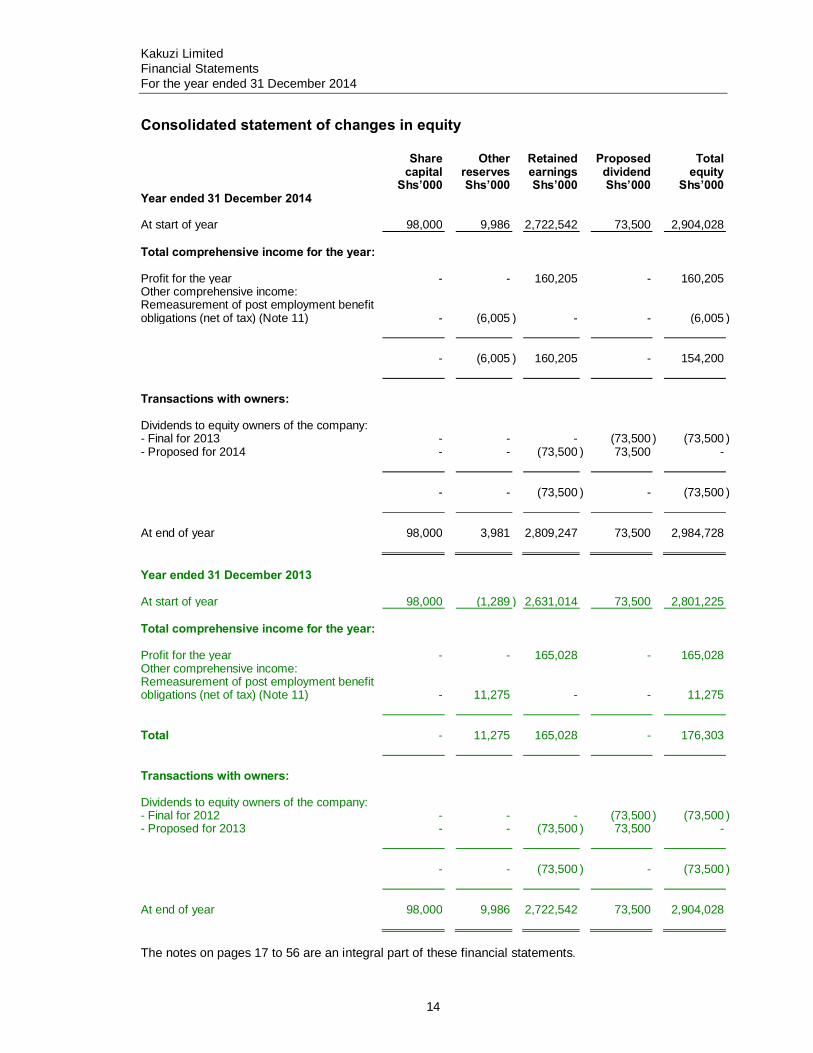
Consolidated statement of changes in equity Share
capital Shs’000
Other reserves Shs’000
Retained earnings Shs’000
Proposed dividend Shs’000
Total equity
Shs’000
Year ended 31 December 2014 At start of year 98,000 9,986 2,722,542 73,500 2,904,028 Total comprehensive income for the year: Profit for the year - - 160,205 - 160,205 Other comprehensive income: Remeasurement of post employment benefit obligations (net of tax) (Note 11)
-
(6,005 )
-
-
(6,005 )
-
(6,005 )
160,205
-
154,200
Transactions with owners: Dividends to equity owners of the company: - Final for 2013 - - - (73,500 ) (73,500 ) - Proposed for 2014 - - (73,500 ) 73,500 -
-
-
(73,500 )
-
(73,500
)
At end of year 98,000 3,981 2,809,247 73,500 2,984,728 Year ended 31 December 2013 At start of year 98,000 (1,289 ) 2,631,014 73,500 2,801,225 Total comprehensive income for the year: Profit for the year - - 165,028 - 165,028 Other comprehensive income: Remeasurement of post employment benefit obligations (net of tax) (Note 11)
-
11,275
-
-
11,275
Total
-
11,275
165,028
-
176,303
Transactions with owners: Dividends to equity owners of the company: - Final for 2012 - - - (73,500 ) (73,500 ) - Proposed for 2013 - - (73,500 ) 73,500 -
-
-
(73,500 )
-
(73,500
)
At end of year 98,000 9,986 2,722,542 73,500 2,904,028 The notes on pages 17 to 56 are an integral part of these financial statements.
Kakuzi Limited Financial Statements For the year ended 31 December 2014
15
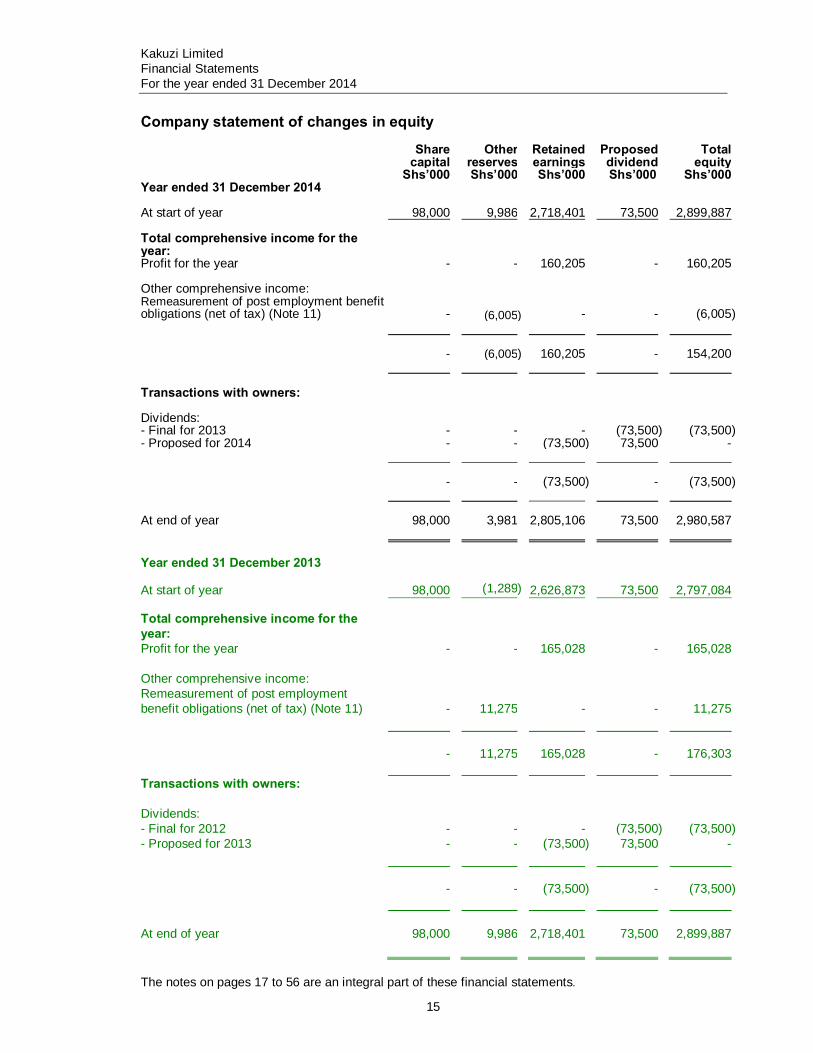
Company statement of changes in equity Share
capital Other
reserves Retained
earnings Proposed
dividend Total
equity
Shs’000 Shs’000 Shs’000 Shs’000 Shs’000 Year ended 31 December 2014 At start of year 98,000 9,986 2,718,401 73,500 2,899,887 Total comprehensive income for the year:
Profit for the year - - 160,205 - 160,205 Other comprehensive income: Remeasurement of post employment benefit obligations (net of tax) (Note 11) - (6,005
) -
-
(6,005 )
- (6,005) 160,205 - 154,200 Transactions with owners: Dividends: - Final for 2013 - - - (73,500) (73,500) - Proposed for 2014 - - (73,500) 73,500 - - - (73,500)
-
(73,500)
At end of year 98,000 3,981 2,805,106 73,500 2,980,587 Year ended 31 December 2013 At start of year 98,000 (1,289) 2,626,873 73,500 2,797,084 Total comprehensive income for the year:
Profit for the year - - 165,028 - 165,028 Other comprehensive income: Remeasurement of post employment benefit obligations (net of tax) (Note 11) - 11,275
-
-
11,275
- 11,275
165,028
-
176,303
Transactions with owners: Dividends: - Final for 2012 - - - (73,500) (73,500) - Proposed for 2013 - - (73,500) 73,500 -
- - (73,500)
-
(73,500)
At end of year 98,000 9,986 2,718,401 73,500 2,899,887 The notes on pages 17 to 56 are an integral part of these financial statements.
Kakuzi Limited Financial Statements For the year ended 31 December 2014
16
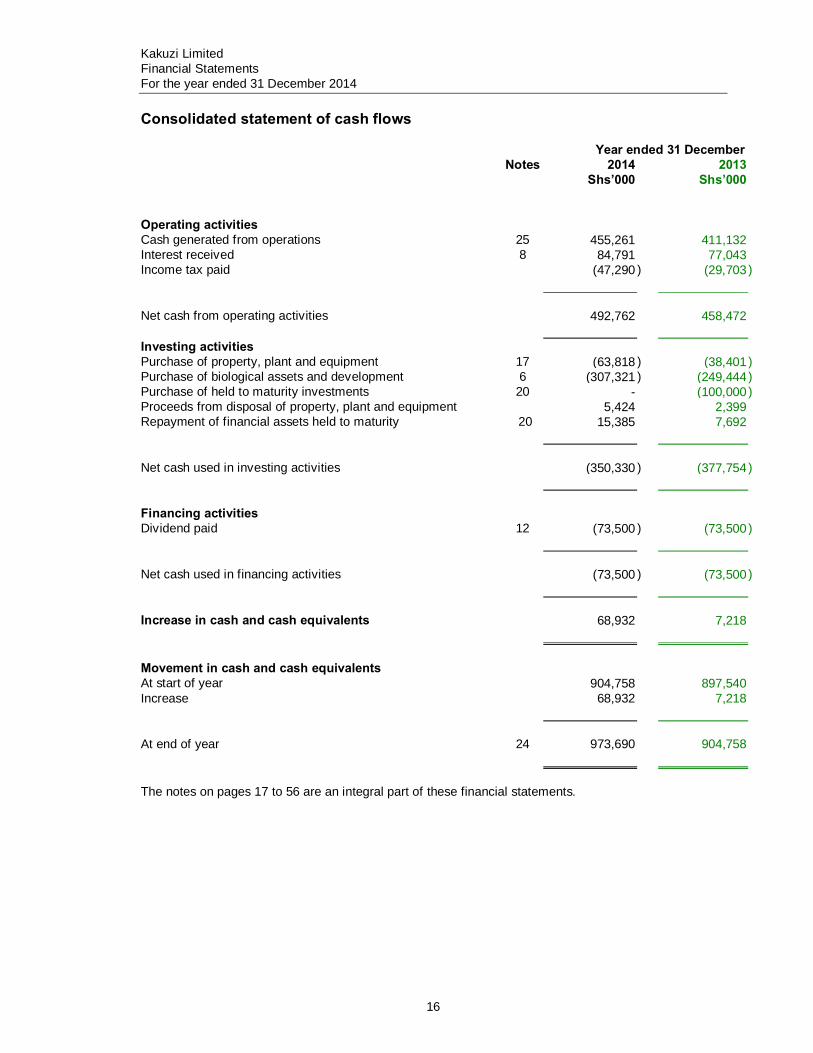
Consolidated statement of cash flows
Year ended 31 December Notes 2014 2013 Shs’000 Shs’000 Operating activities Cash generated from operations 25 455,261 411,132 Interest received 8 84,791 77,043 Income tax paid (47,290 ) (29,703 ) Net cash from operating activities 492,762 458,472 Investing activities Purchase of property, plant and equipment 17 (63,818 ) (38,401 ) Purchase of biological assets and development 6 (307,321 ) (249,444 ) Purchase of held to maturity investments 20 - (100,000 ) Proceeds from disposal of property, plant and equipment 5,424 2,399 Repayment of financial assets held to maturity 20 15,385 7,692 Net cash used in investing activities (350,330 ) (377,754 ) Financing activities Dividend paid 12 (73,500 ) (73,500 ) Net cash used in financing activities (73,500 ) (73,500 ) Increase in cash and cash equivalents 68,932 7,218 Movement in cash and cash equivalents At start of year 904,758 897,540 Increase 68,932 7,218 At end of year 24 973,690 904,758 The notes on pages 17 to 56 are an integral part of these financial statements.
Kakuzi Limited Financial Statements For the year ended 31 December 2014
17
Notes
1 General information Kakuzi Limited is incorporated in Kenya under the Kenyan Companies Act as a public limited liability
company, and is domiciled in Kenya. The address of its registered office is: Main Office Punda Milia Road, Makuyu P O Box 24 01000 THIKA Kenya
The Company’s stock units are listed on the Nairobi Securities Exchange and the London Stock Exchange. For Kenyan Companies Act reporting purposes, the balance sheet is represented by the statement of financial position and the profit or loss by the statement of comprehensive income, in these financial statements.
2 Summary of significant accounting policies The principal accounting policies applied in the preparation of these consolidated financial statements
are set out below. These policies have been consistently applied to all the years presented, unless otherwise stated.
(a) Basis of preparation The financial statements have been prepared in accordance with International Financial Reporting
Standards (IFRS). The measurement basis applied is the historical cost basis, except where otherwise stated in the accounting policies below. The financial statements are presented in Kenya Shillings (Shs), rounded to the nearest thousand. The preparation of financial statements in conformity with IFRS requires the use of certain critical accounting estimates. It also requires the Directors to exercise judgement in the process of applying the Group’s accounting policies. The areas involving a higher degree of judgement or complexity, or where assumptions and estimates are significant to the financial statements, are disclosed in Note 3.
Changes in accounting policy and disclosures (i) New and amended standards adopted by the Group The following are the significant new and amended standards that have been adopted by the Group for
the first time for the financial year beginning 1 January 2014: Amendment to IAS 32, ‘Financial instruments: Presentation’ on offsetting financial assets and financial liabilities. This amendment clarifies that the right of set-off must not be contingent on a future event. It must also be legally enforceable for all counterparties in the normal course of business, as well as in the event of default, insolvency or bankruptcy. The amendment also considers settlement mechanisms. The amendment did not have a significant effect on the Group financial statements. Amendments to IAS 36, ‘Impairment of assets’, on the recoverable amount disclosures for non-financial assets. This amendment removed certain disclosures of the recoverable amount of CGUS (cash generating units) which had been included in IAS 36 by the issue of IFRS 13. The amendment did not have an impact on the Group financial statements.
Kakuzi Limited Financial Statements For the year ended 31 December 2014
18
Notes (continued)
2 Summary of significant accounting policies (continued) (a) Basis of preparation (continued) Changes in accounting policy and disclosures (continued) (i) New and amended standards adopted by the Group (continued) Amendment to IAS 39, ‘Financial instruments: Recognition and measurement’ on the novation of
derivatives and the continuation of hedge accounting. This amendment considers legislative changes to ‘over-the-counter’ derivatives and the establishment of central counterparties. Under IAS 39 novation of derivatives to central counterparties would result in discontinuance of hedge accounting. The amendment provides relief from discontinuing hedge accounting when novation of a hedging instrument meets specified criteria. The amendment did not have a significant effect on the Group financial statements. IFRIC 21, ‘Levies’, sets out the accounting for an obligation to pay a levy if that liability is within the scope of IAS 37 ‘Provisions’. The interpretation addresses what the obligating event is that gives rise to pay a levy and when a liability should be recognised. The amendment did not have a significant effect on the Group financial statements.
(ii) New standards and interpretations not yet adopted A number of new standards and amendments to standards and interpretations are effective for annual
periods beginning after 1 January 2014, and have not been applied in preparing these financial statements. None of these is expected to have a significant effect on the financial statements of the Group, except the following set out below: IFRS 9, ‘Financial instruments’, addresses the classification, measurement and recognition of financial assets and financial liabilities. The complete version of IFRS 9 was issued in July 2014. It replaces the guidance in IAS 39 that relates to the classification and measurement of financial instruments. IFRS 9 retains but simplifies the mixed measurement model and establishes three primary measurement categories for financial assets: amortised cost, fair value through OCI and fair value through P&L. The basis of classification depends on the entity’s business model and the contractual cash flow characteristics of the financial asset. Investments in equity instruments are required to be measured at fair value through statement of comprehensive income with the irrevocable option at inception to present changes in fair value in OCI not recycling. There is now a new expected credit losses model that replaces the incurred loss impairment model used in IAS 39. For financial liabilities there were no changes to classification and measurement except for the recognition of changes in own credit risk in other comprehensive income, for liabilities designated at fair value through income statement of comprehensive income. IFRS 9 relaxes the requirements for hedge effectiveness by replacing the bright line hedge effectiveness tests. It requires an economic relationship between the hedged item and hedging instrument and for the ‘hedged ratio’ to be the same as the one management actually use for risk management purposes. Contemporaneous documentation is still required but is different to that currently prepared under IAS 39. The standard is effective for accounting periods beginning on or after 1 January 2018. Early adoption is permitted. The Company is yet to assess IFRS 9’s full impact on the Group financial statements.
IFRS 15, ‘Revenue from contracts with customers’ deals with revenue recognition and establishes
principles for reporting useful information to users of financial statements about the nature, amount, timing and uncertainty of revenue and cash flows arising from an entity’s contracts with customers. Revenue is recognised when a customer obtains control of a good or service and thus has the ability to direct the use and obtain the benefits from the good or service. The standard replaces IAS 18 ‘Revenue’ and IAS 11 ‘Construction contracts’ and related interpretations. The standard is effective for annual periods beginning on or after 1 January 2017 and earlier application is permitted. The Company is assessing the impact of IFRS 15 to the Group financial statements.
Kakuzi Limited Financial Statements For the year ended 31 December 2014
19
Notes (continued)
2 Summary of significant accounting policies (continued) (a) Basis of preparation (continued) Changes in accounting policy and disclosures (continued) (ii) New standards and interpretations not yet adopted (continued) Amendment to IAS 41, ‘Agriculture’, and IAS 16, Property, plant and equipment. The amendments
change the financial reporting for bearer plants, such as tea bushes, avocado plantations, fruit trees, and flower bushes. A bearer plant is defined as a living plant that is used in the production or supply of agricultural produce, is expected to bear produce for more than one period and has a remote likelihood of being sold as agricultural produce, except for incidental scrap sales. Previously, bearer plants were not defined and bearer plants related to agricultural activity were included within the scope of IAS 41. Bearer plants are used solely to grow produce. The only significant future economic benefits from bearer plants arise from selling the agricultural produce that they create. Bearer plants meet the definition of property, plant and equipment in IAS 16 and their operation is similar to that of manufacturing. Accordingly, the amendments require bearer plants to be accounted for as property, plant and equipment and included within the scope of IAS 16, instead of IAS 41. Biological assets that meet the definition of bearer plants will be measured either at cost or revalued amounts, less accumulated depreciation and impairment losses. Bearer plants are measured at accumulated costs until maturity similar to the accounting for self-constructed items of property, plant and equipment. The produce growing on bearer plants will remain within the scope of IAS 41 and are measured at fair value less costs to sell with changes recognised in the income statement of comprehensive income as the produce grows. The amendments are to be applied retrospectively and are effective for annual periods beginning on or after 1 January 2016. Early application is permitted. Existing IFRS preparers who measure bearer plants at fair value less cost to sell are permitted to use fair value as deemed cost for these assets upon adoption of the amendments.
The Company is still assessing the impact of the amendments to the Group financial statements.
(b) Consolidation of subsidiaries Subsidiaries are all entities (including structured entities) over which the group has control. The Group
controls an entity when the group is exposed to, or has rights to, variable returns from its involvementwith the entity and has the ability to affect those returns through its power over the entity. Subsidiaries are fully consolidated from the date on which control is transferred to the Group. They are deconsolidated from the date that control ceases. Inter-company transactions, balances and unrealised gains on transactions between group companies are eliminated. Unrealised losses are also eliminated unless the transaction provides evidence of an impairment of the asset transferred.
(c) Segment reporting Operating segments are reported in a manner consistent with the internal reporting provided to the
Executive Directors, who are responsible for allocating resources and assessing performance of the operating segments and making strategic decisions.

Kakuzi Limited Financial Statements For the year ended 31 December 2014
20
Notes (continued)
2 Summary of significant accounting policies (continued)
(d) Revenue recognition Revenue comprises the fair value of the consideration received and receivable for the sale of goods
and services in the ordinary course of the Group’s activities. Revenue is shown net of value-added tax (VAT), returns, rebates and discounts and after eliminating sales within the Group. The Group recognises revenue when the amount of revenue can be reliably measured, it is probable that future economic benefits will flow to the Group and when specific criteria have been met for each of the Group’s activities as described below. The amount of revenue is not considered to be reliably measurable until all contingencies relating to the sale have been resolved. The Group bases its estimates on historical results, taking into consideration the type of customer, the type of transaction and the specifics of each arrangement. Revenue is recognised as follows:
i. Sales are recognised upon delivery of products to the customer, the customer has accepted
the products and collectability of the related receivables is reasonably assured. ii. Interest income is recognised using the effective interest method iii. Dividends are recognised as income in the period in which the right to receive payment is
established. (e) Functional currency and translation of foreign currencies (i) Functional and presentation currency Items included in the financial statements are measured using the currency of the primary economic
environment in which the entity operates (‘the functional currency’). The financial statements are presented in Kenyan Shillings which is the Company’s functional currency.
(ii) Transactions and balances Foreign currency transactions are translated into the functional currency of the respective entity using
the exchange rates prevailing at the dates of the transactions. Foreign exchange gains and losses resulting from the settlement of such transactions and from the translation at year-end exchange rates of monetary assets and liabilities denominated in foreign currencies are recognised in the statement of comprehensive income.
Foreign exchange gains and losses that relate to borrowings and cash and cash equivalents are
presented in the income statement of comprehensive income within ‘finance income or cost’. All other foreign exchange gains and losses are presented in the statement of income statement of comprehensive income within ‘other income’ or ‘other expenses’.
(f) Property, plant and equipment All categories of property, plant and equipment are initially recorded at historical cost and subsequently
stated at cost less depreciation. Historical cost includes expenditure that is directly attributable to the acquisition of the items.
Subsequent costs are included in the asset’s carrying amount or recognised as a separate asset, as
appropriate, only when it is probable that future economic benefits associated with the item will flow to the Group and the cost of the item can be measured reliably. All other repairs and maintenance are charged to the income statement within ‘cost of production’ during the financial period in which they are incurred.
Kakuzi Limited Financial Statements For the year ended 31 December 2014
21
Notes (continued)
2 Summary of significant accounting policies (continued) (f) Property, plant and equipment (continued)
Freehold land is not depreciated. Depreciation on other assets is calculated using the straight line
method to write cost to their residual values over their estimated useful life as follows: Buildings, dams and improvements 4 – 40 years Plant and machinery 10 – 13 years Motor vehicles, tractors, trailers and implements 4 – 10 years Furniture, fittings and equipment 3 – 8 years Capital work in progress is not depreciated The assets’ residual values and useful lives are reviewed, and adjusted if appropriate, at each reporting date.
Property, plant and equipment are reviewed for impairment whenever events or changes in
circumstances indicate that the carrying amount may not be recoverable. An impairment loss is recognised for the amount by which the asset’s carrying amount exceeds its recoverable amount. The recoverable amount is the higher of an asset’s fair value less costs to sell and value in use. For the purposes of assessing impairment, assets are grouped at the lowest levels for which there are separately identifiable cash flows (cash-generating units).
Gains and losses on disposal of property, plant and equipment are determined by reference to their
carrying amounts and are taken into account in determining operating profit. (g) Biological assets Biological assets comprise tea, avocado, pineapple, macadamia, timber and livestock. Biological assets are measured on initial recognition and at each reporting date at fair value less costs
to sell. Any gains or losses arising on initial recognition of biological assets and from subsequent changes in fair value less costs to sell are recognised in the statement of comprehensive income in the year in which they arise.
The fair value of livestock is determined based on market prices of livestock of similar age, breed and
genetic merit. The fair value of avocado and mature macadamia is determined based on the net present values of expected future cash flows, discounted at current market-determined pre-tax rates. The discount rate used reflects the cost of capital, an assessment of country risk, and the risk associated with avocado and macadamia. The fair value of other biological assets including tea is based on market prices as valued by an external independent valuer.
Purchases and development of biological assets include cost of planting, breeding and upkeep until
they mature. Subsequently all costs of upkeep and maintenance of mature biological assets are recognised in the statement of comprehensive income within ‘cost of production’ under cost of production in the period in which they are incurred.
(h) Operating leases Leases in which a significant portion of the risks and rewards of ownership are retained by the lessor
are classified as operating leases. Payments made or receipts under operating leases are charged or credited to the statement of comprehensive income within ‘cost of production’ on a straight-line basis over the period of the lease.
Kakuzi Limited Financial Statements For the year ended 31 December 2014
22
Notes (continued)
2 Summary of significant accounting policies (continued) (i) Inventories Inventories are stated at the lower of cost and net realisable value. Agricultural produce at the point of harvest is measured at fair value less costs to sell. Any changes
arising on initial recognition of agricultural produce at fair value less costs to sell are recognised in the statement of comprehensive income in the year in which they arise. The cost of other inventory is determined by the weighted average method. Net realisable value is the estimate of the selling price in the ordinary course of business, less the costs of completion and selling expenses.
(j) Receivables Receivables are amounts due from customers for merchandise sold or services performed in the
ordinary course of business. If collection is expected in one year or less (or in the normal operating cycle of the business if longer), they are classified as current assets. If not, they are presented as non-current assets.
Receivables are recognised initially at fair value and subsequently measured at amortised cost using
the effective interest method. A provision for impairment of receivables is established when there is objective evidence that the Group will not be able to collect all the amounts due according to the original terms of receivables. The amount of the provision is the difference between the carrying amount and the present value of expected cash flows, discounted at the effective interest rate. The amount of the provision is recognised in the statement of comprehensive income within ‘cost of production’.
(k) Payables Payables are obligations to pay for goods and services that have been acquired in the ordinary course
of business from suppliers. Accounts payable are classified as current liabilities if payment is due within one year or less (or in the normal operating cycle of the business if longer). If not, they are presented as non-current liabilities. Payables are recognised initially at fair value and subsequently measured at amortised cost using the effective interest method.
(l) Share capital Stock units are classified as equity. (m) Cash and cash equivalents Cash and cash equivalents include cash in hand, deposits held at call with banks, other short term
highly liquid investments with original maturities of three months or less, and bank overdrafts. Bank overdrafts are shown within borrowings in current liabilities on the statement of financial position.
Kakuzi Limited Financial Statements For the year ended 31 December 2014
23
Notes (continued)
2 Summary of significant accounting policies (continued)
(n) Financial assets The Group classifies its financial assets in the following categories: financial assets at fair value
through profit or loss, loans and receivables, held-to-maturity financial assets, and available-for-sale financial assets. The classification depends on the purpose for which the financial assets were acquired. Management determines the classification of its financial assets at initial recognition and re-evaluates such designation at every reporting date:
(i) Financial assets at fair value through profit or loss
This category has two sub-categories: financial assets held for trading, and those designated at fair value through profit or loss at inception. A financial asset is classified in this category if acquired principally for the purpose of selling in the short term, or if so classifying eliminates or significantly reduces a measurement inconsistency. Derivatives are also categorised as held for trading. Assets in this category are classified as current assets. During the year, the Group did not hold any financial assets in this category.
(ii) Loans and receivables
Loans and receivables are non-derivative financial assets with fixed or determinable payments that are not quoted in an active market. They are included in current assets, except for maturities greater than 12 months after the end of reporting date. These are classified as non-current assets.
(iii) Financial assets held-to-maturity
Financial assets held-to-maturity are non-derivative financial assets with fixed or determinable payments and fixed maturities that the Group’s management has the positive intention and ability to hold to maturity.
(iv) Financial assets available-for-sale
Financial assets available-for-sale are non-derivatives that are either designated in this category or not classified in any of the other categories. They are included in non-current assets unless management intends to dispose of the investment within 12 months of the balance sheet date.
Regular purchases and sales of financial assets are recognised on the trade date, which is the date on
which the Group commits to purchase or sell the asset. Financial assets are initially recognised at fair value, plus transaction costs for all financial assets not carried at fair value through profit or loss. Financial assets carried at fair value through profit or loss are initially recognised at fair value, and transaction costs are expensed. Financial assets are derecognised when the rights to receive cash flows from the financial assets have expired or have been transferred and the Group has transferred substantially all risks and rewards of ownership. Available for-sale financial assets and financial assets at fair value through profit or loss are subsequently carried at fair value. Loans and receivables and held-to-maturity financial assets are carried at amortised cost using the effective interest method. Realised and unrealised gains and losses arising from changes in the fair value of the ‘financial assets at fair value through profit or loss’ category are included in the profit and loss account within other losses/(gains) in the period in which they arise. Unrealised gains and losses arising from changes in the fair value of non-monetary securities classified as available-for-sale are recognised in other comprehensive income. When securities classified as available-for-sale are sold or impaired, the accumulated fair value adjustments are included in the income statement as gains and losses from investment securities.
Kakuzi Limited Financial Statements For the year ended 31 December 2014
24
Notes (continued)
2 Summary of significant accounting policies (continued)
(o) Financial assets (continued)
(iv) Financial assets available-for-sale (continued)
Derivatives, which comprise solely forward foreign exchange contracts, are initially recognised at fair value on the date the derivative contract is entered into and are subsequently measured at fair value. The fair value is determined using forward exchange market rates at the balance sheet date. The derivatives do not qualify for hedge accounting. Changes in the fair value of derivatives are recognised immediately in the profit and loss account.
The fair values of quoted investments are based on current bid prices. If the market for a financial asset is not active (and for unlisted securities), the Group establishes fair value by using valuation techniques. These include the use of recent arm’s length transactions, reference to other instruments that are substantially the same, discounted cash flow analysis and option pricing models refined to reflect theissuer’s specific circumstances. During the year, the Group did not hold any financial assets in this category.
(p) Employee benefits (i) Post employment benefits obligations For unionised employees, the Group has an unfunded obligation to pay terminal gratuities under its
Collective Bargaining Agreement with the union. Employees who resign after completing at least ten years (Nandi Hills employees) or employees who retire and have completed at least five years (Makuyu employees) of service are entitled to twenty one days pay (Nandi Hills employees) or eighteen days (Makuyu employees) for each completed year of service respectively. The liability recognised in the statement of financial position in respect of this defined benefit scheme is the present value of the defined benefit obligation at the reporting date. The obligation is estimated annually using the projected unit credit method by independent actuaries. The present value is determined by discounting the estimated future cash outflows using interest rates of government bonds. The currency and estimated term of these bonds is consistent with the currency and estimated term of the post-employment benefit obligation. The obligation relating to employees who have reached the minimum retirement age and completed the required years of service and are still in employment are classified as payable within the next twelve months.
Remeasurement of post employment benefit obligations arising from experience adjustments and
changes in actuarial assumptions are charged or credited to equity in other comprehensive income in the period in which they arise.
The Group operates a defined contribution post-employment benefit scheme for management
employees. A defined contribution plan is a pension plan under which the Group pays fixed contributions into a separate entity. The Group has no legal or constructive obligations to pay further contributions ifthe fund does not hold sufficient assets to pay all employees the benefits relating to employee service in the current and prior periods.
The assets of the defined contribution post-employment benefit scheme are held in a separate trustee
administered fund, which is funded by contributions from both the Group and the employees. The Group and all its employees also contribute to the statutory National Social Security Fund, which is a defined contribution scheme.
The Group’s contributions to both these defined contribution schemes are charged to the statement of
comprehensive income within ‘cost of production’ in the year in which they fall due. (ii) Other entitlements
The estimated monetary liability for employees’ accrued annual leave entitlement at the reporting date is recognised as an expense accrual.
Kakuzi Limited Financial Statements For the year ended 31 December 2014
25
Notes (continued)
2 Summary of significant accounting policies (continued) (q) Current and deferred income tax The tax expense for the period comprises current and deferred income tax. Tax is recognised in the
statement of comprehensive income except to the extent that it relates to items recognised in other comprehensive income or directly in equity. In this case, the tax is also recognised in other comprehensive income or directly in equity respectively.
(i) Current income tax
The current income tax charge is calculated on the basis of the tax enacted or substantively enacted at the reporting date. Directors periodically evaluate positions taken in tax returns with respect to situations in which applicable tax regulation is subject to interpretation. It establishes provisions where appropriate on the basis of amounts expected to be paid to the tax authorities.
(ii) Deferred income tax
Deferred income tax is recognised, using the liability method, on temporary differences arising between the tax bases of assets and liabilities and their carrying values in the financial statements. However, if the deferred tax liabilities are not recognised if they arise from the initial recognition of goodwill; deferred income tax is not accounted for if it arises from initial recognition of an asset or liability in a transaction other than a business combination that at the time of the transaction affects neither accounting nor taxable income statement of comprehensive income. Deferred income tax is determined using tax rates and laws that have been enacted or substantively enacted at the reporting date and are expected to apply when the related deferred income tax liability is settled. Deferred income tax assets are recognised only to the extent that it is probable that future taxable profits will be available against which the temporary differences can be utilised.
Deferred income tax is provided on temporary differences arising on investments in subsidiaries and
associates, except where the timing of the reversal of the temporary difference is controlled by the Groupand it is probable that the temporary difference will not reverse in the foreseeable future. Deferred income tax assets and liabilities are offset when there is a legally enforceable right to offset current tax assets against current tax liabilities and when the deferred income taxes assets and liabilities relate to income taxes levied by the same taxation authority on either the same taxable entity or different taxable entities where there is an intention to settle the balances on a net basis.
(r) Borrowings Borrowings are recognised initially at fair value, net of transaction costs incurred. Borrowings are
subsequently stated at amortised cost using the effective interest method; any differences between proceeds (net of transaction costs) and the redemption value is recognised in the statement of comprehensive income within ‘cost of production’ over the period of the borrowings. Borrowings are classified as current liabilities unless the company has an unconditional right to defer settlement of the liability for at least 12 months after the reporting date.
(s) Dividends Dividends on stock units are charged to equity in the period in which they are declared. Proposed
dividends are shown as a separate component of equity until declared.
Kakuzi Limited Financial Statements For the year ended 31 December 2014
26
Notes (continued)
3 Critical accounting estimates and judgements The estimates and assumptions that have significant risk of causing a material adjustment to the carrying
amounts of assets and liabilities within the next financial year are addressed below: Estimates and judgements are continually evaluated and are based on historical experience and other
factors, including experience of future events that are believed to be reasonable under the circumstances.
(a) Critical accounting estimates and assumptions (i) Biological assets
Critical assumptions are made by the directors and the independent valuer in determining the fair values of biological assets. The key assumptions are set out in Note 6.
(ii) Post employment benefits obligations
Critical assumptions are made by the actuary in determining the present value of the service gratuities to non-management employees. The carrying amount of the provision and the key assumptions made in estimating the provision are set out in Note 16.
(b) Critical judgements in applying the entity’s accounting policies In the process of applying the Company’s accounting policies, the Directors have made judgements in
determining:
• the classification of financial assets and leases • whether financial and non-financial assets are impaired • the recoverability of tax assets.
4 Financial risk management objectives and policies The Group’s activities expose it to a variety of financial risks, including credit risk, liquidity risk, prices for
its agricultural produce, foreign currency exchange rates and interest rates. The Group’s overall risk management programme focuses on the unpredictability of financial and agricultural markets and seeks to minimise potential adverse effects on its financial performance, but the Group does not hedge any risks. Financial risk management is carried out by the finance department under policies approved by theBoard of Directors. These policies provide principles for overall risk management, as well as policies covering specific areas such as foreign exchange risk, interest rate risk and credit risk.
Market risk (i) Foreign exchange risk
The Group operates internationally and is exposed to foreign exchange risk arising from various currency exposures, primarily with respect to the US dollar and Euro. Foreign exchange risk arises from future commercial transactions, and recognised assets and liabilities. At 31 December 2014, if the Shilling was weaker/stronger by 5% (2013: 5%) against the US dollar with all other variables held constant, the consolidated post tax profit would have been Shs 4,855,231 (2013: Sh112,561) higher/lower mainly as a result of US dollar deposits and trade receivables.
At 31 December 2014 if the Shilling was weaker/stronger by 5% (2013: 5%) against the Euro with all
other variables held constant, the consolidated post tax profit would have been Shs 4,941,650higher/lower (2013: Sh493,730) mainly as a result of Euro deposits.
(ii) Price risk
The Group does not hold any financial instruments subject to price risk.
Kakuzi Limited Financial Statements For the year ended 31 December 2014
27
Notes (continued)
4 Financial risk management objectives and policies (continued) Market risk (continued) (iii) Interest rate risk
The Group has borrowings and bank overdraft facilities at variable rates, which exposes the Group to cash flow interest rate risk. The Group regularly monitors financing options available to ensure optimum interest rates are obtained. For the year ended 31 December 2014, an increase/decrease of 5% (2013: 5%) would have resulted in a decrease/increase in post tax profit of Shs Nil (2013: Shs Nil).
The Group has interest earning deposits, whose income would be subject to interest rate risk. An increase/decrease in interest rates of 5% (2013: 5%) would have resulted in an increase/decrease in post tax profit of Shs 6,653,648 (2013: Shs 5,140,279).
Credit risk
Credit risk arises from deposits with banks, as well as trade and other receivables. The Group does not have any significant concentrations of credit risk. The Group has policies in place to ensure that sales are made to customers with an appropriate credit history. The amount that best represents the Group’s and company’s maximum exposure to credit risk at 31 December 2014 is the carrying value of the financial assets in the statement of financial position.
Collateral is held only for staff loans amounting to Shs 24,425,771 (2013: Shs 20,492,420) included in
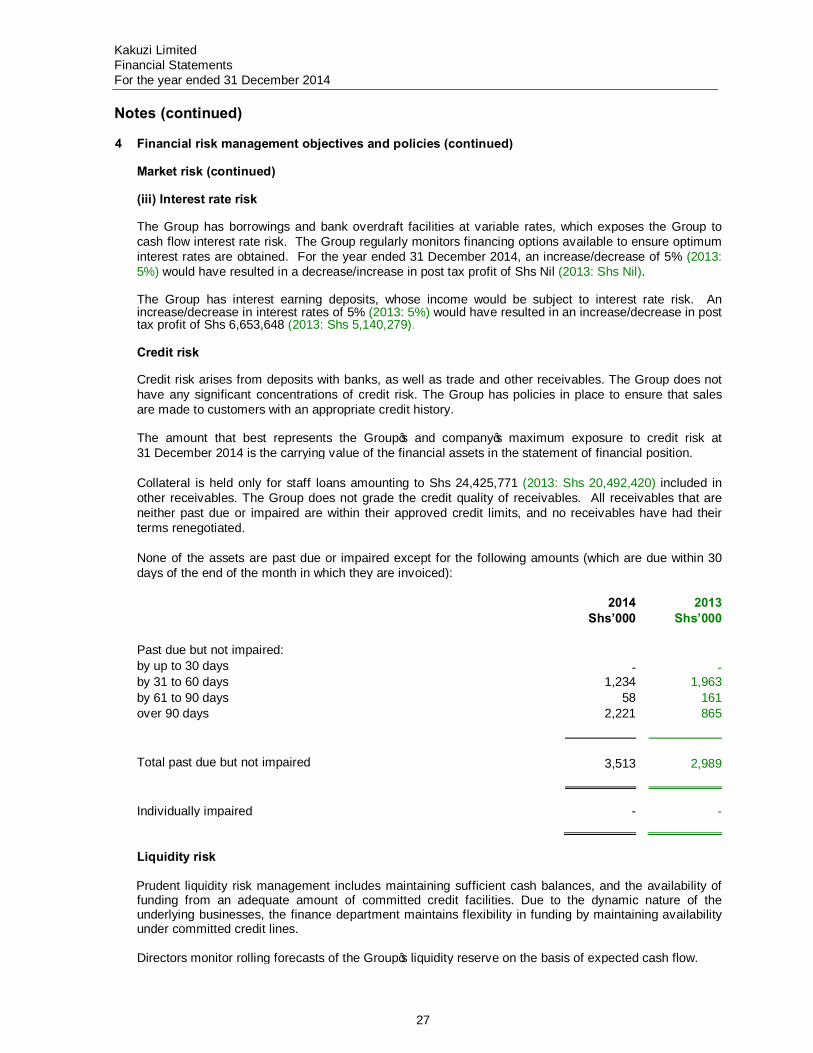
other receivables. The Group does not grade the credit quality of receivables. All receivables that are neither past due or impaired are within their approved credit limits, and no receivables have had their terms renegotiated. None of the assets are past due or impaired except for the following amounts (which are due within 30 days of the end of the month in which they are invoiced):
2014 2013 Shs’000 Shs’000 Past due but not impaired: by up to 30 days - - by 31 to 60 days 1,234 1,963 by 61 to 90 days 58 161 over 90 days 2,221 865 Total past due but not impaired 3,513 2,989 Individually impaired - -
Liquidity risk
Prudent liquidity risk management includes maintaining sufficient cash balances, and the availability of funding from an adequate amount of committed credit facilities. Due to the dynamic nature of the underlying businesses, the finance department maintains flexibility in funding by maintaining availability under committed credit lines.
Directors monitor rolling forecasts of the Group’s liquidity reserve on the basis of expected cash flow.
Kakuzi Limited Financial Statements For the year ended 31 December 2014
28
Notes (continued)
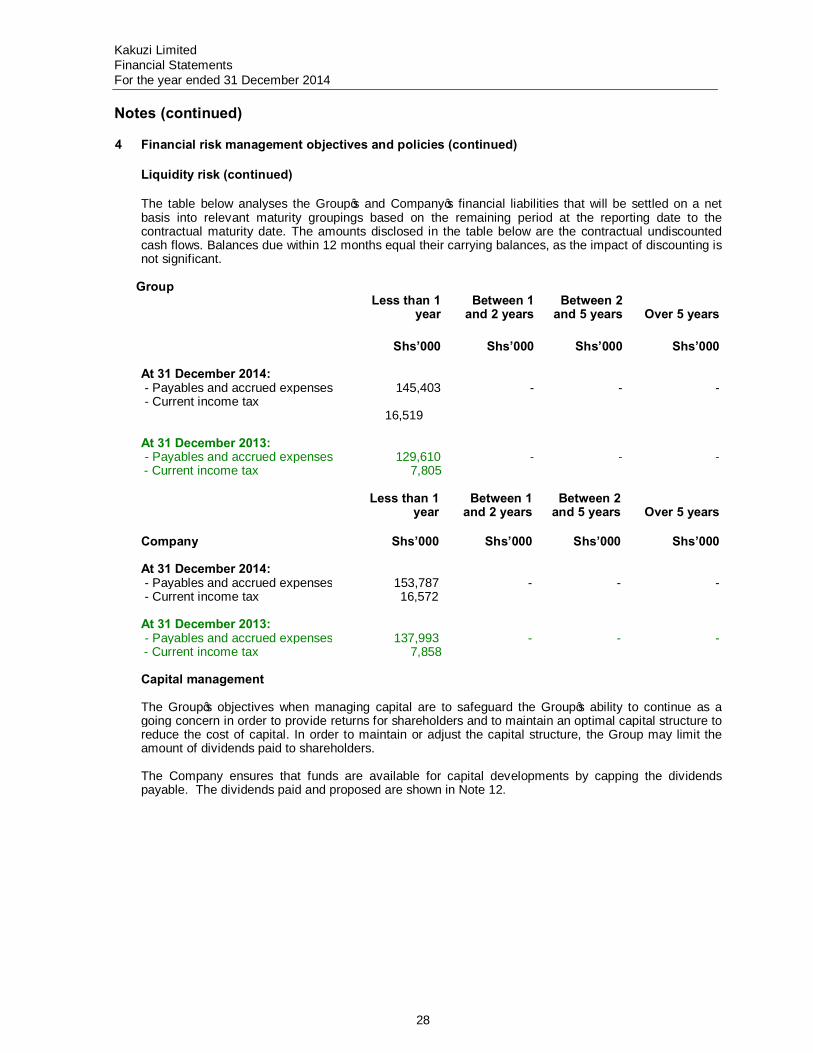
4 Financial risk management objectives and policies (continued) Liquidity risk (continued)
The table below analyses the Group’s and Company’s financial liabilities that will be settled on a net basis into relevant maturity groupings based on the remaining period at the reporting date to the contractual maturity date. The amounts disclosed in the table below are the contractual undiscounted cash flows. Balances due within 12 months equal their carrying balances, as the impact of discounting is not significant.
Group
Less than 1 year
Between 1 and 2 years
Between 2 and 5 years
Over 5 years
Shs’000 Shs’000 Shs’000 Shs’000 At 31 December 2014: - Payables and accrued expenses 145,403 - - - - Current income tax
16,519
At 31 December 2013:
- Payables and accrued expenses 129,610 - - - - Current income tax 7,805
Less than 1 year
Between 1 and 2 years
Between 2 and 5 years
Over 5 years
Company Shs’000 Shs’000 Shs’000 Shs’000 At 31 December 2014: - Payables and accrued expenses 153,787 - - - - Current income tax 16,572
At 31 December 2013:
- Payables and accrued expenses 137,993 - - - - Current income tax 7,858
Capital management
The Group’s objectives when managing capital are to safeguard the Group’s ability to continue as a
going concern in order to provide returns for shareholders and to maintain an optimal capital structure to reduce the cost of capital. In order to maintain or adjust the capital structure, the Group may limit the amount of dividends paid to shareholders.
The Company ensures that funds are available for capital developments by capping the dividends
payable. The dividends paid and proposed are shown in Note 12.
Kakuzi Limited Financial Statements For the year ended 31 December 2014
29
Notes (continued)
4 Financial risk management objectives and policies (continued)
Fair value estimation
IFRS 13 requires disclosure of fair value measurements by level of the following fair value measurement hierarchy:
• Quoted prices (unadjusted) in active markets for identical assets or liabilities (level 1). • Inputs other than quoted prices included within level 1 that are observable for the asset or liability, either directly (that is, as prices) or indirectly (that is, derived from prices) (level 2). • Inputs for the asset or liability that are not based on observable market data (that is, unobservable inputs) (level 3).
The fair value of financial instruments that are not traded in an active market (for example, over-the-counter derivatives) is determined by using valuation techniques. These valuation techniques maximise the use of observable market data where it is available and rely as little as possible on entity specific estimates. If all significant inputs required to fair value an instrument are observable, the instrument is included in level 2.
Kakuzi Limited Financial Statements For the year ended 31 December 2014
30
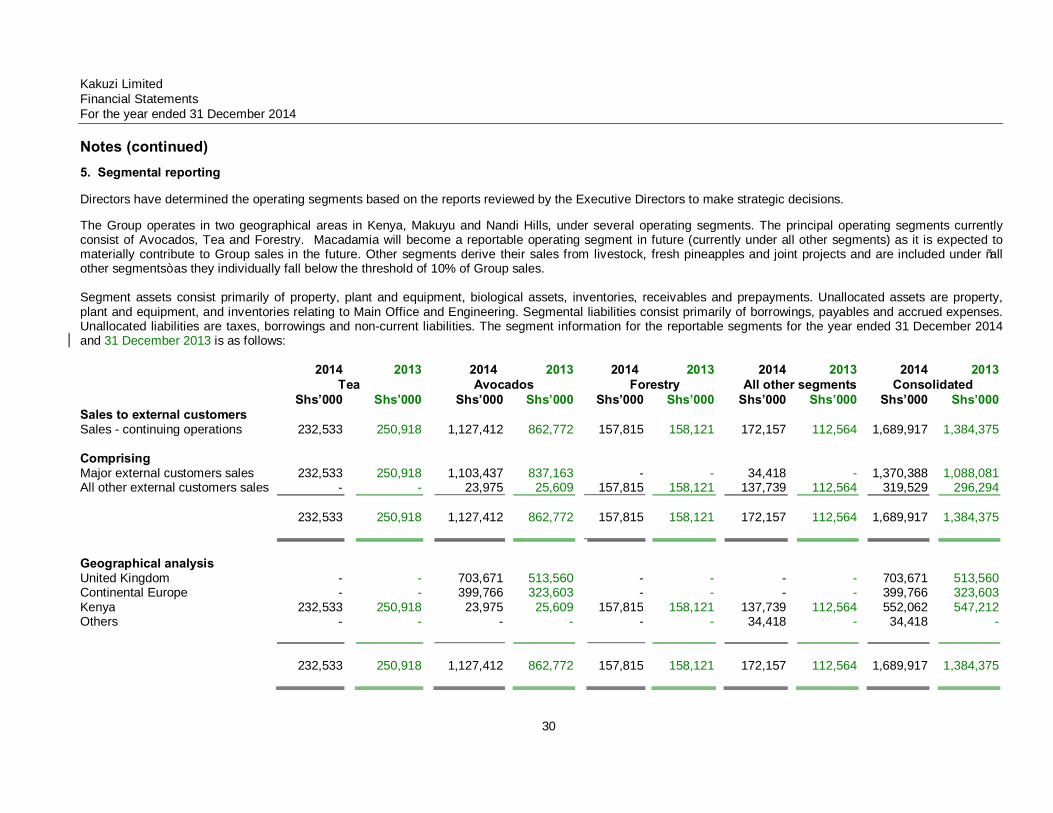
Notes (continued)
5. Segmental reporting Directors have determined the operating segments based on the reports reviewed by the Executive Directors to make strategic decisions. The Group operates in two geographical areas in Kenya, Makuyu and Nandi Hills, under several operating segments. The principal operating segments currently consist of Avocados, Tea and Forestry. Macadamia will become a reportable operating segment in future (currently under all other segments) as it is expected to materially contribute to Group sales in the future. Other segments derive their sales from livestock, fresh pineapples and joint projects and are included under “all other segments” as they individually fall below the threshold of 10% of Group sales. Segment assets consist primarily of property, plant and equipment, biological assets, inventories, receivables and prepayments. Unallocated assets are property, plant and equipment, and inventories relating to Main Office and Engineering. Segmental liabilities consist primarily of borrowings, payables and accrued expenses. Unallocated liabilities are taxes, borrowings and non-current liabilities. The segment information for the reportable segments for the year ended 31 December 2014 and 31 December 2013 is as follows: 2014 2013 2014 2013 2014 2013 2014 2013 2014 2013 Tea Avocados Forestry All other segments Consolidated Shs’000 Shs’000 Shs’000 Shs’000 Shs’000 Shs’000 Shs’000 Shs’000 Shs’000 Shs’000 Sales to external customers Sales - continuing operations 232,533 250,918 1,127,412 862,772 157,815 158,121 172,157 112,564 1,689,917 1,384,375 Comprising Major external customers sales 232,533 250,918 1,103,437 837,163 - - 34,418 - 1,370,388 1,088,081 All other external customers sales - - 23,975 25,609 157,815 158,121 137,739 112,564 319,529 296,294 232,533 250,918 1,127,412 862,772 157,815 158,121 172,157 112,564 1,689,917 1,384,375 Geographical analysis United Kingdom - - 703,671 513,560 - - - - 703,671 513,560 Continental Europe - - 399,766 323,603 - - - - 399,766 323,603 Kenya 232,533 250,918 23,975 25,609 157,815 158,121 137,739 112,564 552,062 547,212 Others - - - - - - 34,418 - 34,418 - 232,533 250,918 1,127,412 862,772 157,815 158,121 172,157 112,564 1,689,917 1,384,375
Kakuzi Limited Financial Statements For the year ended 31 December 2014
31
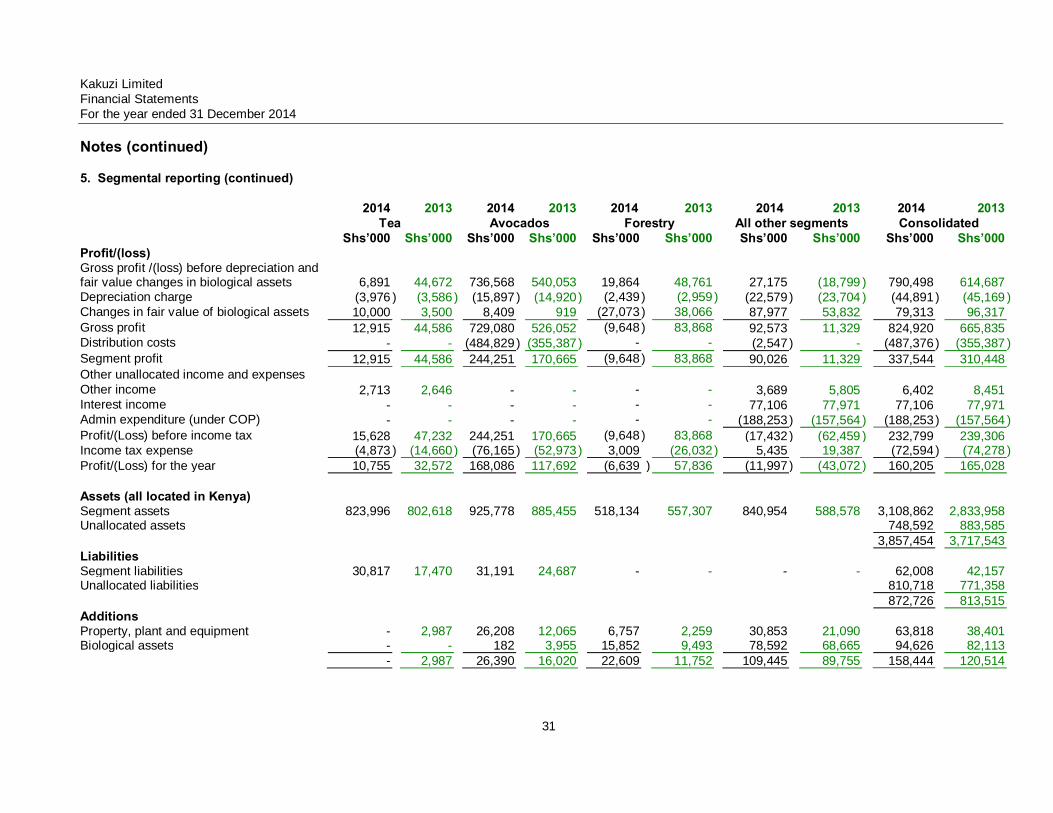
Notes (continued)
5. Segmental reporting (continued) 2014 2013 2014 2013 2014 2013 2014 2013 2014 2013 Tea Avocados Forestry All other segments Consolidated Shs’000 Shs’000 Shs’000 Shs’000 Shs’000 Shs’000 Shs’000 Shs’000 Shs’000 Shs’000 Profit/(loss) Gross profit /(loss) before depreciation and fair value changes in biological assets 6,891 44,672 736,568 540,053
19,864
48,761
27,175 (18,799 ) 790,498
614,687
Depreciation charge (3,976 ) (3,586 ) (15,897 ) (14,920 ) (2,439 ) (2,959 ) (22,579 ) (23,704 ) (44,891 ) (45,169 ) Changes in fair value of biological assets 10,000 3,500 8,409 919 (27,073 ) 38,066 87,977 53,832 79,313 96,317 Gross profit 12,915 44,586 729,080 526,052 (9,648 ) 83,868 92,573 11,329 824,920 665,835 Distribution costs - - (484,829 ) (355,387 ) - - (2,547 ) - (487,376 ) (355,387 ) Segment profit 12,915 44,586 244,251 170,665 (9,648 ) 83,868 90,026 11,329 337,544 310,448 Other unallocated income and expenses Other income 2,713 2,646 - - - - 3,689 5,805 6,402 8,451 Interest income - - - - - - 77,106 77,971 77,106 77,971 Admin expenditure (under COP) - - - - - - (188,253 ) (157,564 ) (188,253 ) (157,564 ) Profit/(Loss) before income tax 15,628 47,232 244,251 170,665 (9,648 ) 83,868 (17,432 ) (62,459 ) 232,799 239,306 Income tax expense (4,873 ) (14,660 ) (76,165 ) (52,973 ) 3,009 (26,032 ) 5,435 19,387 (72,594 ) (74,278 ) Profit/(Loss) for the year 10,755 32,572 168,086 117,692 (6,639 ) 57,836 (11,997 ) (43,072 ) 160,205 165,028 Assets (all located in Kenya) Segment assets 823,996 802,618 925,778 885,455 518,134 557,307 840,954 588,578 3,108,862 2,833,958 Unallocated assets 748,592 883,585 3,857,454 3,717,543 Liabilities Segment liabilities 30,817 17,470 31,191 24,687 - - - - 62,008 42,157 Unallocated liabilities 810,718 771,358 872,726 813,515 Additions Property, plant and equipment - 2,987 26,208 12,065 6,757 2,259 30,853 21,090 63,818 38,401 Biological assets - - 182 3,955 15,852 9,493 78,592 68,665 94,626 82,113 - 2,987 26,390 16,020 22,609 11,752 109,445 89,755 158,444 120,514
Kakuzi Limited Financial Statements For the year ended 31 December 2014
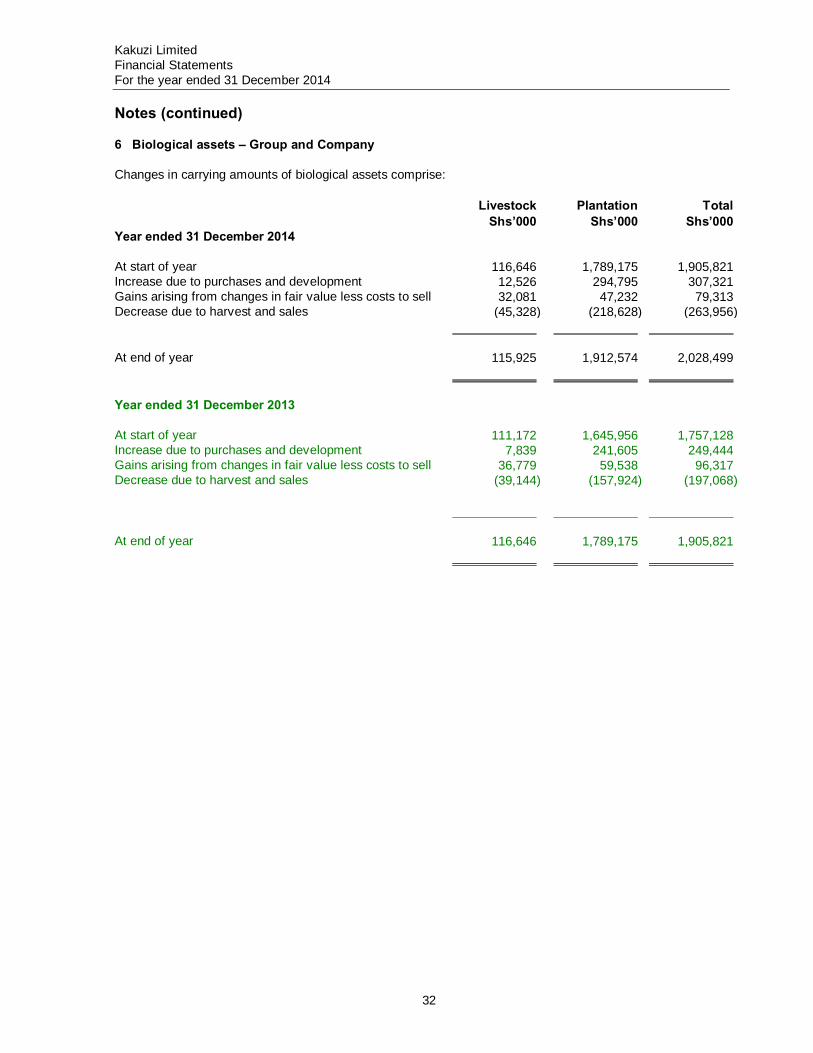
32
Notes (continued) 6 Biological assets – Group and Company Changes in carrying amounts of biological assets comprise: Livestock Plantation Total Shs’000 Shs’000 Shs’000 Year ended 31 December 2014 At start of year 116,646 1,789,175 1,905,821Increase due to purchases and development 12,526 294,795 307,321Gains arising from changes in fair value less costs to sell 32,081 47,232 79,313Decrease due to harvest and sales (45,328) (218,628) (263,956) At end of year 115,925 1,912,574 2,028,499 Year ended 31 December 2013 At start of year 111,172 1,645,956 1,757,128Increase due to purchases and development 7,839 241,605 249,444Gains arising from changes in fair value less costs to sell 36,779 59,538 96,317Decrease due to harvest and sales (39,144) (157,924) (197,068) At end of year 116,646 1,789,175 1,905,821
Kakuzi Limited Financial Statements For the year ended 31 December 2014
33
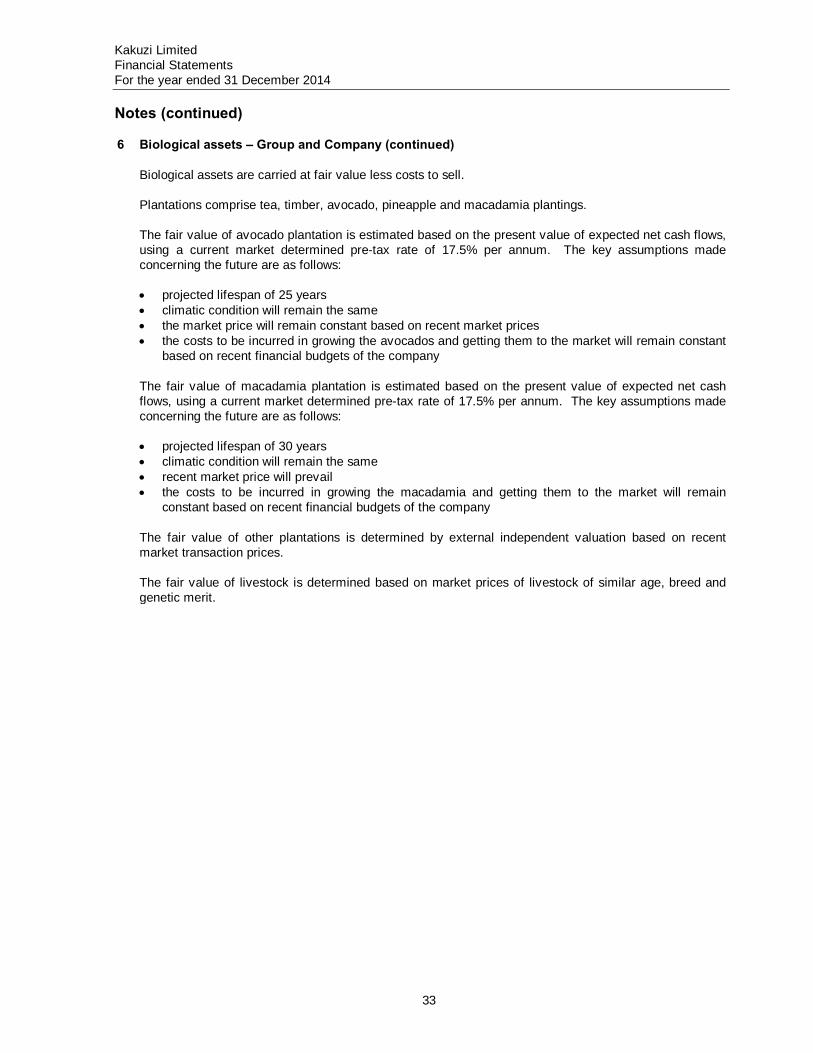
Notes (continued) 16 Biological assets – Group and Company (continued) Biological assets are carried at fair value less costs to sell.
Plantations comprise tea, timber, avocado, pineapple and macadamia plantings. The fair value of avocado plantation is estimated based on the present value of expected net cash flows,using a current market determined pre-tax rate of 17.5% per annum. The key assumptions made concerning the future are as follows: • projected lifespan of 25 years • climatic condition will remain the same • the market price will remain constant based on recent market prices • the costs to be incurred in growing the avocados and getting them to the market will remain constant
based on recent financial budgets of the company The fair value of macadamia plantation is estimated based on the present value of expected net cash flows, using a current market determined pre-tax rate of 17.5% per annum. The key assumptions made concerning the future are as follows: • projected lifespan of 30 years • climatic condition will remain the same • recent market price will prevail • the costs to be incurred in growing the macadamia and getting them to the market will remain
constant based on recent financial budgets of the company The fair value of other plantations is determined by external independent valuation based on recent market transaction prices. The fair value of livestock is determined based on market prices of livestock of similar age, breed and genetic merit.
Kakuzi Limited Financial Statements For the year ended 31 December 2014
34
Notes (continued) 6 Biological assets – Group and Company (continued)
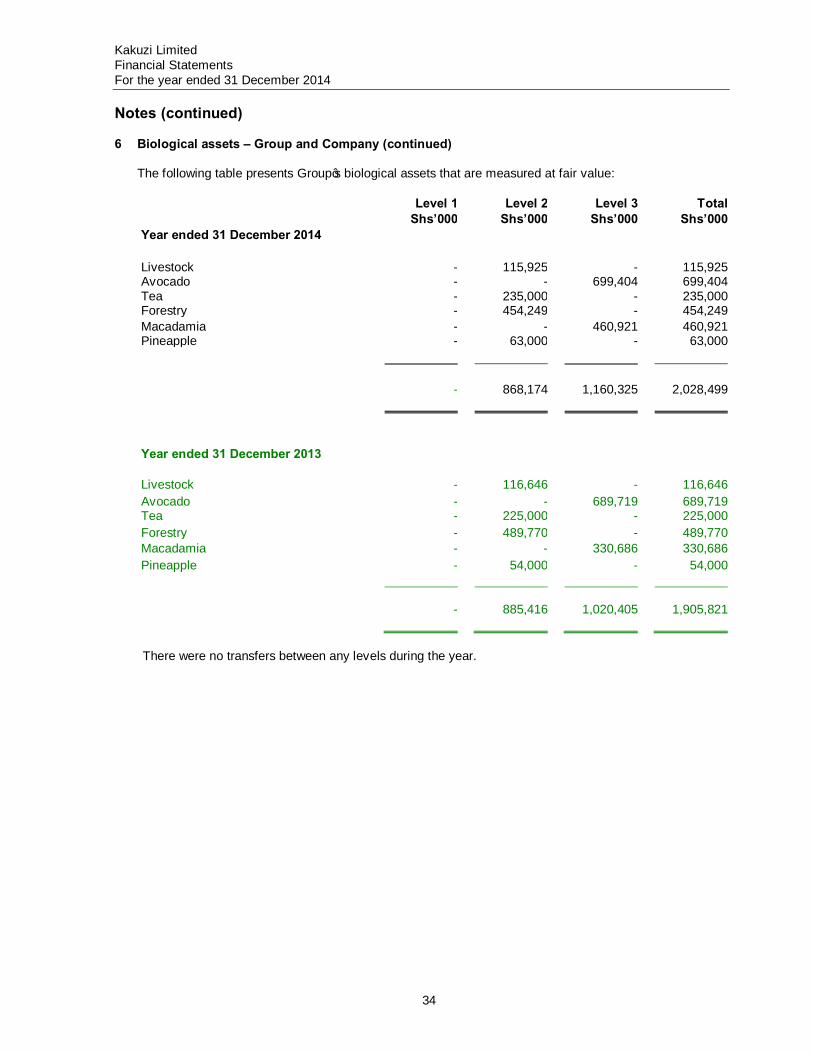
The following table presents Group’s biological assets that are measured at fair value:
Level 1 Level 2 Level 3 Total Shs’000 Shs’000 Shs’000 Shs’000 Year ended 31 December 2014 Livestock - 115,925 - 115,925Avocado - - 699,404 699,404Tea - 235,000 - 235,000Forestry - 454,249 - 454,249Macadamia - - 460,921 460,921Pineapple - 63,000 - 63,000 - 868,174 1,160,325 2,028,499 Year ended 31 December 2013 Livestock - 116,646 - 116,646Avocado - - 689,719 689,719Tea - 225,000 - 225,000Forestry - 489,770 - 489,770 Macadamia - - 330,686 330,686 Pineapple - 54,000 - 54,000 - 885,416 1,020,405 1,905,821
There were no transfers between any levels during the year.
Kakuzi Limited Financial Statements For the year ended 31 December 2014
35
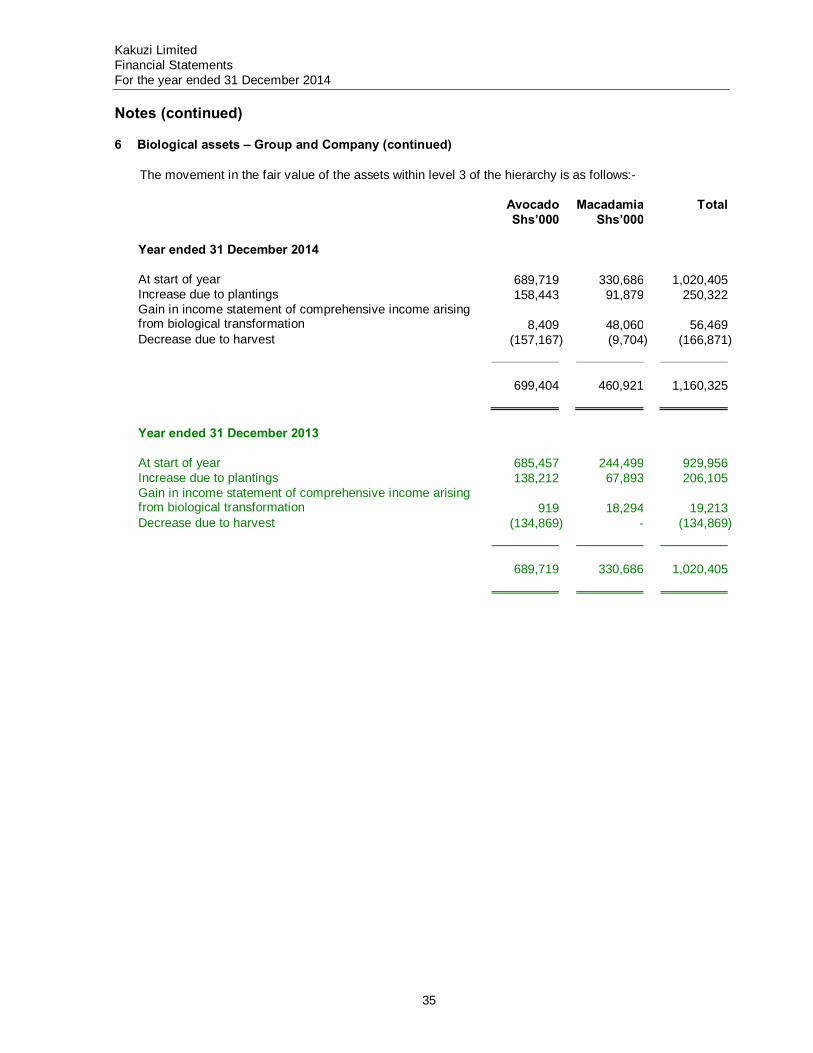
Notes (continued) 6 Biological assets – Group and Company (continued) The movement in the fair value of the assets within level 3 of the hierarchy is as follows:-
Avocado Macadamia Total Shs’000 Shs’000 Year ended 31 December 2014 At start of year 689,719 330,686 1,020,405 Increase due to plantings 158,443 91,879 250,322 Gain in income statement of comprehensive income arising from biological transformation 8,409
48,060
56,469
Decrease due to harvest (157,167) (9,704) (166,871) 699,404 460,921 1,160,325
Year ended 31 December 2013 At start of year 685,457 244,499 929,956 Increase due to plantings 138,212 67,893 206,105 Gain in income statement of comprehensive income arising from biological transformation 919
18,294
19,213
Decrease due to harvest (134,869) - (134,869) 689,719 330,686 1,020,405
Kakuzi Limited Financial Statements For the year ended 31 December 2014
36
Notes (continued) 6 Biological assets – Group and Company (continued)
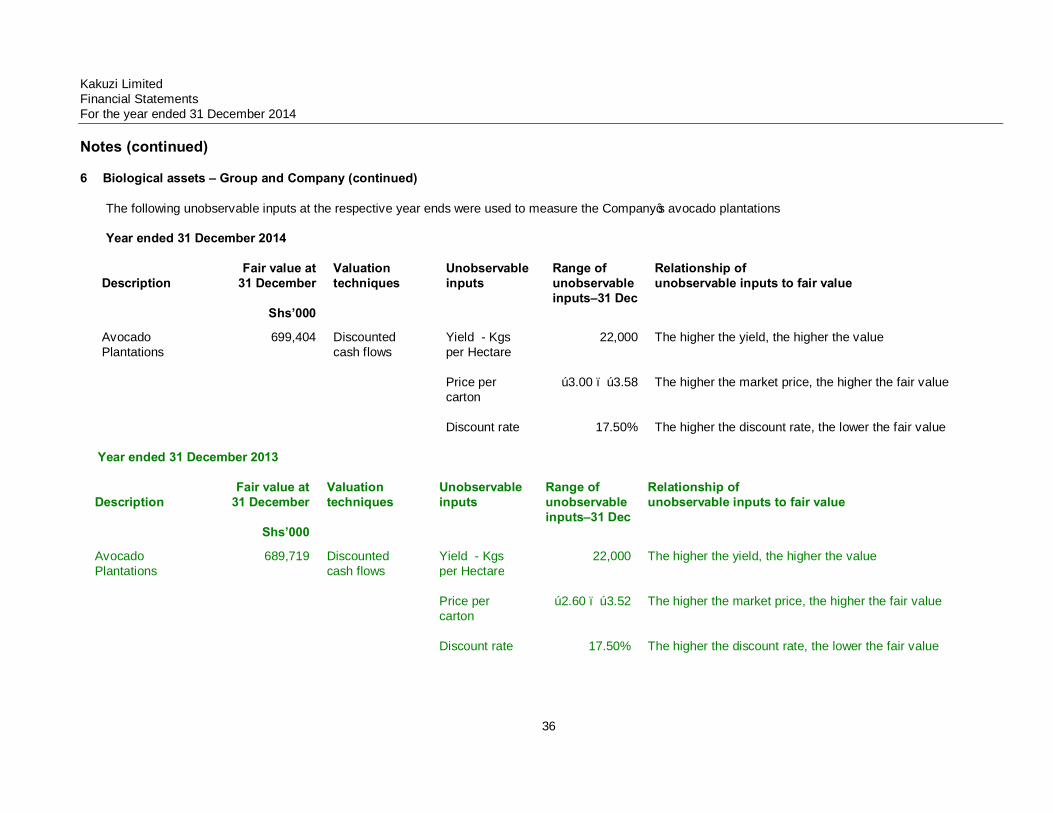
The following unobservable inputs at the respective year ends were used to measure the Company’s avocado plantations Year ended 31 December 2014
Description
Fair value at 31 December
Shs’000
Valuation techniques
Unobservable inputs
Range of unobservable inputs–31 Dec
Relationship of unobservable inputs to fair value
Avocado Plantations
699,404 Discounted cash flows
Yield - Kgs per Hectare
22,000 The higher the yield, the higher the value
Price per carton
€3.00 – €3.58
The higher the market price, the higher the fair value
Discount rate 17.50% The higher the discount rate, the lower the fair value
Year ended 31 December 2013 Description
Fair value at 31 December
Shs’000
Valuation techniques
Unobservable inputs
Range of unobservable inputs–31 Dec
Relationship of unobservable inputs to fair value
Avocado Plantations
689,719 Discounted cash flows
Yield - Kgs per Hectare
22,000 The higher the yield, the higher the value
Price per carton
€2.60 – €3.52
The higher the market price, the higher the fair value
Discount rate 17.50% The higher the discount rate, the lower the fair value
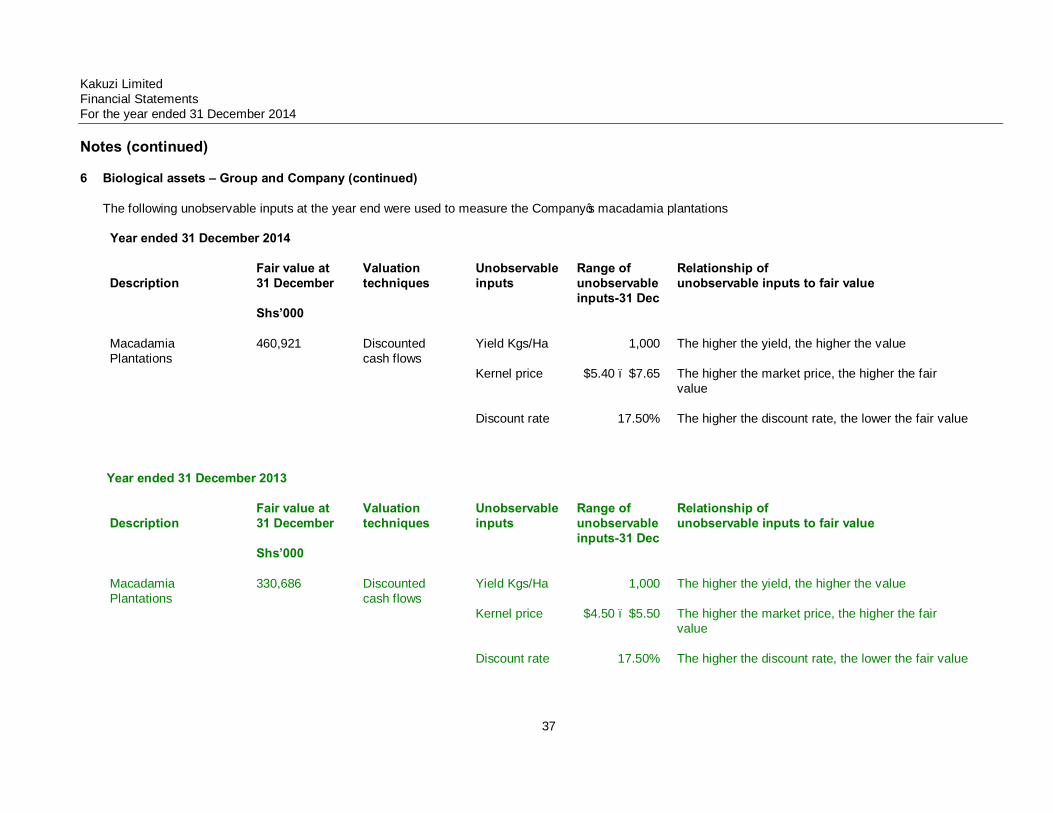
Kakuzi Limited Financial Statements For the year ended 31 December 2014
37
Notes (continued) 6 Biological assets – Group and Company (continued)
The following unobservable inputs at the year end were used to measure the Company’s macadamia plantations Year ended 31 December 2014
Description
Fair value at 31 December Shs’000
Valuation techniques
Unobservable inputs
Range of unobservable inputs-31 Dec
Relationship of unobservable inputs to fair value
Macadamia Plantations
460,921 Discounted cash flows
Yield Kgs/Ha 1,000 The higher the yield, the higher the value
Kernel price $5.40 – $7.65 The higher the market price, the higher the fair value
Discount rate 17.50% The higher the discount rate, the lower the fair value
Year ended 31 December 2013
Description
Fair value at 31 December Shs’000
Valuation techniques
Unobservable inputs
Range of unobservable inputs-31 Dec
Relationship of unobservable inputs to fair value
Macadamia Plantations
330,686 Discounted cash flows
Yield Kgs/Ha 1,000 The higher the yield, the higher the value
Kernel price $4.50 – $5.50 The higher the market price, the higher the fair value
Discount rate 17.50% The higher the discount rate, the lower the fair value
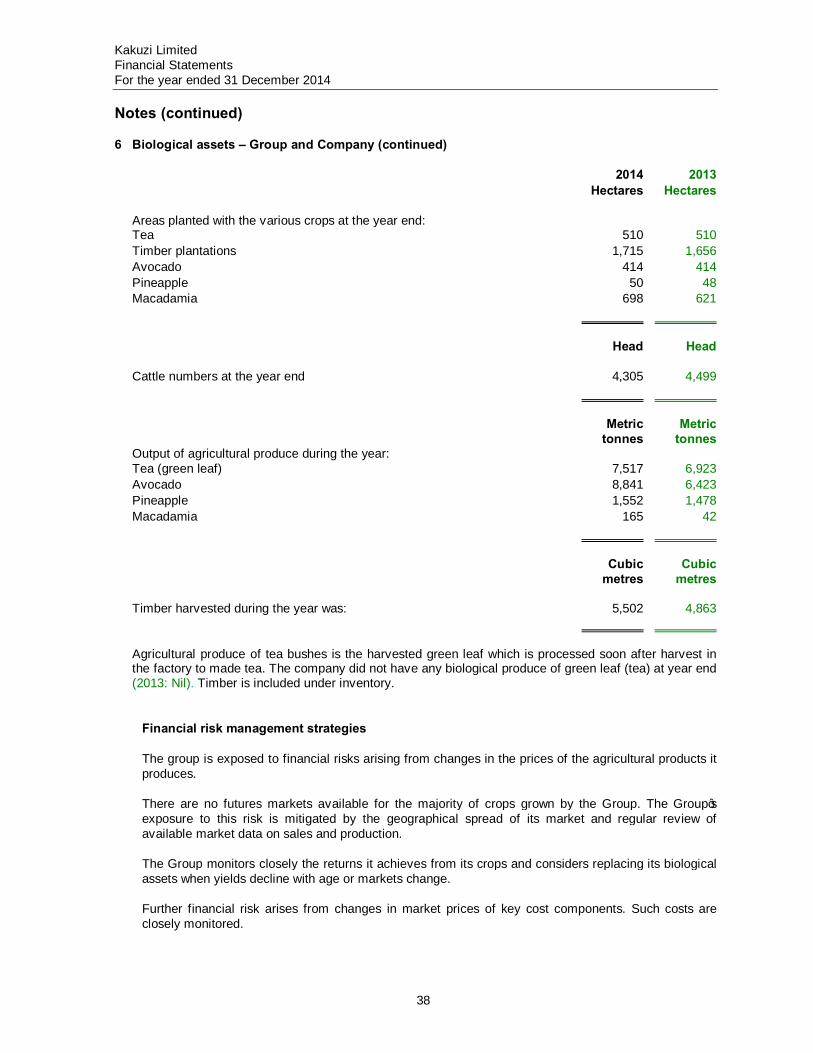
Kakuzi Limited Financial Statements For the year ended 31 December 2014
38
Notes (continued) 6 Biological assets – Group and Company (continued) 2014 2013 Hectares Hectares Areas planted with the various crops at the year end: Tea 510 510 Timber plantations 1,715 1,656 Avocado 414 414 Pineapple 50 48 Macadamia 698 621 Head Head Cattle numbers at the year end 4,305 4,499 Metric
tonnes Metric
tonnes
Output of agricultural produce during the year: Tea (green leaf) 7,517 6,923 Avocado 8,841 6,423 Pineapple 1,552 1,478 Macadamia 165 42 Cubic
metres Cubic
metres
Timber harvested during the year was: 5,502 4,863 Agricultural produce of tea bushes is the harvested green leaf which is processed soon after harvest in
the factory to made tea. The company did not have any biological produce of green leaf (tea) at year end (2013: Nil). Timber is included under inventory.
Financial risk management strategies
The group is exposed to financial risks arising from changes in the prices of the agricultural products it produces. There are no futures markets available for the majority of crops grown by the Group. The Group’s exposure to this risk is mitigated by the geographical spread of its market and regular review of available market data on sales and production. The Group monitors closely the returns it achieves from its crops and considers replacing its biological assets when yields decline with age or markets change. Further financial risk arises from changes in market prices of key cost components. Such costs are closely monitored.
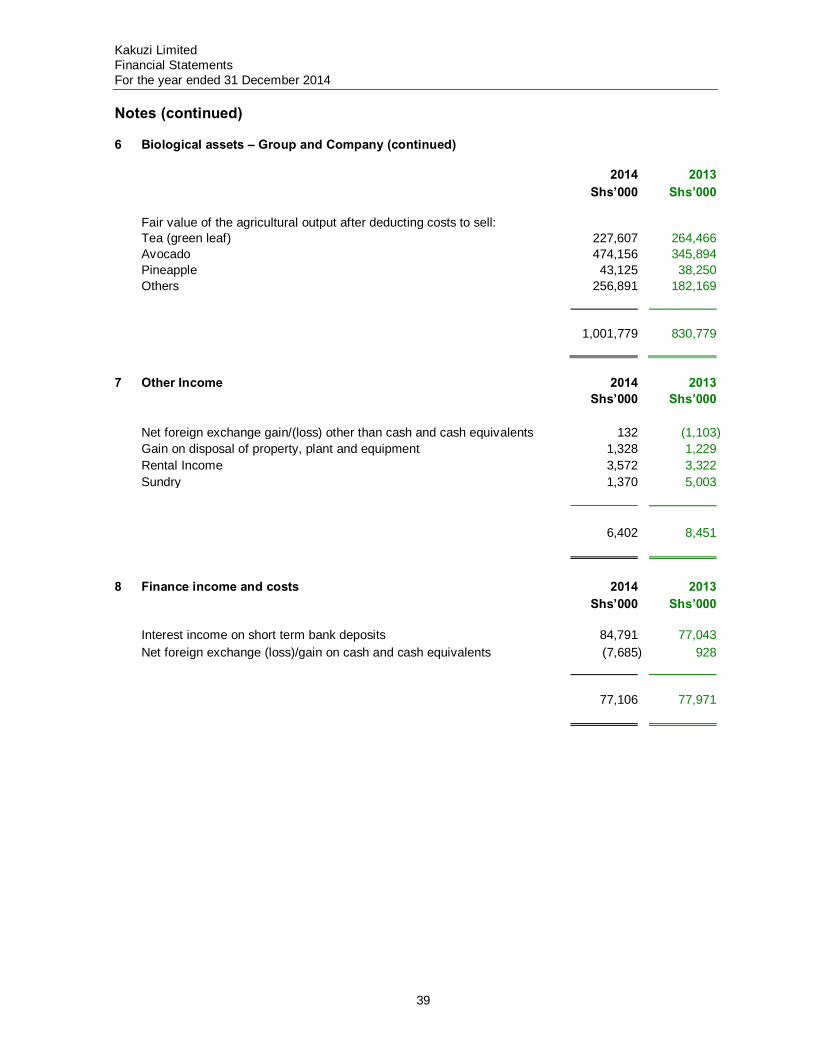
Kakuzi Limited Financial Statements For the year ended 31 December 2014
39
Notes (continued) 6 Biological assets – Group and Company (continued) 2014 2013 Shs’000 Shs’000 Fair value of the agricultural output after deducting costs to sell: Tea (green leaf) 227,607 264,466 Avocado 474,156 345,894 Pineapple 43,125 38,250 Others 256,891 182,169 1,001,779 830,779 7 Other Income 2014 2013 Shs’000 Shs’000 Net foreign exchange gain/(loss) other than cash and cash equivalents 132 (1,103) Gain on disposal of property, plant and equipment 1,328 1,229 Rental Income 3,572 3,322 Sundry 1,370 5,003 6,402 8,451 8 Finance income and costs 2014 2013 Shs’000 Shs’000 Interest income on short term bank deposits 84,791 77,043 Net foreign exchange (loss)/gain on cash and cash equivalents (7,685) 928 77,106 77,971
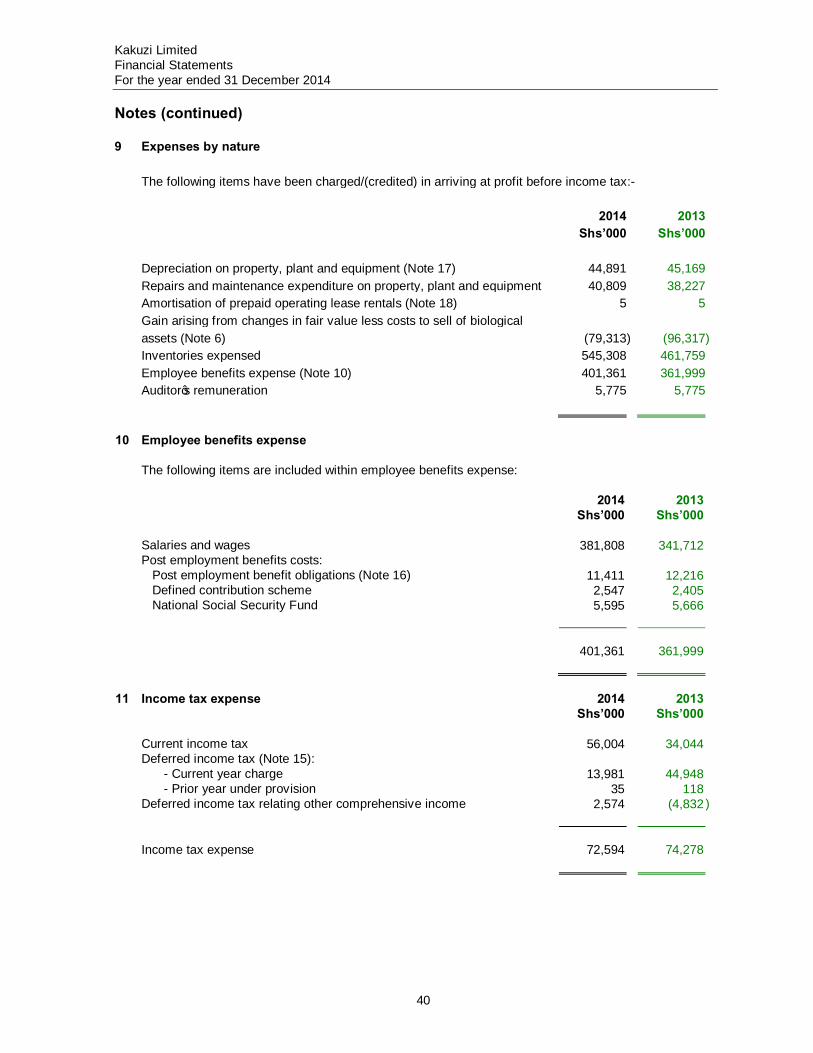
Kakuzi Limited Financial Statements For the year ended 31 December 2014
40
Notes (continued) 9 Expenses by nature The following items have been charged/(credited) in arriving at profit before income tax:- 2014 2013 Shs’000 Shs’000 Depreciation on property, plant and equipment (Note 17) 44,891 45,169 Repairs and maintenance expenditure on property, plant and equipment 40,809 38,227 Amortisation of prepaid operating lease rentals (Note 18) 5 5 Gain arising from changes in fair value less costs to sell of biological assets (Note 6) (79,313) (96,317) Inventories expensed 545,308 461,759 Employee benefits expense (Note 10) 401,361 361,999 Auditor’s remuneration 5,775 5,775
10 Employee benefits expense The following items are included within employee benefits expense:
2014 2013 Shs’000 Shs’000 Salaries and wages 381,808 341,712 Post employment benefits costs: Post employment benefit obligations (Note 16) 11,411 12,216 Defined contribution scheme 2,547 2,405 National Social Security Fund 5,595 5,666
401,361
361,999
11 Income tax expense 2014 2013 Shs’000 Shs’000 Current income tax 56,004 34,044 Deferred income tax (Note 15): - Current year charge 13,981 44,948 - Prior year under provision 35 118 Deferred income tax relating other comprehensive income 2,574 (4,832 ) Income tax expense 72,594 74,278
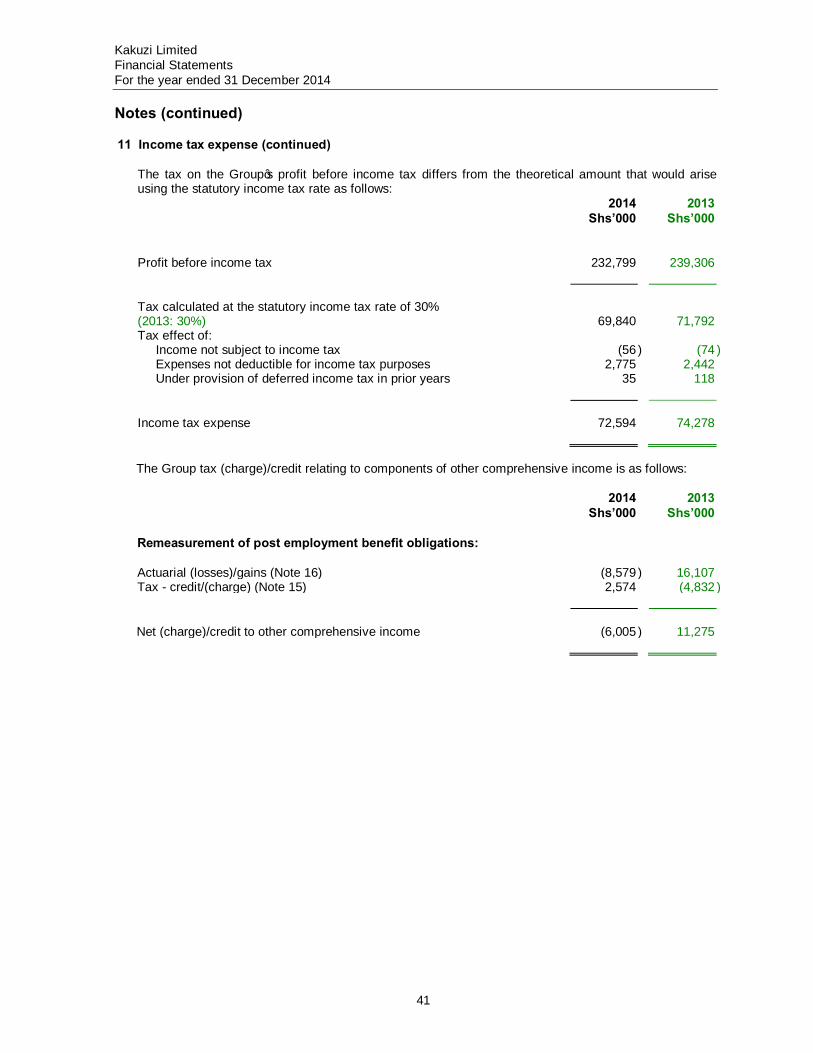
Kakuzi Limited Financial Statements For the year ended 31 December 2014
41
Notes (continued)
11 Income tax expense (continued)
The tax on the Group’s profit before income tax differs from the theoretical amount that would arise using the statutory income tax rate as follows:
2014 2013 Shs’000 Shs’000 Profit before income tax 232,799 239,306 Tax calculated at the statutory income tax rate of 30%
(2013: 30%) 69,840
71,792
Tax effect of: Income not subject to income tax (56 ) (74 ) Expenses not deductible for income tax purposes 2,775 2,442 Under provision of deferred income tax in prior years 35 118 Income tax expense 72,594 74,278
The Group tax (charge)/credit relating to components of other comprehensive income is as follows:
2014 2013 Shs’000 Shs’000
Remeasurement of post employment benefit obligations: Actuarial (losses)/gains (Note 16) (8,579 ) 16,107 Tax - credit/(charge) (Note 15) 2,574 (4,832 ) Net (charge)/credit to other comprehensive income (6,005 ) 11,275
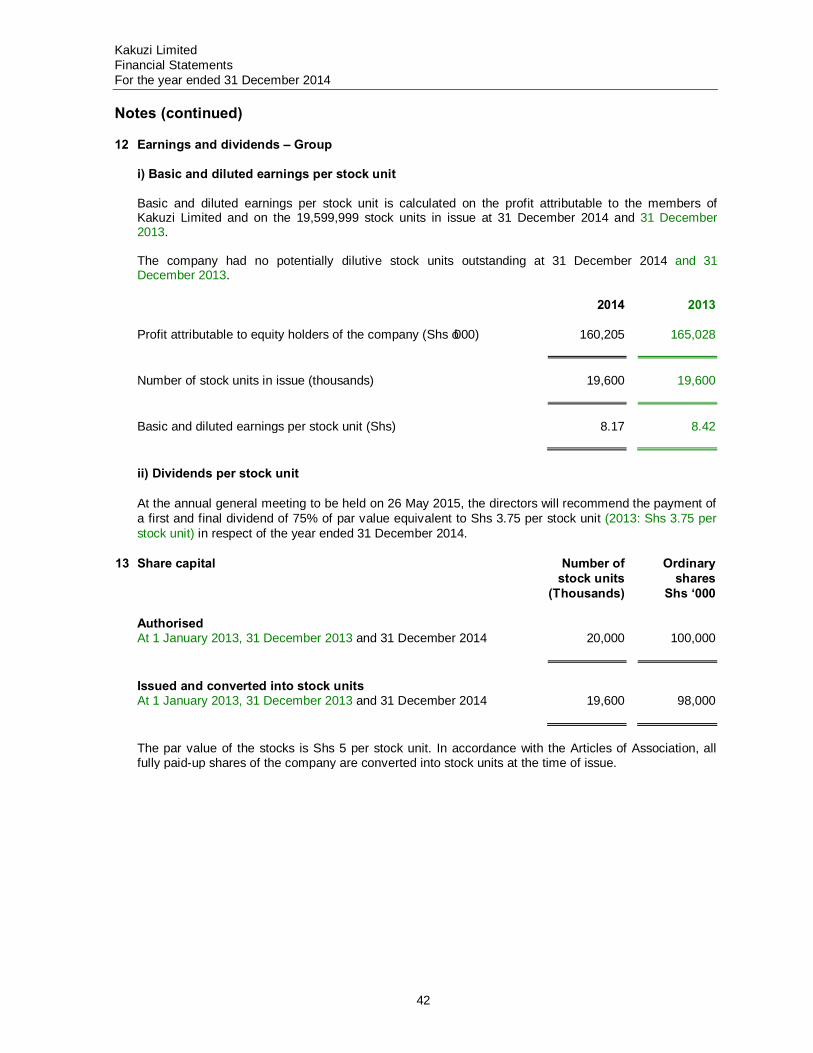
Kakuzi Limited Financial Statements For the year ended 31 December 2014
42
Notes (continued)
12 Earnings and dividends – Group i) Basic and diluted earnings per stock unit Basic and diluted earnings per stock unit is calculated on the profit attributable to the members of
Kakuzi Limited and on the 19,599,999 stock units in issue at 31 December 2014 and 31 December 2013.
The company had no potentially dilutive stock units outstanding at 31 December 2014 and 31
December 2013.
2014 2013 Profit attributable to equity holders of the company (Shs ‘000) 160,205 165,028 Number of stock units in issue (thousands) 19,600 19,600 Basic and diluted earnings per stock unit (Shs) 8.17 8.42
ii) Dividends per stock unit At the annual general meeting to be held on 26 May 2015, the directors will recommend the payment of
a first and final dividend of 75% of par value equivalent to Shs 3.75 per stock unit (2013: Shs 3.75 per stock unit) in respect of the year ended 31 December 2014.
13 Share capital Number of
stock units (Thousands)
Ordinary shares
Shs ‘000 Authorised At 1 January 2013, 31 December 2013 and 31 December 2014 20,000 100,000 Issued and converted into stock units At 1 January 2013, 31 December 2013 and 31 December 2014 19,600 98,000
The par value of the stocks is Shs 5 per stock unit. In accordance with the Articles of Association, all
fully paid-up shares of the company are converted into stock units at the time of issue.
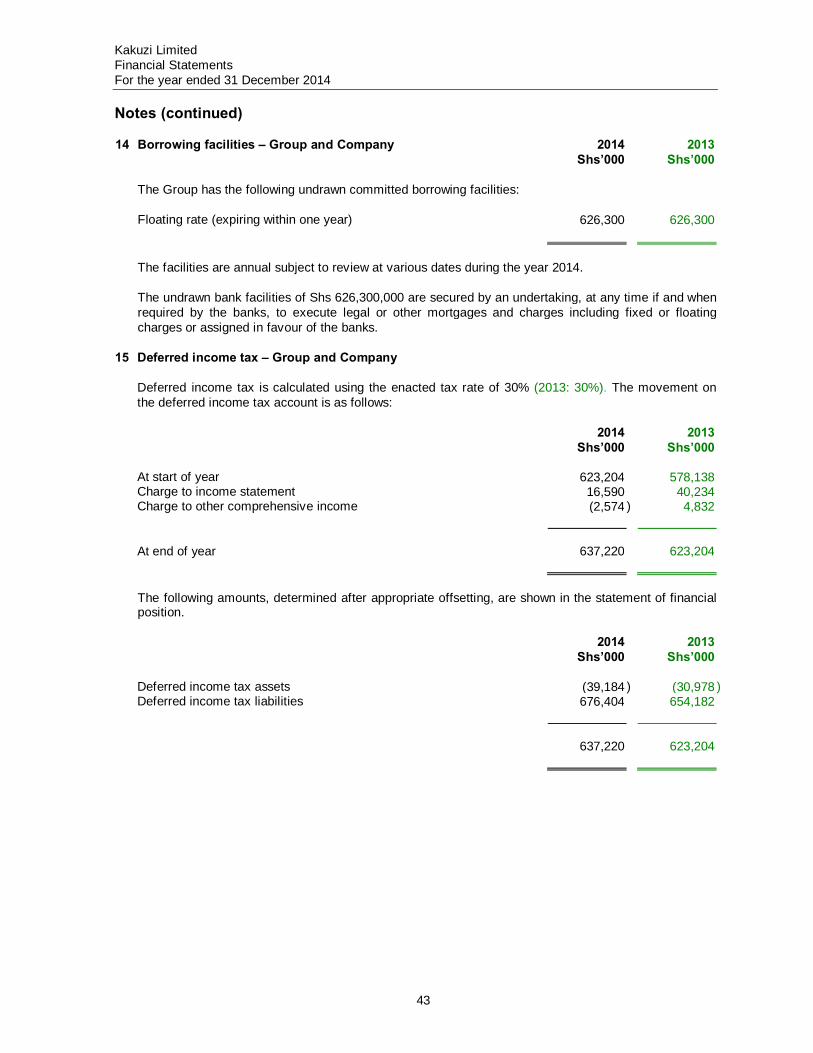
Kakuzi Limited Financial Statements For the year ended 31 December 2014
43
Notes (continued)
14 Borrowing facilities – Group and Company 2014 2013 Shs’000 Shs’000 The Group has the following undrawn committed borrowing facilities: Floating rate (expiring within one year) 626,300 626,300
The facilities are annual subject to review at various dates during the year 2014. The undrawn bank facilities of Shs 626,300,000 are secured by an undertaking, at any time if and when
required by the banks, to execute legal or other mortgages and charges including fixed or floating charges or assigned in favour of the banks.
15 Deferred income tax – Group and Company Deferred income tax is calculated using the enacted tax rate of 30% (2013: 30%). The movement on
the deferred income tax account is as follows:
2014 2013 Shs’000 Shs’000 At start of year 623,204 578,138 Charge to income statement 16,590 40,234 Charge to other comprehensive income (2,574 ) 4,832 At end of year 637,220 623,204
The following amounts, determined after appropriate offsetting, are shown in the statement of financial
position.
2014 2013 Shs’000 Shs’000 Deferred income tax assets (39,184 ) (30,978 ) Deferred income tax liabilities 676,404 654,182 637,220 623,204
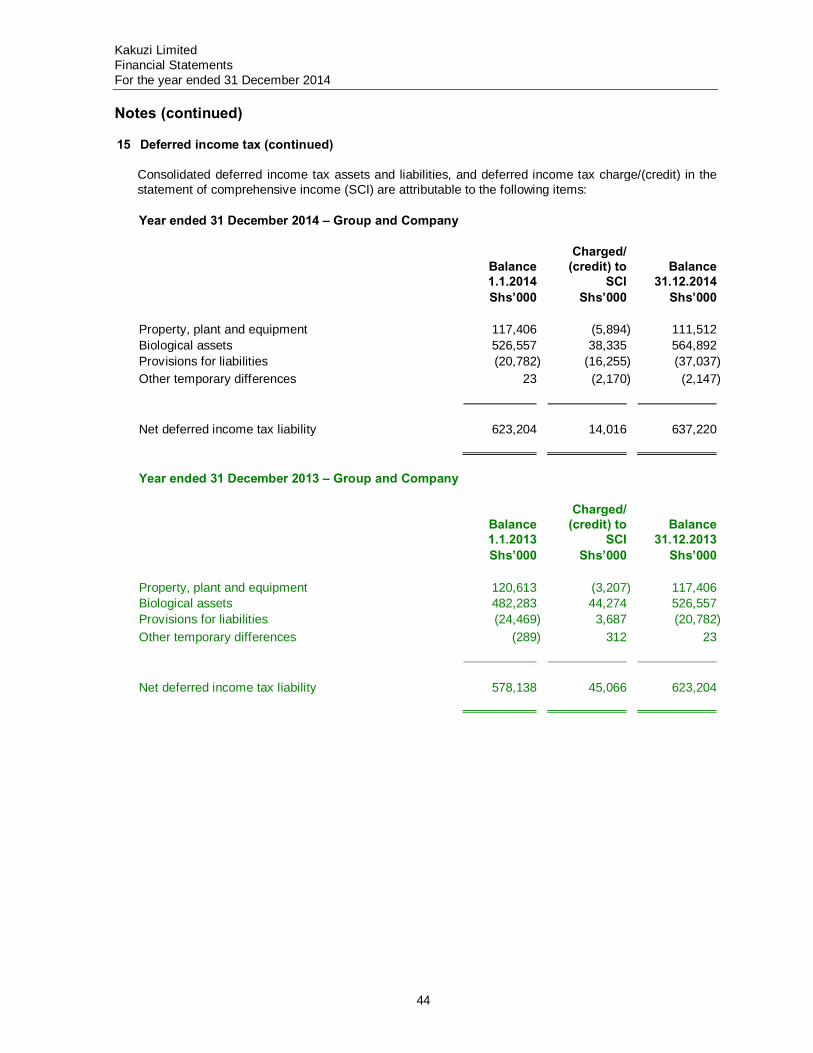
Kakuzi Limited Financial Statements For the year ended 31 December 2014
44
Notes (continued)
15 Deferred income tax (continued)
Consolidated deferred income tax assets and liabilities, and deferred income tax charge/(credit) in the statement of comprehensive income (SCI) are attributable to the following items:
Year ended 31 December 2014 – Group and Company
Balance1.1.2014
Charged/ (credit) to
SCI Balance
31.12.2014 Shs’000 Shs’000 Shs’000 Property, plant and equipment 117,406 (5,894) 111,512 Biological assets 526,557 38,335 564,892 Provisions for liabilities (20,782) (16,255) (37,037) Other temporary differences 23 (2,170) (2,147) Net deferred income tax liability 623,204 14,016 637,220 Year ended 31 December 2013 – Group and Company
Balance1.1.2013
Charged/ (credit) to
SCI Balance
31.12.2013 Shs’000 Shs’000 Shs’000 Property, plant and equipment 120,613 (3,207) 117,406 Biological assets 482,283 44,274 526,557 Provisions for liabilities (24,469) 3,687 (20,782) Other temporary differences (289) 312 23 Net deferred income tax liability 578,138 45,066 623,204
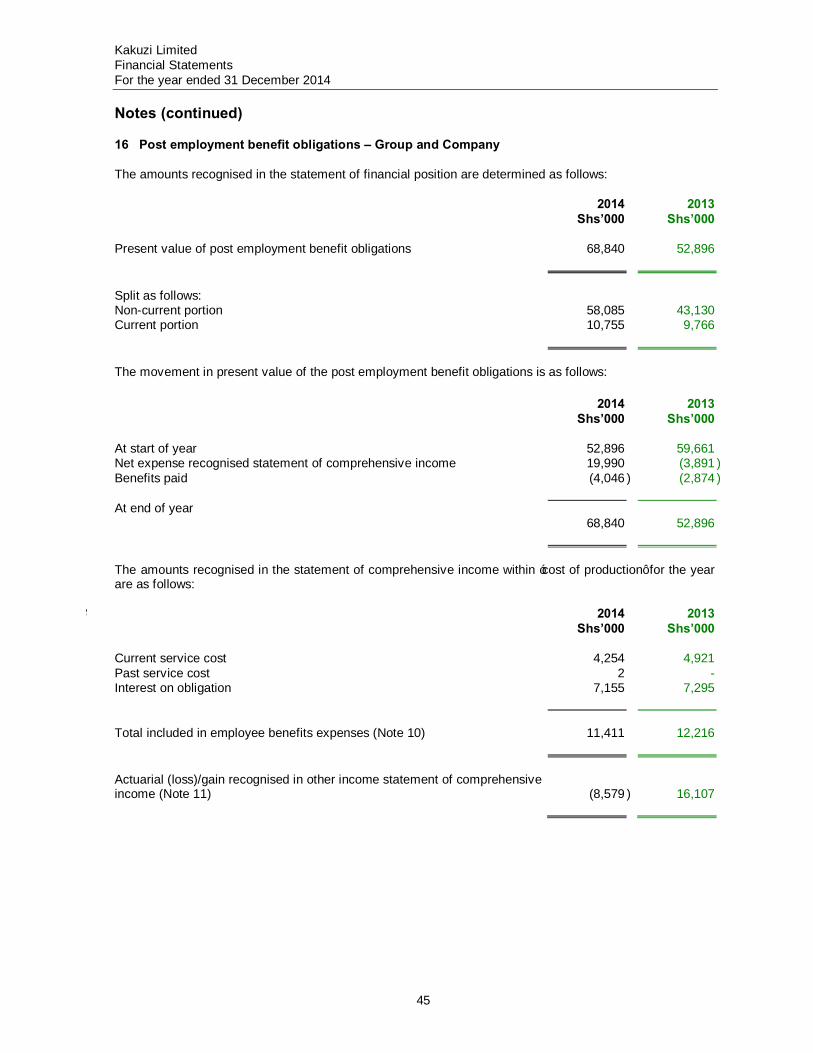
Kakuzi Limited Financial Statements For the year ended 31 December 2014
45
Notes (continued) 16 Post employment benefit obligations – Group and Company The amounts recognised in the statement of financial position are determined as follows:
2014 2013 Shs’000 Shs’000 Present value of post employment benefit obligations 68,840 52,896 Split as follows: Non-current portion 58,085 43,130 Current portion 10,755 9,766 The movement in present value of the post employment benefit obligations is as follows: 2014 2013 Shs’000 Shs’000 At start of year 52,896 59,661 Net expense recognised statement of comprehensive income 19,990 (3,891 ) Benefits paid (4,046 ) (2,874 ) At end of year 68,840 52,896 The amounts recognised in the statement of comprehensive income within ‘cost of production’ for the year
are as follows:
3 2014 2013
Shs’000 Shs’000 Current service cost 4,254 4,921 Past service cost 2 - Interest on obligation 7,155 7,295 Total included in employee benefits expenses (Note 10) 11,411 12,216 Actuarial (loss)/gain recognised in other income statement of comprehensive
income (Note 11)
(8,579 )
16,107
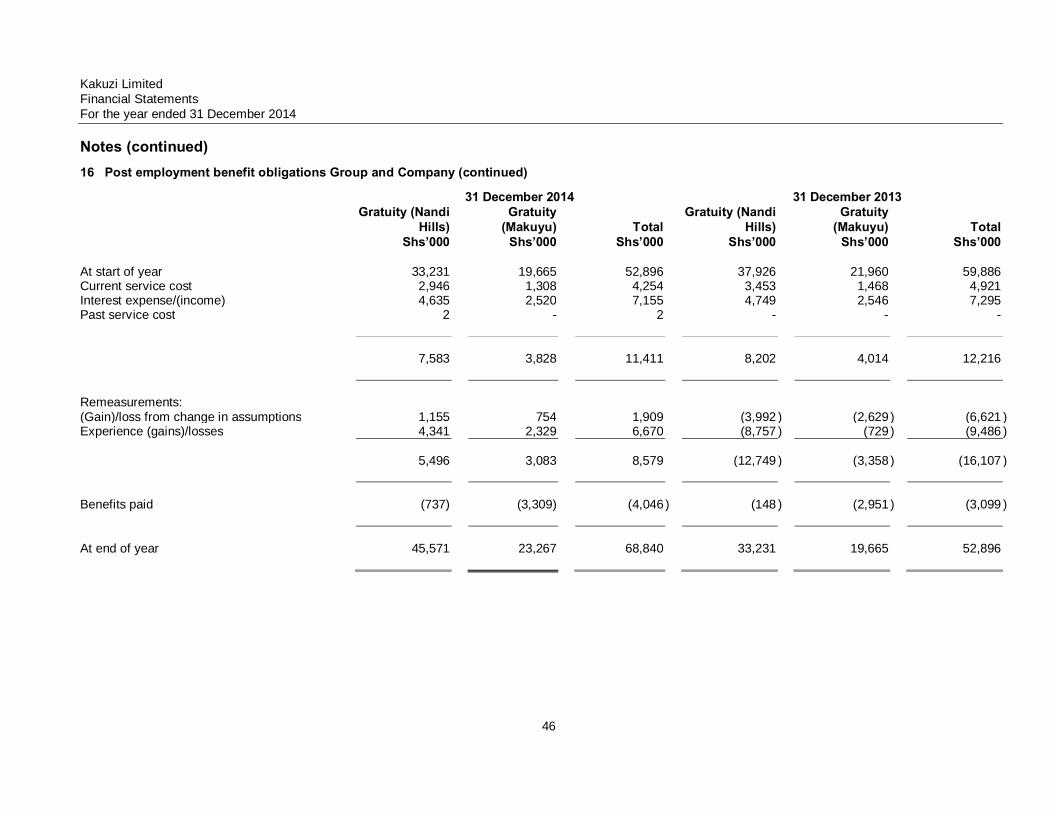
Kakuzi Limited Financial Statements For the year ended 31 December 2014
46
Notes (continued)
16 Post employment benefit obligations Group and Company (continued)
31 December 2014 31 December 2013 Gratuity (Nandi
Hills) Gratuity
(Makuyu)
Total Gratuity (Nandi
Hills) Gratuity
(Makuyu)
Total
Shs’000 Shs’000 Shs’000 Shs’000 Shs’000 Shs’000 At start of year 33,231 19,665 52,896 37,926 21,960 59,886 Current service cost 2,946 1,308 4,254 3,453 1,468 4,921 Interest expense/(income) 4,635 2,520 7,155 4,749 2,546 7,295 Past service cost 2 - 2 - - - 7,583 3,828 11,411 8,202 4,014 12,216 Remeasurements: (Gain)/loss from change in assumptions 1,155 754 1,909 (3,992 ) (2,629 ) (6,621 ) Experience (gains)/losses 4,341 2,329 6,670 (8,757 ) (729 ) (9,486 ) 5,496 3,083 8,579 (12,749 ) (3,358 ) (16,107 ) Benefits paid (737) (3,309) (4,046 ) (148 ) (2,951 ) (3,099 ) At end of year 45,571 23,267 68,840 33,231 19,665 52,896
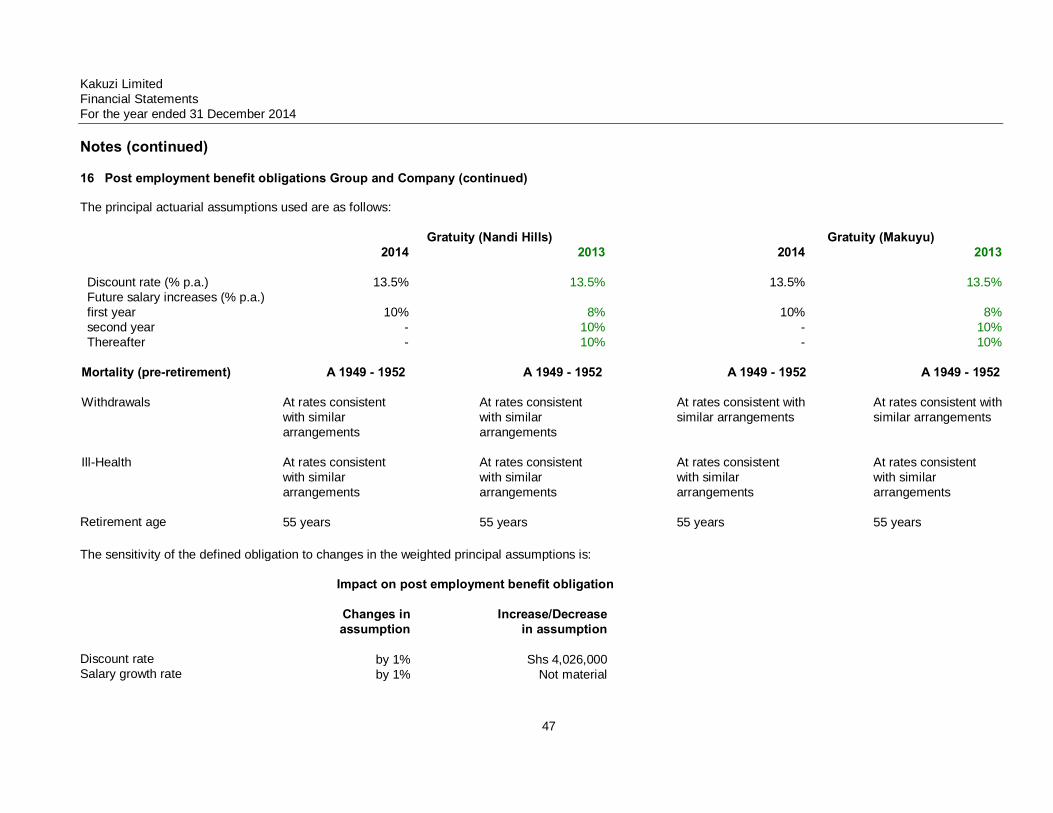
Kakuzi Limited Financial Statements For the year ended 31 December 2014
47
Notes (continued)
16 Post employment benefit obligations Group and Company (continued) The principal actuarial assumptions used are as follows:
Gratuity (Nandi Hills) Gratuity (Makuyu) 2014 2013 2014 2013 Discount rate (% p.a.) 13.5% 13.5% 13.5% 13.5% Future salary increases (% p.a.) first year 10% 8% 10% 8% second year - 10% - 10% Thereafter - 10% - 10%
Mortality (pre-retirement) A 1949 - 1952 A 1949 - 1952 A 1949 - 1952 A 1949 - 1952 Withdrawals At rates consistent
with similar arrangements
At rates consistent with similar arrangements
At rates consistent with similar arrangements
At rates consistent with similar arrangements
Ill-Health At rates consistent
with similar arrangements
At rates consistent with similar arrangements
At rates consistent with similar arrangements
At rates consistent with similar arrangements
Retirement age 55 years 55 years 55 years 55 years
The sensitivity of the defined obligation to changes in the weighted principal assumptions is: Impact on post employment benefit obligation Changes in
assumption Increase/Decrease
in assumption
Discount rate by 1% Shs 4,026,000 Salary growth rate by 1% Not material
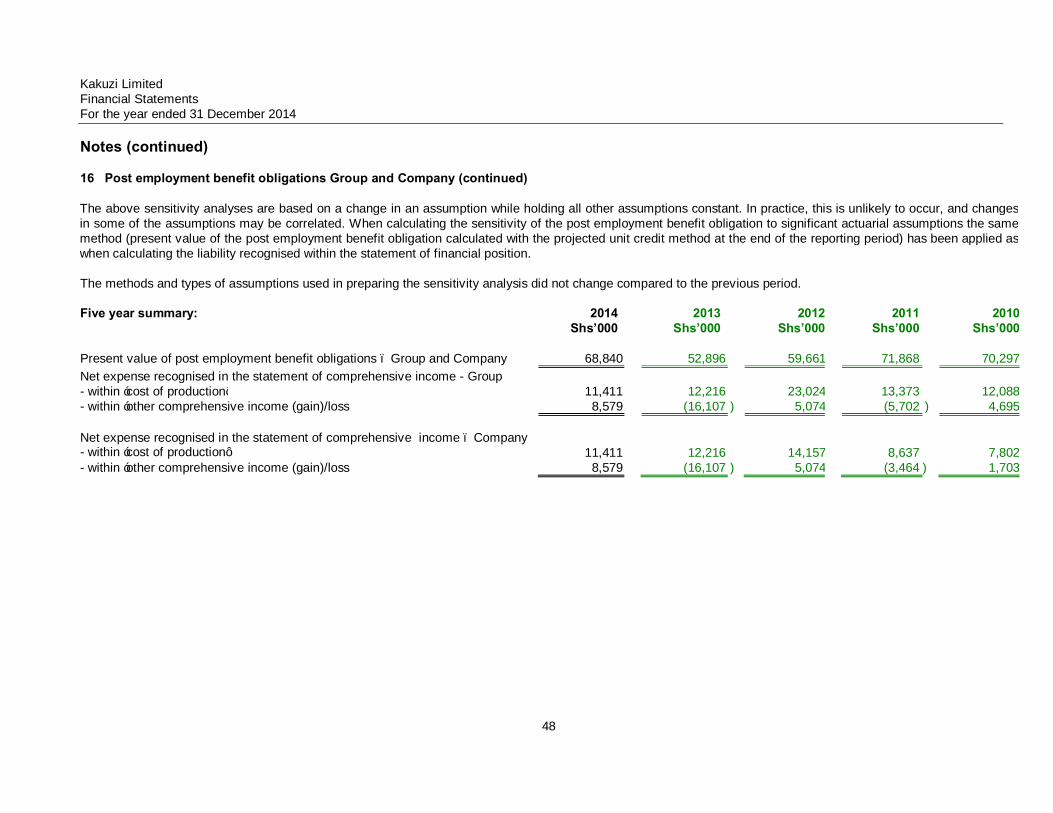
Kakuzi Limited Financial Statements For the year ended 31 December 2014
48
Notes (continued)
16 Post employment benefit obligations Group and Company (continued) The above sensitivity analyses are based on a change in an assumption while holding all other assumptions constant. In practice, this is unlikely to occur, and changes in some of the assumptions may be correlated. When calculating the sensitivity of the post employment benefit obligation to significant actuarial assumptions the same method (present value of the post employment benefit obligation calculated with the projected unit credit method at the end of the reporting period) has been applied aswhen calculating the liability recognised within the statement of financial position. The methods and types of assumptions used in preparing the sensitivity analysis did not change compared to the previous period. Five year summary: 2014 2013 2012 2011 2010 Shs’000 Shs’000 Shs’000 Shs’000 Shs’000 Present value of post employment benefit obligations – Group and Company 68,840 52,896 59,661 71,868 70,297Net expense recognised in the statement of comprehensive income - Group - within ‘cost of production’ 11,411 12,216 23,024 13,373 12,088- within ‘other comprehensive income (gain)/loss 8,579 (16,107 ) 5,074 (5,702 ) 4,695 Net expense recognised in the statement of comprehensive income – Company
- within ‘cost of production’ 11,411 12,216 14,157 8,637 7,802- within ‘other comprehensive income (gain)/loss 8,579 (16,107 ) 5,074 (3,464 ) 1,703
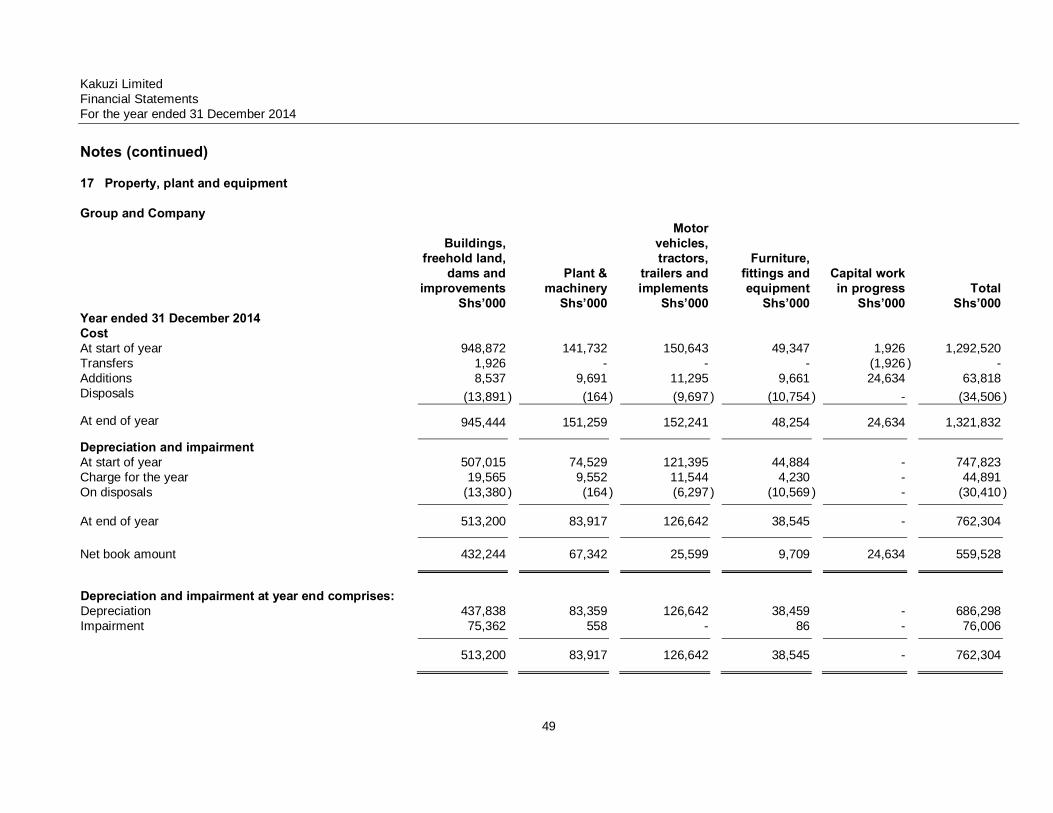
Kakuzi Limited Financial Statements For the year ended 31 December 2014 Notes (continued)
49
17 Property, plant and equipment Group and Company
Buildings, freehold land,
dams and improvements
Plant & machinery
Motor
vehicles, tractors,
trailers and implements
Furniture, fittings and equipment
Capital work in progress
Total
Shs’000 Shs’000 Shs’000 Shs’000 Shs’000 Shs’000 Year ended 31 December 2014 Cost At start of year 948,872 141,732 150,643 49,347 1,926 1,292,520 Transfers 1,926 - - - (1,926 ) - Additions 8,537 9,691 11,295 9,661 24,634 63,818 Disposals (13,891 ) (164 ) (9,697 ) (10,754 ) - (34,506 ) At end of year 945,444 151,259 152,241 48,254 24,634 1,321,832 Depreciation and impairment At start of year 507,015 74,529 121,395 44,884 - 747,823 Charge for the year 19,565 9,552 11,544 4,230 - 44,891 On disposals (13,380 ) (164 ) (6,297 ) (10,569 ) - (30,410 ) At end of year 513,200 83,917 126,642 38,545 - 762,304 Net book amount 432,244 67,342 25,599 9,709 24,634 559,528 Depreciation and impairment at year end comprises:
Depreciation 437,838 83,359 126,642 38,459 - 686,298 Impairment 75,362 558 - 86 - 76,006 513,200 83,917 126,642 38,545 - 762,304
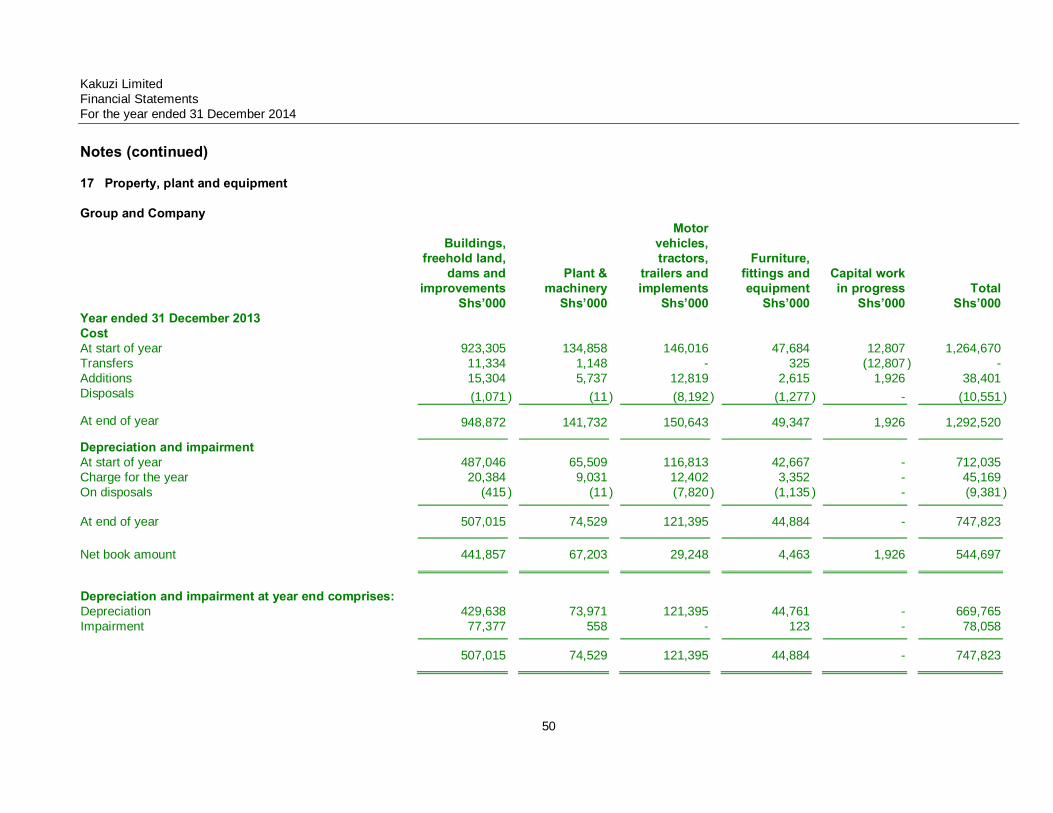
Kakuzi Limited Financial Statements For the year ended 31 December 2014 Notes (continued)
50
17 Property, plant and equipment Group and Company
Buildings, freehold land,
dams and improvements
Plant & machinery
Motor
vehicles, tractors,
trailers and implements
Furniture, fittings and equipment
Capital work in progress
Total
Shs’000 Shs’000 Shs’000 Shs’000 Shs’000 Shs’000 Year ended 31 December 2013 Cost At start of year 923,305 134,858 146,016 47,684 12,807 1,264,670 Transfers 11,334 1,148 - 325 (12,807 ) - Additions 15,304 5,737 12,819 2,615 1,926 38,401 Disposals (1,071 ) (11 ) (8,192 ) (1,277 ) - (10,551 ) At end of year 948,872 141,732 150,643 49,347 1,926 1,292,520 Depreciation and impairment At start of year 487,046 65,509 116,813 42,667 - 712,035 Charge for the year 20,384 9,031 12,402 3,352 - 45,169 On disposals (415 ) (11 ) (7,820 ) (1,135 ) - (9,381 ) At end of year 507,015 74,529 121,395 44,884 - 747,823 Net book amount 441,857 67,203 29,248 4,463 1,926 544,697 Depreciation and impairment at year end comprises:
Depreciation 429,638 73,971 121,395 44,761 - 669,765 Impairment 77,377 558 - 123 - 78,058 507,015 74,529 121,395 44,884 - 747,823
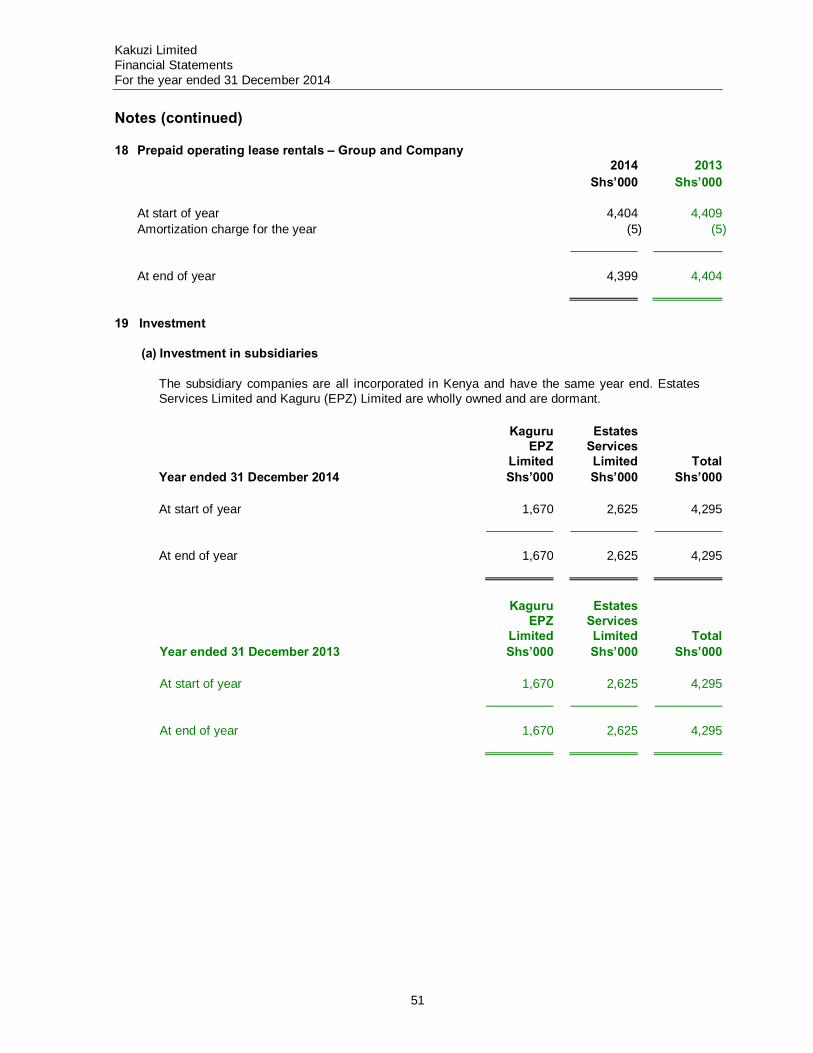
Kakuzi Limited Financial Statements For the year ended 31 December 2014 Notes (continued)
51
18 Prepaid operating lease rentals – Group and Company 2014 2013 Shs’000 Shs’000 At start of year 4,404 4,409 Amortization charge for the year (5) (5) At end of year 4,399 4,404 19 Investment
(a) Investment in subsidiaries
The subsidiary companies are all incorporated in Kenya and have the same year end. Estates Services Limited and Kaguru (EPZ) Limited are wholly owned and are dormant.
Kaguru EPZ
Limited
Estates Services Limited Total
Year ended 31 December 2014 Shs’000 Shs’000 Shs’000 At start of year 1,670 2,625 4,295 At end of year 1,670 2,625 4,295
Kaguru EPZ
Limited
Estates Services Limited Total
Year ended 31 December 2013 Shs’000 Shs’000 Shs’000 At start of year 1,670 2,625 4,295 At end of year 1,670 2,625 4,295
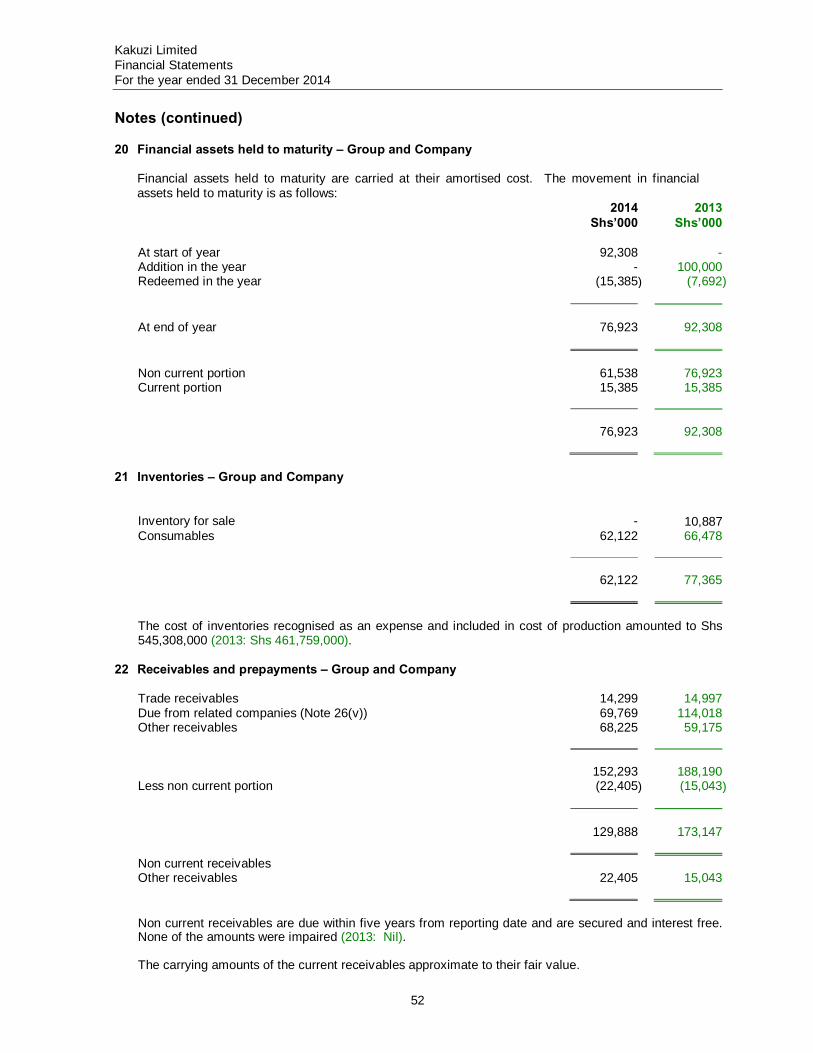
Kakuzi Limited Financial Statements For the year ended 31 December 2014 Notes (continued)
52
20 Financial assets held to maturity – Group and Company
Financial assets held to maturity are carried at their amortised cost. The movement in financial assets held to maturity is as follows: 2014 2013 Shs’000 Shs’000
At start of year 92,308 - Addition in the year - 100,000 Redeemed in the year (15,385) (7,692) At end of year 76,923 92,308 Non current portion 61,538 76,923 Current portion 15,385 15,385 76,923 92,308
21 Inventories – Group and Company
Inventory for sale - 10,887 Consumables 62,122 66,478 62,122 77,365 The cost of inventories recognised as an expense and included in cost of production amounted to Shs 545,308,000 (2013: Shs 461,759,000).
22 Receivables and prepayments – Group and Company
Trade receivables 14,299 14,997 Due from related companies (Note 26(v)) 69,769 114,018 Other receivables 68,225 59,175 152,293 188,190Less non current portion (22,405) (15,043) 129,888 173,147 Non current receivables Other receivables 22,405 15,043
Non current receivables are due within five years from reporting date and are secured and interest free. None of the amounts were impaired (2013: Nil). The carrying amounts of the current receivables approximate to their fair value.
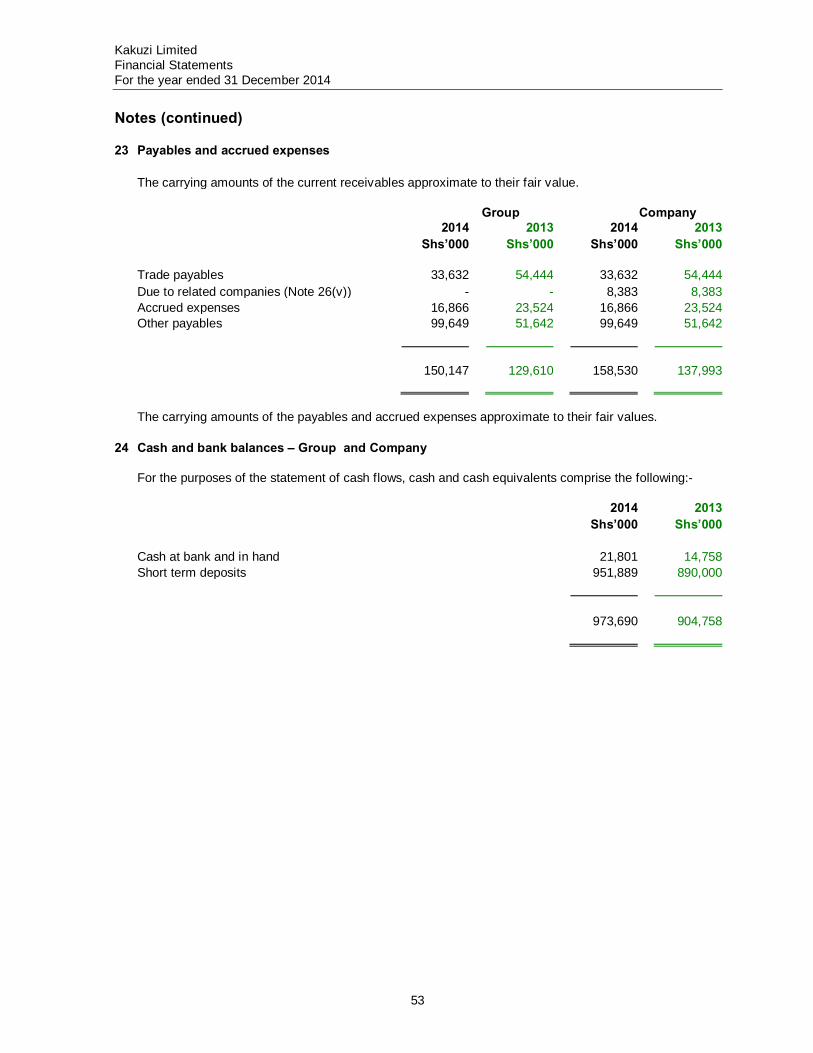
Kakuzi Limited Financial Statements For the year ended 31 December 2014 Notes (continued)
53
23 Payables and accrued expenses The carrying amounts of the current receivables approximate to their fair value. Group Company 2014 2013 2014 2013 Shs’000 Shs’000 Shs’000 Shs’000 Trade payables 33,632 54,444 33,632 54,444 Due to related companies (Note 26(v)) - - 8,383 8,383 Accrued expenses 16,866 23,524 16,866 23,524 Other payables 99,649 51,642 99,649 51,642 150,147 129,610 158,530 137,993
The carrying amounts of the payables and accrued expenses approximate to their fair values.
24 Cash and bank balances – Group and Company For the purposes of the statement of cash flows, cash and cash equivalents comprise the following:-
2014 2013 Shs’000 Shs’000 Cash at bank and in hand 21,801 14,758 Short term deposits 951,889 890,000 973,690 904,758
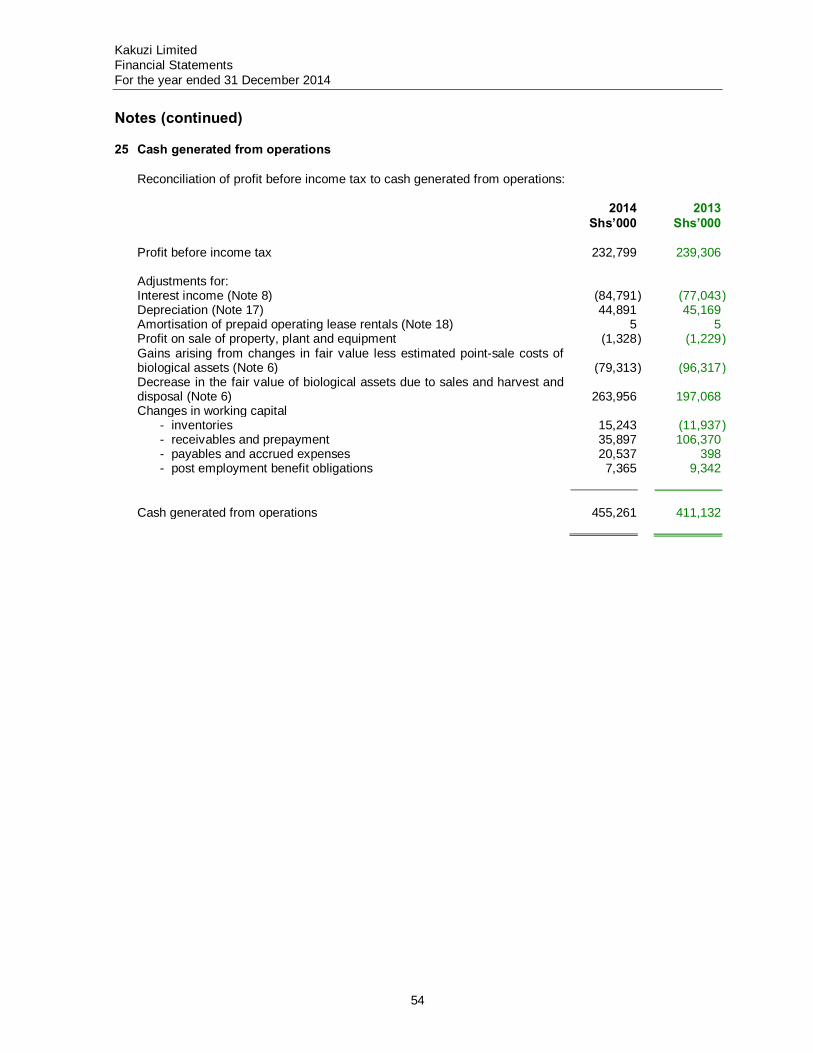
Kakuzi Limited Financial Statements For the year ended 31 December 2014 Notes (continued)
54
25 Cash generated from operations
Reconciliation of profit before income tax to cash generated from operations: 2014 2013 Shs’000 Shs’000 Profit before income tax 232,799 239,306 Adjustments for: Interest income (Note 8) (84,791 ) (77,043 ) Depreciation (Note 17) 44,891 45,169 Amortisation of prepaid operating lease rentals (Note 18) 5 5 Profit on sale of property, plant and equipment (1,328 ) (1,229 ) Gains arising from changes in fair value less estimated point-sale costs of biological assets (Note 6)
(79,313
)
(96,317
)
Decrease in the fair value of biological assets due to sales and harvest and disposal (Note 6)
263,956
197,068
Changes in working capital - inventories 15,243 (11,937 ) - receivables and prepayment 35,897 106,370 - payables and accrued expenses 20,537 398 - post employment benefit obligations 7,365 9,342
Cash generated from operations 455,261 411,132
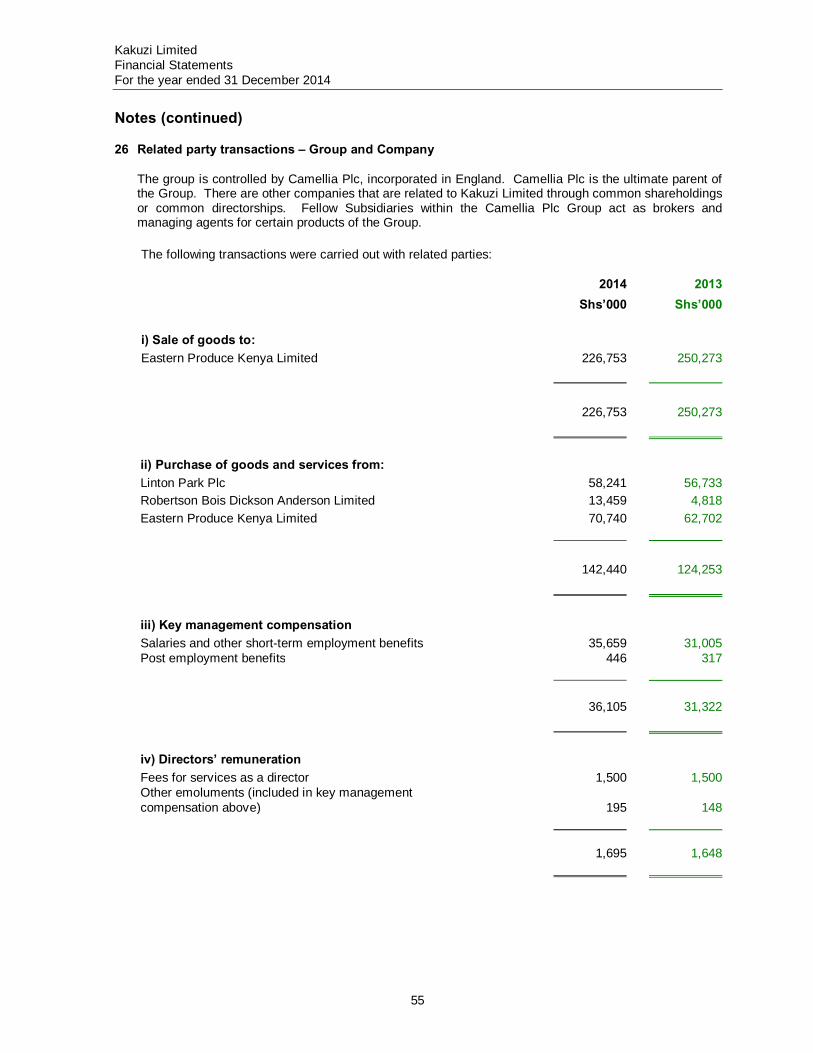
Kakuzi Limited Financial Statements For the year ended 31 December 2014 Notes (continued)
55
26 Related party transactions – Group and Company
The group is controlled by Camellia Plc, incorporated in England. Camellia Plc is the ultimate parent of the Group. There are other companies that are related to Kakuzi Limited through common shareholdings or common directorships. Fellow Subsidiaries within the Camellia Plc Group act as brokers and managing agents for certain products of the Group.
The following transactions were carried out with related parties: 2014 2013 Shs’000 Shs’000 i) Sale of goods to: Eastern Produce Kenya Limited 226,753 250,273 226,753 250,273 ii) Purchase of goods and services from: Linton Park Plc 58,241 56,733 Robertson Bois Dickson Anderson Limited 13,459 4,818
Eastern Produce Kenya Limited 70,740 62,702 142,440 124,253 iii) Key management compensation Salaries and other short-term employment benefits 35,659 31,005 Post employment benefits 446 317 36,105 31,322 iv) Directors’ remuneration Fees for services as a director 1,500 1,500
Other emoluments (included in key management compensation above) 195 148
1,695 1,648
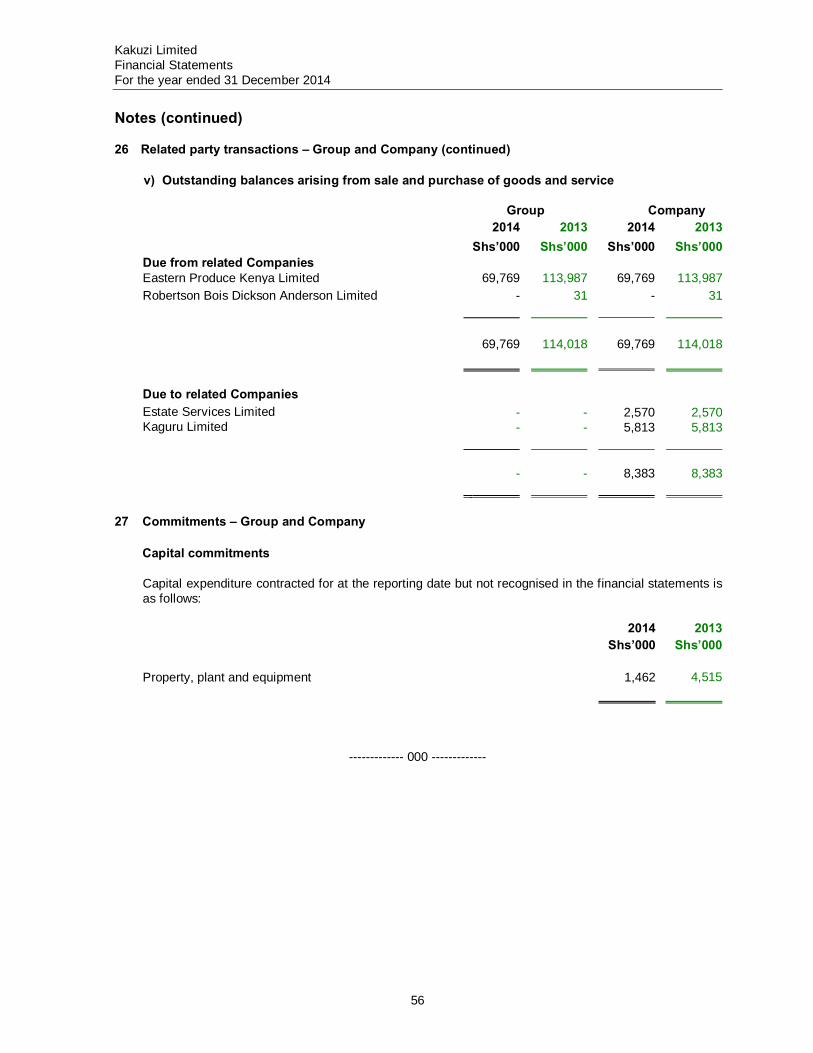
Kakuzi Limited Financial Statements For the year ended 31 December 2014 Notes (continued)
56
26 Related party transactions – Group and Company (continued) v) Outstanding balances arising from sale and purchase of goods and service Group Company 2014 2013 2014 2013 Shs’000 Shs’000 Shs’000 Shs’000 Due from related Companies Eastern Produce Kenya Limited 69,769 113,987 69,769 113,987 Robertson Bois Dickson Anderson Limited - 31 - 31 69,769 114,018 69,769 114,018 Due to related Companies Estate Services Limited - - 2,570 2,570 Kaguru Limited - - 5,813 5,813 - - 8,383 8,383 27 Commitments – Group and Company
Capital commitments
Capital expenditure contracted for at the reporting date but not recognised in the financial statements is as follows:
2014 2013 Shs’000 Shs’000
Property, plant and equipment 1,462 4,515
------------- 000 -------------
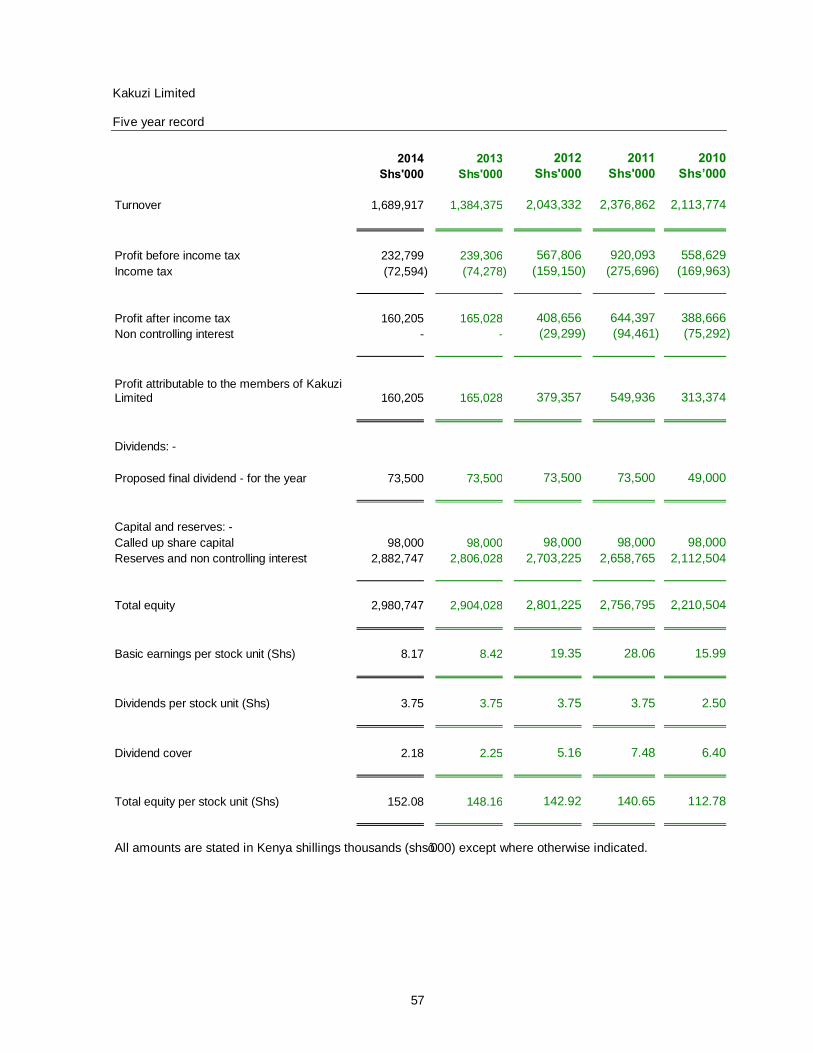
Kakuzi Limited Financial Statements For the year ended 31 December 2014 Notes (continued)
57
2014 2013 2012 2011 2010 Shs'000 Shs'000 Shs'000 Shs'000 Shs’000 Turnover 1,689,917 1,384,375 2,043,332 2,376,862 2,113,774
Profit before income tax 232,799 239,306 567,806 920,093 558,629 Income tax (72,594) (74,278) (159,150) (275,696) (169,963) Profit after income tax 160,205 165,028 408,656 644,397 388,666 Non controlling interest - - (29,299) (94,461) (75,292) Profit attributable to the members of Kakuzi Limited 160,205 165,028 379,357 549,936 313,374 Dividends: - Proposed final dividend - for the year 73,500 73,500 73,500 73,500 49,000 Capital and reserves: - Called up share capital 98,000 98,000 98,000 98,000 98,000 Reserves and non controlling interest 2,882,747 2,806,028 2,703,225 2,658,765 2,112,504 Total equity 2,980,747 2,904,028 2,801,225 2,756,795 2,210,504 Basic earnings per stock unit (Shs) 8.17 8.42 19.35 28.06 15.99 Dividends per stock unit (Shs) 3.75 3.75 3.75 3.75 2.50 Dividend cover 2.18 2.25 5.16 7.48 6.40
Total equity per stock unit (Shs) 152.08 148.16 142.92 140.65 112.78
All amounts are stated in Kenya shillings thousands (shs’000) except where otherwise indicated.
Kakuzi Limited Five year record
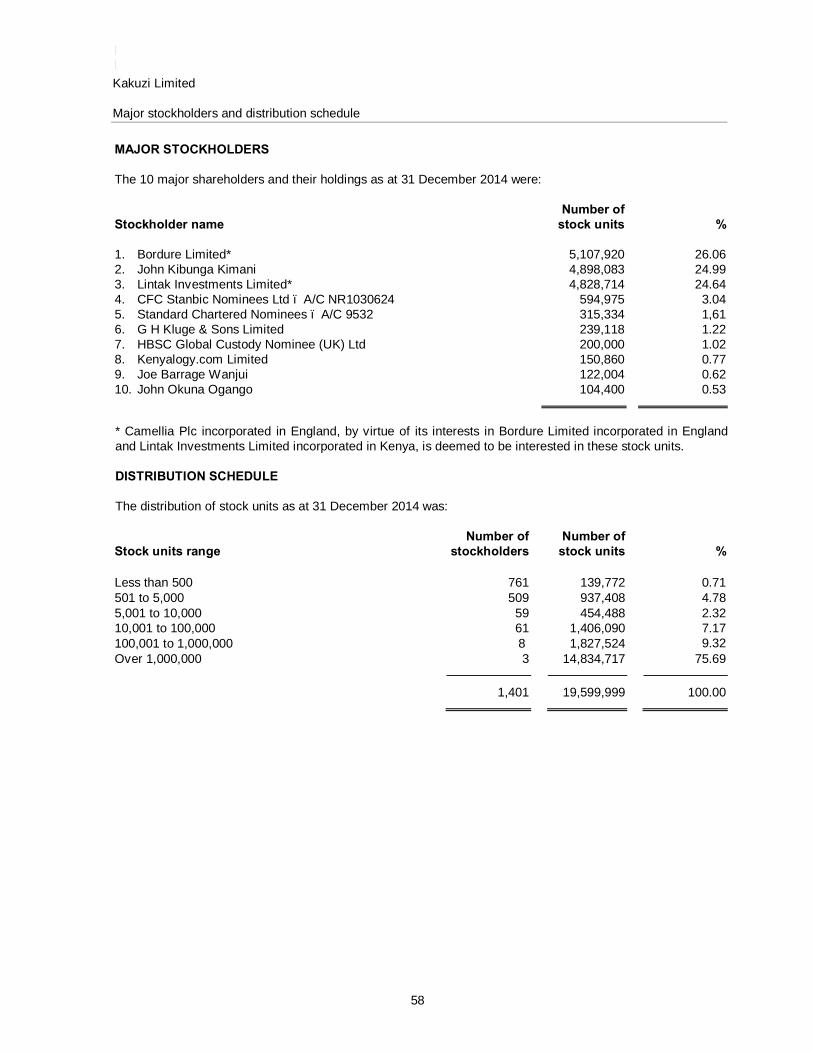
Kakuzi Limited Financial Statements For the year ended 31 December 2014 Notes (continued)
58
MAJOR STOCKHOLDERS The 10 major shareholders and their holdings as at 31 December 2014 were: Stockholder name
Number of stock units
%
1. Bordure Limited* 5,107,920 26.06 2. John Kibunga Kimani 4,898,083 24.99 3. Lintak Investments Limited* 4,828,714 24.64 4. CFC Stanbic Nominees Ltd – A/C NR1030624 594,975 3.04 5. Standard Chartered Nominees – A/C 9532 315,334 1,61 6. G H Kluge & Sons Limited 239,118 1.22 7. HBSC Global Custody Nominee (UK) Ltd 200,000 1.02 8. Kenyalogy.com Limited 150,860 0.77 9. Joe Barrage Wanjui 122,004 0.62 10. John Okuna Ogango 104,400 0.53
* Camellia Plc incorporated in England, by virtue of its interests in Bordure Limited incorporated in England and Lintak Investments Limited incorporated in Kenya, is deemed to be interested in these stock units.
DISTRIBUTION SCHEDULE The distribution of stock units as at 31 December 2014 was:
Stock units range
Number of stockholders
Number of stock units
%
Less than 500 761 139,772 0.71 501 to 5,000 509 937,408 4.78 5,001 to 10,000 59 454,488 2.32 10,001 to 100,000 61 1,406,090 7.17 100,001 to 1,000,000 8 1,827,524 9.32 Over 1,000,000 3 14,834,717 75.69 1,401 19,599,999 100.00
Kakuzi Limited Major stockholders and distribution schedule
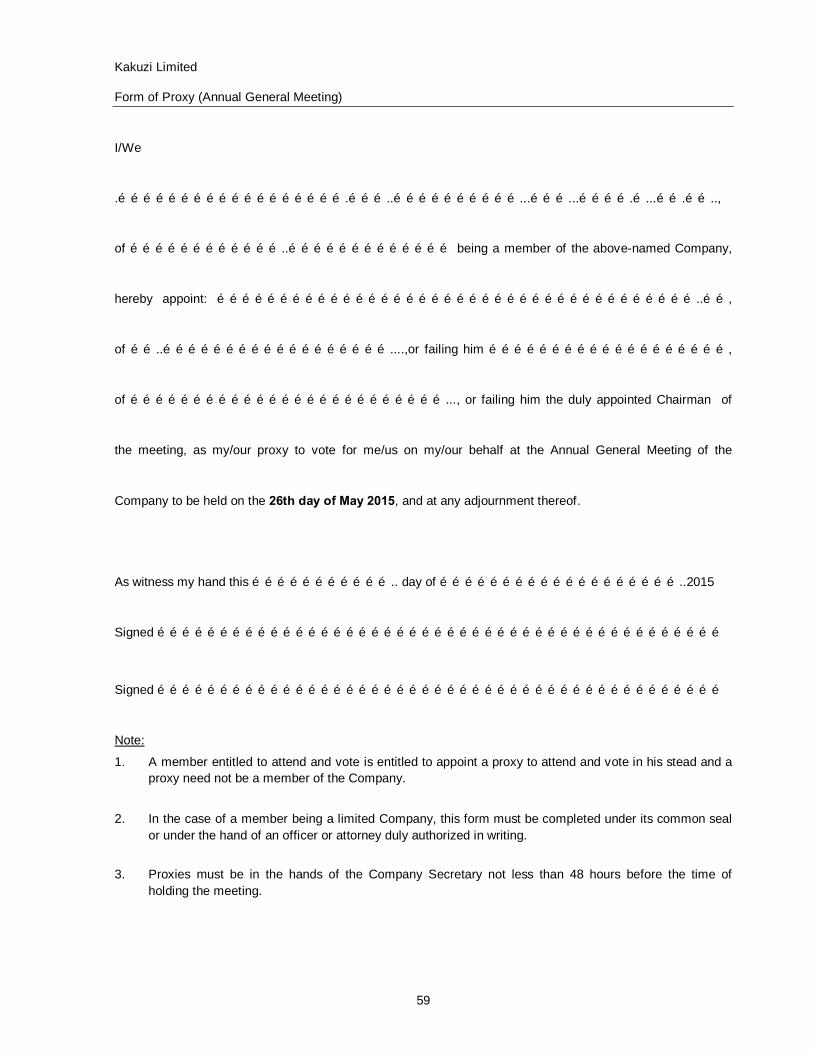
Kakuzi Limited Form of Proxy (Annual General Meeting)
59
I/We
.……………………………………………….………..…………………………...………...………….…...…….……..,
of ………………………………..………………………………… being a member of the above-named Company,
hereby appoint: ……………………………………………………………………………………………………..……,
of ……..………………………………………………....,or failing him …………………………………………………,
of …………………………………………………………………..., or failing him the duly appointed Chairman of
the meeting, as my/our proxy to vote for me/us on my/our behalf at the Annual General Meeting of the
Company to be held on the 26th day of May 2015, and at any adjournment thereof.
As witness my hand this …………………………….. day of …………………………………………………..2015
Signed ………………………………………………………………………………………………………………………
Signed ………………………………………………………………………………………………………………………
Note:
1. A member entitled to attend and vote is entitled to appoint a proxy to attend and vote in his stead and a proxy need not be a member of the Company.
2. In the case of a member being a limited Company, this form must be completed under its common seal
or under the hand of an officer or attorney duly authorized in writing.
3. Proxies must be in the hands of the Company Secretary not less than 48 hours before the time of
holding the meeting.
FOLD 2 STAMP
FOLD
1
Kakuzi Limited P O Box 24 Thika 01000 Kenya FOLD 3 INSERT FLAP INSIDE