kajian ekonomi dan stÁndar harga hutan tamanan
TRANSCRIPT

1
1
TECHNICAL REPORT:
ECONOMIC STUDY AND
STANDAR PRICE OF
COMMUNITY BASED
PLANTATION FOREST
(HTR) PRODUCTS
Case Study in Lampung
Province
By: Dr. Tuti Herawati
ITTO CFM-PD 001/10 REV.2 (F)
“Strengthening Capacity of Stakeholders for the
Development of Community Based Plantation
Forest at Three Selected Areas in Indonesia”
Cooperation between:
The Ministry of Forestry of Indonesia and
International Tropical Timber Organization (ITTO)
2013


PROJECT TECHNICAL REPORT
Economic Study and Standard Price of Community-Based Plantation Forest (HTR) Products
Case Study in Lampung Province
Dr.Tuti Herawati
Report for Activities 3.1. & 3.2.
ITTO CFM-PD 001/10 Rev.2 (F)
Strengthening Capacity of Stakeholders for the Development
Of Community Based Plantation Forest at Three Selected Areas in Indonesia
Host Government: Indonesia
Executing Agency:
Directorate of Plantation Forest
Directorate-General of Forest Utilization
Ministry of Forestry
Starting Date of the Project: July 2011 to December 2013
Project Duration: 30 Months
Project Coordinator: Dr. Anna Indria Witasari


i
EXECUTIVE SUMMARY
Feasibility analysis are based on three investment criteria i.e. net present value (NPV),
benefit cost ratio (BCR), and internal rate of return (IRR). The result of financial analysis indicated
that the plantation of fast growing species in Lampung Province is feasible based on the value of
NPV, BCR, and IRR which are NPV: Rp 9,011,550; BCR: 2.13 ; and IRR: 19%.
The determination of standard price of HTR timber used three approaches, namely.: 1)
market price, 2) stumpage price, and (3) parity/social price. The market price of Paraserianthes
falcataria is Rp 200,000, the stumpage price is Rp 121,984, and the parity/social price is between
Rp 200,000-250,000. The margin share for farmer is 27% and 73% for traders. The farmer is in the
weakness position due to the position as price taker. To increase bargaining position of the
farmers, there is a need for a government intervention in terms of standard price of HTR timber.
The standard can be determined based on parity or social price because the price provides an
opportunity to farmers to get maximum benefit.
The HTR progress in Lampung showed that total allocated HTR areas are 24,835 hectares
or 68% of the reserved area. The HTR activities at 4 of 6 HTR license holders are not in good
management. The factor is commonly caused by the termination of partnership. Based on this
condition, the strategies for HTR development in Lampung province are needed through: 1)
institutional strengthening, 2) facilitation, and 3) farmer capacity building.

ii

iii
TABLE OF CONTENTS
EXECUTIVE SUMMARY ................................................................................................................. i
TABLE OF CONTENTS .............................................................................................................. iii
LIST OF TABLES........................................................................................................................... v
LIST OF FIGURES ....................................................................................................................... vi
APPENDIX .................................................................................................................................. vii
I. INTRODUCTION .................................................................................................................... 1
1.1. Background ...................................................................................................................................... 1
1.2. Problem Formulation ........................................................................................................................ 2
1.3. Hypothesis ........................................................................................................................................ 2
1.4. Purpose and Objectives .................................................................................................................... 2
1.5. Outcome and Impact ......................................................................................................................... 3
1.6. Scope ................................................................................................................................... 3
II. RESEARCH METHOD ........................................................................................................... 4
2.1. Location and Research Respondents ............................................................................................... 4
2.2. Data Collection Techniques............................................................................................................... 5
2.3. Data Analysis .................................................................................................................................... 6
2.3.1. Financial Feasibility Analysis ........................................................................................ 6
2.3.2. Marketing Analysis and Base Price ................................................................................ 8
2.4. Species of HTR plantation and Assumption ....................................................................... 9
III. GENERAL PICTURE OF HTR PROGRAMMEIN LAMPUNG PROVINCE ................ 11
3.1. HTR Development in Lampung Province ........................................................................................ 11
3.2. Problems in HTR management in Lampung Province ........................................................ 13
IV. RESULT AND DISCUSSION .............................................................................................. 15
4.1. Financial Analysis of HTR Business
4.1.1. Stages of Activities in HTR Business .................................................................................. 15

iv
4.1.2. Cost Component of HTR Business ......................................................................... 15
4.1.3. Income from HTR Business .................................................................................... 16
4.1.4. NPV, BCR, and IRR Analysis ................................................................................. 17
4.2. Market Analysis and Market Channel of HTR Products ................................................................. 20
4.2.1. Market and Marketing of Community Produced Wood in Lampung Province ....... 20
4.2.2. Margin distribution analysis ................................................................................... 23
4.3. Analysis on Determination of HTR Wood Base Price .................................................................... 25
4.3.1. Market Price ........................................................................................................... 25
4.3.2. Stumpage Price ...................................................................................................... 26
4.3.3. Parity/Social Price .................................................................................................. 27
4.4. Analysis on HTR Management and HTR Wood Marketing Strategies ............................................ 28
4.4.1. General Strategy on HTR Management ............................................................... 29
4.4.2.Policy in Determining Base Price of HTR Wood Products ............................... 30
V. CONCLUSION AND RECOMMENDATION ...................................................................... 33
5.1. Conclusion ....................................................................................................................................... 33
5.2. Recommendation ............................................................................................................................. 34
BIBLIOGRAPHY .............................................................................................................................. 35
v
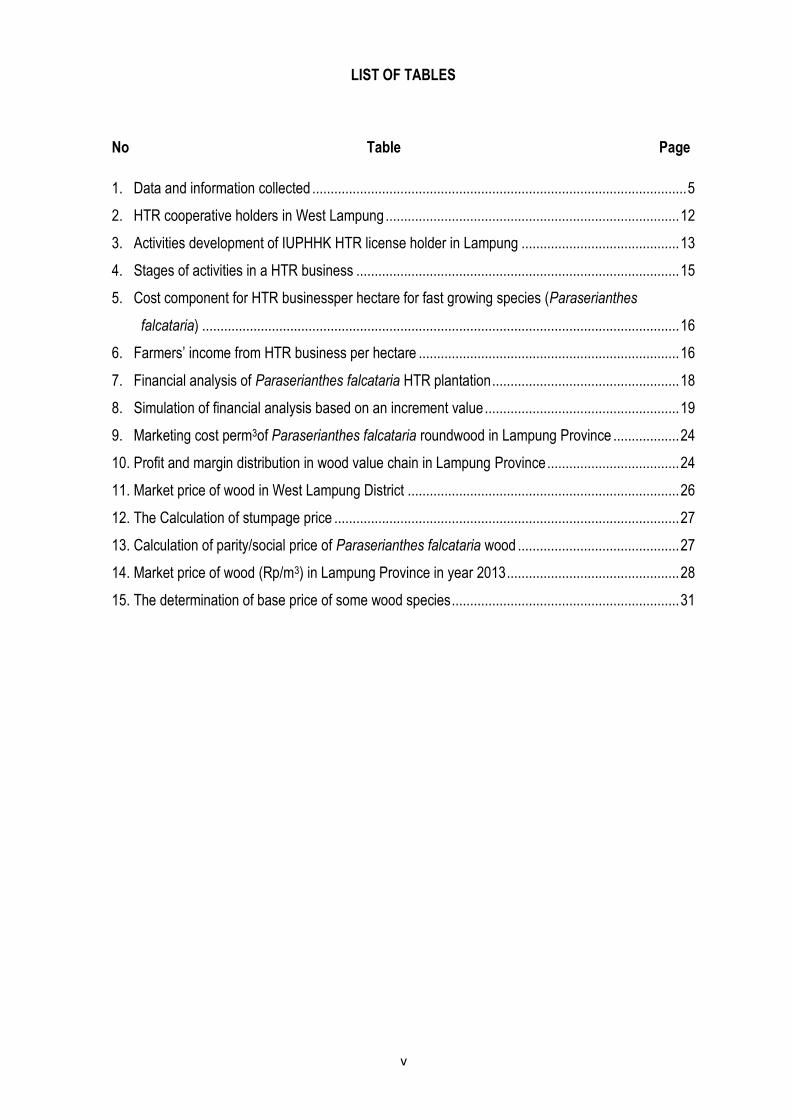
LIST OF TABLES
No Table Page
1. Data and information collected ...................................................................................................... 5
2. HTR cooperative holders in West Lampung ................................................................................ 12
3. Activities development of IUPHHK HTR license holder in Lampung ........................................... 13
4. Stages of activities in a HTR business ........................................................................................ 15
5. Cost component for HTR businessper hectare for fast growing species (Paraserianthes
falcataria) .................................................................................................................................. 16
6. Farmers’ income from HTR business per hectare ....................................................................... 16
7. Financial analysis of Paraserianthes falcataria HTR plantation ................................................... 18
8. Simulation of financial analysis based on an increment value ..................................................... 19
9. Marketing cost perm3of Paraserianthes falcataria roundwood in Lampung Province .................. 24
10. Profit and margin distribution in wood value chain in Lampung Province .................................... 24
11. Market price of wood in West Lampung District .......................................................................... 26
12. The Calculation of stumpage price .............................................................................................. 27
13. Calculation of parity/social price of Paraserianthes falcataria wood ............................................ 27
14. Market price of wood (Rp/m3) in Lampung Province in year 2013 ............................................... 28
15. The determination of base price of some wood species .............................................................. 31

vi
LIST OF FIGURES
No Figure Page
1. HTR area (ha) of each cooperative in Lampung Province ........................................................... 12
2. Wood processing industry inLampung (Source BP2HP Wil VI Lampung) .................................... 20
3. Types of industry in Lampung Province ....................................................................................... 21

vii
APPENDIX
No Table Page
1. List of respondents of HTR cooperative management and members ......................................... 36
2. List of informants (market actors) ............................................................................................... 38
2. List of questions ......................................................................................................................... 39
4. Pictures of activities .................................................................................................................... 43


1
I. INTRODUCTION
1. 1. Background
Community Based Plantation Forest (HTR) programme provides access rights to
communities living around forest areas to play an active role as agents of development in
plantation forests in state-owned forest areas. The objectives of the HTR programme are to
develop HTR business. Problems that could potentially be an obstacle in the development of
smallholder plantations are the feasibility and HTR products marketing.
Some previous studies showed that HTR business in general, is only as a minor
instead a major source of income. Research by Darusman and Hardjanto (2006); Lubis
(2010), as well as Sitanggang (2009) showed that community plantation forest business has not
become a significant source of household’s income. On the other hands, farmers are rational
individuals, meaning that the choice to engage in a business investment is determined by the
potential of a profit which will be received from such business.
These conditions raise questions regarding HTR feasibility. Therefore, the feasibility
analysis of HTR is important to study.
From the feasibility analysis of business, the standard price of HTR products can be
identified. Besides the financial feasibility of HTR, a review that is more macro aspects of the
marketing of the HTR product is also needed. Studies on HTR production marketing include
market potential of timber produced from HTR activities, product marketing channel from farmer
growers to industries, and profit distribution for each market actors in the market chain.
The study was conducted in Lampung province as one of the three study sites besides
West Nusa Tenggara and North Sulawesi. HTR Programme in Lampung started since the year
2010. Based on the Ministry of Forestry Decree No. 47 of 15 January 2010, an area of 24,835
hectares was assigned as allocated HTR areas. However, field verification suggested a change
in the allocated HTR areas size into 22,772 hectares. Six cooperatives which cover an area of
15,384 hectares or 67.7% of total allocated HTR areas have been approved for HTR license.
Many research relating to timber business have been done. However, there is a little to
be done for economic analysis on HTR business. Previous research results can be used as
references in the economic study on HTR. Race et al. (2009) stated that the community-
based forest plantation business only provides a marginal financial benefit. Siregar et al. (2007)
reported a case in Kediri where Paraserianthes falcataria is planted together with various

2
agricultural crops. The combination provides revenue in a relatively high interest rate (17.53%).
In the case in Costa Rica, Kishor and Constantino (1993) reported that business in community
timber plants is more profitable than other crops at the time when bank interest rate is low.
However, it is not when the bank interest rate is high. This condition becomes a reason why
farmers are not interested in forest plantation business.
1.2. Problem Formulation
Feasibility and market opportunities for timber are one of critical success indicators of
smallholder tree plantations. This study aims to answer some fundamental questions related to
the feasibility of HTR farming. The main problems to be answered in this study are:
a. Is HTR farming financially feasible?
b. How is the wood market channel and how is the margin distributed?
c. How is an optimum price for HTR product determined?
d. What are the problems faced by HTR farmers and what are the strategies for HTR
management in order for the business to develop better?
1.3. Hypothesis
Hypothesis developed in this study is that HTR business is financially feasible and has
a market potential.
1.4. Purposes and Objectives
Economic study and HTR standard price are intended to provide data and information
related to management strategies of smallholder plantations. Objectives to be achieved from
the economic study and HTR standard price are:
1. Analyzing the financial feasibility of HTR management.
2. Inventory of marketing system in HTR management.
3. Conducting analysis on standard price of HTR products.
4. Identifying problems and constraints in the implementation of HTR programme in the study
sites and formulating policy recommendations for HTR development.

3
1.5. Outcome and Impact
Economic study and standard price of HTR products will result in the following
outcomes:
1. Data and information on financial feasibility of HTR activities.
2. Data and information on market and marketing system.
3. Data and information on standard price of HTR wood.
4. Data and information on HTR management condition and the formulation of policy
strategy.
The expected impact of this study is the development of HTR business system that is
beneficial to all agencies involved in HTR development. Another expected impact is the
creation of conditions where HTR becomes a main business for HTR license holders.
1.6. Scope
The scope of economic study and standard price of HTR forest products are: financial
feasibility study on HTR at a household level, study on potential and market chain of HTR
products, determination of feasible standard-price of HTR products, analysis of problems in
HTR management, and the recommendations of government policy on HTR management and
marketing regulation.
4
II. RESEARCH METHOD
2.1. Location and Research Respondents
The study was conducted in Lampung Province. Site selection was done intentionally
(purposive sampling) that is the location of the implementation of the ITTO project CFM-PD
001/10 Rev.2 (F): "Strengtehning Capacity of Stakeholders for the Development of Community-
Based Forest Plantation at Three Selected Areas in Indonesia".
Plantation forest management under HTR programme in Lampung province has
started in West Lampung District to date. There are six HTR license holders (cooperatives) in
West Lampung. The HTR sites spread over five Sub-Districts namely Bengkunat, South
Pesisir, North Pesisir, Lemong, and Central Pesisir.
The respondents were the managers of six HTR cooperatives, members of the
cooperatives, as well as HTR sharecroppers. The total respondents were 50 persons who were
the managers and members of cooperatives. List of respondents is attached as Appendix 1.
Marketing study on HTR products was conducted through surveys and interviews with
market actors. The determination of the respondents was done through snowball sampling,
where based on information from a farmer, the next respondent to whom the timber is sold was
determined. The informants as the source of data in the marketing activities were timber
marketing actors, including farmers having experiences in selling timber, village-level buyers
or middlemen, sawmill owners, sawmill operators, and timber depot owners at a district and a
provincial levels. The number of research informants for timber marketing activities was 18
people. List of informants in timber marketing is in Appendix 2.
Besides actors in HTR activities, which the managers and the members of
cooperatives, data concerning the programme implementation of HTR was also collected from
informants among the local government and the Ministry of Forestry Technical Unit (BP2HP) in
Lampung Province. The Ministry Offices at the provincial level that were contacted for data
collection were: 1) BP2HP Lampung Region VI, 2) the Provincial Forestry Office of Lampung
Province, 3) the Provincial Office of Cooperatives, Small and Medium Enterprises Trade in
Lampung Province, 4) the District Forestry Office of West Lampung, and 5) the District Office of
Industry and Commerce of West Lampung District.

5
2.2. Data Collection Technique
Data collection techniques were:
1. Observation: by conducting direct observation of biophysical conditions in the field
related to the implementation of cooperative activities in six HTR cooperatives,
activities being carried out, management condition, and the condition of HTR members.
2. Literature review: data collection through reviews on the results of previous studies and
reports of activities derived from relevant institutions.
3. In-depth interviews and focus group discussions (FGDs).
Data collected included primary data and secondary data. Primary data were collected
by survey method, observation, or interviews using a structured question-naire to marketing
actors. The list of the questions can be found in Appendix III. Primary data included data on
HTR management costs and revenues, data on HTR product marketing channel, data on
marketing margin distribution for each marketing actors, as well as the problems faced in HTR
management. These data were collected through questionnaires, discussions and interviews
with HTR license holders, merchants, and wholesalers. In-depth interviews were also
conducted on local government officials to explore information on the local government
programmes in HTR management and wood marketing activities.
Secondary data was collected through literature reviews or reports from relevant
agencies such as the Department of Forestry and Agriculture, the Department of Industry and
Trade, the Central Bureau of Statistics. Secondary data included general conditions on HTR
management, data on wood-processing industries which are market potential for HTR products.
Table 1.Data and information collected
No. Benefit of analysis/collected data Data Source Method of Collection
I. Feasibility Analysis of HTR Enterprise
Data on cost and income of HTR Manage-ment activities at farmer level
HTR Farmers Interview
II Market channel analysis of HTR Products
Data on market channel models for HTR products
HTR Farmers Merchants
Interview
III Standard Price analysis of HTR Product
Data on margin and cost presented by market actors
Merchants Interview

6
No. Benefit of analysis/collected data Data Source Method of Collection
IV. Analysis on strategies on policy and market development of HTR products
Secondary data related to HTR management
General condition of area, forest resource potential , data on allocated HTR area (Target and realization of HTR develop-ment in study sites)
Director General (DG) of Forest Utilization and Provincial Forestry Office
study reports
. Related regulations: - HTR establishment and development - maketing of HTR products - user industry of HTR products
DG of Forest Utilization, DG of Plannology, and Local Government
study reports
Data and information related to market and marketing of wood products
2.3. Data Analysis
Data were analyzed qualitatively and quantitatively. Qualitative analysis was done to
explore the general and specific description of the study sites, marketing channels and
marketing structure. Quantitative analysis was done to identify business feasibility, market
variability by using marketing margin analysis. In summary, the stages of analysis and
analytical models used to answer the research objectives were:
1. HTR cost analysis which was intended to determine all cost components and the amount of
costs expended by producers/farmers in the production process of HTR timber.
2. Financial Analysis of HTR farming, including analysis of BCR, NPV and IRR, to determine
the feasibility of HTR farming
3. Analysis of the trade system to determine the distribution of wood from the manufacturer to
the end users. Analysis of marketing margin and profit margin was done to identify the
benefit received by each of the businesses actors.
2.3.1. Financial Feasibility Analysis
In order to find a comprehensive measure of the feasibility of a project/ investment, a
wide range of index called the investment criteria has been developed. Each index uses
discounted present value of current benefits and costs over the life of a project.
The following are the investment criteria used in the feasibility analysis of HTR in
Lampung Province.
1. Net Present Value (NPV).
2. Benefit Cost Ratio (BCR).
7
3. Internal Rate of Return (IRR).
- NPV (Net Present Value)
NPV calculation in an investment appraisal is a practical way to determine
whether a project is profitable or not. NPV is the difference between the Present Value of
flow of Benefit and Present Value of flow of Costs. The project is profitable if it has a
positive value of NPV (NPV> 0).
Explanation:
Bt = Benefit at year t
Ct = Cost at year t
t = length of investment
i = interest rate
Criteria:
If NPV > 0, meaning profitable, where the benefit received by the project is higher
than total cost expended.
If NPV = 0, meaning break even point, where the benefit received is only enough to
cover total cost expended.
If NPV < 0, meaning loss, where total cost expended is higher than benefit received.
- Benefit Cost Ratio (BCR)
BCR is an assessment done to identify the level of efficiency of the use of a cost
which is a comparison between the positive net present value and the negative net present
value. A project is feasible and efficient to be implemented if the value of the Net B/C is >
1, meaning that the benefits outweigh the costs expended and the opposite applies.
Explanation:
Bt = Benefit at year t
Ct = Cost at year t
i = prevailing interest rate
t = HTR project period
n = HTR project age
Criteria:
If B/C>1 = profitable
tn
t i
CtBtNPV
11
n
it
n
it
i
Ct
i
Bt
CB
1
1
1
1

8
if B/C<1 = loss
- Internal Rate of Return (IRR)
IRR is the value of the discounted interest rate that makes the NPV of a
project/investment = 0. IRR is used to determine the economic ability of the business unit
whether the investment can be done or not.
Explanation:
- NPV1 = NPV with the lowest positive value
- NPV2 = NPV with the lowest negative value
- i1 = Interest rate producing the lowest positive value of NPV
- i2 = Interest rate producing lthe owest negative value of NPV
Investment criteria:
- If IRR > i ; meaning investment is feasible
- If IRR = i ; meaning investment is on a break-even point
- If IRR < i ; meaning investment is not feasible
2.3.2. Marketing Analysis and Base Price
To find the level of marketing efficiency, this study uses several variables, namely the
analysis of profit margin; 2) marketing margin, and 3) the level of operational efficiency by using
the parameters of mark-up on selling (Desai, 2001).
1. Profit margin
2. Marketing Margin: Mp = Pr – Pf atau MP = ∑ bi + ∑ ki
3. Operational efficiency level based on mark up on selling

9
Explanation:
Mp = Marketing Margin;
Pr = Price at consumer level (user);
Pf = Price at producer level (farm);
bi = 1st cost of marketing ;
ki = 1st profit ;
Ski, Sbi = benefit received by marketing institution;
Sp = price contribution received by producer.
To set a base price of HTR timber sales, three approaches, namely the calculation of
market price, stumpage price, and social/parity price can be applied (Irawati, et al., 2008)
- The market price is the price established through market mechanisms, where there is a
bargaining process between consumers and producers who meet in the HTR market.
Data on HTR timber market price at a farm level can be obtained from HTR farmers,
traders at a village level and in the industries that directly buy wood from farmers /
wood producers.
- Stumpage price is the price that reflects the value of the stand. HTR farmers expect
that they are able to cover all costs required to produce wood and expect to get profit
from their efforts. Costs expended in HTR development are all cost components
ranging from the cost of seed procurement, planting activities, costs of stand
maintenance until the trees are ready for harvesting and selling.
- The social / parity price is the price that produces the best allocation of resources so it
will produce the highest profit. Social price is calculated on the basis of opportunity cost
that will give the most profitable alternative for HTR wood products by using parity price
approach. HTR social price of wood is derived from the international market price.
2.4 Species of HTR plantation and Assumption
In accordance with the HTR concept, the tree species are fast growing species with a
six to eight year life cycle. Based on interviews and field observations, the tree species
selected for HTR were Paraserianthes falcataria and Anthocephalus cadamba. Both species
have a pretty good market potential. Paraserianthes falcataria has proven to be accepted in the

10
wood processing industries. Meanwhile, Anthocephalus cadamba started to attract many
people, although the market for Anthocephalus cadamba has not been predicted yet. No data
and information were obtained regarding to farmers’ experiences on selling Anthocephalus
cadamba wood since Anthocephalus cadamba they planted was only one year old and has not
ready for harvesting. For the reason, financial and market price analysis, stumpage and social
price of this fast- growing species is represented only by data on Paraserianthes falcataria.
Besides these two tree species, many people in Lampung Province also plant a local
tree species namely Michelia spp.. Planting cycle of Michelia spp. is longer than Paraserianthes
falcataria and Anthocephalus cadamba, which is 10-30 years.
To perform a financial analysis of HTR plants, fast growing species such as
Paraserianthes falcataria and Anthocephalus cadamba would be used. Some basic
assumptions were required in the calculation. The assumption was obtained from the analysis
of conditions in the field.
Assumptions used are:
1. HTR development analysis unit used is 1 (one) hectare.
2. Planting cycle used is 8 years, in accordance with the HTR concept - fast growing species
(Paraserianthes falcataria and Anthocephalus cadamba). As discussed above, these
species have been chosen by farmers in Lampung because of its fast growing
characteristics, short life cycle, and has a market potential.
3. Data on planting costs was assessed based on interviews with farmers in Lampung. The
planting cost per hectare for Paraserianthes falcataria was Rp 9,105,000. This cost is
higher than the standard for loan disbursed, which is regulated by the Regulation of the
Head of Centre for Forest Development Funding No. P.01/P2H-1/2010. The loan
disbursed is Rp 8,531,900 per hectare.
4. The market price of Paraserianthes falcataria timber based on market survey and
interviews is Rp 200,000 for each cubic meter in the form of standing tree.
5. The number of trees that grow per hectare until the end of the cycle (8 years) is as many
as 400 trees. This assumption is adjusted to the minimum requirements set by the
government in assessing the success of HTR.
6. The interest rate (i) used is 10% per year.

11
III. GENERAL PICTURE OF HTR PROGRAMME IN LAMPUNG PROVINCE
3.1. HTR Development in Lampung Province
Based on the Regulation of the Minister of Forestry No. HTR. 47/Menhut-II/20120 of 15
January 2010 on allocated HTR areas, total area allocated for HTR in Lampung is 24,835
hectares. West Lampung District has issued HTR license for two HTR cooperatives in 2010,
three cooperatives in 2011, and one cooperative in 2012. Figure 1 shows the areas of HTR
areas managed by each cooperative in Lampung Province. Table 2 presents data on the six
cooperative holders in Lampung Province.
Figure 1. HTR area (ha) of each cooperative in Lampung Province
LambarSuburRezeki
SinarSelatan
UnggulJaya
JayaBersama
LabuwaiLestari
Bina HutanUtara
8,000
3,115
1,464 1,460
675 670

12
Table 2. HTR cooperative holders in West Lampung
No Name of HTR
cooperative holders
Decree of Head of District
Date Area
size
(Ha)
Location
Location
1. Cooperative Lambar
Subur Rezeki
B/296.a/KPTS/11.11/2010 21 October 2010 8,000 Pekon Tanjung Kemala
Bengkunat Belimbing Sub-District
Unit I Ngambur
Unit II Bengkunat
Unit III Bengkunat Belimbing
2. Cooperative Sinar
Selatan
B/319/KPTS/11.11/2010 16 November 2010 3,115 Pekon Biha
South Pesisir Sub-District
HPT South Pesisir Sub-District
3. Cooperative Bina
Hutan Utara
B/153/KPTS/11.14/2011 23 March 2011 670 Pekon Kota Karang
North Pesisir Sub-District
HPT Pekon Batu Raja and Pekon
Gedau, North Pesisir Sub-District
4. Cooperative Jaya
Bersama
B/398/KPTS/11.14/2011 30 June 2011 1,460 Pekon Malaya
Lemong Sub-District
HPT Pekon Malaya, HPT pekon
Suka Mulya, HPT Pekon Paga
Dalam, and HPT Pekon Cahaya
Negeri, Lemong Sub-District
5. Cooperative Unggul
Jaya
B/398.a/KPTS/11.14/2011 30 June 2011 1,460 Pekon Rata Agung
Lemong Sub-District
HPT Pekon Rata Agung and HPT
Pekon Lemong, Lemong Sub-
District
6. Cooperative Labuwai
Lestari
B/121/Kpts/II.14/2012 7 March 2012 675 Pekon Pahmugan
Central Pesisir Sub-District
HPT Pekon Pahmungan, Central
Pesisir Sub-District
Total
15,384
13
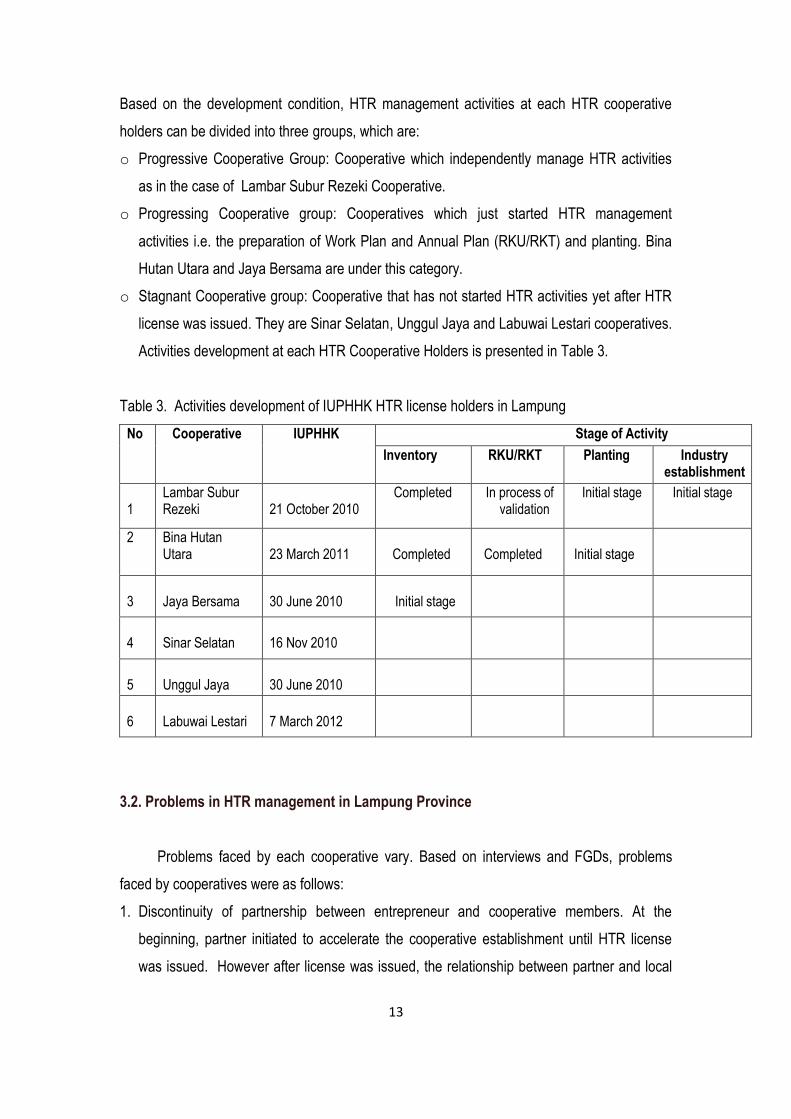
Based on the development condition, HTR management activities at each HTR cooperative
holders can be divided into three groups, which are:
o Progressive Cooperative Group: Cooperative which independently manage HTR activities
as in the case of Lambar Subur Rezeki Cooperative.
o Progressing Cooperative group: Cooperatives which just started HTR management
activities i.e. the preparation of Work Plan and Annual Plan (RKU/RKT) and planting. Bina
Hutan Utara and Jaya Bersama are under this category.
o Stagnant Cooperative group: Cooperative that has not started HTR activities yet after HTR
license was issued. They are Sinar Selatan, Unggul Jaya and Labuwai Lestari cooperatives.
Activities development at each HTR Cooperative Holders is presented in Table 3.
Table 3. Activities development of IUPHHK HTR license holders in Lampung
No Cooperative IUPHHK Stage of Activity
Inventory RKU/RKT Planting Industry establishment
1
Lambar Subur Rezeki
21 October 2010
Completed In process of validation
Initial stage
Initial stage
2 Bina Hutan Utara
23 March 2011
Completed
Completed
Initial stage
3
Jaya Bersama
30 June 2010
Initial stage
4
Sinar Selatan
16 Nov 2010
5
Unggul Jaya
30 June 2010
6
Labuwai Lestari
7 March 2012
3.2. Problems in HTR management in Lampung Province
Problems faced by each cooperative vary. Based on interviews and FGDs, problems
faced by cooperatives were as follows:
1. Discontinuity of partnership between entrepreneur and cooperative members. At the
beginning, partner initiated to accelerate the cooperative establishment until HTR license
was issued. However after license was issued, the relationship between partner and local
14
community ended. This resulted in the activity discontinuation. The reason for the
partnership discontinuation was no more interest from entrepreneurs to continue HTR
activities. This information was obtained from cooperative members. However, clarification
from partners was needed to identify the reasons behind such condition.
2. Lack of understanding from cooperative managers and members who were local community
on HTR regulations. This was identified by the absence of activities after the partner
stopped providing facilities and facilitation in the activities. It was also resulted from the
instant process of cooperative establishment by partner, causing a minimal participation of
local community in the formation and management of the cooperative.
3. Limited financial capital. Cooperative which was reorganized and restructured for its HTR
activity planning such as Jaya Bersama cooperative faced a financial problem. Field
activities such as individual boundary mapping, stand inventory, workplan formulation, and
planting activities needed considerable financial support. Meanwhile, financial capital
resource was still limited to member’s contribution and voluntary donation. At the same
time, the early stages of HTR development required considerable amount of capital.
Therefore, Centre for Forest Development Funding (BLU) support to provide loan to
cooperatives was very much needed. The ability of cooperative management to access loan
from BLU was also poor.
4. HTR facilitators have not optimally facilitated HTR activities. The facilitation by facilitators
assigned by the Technical Office Unit of DG of Forest Utilization (BP2HP) was still limited to
the preparation of HTR work plan and annual plan. The problems with HTR facilitators were
the recruitment system and performance evaluation which still needed improvement.

15
IV. RESULT AND DISCUSSION
4.1. Financial Analysis of HTR Business
For the financial analysis of HTR business, data analysis on the stages of activities of
HTR business, analysis on HTR costs and revenues, and the feasibility analysis using
parameters of NPV, BCR, and IRR are needed.
4.1.1. Stages of Activities in HTR Business
The following are stages of activities done for one rotation of a plant species having a
life cycle of eight years.
Table 4. Stages of activities in a HTR business
No Activity Component Year
0 1 2 3 4 5 6 7 8
A PLANTING
1 Nursery and seedling √ √ √ √ √ √ √ √ √
2 Land preparation √ √ √ √ √ √ √ √ √
3 Planting √ √ √ √ √ √ √ √ √
B MAINTENANCE
1 Tending year 1 √ √ √ √ √ √ √ √ √
2 Tending year 2
√ √ √ √ √ √ √ √
3 Tending year 3
√ √ √ √ √ √ √
4 Extended tending year 1
√ √ √ √ √ √
5 Extended Tending year 2
√ √ √ √ √ √
C FOREST PROTECTION
1 Pest and disease control √ √ √ √ √ √ √ √ √
2 Fire control √ √ √ √ √ √ √ √ √
3 Forest safeguarding √ √ √ √ √ √ √ √ √
D HARVESTING/FELLING
√
4.1.2. Cost Component of HTR Business
Cost component assumption is for a one-hectare planting area. Data on cost was
obtained from interviews with farmers planting Paraserianthes falcataria and Anthocephalus
cadamba. These two species have relatively similar cost component. Differing factor between
the two species is the price of seedlings. Other components such as cost for land preparation,
planting and tending are relatively the same.

16
Table 5. Cost component for HTR business per hectare for fast growing species
(Paraserianthes falcataria)
No Activity component Unit
(Ha) HTR Unit Price (Rp)
A PLANTING
1 Nursery and Seedling Ha 1.380.000
2 Land Preparation Ha 3.600.000
3 Planting Ha 2.000.000
Total A
6.980.000
B MAINTENANCE and PROTECTION
1 Tending year 1 Ha 475.000
2 Tending year 2 Ha 450.000
3 Tending year 3 Ha 400.000
4 Extended Tending 1 ha 400.000
5 Extended Tending 2 Ha 400.000
Total B
2.150.000
Total A + B Ha 9.105.000
4.1.3. Income from HTR Business
Planting pattern done by community at the HTR sites in West Lampung District is
monoculture, without any other plants including food crops. Therefore, the source of income
for farmers is the plantation yield harvested in the end of planting cycle (an eight-year cycle) as
shown in Table 6.
Table 6. Farmers’ income from HTR business per hectare
Planting cycle 8 year
Minimum increment per hectare at the end of
planting cycle
80 m3/ha (annual increment of 10m3 / ha)
Maximum increment per hectare at the end of
planting cycle
320 m3 / ha (annual increment of 40m3 / ha)
Market price of Paraserianthes falcataria wood Rp 200,000/m3
Minimum income per hectare Rp 16,000,000,00
Maximum income per hectare Rp 64,000,000,00

17
Assumptions of minimum and maximum increment of Paraserianthes falcataria was
based on result of research by Lemmens (1993) which stated that average annual volume
increment of Paraserianthes falcataria varies between 10-40 m3/ha.
Based on analysis in Table 6, income expected by farmers is around Rp 16,000,000 to
Rp 64,000,000. With the average annual increment of 25 m3 per hectare, income at the end of
the 8th year is Rp 40,000,000.
4.1.4. NPV, BCR, and IRR Analysis
To calculate the financial analysis of HTR business, a discount rate of 10% is used
(adjusted to interest rate for deposit of State-owned Banks in the year 2012). Reduction of
benefit and cost at certain discount rate is a calculation to determine the feasibility of an
investment. Criteria used in the calculation of evaluation whether HTR business is feasible or
not are NPV, BCR, IRR (Andayani, 2008).
Result of analysis of financial feasibility of HTR business is presented in Table 7.
Assumption used in the calculation of this financial analysis is by using the median of
harvesting income of Rp 40,000,000. Feasible financial parameters at that level of income
shows that HTR business is feasible with NPV value of Rp 9,911,550; BCR 2.13, and an IRR
of 19%.

18
Table 7. Financial analysis of Paraserianthes falcataria HTR plantation
No Activity Component Year
1 2
3
4
5
6
7
8 Total
A PLANTING
1 Nursery and Seedlings 1,380,000
2 Land Preparation 3,600,000
3 Planting 2,000,000
B TENDING
1 Tending year 1 475,000
2 Tending year 2
450,000
3 Tending year 3 400,000
4 Extended tending 1 400,000
5 Extended tending 2 400,000
TOTAL COST / HA 7,455,000 450,000 400,000
400,000
400,000
-
- -
9,105,000
INCOME
40,000,000
BENEFIT (7,455,000) 450,000) (400,000) 00,000) (400,000) - - 40,000,000
Interest 10%
DF 1.000 0.909 0.826 0.752 0.683 0.467
DC (7,455,000) (409,050) (330,400) (300,800) (273,200) - -
DB
18,680,000
NPV
9,911,550
BCR
2. 13
IRR 19%
DF = Discount Factor, DC= Discount Cost, DB=Discount benefit

19
The calculation of feasibility criteria for HTR business resulted in an NPV value of Rp
9,911,550. Since the value of NPV is >0, it means that HTR business is profitable because the
benefit received by the enterprise is higher than the total cost expended. This calculation also
shows that the present value of net profit received by HTR farmers has a positive value during
one rotation of Paraserianthes falcataria plantation.
The calculation of B/C ratio is to know whether with the cost expended, a higher
benefit will be received. The calculation of B/C shows a positive value (2.15). This means that
Paraserianthes HTR business is feasible to be done. This also means that for expenditure of
Rp 1, a benefit of Rp 2.15 will be received.
The calculation of IRR shows the average level of annual profit for the enterprise doing
the investment. It is expressed in a percentage (Gittinger, 1986). The calculation shows that a
value of IRR is 19%. This value is higher than the value of i (10%). It means that
Paraserianthes falcataria HTR business is feasible to be done because the value of profit is
much higher than the prevailing interest rate.
The financial analysis uses the assumption of an average annual increment of 25 m3
per hectare. Lemmens (1993) stated that the annual increment of Paraserianthes falcataria is
around 10-40 m3 per hectare. Therefore, parameter value of financial analysis can be
simulated by using an increment value approach. Simulation value of NPV,BCR, IRR is based
on increment shown in Table 8.
Table 8. Simulation of financial analysis based on an increment value
Cost Rp 9,105,000
Planting cycle 8 year
Increment 10 m3/year 40 m3/year
NPV (-) Rp 1,296,540 Rp 21,119,550
BCR 0.85 3.41
IRR 4% 28%
From the Table above, it is identified that if annual increment is only 10 m3/ha, the
plantation business is not feasible to be done. This is also shown by the value of a negative
NPV, and BCR (less than 1). At the condition of minimal increment, the business becomes
feasible, if wood price increases to minimum Rp 225,000 per cubic meter.
In the meantime, at the optimistic increment value of maximum 40 m3 per hectare,
NPV value will automatically increase to Rp 21,119,550; BCR to 3.41; and IRR 28%. In the
optimal increment value, a low wood price will still make the enterprise to be feasibly done.

20
Simulation analysis shows that at the optimal increment, wood price could still be accepted at
Rp 65,000.
This price simulation analysis is an initial information to get a description on
determining a basic price of wood. However, below will be described the method used to
determine a base price of wood based on the methodology of market value, stumpage value,
and parity value.
4.2. Market Analysis and Market Channel of HTR Products
4.2.1. Market and Marketing of Community Produced Wood in Lampung Province
To support successful HTR management, market assurance for HTR products is
needed. HTR wood marketing activities in Lampung Province has not been identified, since
HTR activities had just started at the initial stage of planting. The age of trees was only around
9 months (interview with the leader of BHU cooperative).
The potential of wood market in Lampung province can be identified from wood
processing industry data. Installed capacity of wood processing industry in Lampung is 567,900
m3 per year. The details of each District are shown in Figure 2.
Figure 2. Wood processing industry in Lampung (Source BP2HP Wil VI Lampung)
0 20000 40000 60000 80000 100000 120000 140000
BANDAR LAMPUNG
PESAWARAN
PRINGSEWU
LAMPUNG TIMUR
LAMPUNG TENGAH
LAMPUNG SELATAN
LAMPUNG UTARA
TULANG BAWANG
TULANG BAWANG BARAT
LAMPUNG BARAT
WAY KANAN
MESUJI
120,000
61,500
3,500
23,000
44,000
25,800
118,000
36,000
3,000
28,400
76,000
6,000

21
In general, those industries produce sawn timber. The number of sawmill is 106 units
from a total of 120 industries (88%). There are 9 units of veneer processing industries, 4
plywood mills, and one unit of furniture factory with a capacity of 400 m3/year (Figure 3).
Figure 3. Types of industry in Lampung Province
In addition to high capacity industries, there are also small and medium scale wood
processing industries that could absorb wood market from Lampung and its surrounding
regions. Therefore, wood products in Lampung Province has a potential market.
Data on marketing activities in Lampung province, especially in West Lampung District,
was collected from the wood market which was run traditionally by local people having private
forest land as well as customary land. Market analysis uses the concept of value chain, which
is tracing product from one market actor to the next.
The study is focused on market and marketing of forest products. In addition to timber
forest products, Lampung province also produces non-timber forest products that is Shorea
spp. resin. However, the focus of this study is basic price of wood commodity. Wood species
in the wood market is divided into two groups, namely: 1) Shorea spp. wood known as a
Premium Wood Class, and 2) Mixed Wood, consisting of various species of wood except
Shorea spp. Wood traded in wood market is classified: 1) Round wood, 2) square logs, and 3)
Sawn timber of various sizes such as planks and rafters.
There are five main market actors involved in the wood marketing chain. They are:
a. Farmer/wood producer
Farmer/Wood producer is the first marketing chain. Farmers plant wood on HTR land or
on private land.
b. Collector merchant/middleman/chainsaw owner

22
Collector merchant is the first to buy wood from farmer/producer. Collector merchant is
also called middlemen. In some places, they are also called tengkulak (middleman).
They usually have chainsaw since they buy wood from farmers as a standing trees.
Collector does the felling, wood processing into square logs, transporting the products to
the roadside, and selling wood to a wholesaler or a building depot. There are various
activities done by a collector. Some collectors only fell trees without any further
processing. After logs are produced, they will bring the logs to sawmill for processing logs
into sawn timber.
c. Sawmill owner
Is the owner of a large scale sawmill who buys logs from wood collector. After wood is
processed into square logs, sawmill operators sell it to the next wood marketing chain
outside the district or even the provincial area. A sawmill owner usually has a high capital.
To obtain a steady supply of wood raw material, they usually have assistants who observe
the timber stock in the villages. Therefore, sawmill owner usually collector merchants
besides independent collectors, not associated with sawmill.
d. Panglong (depot for construction wood)
Owner of panglong or depot for construction wood is a wood merchant who are in contact
with the supplier of sawntimber and sell it to the end users. Panglong owners can be
classified into a district and a provincial level.
e. Consumers
Is the final actor in the wood marketing chain, who uses the wood in the form of sawn
timber.
Furthermore, there are four models of community produced wood marketing channel,
starting from the farmer who plant the tree to the end users at the household level. The four
models of wood market channel are illustrated in Figure 4.
Wood producer/farmer household consumers
Wood producer/farmer collector/chainsaw owner consumer
Wood producer/farmer collector/chainsaw owner sawmill panglong (depot)
consumer
Wood producer/farmer collector/chainsaw owner panglong (depot) consumer
23
Wood sales from farmers to merchants are done through various ways. Among others
are:
1) Farmers offer trees directly to middlemen or sawmill owner. Information given is tree
location of trees, quantity, species and tree age.
2) Middlemen merchants, who has their own capital or work for sawmill owner. They will
observe or do a survey to the location and to assess/to invent the wood volume. Based on
this assessment, bargaining process on price will be done.
4.2.2. Margin distribution analysis
To identify the benefit distribution received by each business actors, the mechanism will
be described starting from the cost analysis of Paraserianthes falcataria stand development or
other fast growing species to the determination of sale price of product.
a. Market Price of Round Wood
Planting pattern is done in monoculture. The initial number of seedlings to be planted is
between 600 – 800 seedlings with the assumption that at least 400 of the planted seedlings will
survive until the end of planting cycle (harvested at the 8th year). Based on market survey and
interviews by using FGD method between HTR farmers and wood merchants, market price of
standing tree of Paraserianthes falcataria wood for each m3 is Rp 200,000. Based on farmer’s
experience in the field and supported by study results (Andayani, 2008; Putra, 2006; Sitanggang,
2009), Paraserianthes falcataria trees of 8 years old has reached an average diameter of 37.6
cm with height of free of branches bole of 10 m. Therefore, the average wood volume of
Paraserianthes falcataria bole is around 0.78 m3/stem. With a number of 400 trees per hectare
at the end of the planting cycle, wood volume expected from each hectare of plantation is 312
m3. Based on an average increment of 25 m3/ha/year, wood volume per hectare of
Paraserianthes falcataria at the age of 8 years is thus 200 m3. For calculation of a minimum base
price, wood volume of 200 m3 per hectare is used.
b. Marketing Cost Analysis
Marketing cost expended by each business actor includes chainsaw cost (felling and
bucking), transportation cost (from forest to market, cost for loading and unloading),
administration cost, and other costs. Table 9 shows the recapitulation of marketing cost based
on marketing pattern prevailing in Lampung Province.

24
Table 9. Marketing cost per m3 of Paraserianthes falcataria roundwood in Lampung Province
No Type of Cost Marketing Cost (Rp/m3)
1 Fee for chainsaw man (felling – bucking) 400,000
2 Transport to log deck (manpower) 10,000
3 Transport by truck 50,000
4 Load - unload (manpower) 30,000
5 Administrative cost (permit, retribution, tax, and others) 1,000
Total 500,000
c. Profit and margin distribution
In value chain analysis, profit and margin is differentiated. Profit is benefit for each
market actor by calculating all costs expended. In other words, profit is obtained from deducting
total income with total cost expended by each market actor. Meanwhile, margin distribution in the
value chain is obtained from the difference of benefit received by one market actor with another
market actor in the previous market chain.
Table 10 shows the profit and margin distribution in the wood value chain in Lampung
Province. The result of data analysis was obtained by tracing the value chain distribution in the
field. There were three market actors identified: tree owner/farmer, collector merchant and end
user. Trees sold by farmer did not originate from HTR activity, but growing among Shorea
javanica trees. The trees grew from natural regeneration, without any intensive tending. Shorea
javanica farmers were more focused on tending Shorea javanica trees and its resin. In other
words, the fast growing tree species grew naturally. This was being confirmed by the farmer
owning the trees that the trees grew without spending any cost invested on it. This assumption is
used in the analysis of value chain, where farmers did not spend any cost in the wood production.
Table 10. Profit and margin distribution in wood value chain in Lampung Province
Market actor
Cost Revenues Profits ‘Margins’
Total cost Additiona
l cost % Unit price
Unit % Unit %
Petani kayu rakyat 0 0 0% 200,000 200,000 80% 200,000 27%
Wood buyer 700,000 500,000 100% 750,000 50,000 20% 550,000 73%
Total 500,000 100% 250,000 100 750,000 100%

25
Based on data on Table 9, margin distribution between wood buyer and tree
owner/farmer is not equally distributed (27% and 73%). This proportion shows that highest
margin is received by buyer. However, this margin distribution does not take into consideration
the cost expended by market actors. If cost of production component is taken into consideration,
profit received by wood buyers is Rp 50,000/m3 (20%) and farmers Rp 200,000 (80%). Data
collected from the field shows that the value chain in the community wood market in Lampung
province is not as what should be.
Lesson learned from the case is that community wood market has no standard price.
Profit distribution to buyer which is Rp 50, 000/m3 should not be assumed as a small value.
Rather, it should be understood that the profit is received by buyer in a relatively shorter time than
that spent by farmer to plant trees. Furthermore, the profit per transaction of wood purchase can
reach minimum of Rp 250,000 or 5 m3 of wood per transaction (data from an interview).
Meanwhile, profit of tree owner which is Rp 200,000/m3 is received in the time scale of the tree
life cycle or more than five years.
Market condition and wood price which has no standard is one of the reasons why
community plantation forest has not developed as expected. In Lampung Province in particular,
farmers are not interested in planting timber rather they prefer to invest in agricultural produce
e.g. rubber, oil palm, and coffee. Investment in crop commodities is more promising in terms of
continuous income, shorter period of time, and easier marketing of produce. Meanwhile,
although timber has a high price, there is no standard yet for timber price. This is the reason why
timber plantation has not become a reliable business as a source of family income.
To encourage the business of community wood, a study is needed on the base price of
wood. The next sub-chapter will explain some methods in determining base price of wood, by
assuming that the wood is produced from community-based plantation fforest (HTR).
4.3. Analysis on Determination of HTR Wood Base Price
The determination of HTR wood base price can use one of the approaches, which are
market price, stumpage price, and social price (Irawati et al. 2008).
4.3.1. Market Price
Market price is the price formed through market mechanism. The price is from
bargaining process between consumers and producers who meet at the wood market. Wood

26
market price is determined by wood species and product specification. In Lampung province,
wood species in the market is classified into two groups, namely Shorea spp. and non Shorea
spp. or racuk (a local name). Racuk is classified into two groups based on the quality.
Premium (a high) quality racuk are e.g. Piper ningrum, Vitex pubescen, Cinnamomum spp.,
and Michelia spp. woods and non-class (a low quality) racuk are e.g. Alstonia spp. and
Anthocephalus cadamba wood. Tabel 11 shows the market price of various species and wood
products at study sites.
Table 11. Market price of wood in West Lampung District
No Product
Specifi-
cation
Size
Price (Rp)/m3
Shorea spp Premium
Racuk
Non-class Racuk
1. Planks 2/4 m x 25 cm x 2
cm
1,700,000 1,400,000 1,200,000 –
1,300,000
2/4 m x 25 cm x 4
cm
2,000,000 1,400,000 1,200,000 –
1,300,000
2. Squares Various
(3x3, 3x6, 4x6,
5x7, 7x14)
1,600,000–
2,000,000
750,000 –
800,000
500,000 – 700,000
Explanation: price at merchants = price at end user
Market price at a farmer level is evaluated based on tree measurement, species, and
location of the standing tree. Based on the interviews with farmers, price of tree received by
farmers is around Rp 100,000 for non Shorea spp. tree or racuk while for Shorea spp., the
price is around Rp 500,000. For racuk species, the price applies for trees with an estimated
volume of 0.5 m3. Therefore, price per m3 at a farmer level is Rp 200,000, excluding harvesting
and processing costs.
4.3.2. Stumpage price
Stumpage price is the price that reflects the value of stand. The price received by HTR
farmer should cover all costs expended in producing wood and there should be profit from his
venture. Therefore, stumpage price is calculated from the accumulation of costs expended,
profit and risk. Table 12 shows the results of analysis of stumpage price for fast growing
species of community wood.

27
Table 12. The Calculation of stumpage price
No. Cost Component Total (Rupiah)
1 Cost of production 9,105,000
Plantation life cycle (year) 8
Bank interest rate per year (%) 10
2 Value of stand on 8th year 19,517,376
Production (m3/ha) 200
3 Value of stand (m3/ha) 97,578
Profit 14,638
Risk 9,759
4. Value of stand after profit 112,225
5 Value of stand after profit + risk 121,984
Stand Value 121,984
Based on above calculation the stumpage price is Rp 121,984.
4.3.3. Parity/Social Price
Parity/Social price is the price that gives the best allocation of the resource and
therefore will give the highest level of profit. Social price is calculated on the basis of the base
price of opportunity cost, which is the most profitable alternative of wood produced from HTR
and using the parity price approach. The social price of wood is derived from wood price at the
international level, where social price of wholesalers and wood processing industries which is
the closest price with that at a farmer level is equal to international price after the adjustment to
the exchange rate, transportation cost, processing cost, and domestic marketing (Irawati et al.,
2008).
Community wood is sold to factory that will further process it into export commodity.
Therefore, social price is calculated based on the sale price at the factory door where wood is
processed. Parity price of Paraserianthes falcataria wood in Lampung province is around Rp
225,000 to Rp 240,000 per m3 (Table 13).
Table 13. Calculation of parity/social price of Paraserianthes falcataria wood
No. Cost Types (Rp/m3)
1 Price of Roundwood at factory door 700,000-750,000
2 Total Cost 500,000
Wage of chainsaw man (felling – bucking) 400,000
Transport to log deck (cattle or man) 10,000

28
No. Cost Types (Rp/m3)
Truck transport 50,000
Load - unload (manpower) 30,000
Administrative cost (permit, retribution, tax, and others) 10,000
3 Paraserianthes falcataria Roundwood Parity Price 200,000-250,000
Analysis for determining wood base price using three approaches (market price,
stumpage price, and parity price) gives different standard price. Analysis of stumpage price
resulted in a figure of Rp 121,984 per m3, market price resulted in a figure of Rp 200,000/m3,
while using analysis of parity price resulted in a figure between Rp 200,000 and Rp 250,000 per
m3.
To determine standard price for wood produced from HTR, the parity/social price can
be used as standard price. By using social price as a standard price, farmers receive a
maximum profit from HTR business. Thus, HTR farmers are encouraged and motivated in HTR
management because they receive a high profit. This condition will accelerate the HTR
development and enhance the economy of communities living around forest areas.
Besides fast growing species i.e. Paraserinathes falcataria and Anthocephalus
cadamba, many other species are also planted in Lampung province. They are Michelia spp.,
and Shorea family, in particular Shorea javanica. Table 14 shows the result of analysis of
market price of these wood species in year 2013.
Table 14. Market price of wood (Rp/m3) in Lampung Province in year 2013
No Wood species Price of
standing
tree
Price of log
at log deck
Wood price at
factory door
Sawntimber price in
market in Province
1. Paraserianthes falcataria 200,000 450,000 750,000 1,000,000
2. Michelia spp. 800,000 1,000,000 1,500,000 2,600,000
3 Shorea spp. 1,000,000 1,500,000 2,000,000 3,000.0000
4.4 Analysis on HTR Management and HTR Wood Marketing Strategies
Policy on marketing aspect of community wood is one of the aspects that government
should pay attention to if HTR is expected to develop well in the future. However, HTR
management also needs policy intervention to solve problems at a field level.

29
The study results, observation, interviews and FGDs can be used as valuable inputs
for the policy formulation on HTR. Various strategies can be formulated to address the
problems encountered in the HTR management in Lampung Province as described below.
4.4.1. General Strategy on HTR Management
Based on problem analysis in each HTR cooperative holders in Lampung Province,
there is the need for efforts from relevant agencies, both the Technical Units of the Ministry of
Forestry and the local government at provincial and district level to adopt strategies as follows:
1. Strengthening Cooperative Institution
To develop and to enhance the capacity of cooperative and community groups
through:
- reorganization of cooperative management
- formulation of work plan at cooperative level
- improvement of business institution
- strengthening working capital of cooperative.
2. Facilitation
The enhancement of facilitators’ capacity and the improvement of facilitators’ duty and
responsibilities in the field are needed. The technical unit of DG of Forest Utilization (BP2HP)
should develop criteria and indicators of duties and responsibilities of facilitators and reporting
system. This is to facilitate the performance evaluation system and incentive provision for
facilitators. Lessons learned from the BUTSI progranme around the year 1969 showed that
HTR facilitators can be recruited from new university graduates of forestry or agriculture.
Facilitators are advised to stay at the location where they work, be involved in HTR
development, and be enganged in communities’ everyday lives. They are provided with
incentive in the form of a piece of land. The land can be used as an example for the
community being assisted in terms of good HTR land management.
3. Strengthening the capacity of HTR farmers.
In some HTR cooperative holders, cooperative members are not actively involved in
HTR management. All land management activities is left entirely to the cooperative board. This
condition is certainly not in line with the original purpose of HTR programme which is to
enhance community participation in forest management. Thus, strengthening the capacity of
farmers is important to be done through intensive extension and facilitation.

30
The capacity building strategy for HTR famers suggests that the role of the Agency for
Human Resources Development and Forestry Extension becomes very important. The process
of forestry extension and farmer capacity building of smallholder plantations has become the
priority. However, the process is still underway. At the field level, strong cooperation and
coordination still needs to be maintained. Coordination between Technical Unit of DG of Forest
Utilization (BP2HP), Forest Service, Department of Cooperatives, Extension Board,
Department of Industry, and Regional Development Planning Board should not be just a
slogan, instead it must be realized in concrete programmes to enhance the capacity of the
communities as professional business communities in forest plantations.
4.4.2. Policy in Determining Base Price of HTR Wood Products
In connection with the lack of incentive in relation to standard price of timber produced
by local people, government policy is required to enhance farmers' interest in doing HTR
business. For the reason, the efforts to develop community produced timber market are done
by opening market channel. This is an opportunity to increase market price of timber. It can be
done among others by opening up channels of wood exports. These efforts will increase the
demand for community produced wood. Strong demand will drive the market into a perfect
competitive structure. Thus, farmers who produce good quality wood will get a fair price based
on the balance point of supply and demand.
Learning from the management of community forests in Java, many authors state that
the development of community forests in Java is driven by timber market. Similar experiences
occur in various parts of the world. Zhang and Owiredu (2007) reported that wood price is a
driving force for the development of community timber plants in Ghana. High demand, but
limited supply of wood and timber from natural forests has encouraged the development of
plantation forests including community teak forest plantations in Laos (Midgley et al., 2007).
Similarly in the Philippines, the development of community timber plantations is fueled by the
rising demand for timber and profitable timber price (Bertomeu, 2006).
In a developed country such as Japan, to attract farmers to become timber plant
growers, government subsidy is sometimes still necessary (Ota, 2001). The forms of subsidy
required to develop community timber plantation business include the partnership between
farmers and wood-processing industries. For this purpose, it is necessary to review policy in
partnership mechanism between entrepreneurs and HTR cooperative holders. The scope of
activities of a partnership may include crop production activities to product marketing. The

31
principles of partnership are the implementation of work norms and standards, so the
partnership works with the principle of equality, open and non-binding, market-oriented, the
improvement of forest land productivity orientation, respecting the functions and roles of each
party, willingness to grow and move forward together, as well as the competency to solve
problems by consensus. Partnership principle that should be implemented in wood marketing
activities is a balance of information and bargaining power between farmers and industries.
Thus, the partnership will provide a fair price for both parties.
To achieve an equal partnership, HTR farmers need to have information on price and
timber market. Similarly, in a perfect competitive market condition, forest farmers are expected
to have adequate capacity as entrepreneurs of forest plantations. For this purpose, the capacity
building of farmers as forest plantation entrepreneurs need to be seriously considered.
Policy formulation on base price of HTR timber sale suggested by Irawati et al. (2008)
can be considered, i.e. the selling price of HTR timber must be able to cover all costs of timber
production at a farm level. In addition, farmers should receive a reasonable profit from their
business. There are several factors for the government policy intervention to determine base
price of wood produced by communities. They are:
1. Bargaining position of farmers in determining the price is weak. Farmers agree with the
price determined by traders because farmers in an urgent situation to get money.
2. There is a difference of wood volume determination between the calculation done by
farmers and by traders (30-40%). The reason is that traders measure the top diameter
which is the smallest. Therefore, the price paid to the farmers is minimal. The Government
may determine the base price with an allowance of 30-40% of the market price. Irawati et
al. (2008) explains that the market price is the price that occurs in the field or actual price
and the government can not intervene further once the market price has been established.
Therefore, the base price is derived from the current market price with an allowance of 30-
40%. The results of the calculation of the base price are shown in Table 15.
Table 15. The determination of base price of some wood species
No Base price based on location Market Price
(Rp/m3)
Base Price
(Rp/m3)
1 Paraserianthes falcataria
- As standing tree 200,000 260,000 -280,000
- At Log Deck in forest road 450,000 585,000 – 630,000
- At factory door 750,000 975,000 – 1,050,000

32
No Base price based on location Market Price
(Rp/m3)
Base Price
(Rp/m3)
2 Michelia spp.
- As standing tree 800,000 1,040,000 – 1,120,000
- At Log Deck in forest road 1,000,000 1,300,000 – 1,400,000
- At factory door 1,500,000 1,950,000 – 2,100,000
3 Shorea spp.
- As standing tree 1,000,000 1,300,000 – 1,400,000
- At Log Deck in forest road 1,500,000 1,950,000 – 2,100,000
- At factory door 2,000,000 2,600,000 – 2,800,000
(data source: primary data collection)
The price established from the results of this analysis indicates that the base price
value is closer to the value of social / parity price. Therefore, in determining the base price, the
government can use two alternative approaches, namely 1) social / parity price, and 2) current
market price with an additional value of 30-40%.
Through the determination of base price, HTR farmers are expected to be more
motivated to do HTR business because of a reasonable profit. Furthermore, the HTR
programme will be successful in enhancing people’s economy in accordance with the principles
of development which are pro-poor, pro-growth, pro-jobs, and pro-environment.

33
V. CONCLUSION AND RECOMMENDATION
5.1. Conclusion
1) The result of financial analysis for HTR business in Lampung Province shows that HTR
business is feasible. Parameter values as the result of data collection are: NPV: Rp
9,911, 550; BCR: 2.13 and IRR: 19%.
2) There are four marketing pattern for Paraserianthes falcataria round logs in Lampung
Province, which are:
Farmer collector/chainsaw owner sawmill panglong (depot)
consumer
Farmer collector/chainsaw owner panglong (depot) consumer
Farmer collector/chainsaw owner consumer
Farmer consumer
The chain of timber market has not benefited the farmers as log producers due to a low
bargaining power. Farmers as price takers receive a minimal margin, which is 27% while
traders receive 73%.
3) The calculation of Paraserianthes falcataria wood price using stumpage price, market
price and social/parity price methods gives the following results:
- Stumpage price is Rp 121,984/m3
- Market price is Rp 200,000/m3
- Social/parity price is Rp 200,000-250,000/m3
The values are received by farmers in the form of standing trees in the forest. In
determining standard price, value ranges between market price and social/parity price
can be used.
4) The constraints of the HTR programme in Lampung Province is the discontinuation of
partnership. In four out of six cooperatives, HTR activities do not continue after the

34
HTR license has been issued. The relationship between farmers and cooperative
management was stagnant and need support if HTR activities were to continue.
Therefore, the strategies for HTR development in Lampung province are: 1)
institutional strengthening of cooperative, 2) facilitation, 3) increasing capacity of
farmers.
5.2 Recommendation
By learning the progress of HTR programme in Lampung Province, there are several
suggestions for the development of HTR. They are:
1. The Ministry of Forestry through the Technical Unit (BP2HP) collaborates with the
Cooperative District Office to support the institutional strengthening of HTR Cooperative by
reorganization of cooperative management, the preparation of work plan, institutional reform
efforts, and strengthening cooperative working capital through BLU P2HT loan.
2. To enhance the capacity of facilitators and to improve the work of facilitators, BP2HP needs
to develop criteria and indicators of the duties and responsibilities of facilitators as well as
reporting system.
3. There is a need for coordination between the Directorate General (DG) of Forest Utilization
and Human Resource Development Agency and Forestry Extension, as well as other
relevant agencies to strengthen the capacity of farmers into professional HTR plantation
entrepreneurs. Education and training are done with comprehensive material on business
management of forest plantations, ranging from silvicultural techniques to timber market
information. BP2HP facilitates the partnership between farmers and wood-processing
industries.
4. Base price of HTR timber sales in Lampung Province should be established through
government policy intervention. This policy is needed as the government concern to farmers
while maintaining a fair margin distribution among market actors. The determination of
standard price can refer to social or parity price. In pratice, market price can also be used
with an additional value of 30-40% of the market price.

35
BIBLIOGRAPHY
Darusman D, Hardjanto. 2006. Tinjauan ekonomi hutan rakyat. Prosiding Seminar Hasil
Penelitian Hasil Hutan. Bogor: Pusat Litbang Hasil Hutan. hlm: 4-13.
Departemen Kehutanan. 2009. Potensi Sumber daya Hutan produksi Nusa Tenggara Barat.
Direktorat Jenderal Bina Produksi Kehutanan. Jakarta.
Kishor NM, Constantino LF. 1993. Forest management and competing land uses: An economic
analysis for Costa Rica. LATEN Dissemination Note # 7. Washintgton: The World Bank
Latin America Technical Department, Environment Division.
Lubis SU. 2010. Manfaat Ekonomi Sistem Pengelolaan Hutan Rakyat di Sekitar Taman
Nasional Batang Gadis (Studi Kasus: Desa Hutarimbaru Dan Desa Tolang, Sub-District
Ulu Pungkut, Kabupaten Mandailing Natal) [Skripsi]. Medan: Departemen Kehutanan,
Fakultas Pertanian, Universitas Sumatera Utara.
Ota I. 2001. The economic situation of small-scale forestry in Japan. Di dalam: Niskanen A,
Väyrynen J, editors. Economic Sustainability of Small-scale Forestry, International
IUFRO 3.08.00 Symposium; Joensuu-Finland, 20-26 March 2001. Finland: EFI. 29-39.
Race D et al. 2009. Partnership for involving small-scale growers in commercial forestry:
Lessons from Australia and Indonesia. International Forestry Review Vol. 11 (1).
Siregar UJ, Rachmi A, Massijaya MY, Ishibashi N, Ando K. 2007. Economic analysis of sengon
(Paraserianthes falcataria) community forest plantation, a fast growing species in East
Java, Indonesia. Forest Policy and Economics 9: 822–829.
Sitanggang PH. 2009. Manfaat Ekonomi Sistm Pengelolaan Hutan Rakyat (Studi Kasus: Dusun
Marubun Pane Sub-District Tigarunggu Kabupaten Simalungun) [Skripsi]. Medan:
Fakultas Pertanian, Universitas Sumatera Utara.
Van Bodegom AJ, van den Berg J, van der Meer P. 2008. Forest plantations for sustainable
production in the tropics: key issues for decision-makers. The Netherlands: Wageningen
University & Research Centre.
Zhang D, Owiredu EA. 2007. Land tenure, market, and the establishment of forest plantations
in Ghana. Forest Policy and Economics 9: 602– 610.

36
Appendix 1. List of respondents of HTR cooperative management and members
No Name Remarks
1 Lukman Cooperative Member of Bina Hutan Utara
2 Arpandi HS Cooperative Member of Bina Hutan Utara
3 Mista Yamisata Cooperative Member of Bina Hutan Utara
4 Joni Aspiyani Cooperative Member of Bina Hutan Utara
5 Aria Effendi Cooperative Member of Bina Hutan Utara
6 Susroharni Cooperative Member of Bina Hutan Utara
7 Agus Ricardo Cooperative Member of Bina Hutan Utara
8 Darul Hak Cooperative Member of Bina Hutan Utara
9 Yudi Ardianto Cooperative Member of Bina Hutan Utara
10 Ahmat Jauhari Cooperative Member of Bina Hutan Utara
11 Makmur Banas Cooperative Member of Bina Hutan Utara
12 Nursiwan Cooperative Member of Bina Hutan Utara
13 Amirudin Cooperative Member of Bina Hutan Utara
14 Efendi Lubis Cooperative Leader of Bina Hutan Utara
15 Izhar Rahman Cooperative Member of Bina Hutan Utara
16 Rohidi Cooperative Member of Bina Hutan Utara
17 Sarwono Cooperative Member of Bina Hutan Utara
18 Yonesta Cooperative Member of Bina Hutan Utara
19 Hari Yanto Cooperative Member of Bina Hutan Utara
20 Sofi Amaludin Cooperative Leader of Jaya Bersama
21 Imron Cooperative Treasurer of Jaya Bersama
22 Nur Cooperative Secretary of Jaya Bersama
23 Prabawa Cooperative Lambar Subur Rezeki
24 Mulyono Cooperative Lambar Subur Rezeki
25 Edwin Cooperative Lambar Subur Rezeki
26 Ilham Cooperative Secretary of Unggul Jaya
27 Ahmad Cooperative Unggul Jaya
28 Peratin Cooperative Unggul Jaya
29 Rizki Cooperative Unggul Jaya
30 Nugraha Cooperative Labuwai Lestari
31 Joko Cooperative Labuwai Lestari
32 Alifin Nur Cooperative Labuwai Lestari
33 Bambang Cooperative Labuwai Lestari
34 Baskoro Cooperative Labuwai Lestari
35 Jatmiko Cooperative Sinar Selatan
36 Dedi Cooperative Sinar Selatan
37 Agus Komara Cooperative Sinar Selatan
38 Wahyu Cooperative Sinar Selatan
39 Komar Cooperative Sinar Selatan
40 Yayat Cooperative Sinar Selatan
41 Subandi Cooperative Sinar Selatan
42 Cepi Cooperative Sinar Selatan

37
No Name Remarks
43 Rustam Cooperative Sinar Selatan
44 Andi Cooperative Sinar Selatan
45 Yusef Cooperative Sinar Selatan
46 Marzuki Cooperative Sinar Selatan
47 Subowo Cooperative Sinar Selatan
48 Budi Cooperative Sinar Selatan
49 Ahmad Cooperative Sinar Selatan
50 Rudianto Cooperative Sinar Selatan

38
Appendix 2. List of informants (market actors)
No Informant Group
No Name of Informant
I Tree Grower 1 Najili
2 Mulyandri
3 Yusef
II Chainsaw Owner 1 Ediansah
2 Tobing
3 Joni
III Merchant collector, sawmill supplier 1 John
2 Win
IV Sawmill 1 Cikwan
2 Julius
3 Haji Nizar
V Panglong (wood depot)
-Panglong at District level 1 Peratin Mulyadi
2 Khoirul Effendi
-Panglong inter District/Province 3 Edi Qoiri
-Panglong City Province 4 Taufiq
VI Wood Processing 1 Merah Efendi
2 Maman
3 Ujang
Total 18 persons

39
APPENDIX 3. List of questions
Respondents: HTR Farmers
No Purpose/
Inquiry point
Remarks
I Financial analysis of HTR activities
1. Costs needed for planting establishment
- Land preparation
- Land clearing
- Seedling preparation
- Planting hole digging
- Planting
- Tending
- Pest and disease control
- Harvesting
2. Sale of HTR Products
- Wood (species, volume, harvesting span period, price)
- Non wood (type, volume, harvesting span period, price)
II. Anlysis of Market Channel
1. To whom is HTR products sold?
2. Is there any alternative to sell to others? Social cultural
aspects in
marketing HTR
products
3. Reason to sell to certain party (because of highest price, good
relationship, or because of other reasons?)
4. How does negotiation process occur?
5. How is the mechanism of payment done (cash at the time product is
harvested, postponed until wood is sold to next merchant or ijon*)
system?)
6. Is the price at the transaction satisfactory?
7. Is there any other marketing mechanism that has the potential of
increasing profit / income of farmers?
III. Analysis of standard price of HTR Products
1. How is the perception of farmers on current wood price? (too cheap or
reasonable)
2. If price is too low, what is the reason (weak bargaining power of
farmers, no information on standard price, or there is no other choices
when the need for cash is urgent)?
3. If price is too cheap, what is the reasonable price according to farmers’
perception?
*) selling as standing tree before harvesting time

40
IV Analysis on Marketing Strategy of HTR Products
1. How is the experience of farmers in requesting HTR license (from
where was the first information on HTR was received, who supported
the process of license application, how is license processed, and
others)?
2. How is the response/opinion of farmers after becoming a HTR license
holder (what is the benefit felt as a HTR license holder)?
3. What problems are faced as HTR license holder?
- Problems in permit processing
- Problems in cultivation technology
- Problems in financial capital
- Problems in marketing, and others
4. What is farmers’ expectation in order for HTR business to be more
developed?
5. Is there any proposal/suggestion/solution from farmers on problems
faced?
Respondent: Merchants (collectors, wholesalers, and others in market chain of HTR
Products)
Method used is snowball sampling, where respondents to whom farmers sell their HTR
products are selected based on initial information of HTR farmers
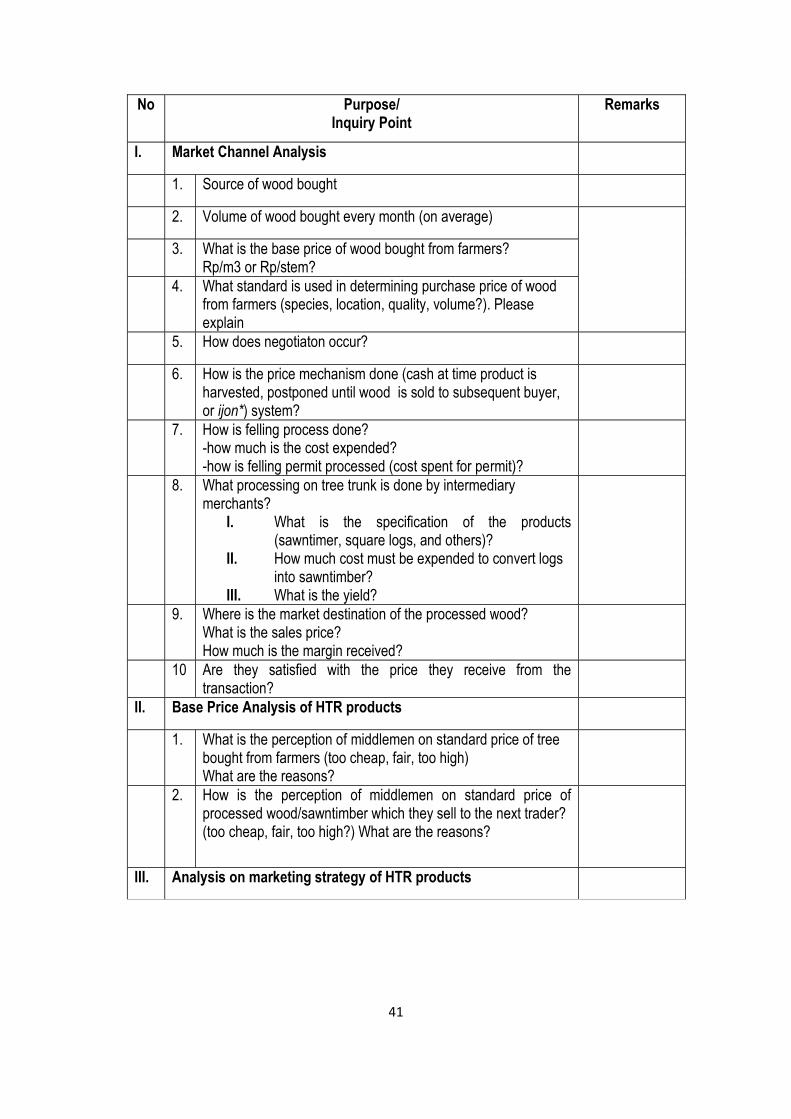
41
No Purpose/ Inquiry Point
Remarks
I. Market Channel Analysis
1. Source of wood bought
2. Volume of wood bought every month (on average)
3. What is the base price of wood bought from farmers?
Rp/m3 or Rp/stem?
4. What standard is used in determining purchase price of wood
from farmers (species, location, quality, volume?). Please explain
5. How does negotiaton occur?
6. How is the price mechanism done (cash at time product is
harvested, postponed until wood is sold to subsequent buyer, or ijon*) system?
7. How is felling process done?
-how much is the cost expended? -how is felling permit processed (cost spent for permit)?
8. What processing on tree trunk is done by intermediary
merchants? I. What is the specification of the products
(sawntimer, square logs, and others)? II. How much cost must be expended to convert logs
into sawntimber? III. What is the yield?
9. Where is the market destination of the processed wood?
What is the sales price? How much is the margin received?
10 Are they satisfied with the price they receive from the
transaction?
II. Base Price Analysis of HTR products
1. What is the perception of middlemen on standard price of tree
bought from farmers (too cheap, fair, too high) What are the reasons?
2. How is the perception of middlemen on standard price of
processed wood/sawntimber which they sell to the next trader? (too cheap, fair, too high?) What are the reasons?
III. Analysis on marketing strategy of HTR products

42
Respondents: Regional Forestry Office, Technical Unit (UPT) of DG of Forest Utilization of the
Ministry of Forestry (BP2HP)
No Purpose/
Inquiry Point
Remarks
I. Market Analysis
1. Data base related to HTR areas (allocated HTR areas, HTR
definitive areas, license holder, and others)
2. Secondary data on wood processing industries
3. Secondary data on community wood felling
4. Regulation related to trade of community wood
II. Strategy analysis on HTR products
1. Perception of local government related to HTR programme
2. Problems, constraints or obstacles in implementation of HTR
programme
3. How is the function of regional office in the development of HTR
programmes (what programmes have been or will be done)?
4. What are suggestions and recommendations of local government to
develop HTR programme

43
Appendix 4. Pictures of activities
Interviews with farmer as the owner of community
wood
Interviews with middleman/collector trader/
chainsaw owner
Interview with sawmill owner Sawmill

44
Interview with panglong (wood depot) owner in the
district
Panglong (wood depot) owner at District level
Interview with the Head of District Forestry Office and
staff in West Lampung
Interview and secondary data collection at
Provincial Forestry Office in Bandar Lampung
Interview and wood marketing data collection at the
Provincial Forestry Office in Bandar Lampung
Data collection at District Forestry Office in
West Lampung
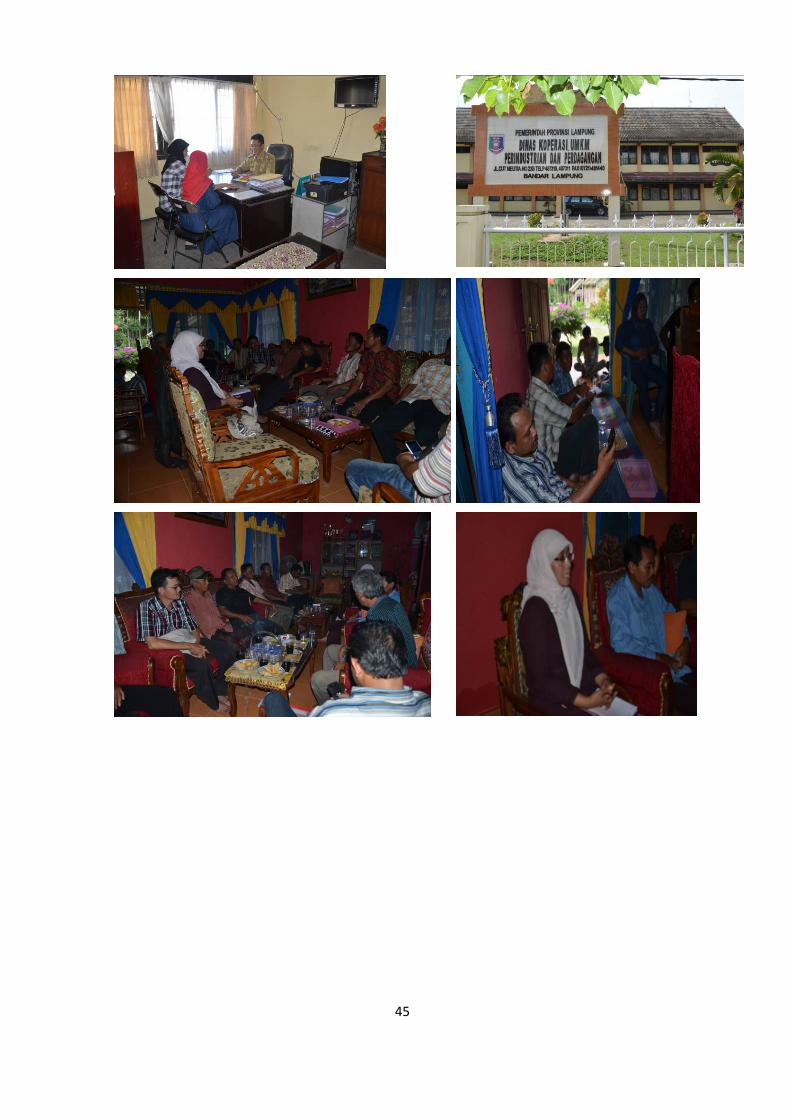
45