kajaria ceramics ltd - sifyim.sify.com/sifycmsimg/jul2012/finance/15003121_kajariacements.pdfkajaria...
TRANSCRIPT

1
SYNOPSIS
Kajaria Ceramics is the second largest player in the Indian ceramic tile market. The company has a manufacturing capacity of 38.30 mn sq mtrs across its units.
Kajaria Ceramics has increased its capacity from 1 mn. sq. mtrs to 30.60 mn. sq. mtrs in last 23 years.
Kajaria Ceramics Ltd has acquired 51% shareholding in M/s. Vennar Ceramics Limited for a total consideration of Rs. 136.50 Million.
During the quarter, the robust growth of Net Profit is increased by 31.85% to Rs. 221.90 million.
Kajaria Ceramics Ltd has recommended a Dividend of 125% (Rs. 2.50 per equity share of Rs. 2 each.
Kajaria Ceramics exports to more than 20 countries round the Globe & set to emerge as a leader in the international ceramic tiles market.
Net Sales and PAT of the company are expected to grow at a CAGR of 25% and 27% over 2011 to 2014E respectively.
Years Net sales (Rs mn)
EBITDA (Rs mn)
Net Profit (Rs mn) EPS P/E
FY 12 13127.80 2015.80 807.20 10.97 16.05
FY 13E 16029.04 2480.90 1028.62 13.98 12.59
FY 14E 18513.55 2883.27 1234.81 16.78 10.49
Stock Data:
Sector: Ceramic
Face Value Rs. Rs.2.00
52 wk. High/Low (Rs.) 190.80/84.00
Volume (2 wk. Avg.) 14000.00
BSE Code 500233
Market Cap (Rs.In mn) 12953.60
Share Holding Pattern
1 Year Comparative Graph
KAJARIA CERAMICS BSE SENSEX
C.M.P : Rs.176.00 Target Price : Rs.198.00 Date : July 14th 2012 BUY
KAJARIA CERAMICS LTD
Result Update: Q1 FY 13
2
Peer Group Comparison
Name of the company CMP(Rs.) Market Cap. (Rs.Mn.) EPS(Rs.) P/E(x) P/Bv(x) Dividend (%)
Kajaria ceramic Ltd 176.00 12953.60 10.97 16.05 4.60 125.00
Shalimar Paints Ltd 593.45 2246.60 38.20 15.54 3.69 100.00
Kansai Nerolac Paints 931.00 50127.60 40.07 23.21 4.71 110.00
Cera Sanitary ware 294.20 3723.10 26.97 10.91 2.60 50.00
Investment Highlights
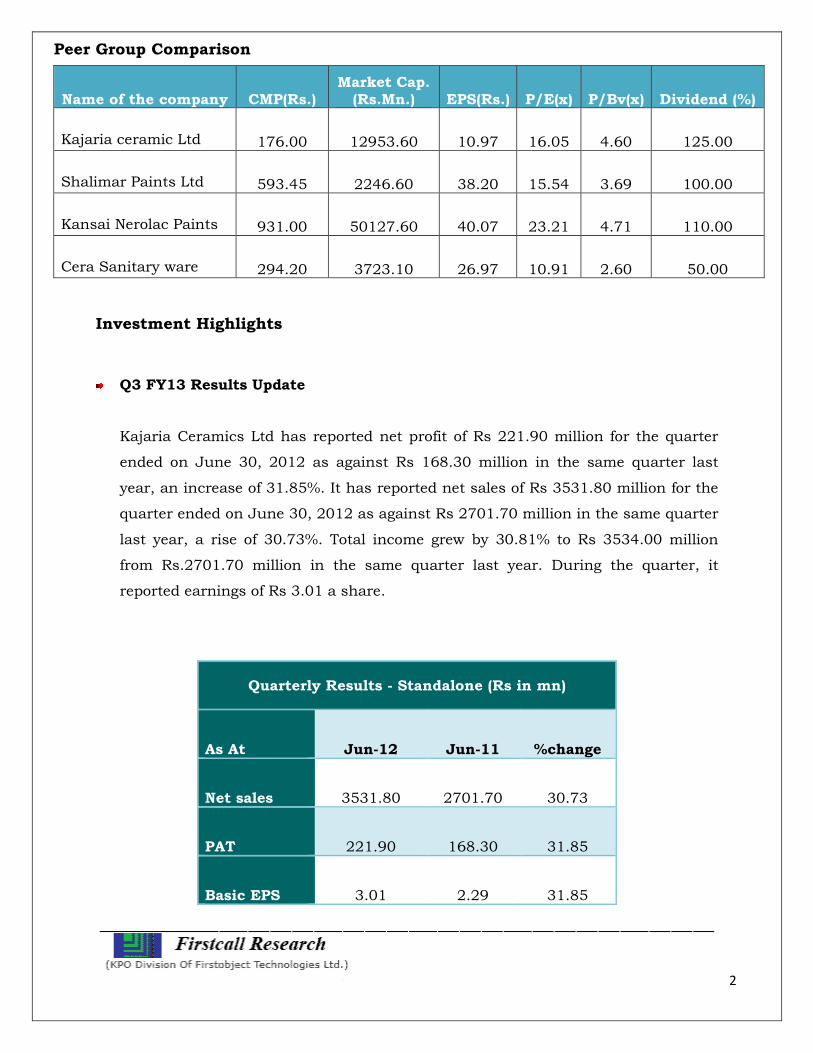
Q3 FY13 Results Update
Kajaria Ceramics Ltd has reported net profit of Rs 221.90 million for the quarter
ended on June 30, 2012 as against Rs 168.30 million in the same quarter last
year, an increase of 31.85%. It has reported net sales of Rs 3531.80 million for the
quarter ended on June 30, 2012 as against Rs 2701.70 million in the same quarter
last year, a rise of 30.73%. Total income grew by 30.81% to Rs 3534.00 million
from Rs.2701.70 million in the same quarter last year. During the quarter, it
reported earnings of Rs 3.01 a share.
Quarterly Results - Standalone (Rs in mn)
As At Jun-12 Jun-11 %change
Net sales 3531.80 2701.70 30.73
PAT 221.90 168.30 31.85
Basic EPS 3.01 2.29 31.85

3
Break Up of Expenditure
Recommended Dividend
Kajaria Ceramics Ltd has recommended a Dividend of 125% (Rs. 2.50 per equity
share of Rs. 2 each) for the financial year ended March 31, 2012.
Acquisition
Kajaria Ceramics Ltd has acquired 51% shareholding in M/s. Vennar Ceramics
Limited for a total consideration of Rs. 136.50 Million. Pursuant to Section 4 and
other applicable provisions of the Companies Act, 1956, M/s. Vennar Ceramics
Limited has become the subsidiary of the Company.
Future Outlook
� Kajaria Ceramics Ltd is planning to expand distribution network to locations with
significant demand potential areas.
� The company manufacturing plants are maintaining high-end digitally printed wall
tiles for sales exclusively through the Kajaria World network.

4
� Kajaria Ceramics Ltd strengthen the Tier-I distribution network and the company
planning to establish a Tier-II network.
� Kajaria Ceramics Ltd is planning to expand channel network from 30 to 70.
Company Profile
Kajaria Ceramics, incorporated in 1985, is the largest ceramic floor and wall tile
manufacturer in India. It has an annual aggregate capacity of 38.30 mn. sq. meters,
distributed across Five plants-Sikandrabad in Uttar Pradesh, Gailpur in Rajasthan,
two plants in Morbi in Gujarat and one at Vijayawada in Andhra Pradesh.
The company has an in-house research and development facility that focuses on
developing new designs and creating cost effective products.
Kajaria Ceramics has received various certifications such as ISO 9001 (for quality
management), ISO 14001 (environment management), OHSAS 18001 (for safety and
health management) and SA-8000 (for commitment to society). Kajaria Ceramics has
pan-India presence with a strong distribution network of about 600 dealers and over
6000 sub-dealers. Equipped with eight stock points, the company has Kajaria World
showrooms and owns 19 offices-cum-display centres.
Exports
KAJARIA Ceramics exports to more than 20 countries round the Globe. The
International Marketing operations are organized by a specialist export division that
manages a network of international agents and distributors supported by exclusive
office/showroom in UAE. Now in international markets they enjoy a similar brand
Recall as that of Domestic.
Company Brand "Kajaria" has today become synonym of Quality, service and
innovation not only in the domestic market but even in the international market.
"Kajaria" products are also well accepted in European market. With increased
capacity, increase in turnover and a growing domestic and exports market, Kajaria
Ceramics is set to emerge as a leader in the international ceramic tiles market.

5
Products
The company manufactures more than 400 options of flooring solutions such as wall
tiles, Floor tiles, vitrified tiles, Wooden Flooring, Sanitaryware & Fittings, Wellness,
Tile Adhesives & Grout and European tiles.
The tiles major market these products under the brand name such as Kajaria,
Kerrogres, Eternity, Aparici, Saloni ceramica, Ergon and GRESPANIA Ceramica.
Clientele
� Unitech
� DLF
� Parsvnath
� Magarpatta
� Sobha Developers
� DSK
� Mantri Group
� Prestige Group
� Ansals
� Hiranandani
� Raheja Developers
� Omaxe
� EMAAR-MGF
Subsidiary companies
� Soriso Ceramic Private Limited
� Jaxx Vitrified Private Limited
� Kajaria Ceramics Addis Plc
� Vennar Ceramics Limited

6
Financial Results
12 Months Ended Profit & Loss Account (Standalone)
Value(Rs.in.mn) FY11 FY12 FY13E FY14E
Description 12m 12m 12m 12m
Net Sales 9534.20 13127.80 16029.04 18513.55
Other Income 0.00 11.30 12.43 13.67
Total Income 9534.20 13139.10 16041.47 18527.22
Expenditure -8048.80 -11123.30 -13560.57 -15643.95
Operating Profit 1485.40 2015.80 2480.90 2883.27
Interest -298.60 -469.80 -554.36 -620.89
Gross profit 1186.80 1546.00 1926.54 2262.38
Depreciation -295.00 -370.80 -422.71 -464.98
Profit Before Tax 891.80 1175.20 1503.83 1797.40
Tax -285.20 -368.00 -475.21 -562.59
Profit After Tax 606.60 807.20 1028.62 1234.81
Equity capital 147.20 147.20 147.20 147.20
Reserves 2078.40 2671.80 3700.42 4935.23
Face value 2.00 2.00 2.00 2.00
EPS 8.24 10.97 13.98 16.78

7
Quarterly Ended Profit & Loss Account (Standalone)
Value(Rs.in.mn) 31-Dec-11 31-Mar-12 30-Jun-12 30-Sep-12E
Description 3m 3m 3m 3m
Net sales 3483.80 3774.70 3531.80 3990.93
Other income 0.00 11.30 2.20 0.00
Total Income 3483.80 3786.00 3534.00 3990.93
Expenditure -2936.10 -3208.80 -2995.10 -3392.29
Operating profit 547.70 577.20 538.90 598.64
Interest -150.80 -121.30 -120.60 -135.07
Gross profit 396.90 455.90 418.30 463.57
Depreciation -100.10 -95.20 -96.70 -97.67
Profit Before Tax 296.80 360.70 321.60 365.90
Tax -89.00 -118.60 -99.70 -114.16
Profit After Tax 207.80 242.10 221.90 251.74
Equity capital 147.80 147.20 147.20 147.20
Face value 2.00 2.00 2.00 2.00
EPS 2.81 3.29 3.01 3.42
8
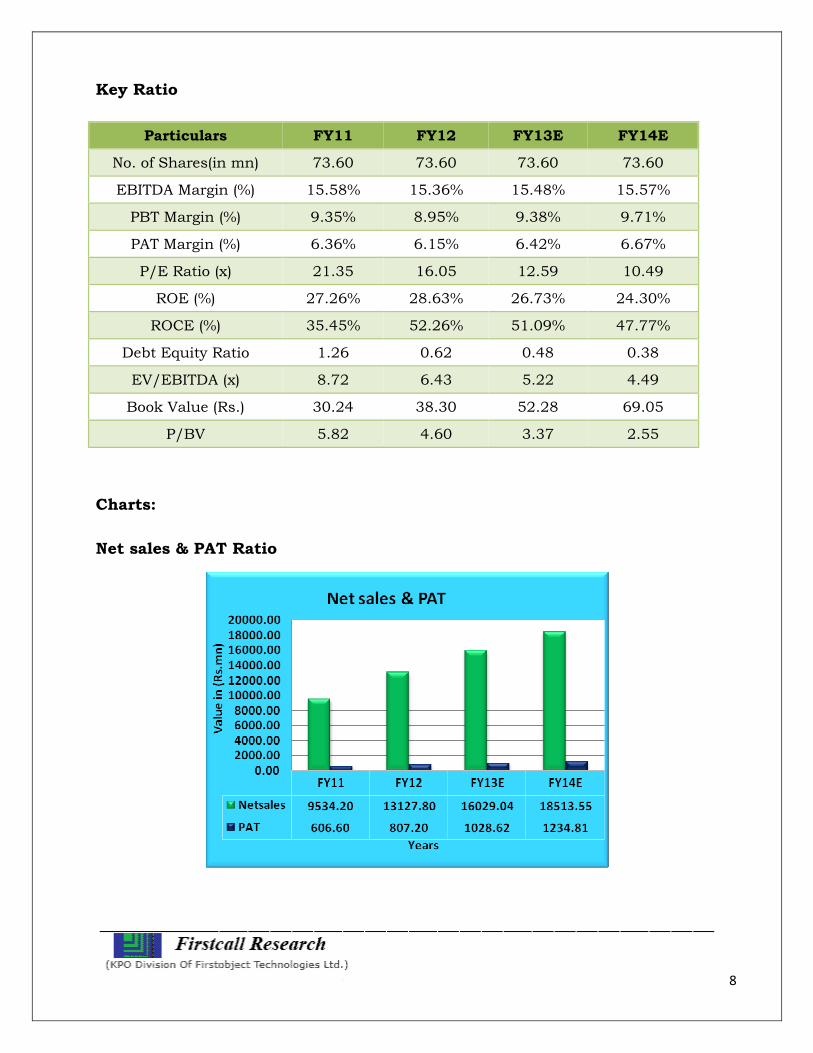
Key Ratio
Particulars FY11 FY12 FY13E FY14E
No. of Shares(in mn) 73.60 73.60 73.60 73.60
EBITDA Margin (%) 15.58% 15.36% 15.48% 15.57%
PBT Margin (%) 9.35% 8.95% 9.38% 9.71%
PAT Margin (%) 6.36% 6.15% 6.42% 6.67%
P/E Ratio (x) 21.35 16.05 12.59 10.49
ROE (%) 27.26% 28.63% 26.73% 24.30%
ROCE (%) 35.45% 52.26% 51.09% 47.77%
Debt Equity Ratio 1.26 0.62 0.48 0.38
EV/EBITDA (x) 8.72 6.43 5.22 4.49
Book Value (Rs.) 30.24 38.30 52.28 69.05
P/BV 5.82 4.60 3.37 2.55
Charts:
Net sales & PAT Ratio

9
P/E Ratio
Debt Equity Ratio

10
EV/EBITDA Ratio
P/BV Ratio

11
Outlook and Conclusion
At the current market price of Rs.176.00, the stock is trading at 12.59 x FY13E
and 10.49 x FY14E respectively.
Earning per share (EPS) of the company for the earnings for FY13E and FY14E
is seen at Rs.13.98 and Rs.16.78 respectively.
Net Sales and PAT of the company are expected to grow at a CAGR of 25% and
27% over 2011to 2014E respectively.
On the basis of EV/EBITDA, the stock trades at 5.22 x for FY13E and 4.49 x
for FY14E.
Price to Book Value of the stock is expected to be at 3.37 x and 2.55 x
respectively for FY13E and FY14E.
We expect that the company will keep its growth story in the coming quarters
also. We recommend ‘BUY’ in this particular scrip with a target price of
Rs.198.00 for Medium to Long term investment.
Industry Overview
Indian ceramic industry
The Indian Tile industry ranks third in terms of production and consumption
(estimated at Rs 140 billion as of March 2011). The industry reported strong growth
owing to the emergence of tiles as durable, cost-effective and convenient solutions
over natural stone.
India’s consumption grew 12.95% CAGR between 2006-07 and 2010-11 to 557 MSM,
which were about 2x the global average. Its production grew at a 13.04% CAGR over
the same period to 550 MSM in FY11.
The tiles industry largely comprises ceramic wall and floor tiles and polished and
glazed vitrified tiles. The competitive intensity is less in the vitrified tiles segment; the
country imports vitrified tiles (especially glazed). Tiles are largely consumed by
residential, commercial, retail, hospitality and aviation segments.

12
The industry is fragmented with organized players accounting for 50% of the industry
turnover; the balance was represented by small unorganized/unbranded players,
primarily in Gujarat.
Rapid capacity addition increased home ownership and rising brand aspirations
resulted in a gradual shift of consumer preference towards value-added products.
Global tile industry
Following the 2008 and 2009 slowdowns, production and consumption rebounded
with double-digit growth in CY2010. Global production rose 11.7%, which was higher
than the annual historical average (6-7% up to 2007).
Production: The most remarkable production increase came out of Asia, increasing
its share to more than 66% of the global production due to sizeable volume increases
by all leading tile manufactures – China (+600 MSM), Vietnam (+80 MSM), India (+60
MSM) and Iran (+50 MSM).
Consumption: Global ceramic tile consumption increased from 8,460 billion sq. m to
9,350 billion sq. m (10.5% up from 2009) while it declined only in the EU from 991
MSM to 941 MSM (-5%). Asia reported the biggest consumption growth, up 14% to
6.026 billion sq. m, 64.4% of the global consumption. China, India, Iran, Vietnam,
Saudi Arabia, Thailand, the UAE and Malaysia reported large capacity increases.
Tiles tend to be produced near their consumption areas. Asia accounted for 66.9% of
production and 64.4% of world consumption, Europe (EU+ non-EU) 16.6% and 15%
respectively, the US 12.6% and 14.7% and Africa 4% and 5.5%.
The Urban growth
Increase in earning family members: The dependency ratio among Indian families
declined from 58% in 2005 to 55% in 2010 and is expected to decline to 52% in 2015
and 49% in 2020 (Source: ENAM).
India gets younger: In India, the working age declined sharply, providing high
disposable incomes. Close to 65% of Indians between 20-60 years are working,
leading to higher disposable incomes and lifestyle aspirations. Among BRIC nations,

13
India is expected to remain the youngest with its working-age population estimated to
rise to 70% of the total demographic by 2030 – the largest in the world. Some
estimates suggest that India will see 70 million new entrants into its workforce over
five years.
Increasing earnings and disposable income: The salary of the average Indian grew
12.6% in 2011, higher than most other global nations. India’s per capita income is
estimated to rise 14.3% to Rs 60,972 in 2011-12 (Source: Deccan Herald).
In line with economic growth, estimates suggest that PFCE is expected to scale from
US$790 billion in 2010 to US$3.6 trillion by 2020.
Semi-urban markets
Bharat Nirman: The Build India government initiative expects to build world-class
infrastructure across rural land areas.
Preferred locations: Increasing corporate are shifting focus to Tier-II and III cities,
accounting for over 61% of the total job creation in India in 2010-11. IT/ITeS sector
is expected to add 14 million direct and 55 million indirect job opportunities pan-
India
Housing demand growth
Population growth: India’s population rose to 1.21 billion in the last 10 years, an
increase by 181 million; overall growth is pegged at 1.76% in 2011, which will
catalyze residential demand.
Urbanization:
India is the fastest urbanizing country; UN estimates that 40% of India’s population
will be living in urban areas by 2030 (Source: Forbes India). Rising disposable income
(FY08-11 CAGR of ~15%), growing middle-class and increasing urbanization
(currently ~30% of the population) will boost the demand for improved flooring
solutions and value-added products.

14
Current status of the Industry
A major change that took over the ceramic tiles industry, was the introduction of
vitrified and porcelain tiles. These new entrant product types are said to be the tiles
of the future. Internationally these tiles are already the major sellers. These
categories of products account for almost 50% of total tile sales by value in this
industry.
These new products and the conventional wall & floor tiles have together made the
organized industry grow to a formidable Rs. 7,200 crores industry. This coupled with
a spate of expansions by many players make the industry look very promising in the
future.
The Indian Industry has developed an export market although at the lower end. In
volume it constitutes less than half a percent of the global market. (Presently India
does not figure in the list of major exporting countries). But this reality could change
as Indian exports are rising at an accelerating growth annually. The top-end of the
global export market is presently dominated by China (36.8%) and Italy (15.1%).
_______________ ____ _________________________ Disclaimer:
This document prepared by our research analysts does not constitute an offer or solicitation
for the purchase or sale of any financial instrument or as an official confirmation of any
transaction. The information contained herein is from publicly available data or other
sources believed to be reliable but do not represent that it is accurate or complete and it
should not be relied on as such. Firstcall India Equity Advisors Pvt. Ltd. or any of it’s
affiliates shall not be in any way responsible for any loss or damage that may arise to any
person from any inadvertent error in the information contained in this report. This document

15
is provide for assistance only and is not intended to be and must not alone be taken as the
basis for an investment decision.
Firstcall India Equity Research: Email – [email protected]
C.V.S.L.Kameswari Pharma
U. Janaki Rao Capital Goods
B.Anil Kumar Diversified
Ashish.Kushwaha Diversified
A,Nagaraju Diversified
Firstcall India also provides
Firstcall India Equity Advisors Pvt.Ltd focuses on, IPO’s, QIP’s, F.P.O’s,Takeover
Offers, Offer for Sale and Buy Back Offerings.
Corporate Finance Offerings include Foreign Currency Loan Syndications,
Placement of Equity / Debt with multilateral organizations, Short Term Funds
Management Debt & Equity, Working Capital Limits, Equity & Debt
Syndications and Structured Deals.
Corporate Advisory Offerings include Mergers & Acquisitions(domestic and
cross-border), divestitures, spin-offs, valuation of business, corporate
restructuring-Capital and Debt, Turnkey Corporate Revival – Planning &
Execution, Project Financing, Venture capital, Private Equity and Financial
Joint Ventures
Firstcall India also provides Financial Advisory services with respect to raising
of capital through FCCBs, GDRs, ADRs and listing of the same on International
Stock Exchanges namely AIMs, Luxembourg, Singapore Stock Exchanges and
other international stock exchanges.
For Further Details Contact:
3rd Floor,Sankalp,The Bureau,Dr.R.C.Marg,Chembur,Mumbai 400 071
Tel. : 022-2527 2510/2527 6077/25276089 Telefax : 022-25276089
E-mail: [email protected]
www.firstcallindiaequity.com