k3 business technology group plc · k3 business technology group plc interim results for the six...
TRANSCRIPT

K3 Business Technology Group PLC
Unaudited First Half Yearly Reportfor the six months to 31 May 2018

K3 Business Technology Group plc Interim Results for the six months to 31 May 2018
1 Financial & Operational Key Points
2 JointReportoftheChairmanandChiefExecutiveOfficer
5 Operational Review
9 Financial Statements
14 Notes to the Unaudited Interim Statement
Contents
AIM: KBTk3btg.com
www.responsibleprint.info
This document is printed in a supply chain which meets the strict environmental criteria of Responsible Print®. The CO2 emissions associated with the entire life cycle of this document including paper, print processes, consumables, delivery and end life disposal has been offset.

K3 Business Technology Group plc Interim Results for the six months to 31 May 2018
1
Operational
Key Points
Programme to streamline operations and management structure substantially completed – merger of Microsoft Dynamics practices commenced in H1
ContinuedfocusonincreasingsalesandprofitabilityofownIPproducts,bothestablishedandnew − Imagine,acutting-edgenewoffering,wasformallylaunchedinH1
Significantrecoveryinsalesmomentumfor“ax|isfashion”productinEnterprisesector–sevendealssignedinH1 compared with seven in 17 months to 30 November 2017 − channelpartnerstrategyisbearingfruit,whichisalsoasignificantdriverforprofitabilityand margin expansion
Global Accounts continued to perform well – strong visibility on future services work and increased growth opportunities
SME-relatedactivitiesperformedsteadily
Boardremainsconfidentaboutprospectsforthesecondhalfoftheyear,supportedby: – traditionally high weighting of software licence and support renewals in Q4, with Syspro renewals typically at c.98% – healthy new business pipeline
Summary Resultsshowasignificantrecoveryinunderlyingprofitability,withtheimprovementreflectingthebenefits
of restructuring and a refocused sales strategy
Financial Revenue up 2.6% to £41.4m (2017: £40.3m)
−highlevelofrecurringrevenuesat£18.7m(2017:£18.8m)
Grossprofitrecoveredsignificantly,upby14.3%to£21.6m(2017:£18.9m),helpedby: −substantiallyincreasedcontributionsfromservices,andsoftwarelicences,and −streamlinedoperations Gross margin improved to 52.2% (2017: 46.8%)
Adjustedprofitfromoperations1 of £1.7m (2017: adjusted loss from operations1 of £3.1m), a £4.8m turnaround. Loss from operations reduced to £0.5m (2017: loss of £5.4m)
Net debt2 stood at £8.5m at period end (2017: £18.5m)
Cashgenerationandearningswillbenefitfromthetraditionallyhighlevelsofsoftwarelicence/supportcontracts renewals in Q4
Note 1 Calculated before amortisation of acquired intangibles of £1.3m (2017: £1.4m), exceptional reorganisation costs of £0.7m (2017: £0.8m), and share-basedpaymentchargeof£0.2m(2017:nil).
Note 2 Net debt is goss debt net of cash and cash equivalents.
Chairm
an’s & C
EO’s Report
Operational Review
Financial Statements
Notes
K3 Business Technology Group plc Interim Results for the six months to 31 May 2018
2
IntroductionWe are pleased with the progress K3 has made over the firsthalf,followingaperiodofsignificantrestructuringandinternal change as the new management team implemented initiativestoplacetheGrouponabetterfootingforlong-termrevenueandprofitgrowth.Resultsforthefirstsixmonthsofthefinancialyearshowthebenefitsofatighter,moreintegrated organisational structure, and our refocused sales andownIntellectualProperty(“IP”)strategy.Inparticular,wearepleasedtoseetheGroupreturntounderlyingprofitability,helped by a marked improvement in gross margins, particularly services and own IP. Operational cash generation continues to improve and, with the seasonally stronger weighting in software licence and support contract renewals in the second half, the Group’s cash generation should show furtherprogressbythefinancialyearend.
Overall, the business is in substantially better shape, financially,operationallyandstrategically,andweviewprospects for continuing recovery and growth over the remainderofthefinancialyearpositively,supportedbyahealthy new business pipeline and expected high levels of renewals, with Syspro renewals typically at c. 98%.
Financial resultsRevenue for the six months to 31 May 2018 increased by 2.6% to £41.4m (2017: £40.3m), with recurring income, from software maintenance renewals, support contracts and hosting & managed services, continuing to make up a high percentage of the total, at £18.7m (2017: £18.8m).
Grossprofitroseby14.3%to£21.6m(2017:£18.9m),withsignificantincreasesincontributionfromservices,andsoftwarelicences.Theproportionofgrossprofitderivedfromown IP improved and accounted for 31.5% of the total (2017: 30.7%).
The Group’s gross margin shows a substantial recovery, increasing by 5.4 percentage points to 52.2% (2017: 46.8%). Thisimprovementprincipallyreflectsthelowercostbase,recovery in productivity, and growth in own IP software licences.
Gross margin was higher in software licences and services, and also across recurring and hardware income streams. Gross margin in software licences increased by 12.2 percentage points to 71.7% (2017: 59.5%) and in services rose by 11.1 percentage points to 27.9% (2017: 16.8%). Recurring revenue gross margin improved by 2.3 percentage points to 68.3% (2017: 66.0%).
The recovery in gross margin helped to drive the Group’s turnaroundinunderlyingprofitability,withK3movingfromlossestoanadjustedprofitfromoperations*1 of £1.7m (2017: adjusted loss from operations*1 of £3.1m), a £4.8m improvement.
“We are pleased to see The Group return
to underlying profitability, helped by a
marked improvement in gross margins”.
Joint Report of the Chairman and Chief Executive Officer
“Adjusted profit from operations*1 of £1.7m (2017: loss of £3.1m)”
*See note 9 on page 19 for further details

After taking into account £0.7m of exceptional costs (2017: £0.8m), which related to the reorganisation programme, an amortisation charge of £1.3m for acquired intangibles(2017:£1.4m)andashare-basedpaymentchargeof £0.2m (2017: nil), the loss from operations was £0.5m (2017:lossof£5.4m),whichisayear-on-yearreduction of £4.9m.
Finance expenses were £0.5m (2017: £0.5m), resulting in anadjustedprofitbeforetax*2 for the period of £1.2m (2017: adjusted loss before tax*2 of £3.6m). The reported loss before tax for the period was £1.0m (2017: loss of £5.8m).
Adjusted earnings per share*3 was 1.4p (2017: adjusted loss per share*3 of 7.8p). Basic loss per share was 2.8p (2017: basic loss per share 12.4p).
Balance sheet and cash flows
The Group has been focused on improving cash generation and continues to work on reducing working capital balances especiallyaccruedincome.K3’scashflowisnowinlinewithmanagement expectations, and the second half of the year is expectedtobenefitfromannualsoftwarelicenceandsupportrenewals, which are heavily weighted towards this period, with Syspro renewal rates typically around 98%.
At 31 May 2018, net debt stood at £8.5m (31 May 2017: £18.5m),withthisreductionmainlyreflectingtheequityplacing,warrantsexercisedanddebt-to-equityconversion.(which together reduced net debt by £9.0m in July 2017). However, we are also pleased to highlight £1.1m of
operational cash generation during a 12 month period of restructuring and exceptional costs, as note 5 highlights.
Capitalised development expenditure for the six months was £1.0m (2017: £2.1m), in line with the Group’s refocused IP development roadmap. Approximately half of this expenditure was on the Group’s Imagine product offering, which was launched in the period.
Cash utilised in operating activities amounted to £2.9m (2017:£1.1m),andreflectsamorenormalannualseasonalityto the cash generation. The comparative results for 2017 were impactedbyreorganisationcosts,one-offsrelatingtoworkingcapital optimisation, and operating losses.
Depreciation was similar to the prior six months at £0.5m (2017: £0.5m) and amortisation decreased to £2.5m (2017:£3.1m),followingthewrite-downsinthe17monthperiod ended 30 November 2017.
K3 Business Technology Group plc Interim Results for the six months to 31 May 2018
3
Chairm
an’s & C
EO’s Report
Operational Review
Financial Statements
Notes
*See note 9 on page 19 for further details
Gross Profit
Rose by 14.3% to £21.6m(2017: £18.9m)
20172018
4
DividendThe Board intends to maintain a progressive dividend policy, andexpectstoproposeafinal(andtotal)dividendfortheyearto 30 November 2018.
Overview of PerformanceA key area of focus for the Company is increasing the proportion of sales from our own IP. Sales of own IP software licencesliftedto£2.4m(2017:£1.3m),withgrossprofitfromsoftwarelicencesdoublingto£2.2m(2017:£1.1m)inthefirsthalf against the same period in 2017.
Theseveryencouragingresultsreflectedthebenefitsofourredefined‘go-to-market’strategies,andinparticularourreinvigorated channel partner sales strategy. The trading backdrop in the Enterprise market, which is especially relevant forour“ax|isfashion”product,wasalsobetter.Theuncertaintyaroundcloud-adoptionversustraditional‘on-premise’solutionshas cleared, and is no longer causing major decision delays. Atotalofsevendealswereclosedfor“ax|isfashion”intheperiod, mostly through channel partners, which compares with seven deals over the 17 months to 30 November 2017.
We were pleased to formally launch our Imagine platform and thefirstsetofImaginemodulesinthefirsthalf.TheImagineproductisanin-housedeveloped‘cloud-native’offeringthatenablesustooffercutting-edgeapplicationstocustomerson a SaaS model. Compellingly, it also allows companies to adopt these new technologies easily and cost effectively, without the need to change existing legacy systems, so providing them with a fast return on their investment. We are mobilising resource from across K3 to leverage technical, market and domain expertise to support the ongoing development of Imagine, and will be launching further modules. We also secured a large customer win for Imagine, signingOssur,thegloballeaderinnon-invasiveorthopaedics,including prosthetic limbs. We remain very excited about Imagine’s growth potential, both as an upgrade path for existing customers, with older systems, and a growth engine for new customer wins.
TheGroup’sSME-relatedactivitiesperformedsteadilyacrossall of our supply chain verticals. As previously announced, we are bringing together our Microsoft Dynamics practices (CRM, AXandNAV)andthisprocess,whichstartedinthefirsthalf,iswell-advanced.
Our Global Accounts business, which includes our relationship with Inter IKEA Systems B.V. (the owner and franchisor of the IKEA concept, and the largest customer in the Group) and the Inter IKEA Concept franchisees, continued to perform well, contributing to the increase in services income. There is very good visibility in further activity and we have increased our resource in this area to support thisgrowth.WealsoseesignificantopportunitiesforownIPsales, with certain franchisees.
OutlookWe believe that the changes and initiatives put in place under the new leadership team will continue to underpin the turnaround in K3’s performance and growth prospects. The material reduction in the cost base of the business and morestreamlinedstructuresupportsbothprofitabilityandourrefocused growth plans. We will also be continuing to look for additionalopportunitiestoincreaseefficiency.
We expect good growth across the Group, with the ongoing development of channel partner sales, opportunities in Global Accounts and renewed sales momentum. Our IP strategy is showing encouraging results, and growth in own IP software licences should further accelerate, helped by channel partner sales and the commercialisation of Imagine. Opportunities for Imagine are opening as K3 engages with its large installed customer base across many sectors.
Thereisatraditionalweightingofcashflowsandprofitabilitytowards the fourth quarter of the calendar year, and we expect this to be a feature of this year, driven by software licence and support renewals that are traditionally very high, with Syspro renewals typically at c. 98%. More broadly, webelievethatK3isverywell-positionedtomakefurtherprogress over the second half of the year, and view growth prospectswithconfidence.
Stuart Darling Chairman
Adalsteinn Valdimarsson ChiefExecutiveOfficer
9 July 2018
“These very encouraging results reflected the benefits of our redefined ‘go-to-market’ strategies”
K3 Business Technology Group plc Interim Results for the six months to 31 May 2018

5
Financial Statements
Notes
Operational Review
Chairm
an’s & C
EO’s Report
Operational Review
OverviewThe Group’s results for the six months to 31 May 2018, together with comparatives for the same period in 2017, are summarised in the table below.
Six months to 31 May Revenue Grossprofit Grossmargin Adjustedprofit 2018 2017 2018 2017 2018 2017 2018 2017 £m £m £m £m % % £m £m
Supply chain solutions& managed services*4 32.4 31.2 14.8 13.1 45.7% 41.9% 2.2 (1.4)Own IP*5 9.0 9.1 6.8 5.8 75.9% 63.4% 2.5 0.9Support costs*6 – – – – – – (3.0) (2.6)Total 41.4 40.3 21.6 18.9 52.2% 46.8% 1.7 (3.1)
Own IP revenues includes initial and annual software licences and those revenues which flow directly from K3 IP.
2018 2017
Gross margin 52.2% 46.8%Recurring revenue £18.7m £18.8mRecurring revenue as percentage of total revenues 45.2% 46.7%OwnIPgrossprofitasapercentageoftotalgrossprofit 31.5% 30.7%
Recurring revenue comprises software maintenance renewals, support contracts, and hosting & managed services.
Theslightreductioninrecurringrevenuesreflectedtherevenuemix,withservicesaccountingforalargerproportionofoverallsales, largely driven by growth in Global Accounts.
K3 Business Technology Group plc Interim Results for the six months to 31 May 2018
*See note 9 on page 19 for further details
GrossMargin
Up to 52.2% (2017: 46.8%)
2017 2018

6
Supply Chain Solutions & Managed ServicesK3’s business solutions and managed services are tailored to the requirement of the supply chain industry, including retailers, manufacturers and distributors. The Group’s core offering is based on the Microsoft Dynamics suite of software as well as SYSPRO and Sage solutions.
Six months to 31 May Revenue Grossprofit Grossmargin 2018 2017 2018 2017 2018 2017 £m £m £m £m % %
Software licences 3.1 4.4 1.7 2.3 54.8% 51.7%Services 14.0 11.4 3.7 1.7 26.7% 14.6%Recurring 14.1 14.1 9.1 8.8 64.7% 62.5%Hardware and other 1.2 1.3 0.3 0.3 20.6% 21.8%Total 32.4 31.2 14.8 13.1 45.7% 41.9%
Recurring revenues comprise software maintenance renewals, support contracts, and hosting & managed services.
2018 2017
Adjustedprofit/(loss)fromoperations*4 (£m) 2.2 (1.4)Recurring revenue as % of total revenues 43.4% 45.2%
Theseresultsshowamarkedimprovementinprofitability,helpedbythebenefitsofrestructuringandtheefficiencydrivesimplementedoverthepriorperiods,aswellasgrowthandbetterresourceutilisation.Grossprofitincreasedby13.0%to£14.8m(2017: £13.1m) on revenue up by 3.8% to £32.4m (2017: £31.2m) as we focused on better execution of fewer projects.
Overall gross margins improved by 3.8 percentage points to 45.7% (2017: 41.9%), with services margins showing the most substantial increase, rising by 12.1 percentage points to 26.7% (2017: 14.6%).
Global Accounts, which includes our relationship with Inter IKEA Systems B.V. (the owner and franchisor of the IKEA concept) andtheInterIKEAConceptfranchisees,continuedtogrow,reflectingtheongoingexpansionoftheIKEAfranchiseenetworkand helping to drive services income. We believe that there are some new exciting prospects emerging with certain franchisees, which, if successful, will take the current model into new geographical markets, as well as drive opportunities for own IP product sales.WehaveopenedanofficeinKualaLumpurinordertoservicemoreefficientlytheFarEasterngrowthopportunitieswehaveidentified.
OurSME-relatedactivitiesperformedsteadilyacrossalloursupplychainverticalswithgoodperformancesinthevisitorattraction and hosting and managed services. The SYSPRO business continued to perform well, and the Sage practice signed Manx Telecom Plc as a new Sage X3 customer.
Wearewell-advancedwiththecombinationofourMicrosoftDynamicspractices(CRM,AXandNAV),whichstartedintheperiod. As previously indicated, combining the different practices will enable us to optimise our resources and service our customers more effectively.
*See note 9 on page 19 for further details
“These results show a marked improvement in profitability”
K3 Business Technology Group plc Interim Results for the six months to 31 May 2018

7*See note 9 on page 19 for further details
Chairm
an’s & C
EO’s Report
Operational Review
Financial Statements
Notes
“A key area of focus for the Company is increasing the proportion of sales from our own IP”
Own IPK3’sIPportfoliocomprisestwoparts,first,K3-authoredsoftwarethatenrichesourestablishedofferingmentionedabove,basedon Microsoft, SYSPROandSage.Forexample,our“ax|isfashion”andPebblestoneproductsarebothbasedonMicrosoftDynamics’sEnterpriseResourcePlanning(“ERP”)solutions,buthavebeenfunctionallyenrichedbyK3IPforspecificindustrysegments.Secondly,ourownIPportfoliocomprisesstand-alonesolutions.TheseincludeDdDPointofSales,Dataswitch,and the new Imagine platform and modules. These higher margin products can be sold with our other solutions or individually, including into K3’s existing large customer base.
Six months to 31 May Revenue GrossProfit GrossMargin 2018 2017 2018 2017 2018 2017 £m £m £m £m % %
Software licences 2.4 1.3 2.2 1.1 94.0% 86.5%Services 0.8 1.5 0.4 0.5 49.7% 32.2%Recurring 4.6 4.7 3.7 3.6 79.0% 76.7%Hardware and other 1.2 1.6 0.5 0.6 44.1% 35.6%Total 9.0 9.1 6.8 5.8 75.9% 63.4%
Recurring revenues comprise software maintenance renewals, support contracts, and hosting & managed services.
2018 2017
Adjustedprofitfromoperations*5 (£m) 2.5 0.9Recurring revenue as % of total revenues 51.8% 51.8%
K3 Business Technology Group plc Interim Results for the six months to 31 May 2018
GrossMargin
Rose to 75.9% (2017: 63.4%)
20172018

8 *See note 9 on page 19 for further details
TotalrevenuefromownIPoverthefirsthalfofthefinancialyear amounted to £9.0m (2017: £9.1m), however the revenuemixalteredsignificantly,withrevenuesfromsoftware licences up by 84.6%, and services revenues reducing by 46.7%. This change in the mix drove a 17.2% increaseingrossprofitto£6.8m(2017:£5.8m)anda12.5percentage point improvement in gross margin to 75.9% (2017: 63.4%).
Salesof“ax|isfashion”(whichislargelytargetedattheEnterprise market) and Pebblestone (our leading business softwareforthemid-marketfashionindustry)wereparticularlystrong,especiallyatthehalfyearendfor“ax|isfashion”.Wearealsoverypleasedtohighlightthevolumeof sales achieved through our channel partners.
Thestrongsalesof“ax|isfashion”intheperiodwereinstark contrast to the Enterprise market confusion in 2017, andthereisnowgreatersectoracceptanceofcloud-basedmodels,awayfromtraditional‘on-premise’solutions.Seven“ax|isfashion”dealswereclosedinthefirsthalf,withnewcustomersincludingMoleValleyFarmersLtd,theUK-basedrural retailer, Engbers, Germany’s largest shirt manufacturer, Van Bommel, the Dutch shoemaker and SanMar, the US fashion wholesaler. Eton Shirts, an existing K3 customer, alsoproceededwithamajorroll-outof“ax|isfashion”acrossitsbusiness.Mostofthedeploymentwascloud-based,and these new sales were predominantly achieved through channel partners.
Thepipelineforboth“ax|isfashion”andPebblestonecontinues to look very encouraging.
ThedevelopmentofImagine,ourcloud-native,ERP-agnostic platform has been an important step for us. The platformenablesustointegrateleading-edge‘module’solutions into customers’ existing infrastructure swiftly andcost-effectively.Inthisway,wecanbringproductinnovation and the full power of the cloud to customers in a commerciallyandoperationallyattractivemanner.Ourfirstsuite of modules for Imagine are based around our existing retailofferingsandweintendtodevelopfurtherfunctionally-rich modules to broaden the scope of our product range. We formally launched Imagine to the marketplace in the period, and signed a large contract, with Ossur, which designs and manufactures prosthetic limbs. While Imagine sales are currently a relatively small contributor to sales, we expect the Imagine platform and modules to become a cornerstone of our IP strategy, and are planning to spend 50% of capitalised development on Imagine over the year in order to capture the growth opportunities available to us.
Support CostsSupport costs*6 include the global costs of the Group’s finance,IT,legalandhumanresourcefunctions,aswellasBoardandPLCcosts.Thisclassificationisdifferentfrompreviousreportingandnowreflectsthecentralisedmanagement of these resources and costs.
Costs increased slightly as the Group’s infrastructure frameworkwasamendedtosupportamoreunifiedbusiness,includingsomedouble-runningofcostsduringthisprocess.
K3 Business Technology Group plc Interim Results for the six months to 31 May 2018

9
Consolidated Income Statementfor the six months ended 31 May 2018
Chairm
an’s & C
EO’s Report
Operational Review
Financial Statements
Notes
Unaudited Unaudited Audited Sixmonthsto Sixmonthsto 17monthsto 31May2018 31May2017 30November2017 Notes £’000 £’000 £’000
Revenue 41,407 40,339 118,176Cost of sales (19,789) (21,466) (57,197)
Grossprofit 21,618 18,873 60,979Administrative expenses (22,127) (24,224) (75,762)
Adjustedprofit/(loss)fromoperations 1,668 (3,055) (1,666)Amortisation of acquired intangibles (1,263) (1,443) (3,930)Acquisition costs (7) (9) (308)Exceptional reorganisation costs 2 (738) (844) (4,731)Exceptional impairment of development costs – – (4,541)Release of contingent consideration – – 393Share-basedpaymentcharge (169) – –
Loss from operations (509) (5,351) (14,783)
Finance expense (506) (498) (1,360)Loss before taxation (1,015) (5,849) (16,143)Tax(expense)/credit 3 (175) 1,395 2,773Loss for the period (1,190) (4,454) (13,370)
Alloftheprofit/(loss)fortheperiodisattributabletoequityholdersoftheparent.
(Loss) Per Share 4Basic (2.8)p (12.4)p (35.3)pDiluted (2.8)p (12.3)p (35.3)p
K3 Business Technology Group plc Interim Results for the six months to 31 May 2018

10
Consolidated Statement of Comprehensive Incomefor the six months ended 31 May 2018
Unaudited Unaudited Audited Sixmonthsto Sixmonthsto 17monthsto 31May2018 31May2017 30November2017 £’000 £’000 £’000
Loss for the period (1,190) (4,454) (13,370)Other comprehensive incomeExchange differences on translation of foreign operations (10) 419 1,110Other comprehensive income, net of tax (10) 419 1,110Total comprehensive expense for the period (1,200) (4,035) (12,260)
All of the total comprehensive expense for the period is attributable to equity holders of the parent. All of the other comprehensive (expense)/incomewillbereclassifiedsubsequentlytoprofitorlosswhenspecificconditionsaremet.Noneoftheitemswithinothercomprehensive(expense)/incomehadataximpact.
K3 Business Technology Group plc Interim Results for the six months to 31 May 2018

11
Unaudited Unaudited Audited Asat Asat Asat 31May2018 31May2017 30November2017 Notes £’000 £’000 £’000
ASSETSNon-current assetsProperty, plant and equipment 2,292 2,198 2,479Goodwill 50,973 50,913 51,019Other intangible assets 19,031 26,130 20,539Deferred tax assets 1,277 1,388 1,281Available-for-saleinvestments 98 98 98Total non-current assets 73,671 80,727 75,416Current assetsTrade and other receivables 33,642 39,714 30,429Cash and cash equivalents 1,905 1,987 1,941Total current assets 35,547 41,701 32,370
Total assets 109,218 122,428 107,786
LIABILITIESNon-current liabilitiesLong-termborrowings 5 10,355 19,799 6,170Deferred tax liabilities 2,275 3,307 2,524Total non-current liabilities 12,630 23,106 8,694Current liabilitiesTrade and other payables 6 27,889 32,634 29,249Current tax liabilities – – 127Short-termborrowings 5 59 698 59Total current liabilities 27,948 33,332 29,435
Total liabilities 40,578 56,438 38,129
EQUITYShare capital 10,737 9,000 10,737Share premium account 28,897 21,586 28,897Other reserves 10,448 10,448 10,448Translation reserve 2,176 1,946 2,186Retained earnings 16,382 23,010 17,389Total equity attributable to equity holders of the parent 68,640 65,990 69,657
Total equity and liabilities 109,218 122,428 107,786
Consolidated Statement of Financial Positionas at 31 May 2018
Chairm
an’s & C
EO’s Report
Operational Review
Financial Statements
Notes
K3 Business Technology Group plc Interim Results for the six months to 31 May 2018
12
Consolidated Statement of Cash Flowsfor the six months ended 31 May 2018
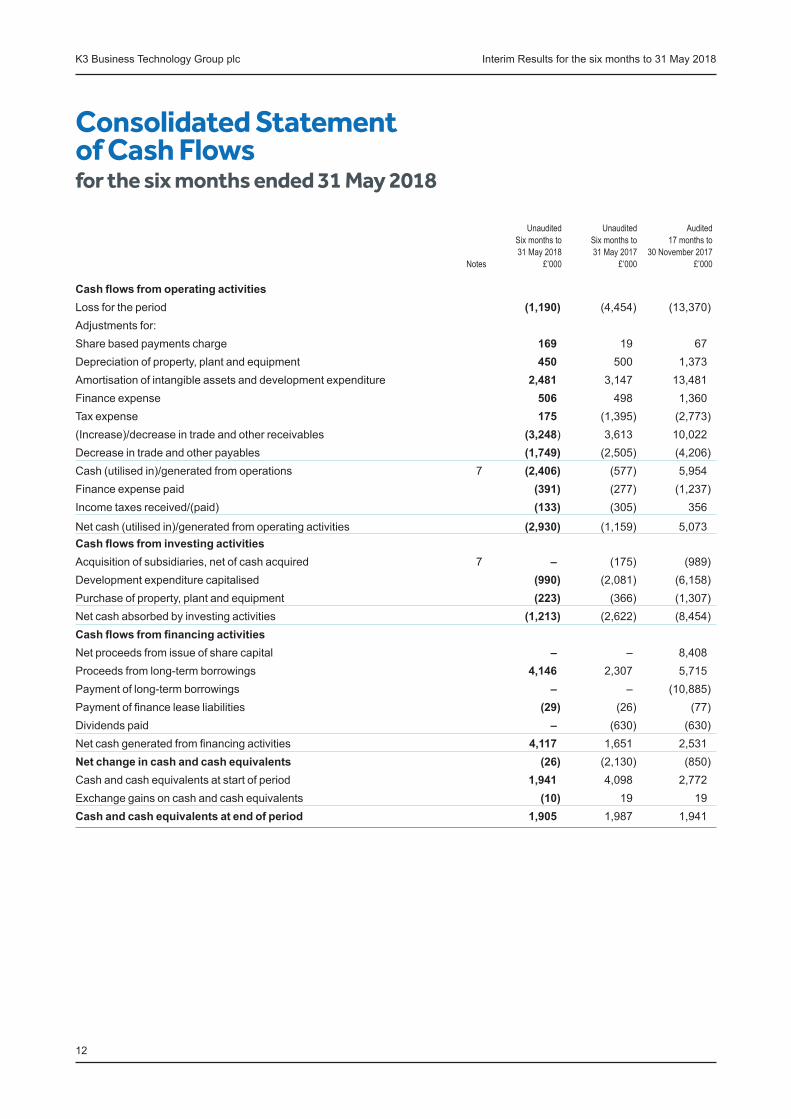
Unaudited Unaudited Audited Sixmonthsto Sixmonthsto 17monthsto 31May2018 31May2017 30November2017 Notes £’000 £’000 £’000
Cash flows from operating activitiesLoss for the period (1,190) (4,454) (13,370)Adjustments for:Share based payments charge 169 19 67Depreciation of property, plant and equipment 450 500 1,373Amortisation of intangible assets and development expenditure 2,481 3,147 13,481Finance expense 506 498 1,360Tax expense 175 (1,395) (2,773)(Increase)/decreaseintradeandotherreceivables (3,248) 3,613 10,022Decrease in trade and other payables (1,749) (2,505) (4,206)Cash(utilisedin)/generatedfromoperations 7 (2,406) (577) 5,954Finance expense paid (391) (277) (1,237)Incometaxesreceived/(paid) (133) (305) 356
Netcash(utilisedin)/generatedfromoperatingactivities (2,930) (1,159) 5,073Cash flows from investing activitiesAcquisition of subsidiaries, net of cash acquired 7 – (175) (989)Development expenditure capitalised (990) (2,081) (6,158)Purchase of property, plant and equipment (223) (366) (1,307)Net cash absorbed by investing activities (1,213) (2,622) (8,454)Cash flows from financing activitiesNet proceeds from issue of share capital – – 8,408Proceedsfromlong-termborrowings 4,146 2,307 5,715Paymentoflong-termborrowings – – (10,885)Paymentoffinanceleaseliabilities (29) (26) (77)Dividends paid – (630) (630)Netcashgeneratedfromfinancingactivities 4,117 1,651 2,531Net change in cash and cash equivalents (26) (2,130) (850)Cash and cash equivalents at start of period 1,941 4,098 2,772Exchange gains on cash and cash equivalents (10) 19 19Cash and cash equivalents at end of period 1,905 1,987 1,941
K3 Business Technology Group plc Interim Results for the six months to 31 May 2018

13
Share Share Other Translation Retained Total capital premium reserve reserve earnings equity £’000 £’000 £’000 £’000 £’000 £’000
At 1 December 2016 9,000 21,586 10,448 1,527 28,055 70,616Changes in equity forsix months ended 31 May 2017Loss for the period – – – – (4,454) (4,454)Other comprehensive income for the period – – – 419 – 419Totalcomprehensiveincome/(expense) – – – 419 (4,454) (4,035)Share-basedpaymentcredit – – – – 19 19Movement in own shares held – – – – 20 20Dividends to equity holders – – – – (630) (630)At 31 May 2017 9,000 21,586 10,448 1,946 23,010 65,990Changes in equity forsix months ended 30 November 2017Loss for the period – – – – (5,669) (5,669)Other comprehensive income for the period – – – 240 – 240Totalcomprehensiveincome/(expense) – – – 240 (5,669) (5,429)Share-basedpaymentcredit – – – – 24 24Warrants exercised 175 488 – – – 663Conversion of shareholder loan to equity 114 526 – – – 640Issue of new shares 1,448 6,297 – – – 7,745Movement in own shares held – – – – 24 24At 30 November 2017 10,737 28,897 10,448 2,186 17,389 69,657Changes in equity forsix months ended 31 May 2018Loss for the period – – – – (1,190) (1,190)Othercomprehensiveincome/(expense)fortheperiod – – – (10) – (10)Totalcomprehensiveincome/(expense) – – – (10) (1,190) (1,200)Share-basedpaymentcredit – – – – 169 169Movement in own shares held – – – – 14 14At 31 May 2018 10,737 28,897 10,448 2,176 16,382 68,640
Consolidated Statement of Changes in Equityfor the six months ended 31 May 2018
Chairm
an’s & C
EO’s Report
Operational Review
Financial Statements
Notes
K3 Business Technology Group plc Interim Results for the six months to 31 May 2018
14
Notes to the Unaudited Interim Statement
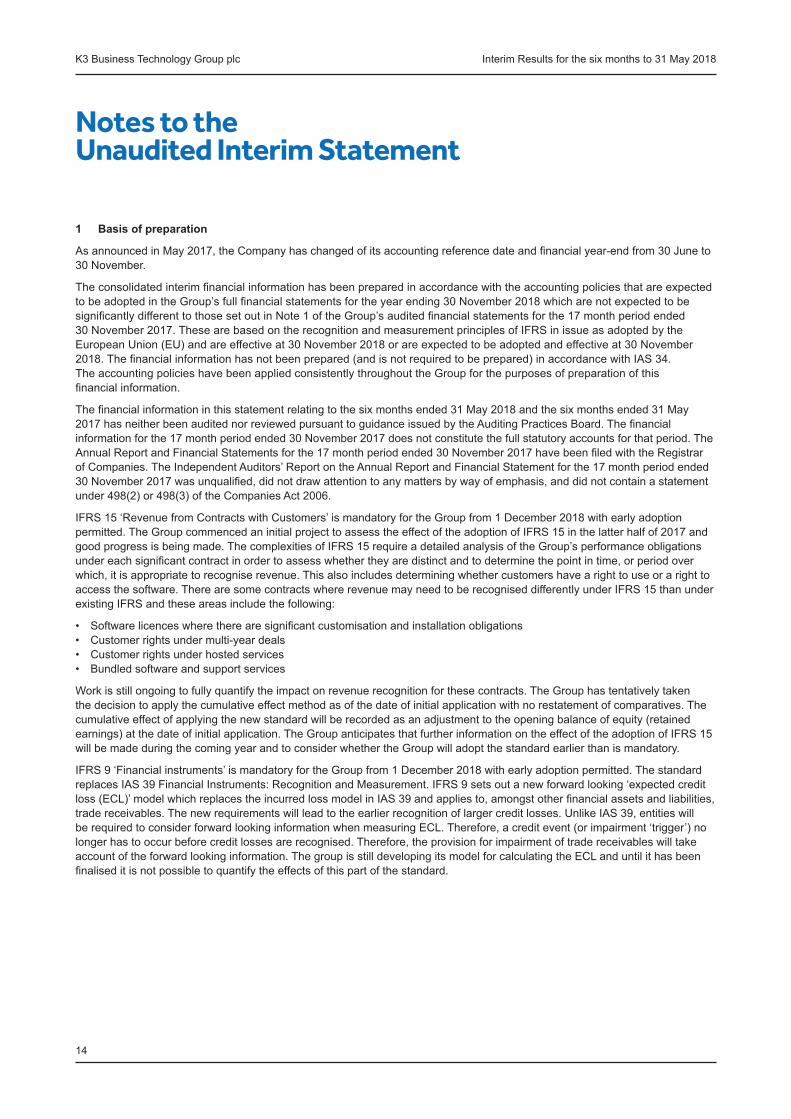
1 Basis of preparation
AsannouncedinMay2017,theCompanyhaschangedofitsaccountingreferencedateandfinancialyear-endfrom30Juneto30 November.
TheconsolidatedinterimfinancialinformationhasbeenpreparedinaccordancewiththeaccountingpoliciesthatareexpectedtobeadoptedintheGroup’sfullfinancialstatementsfortheyearending30November2018whicharenotexpectedtobesignificantlydifferenttothosesetoutinNote1oftheGroup’sauditedfinancialstatementsforthe17monthperiodended30 November 2017. These are based on the recognition and measurement principles of IFRS in issue as adopted by the European Union (EU) and are effective at 30 November 2018 or are expected to be adopted and effective at 30 November 2018.Thefinancialinformationhasnotbeenprepared(andisnotrequiredtobeprepared)inaccordancewithIAS34. The accounting policies have been applied consistently throughout the Group for the purposes of preparation of this financialinformation.
Thefinancialinformationinthisstatementrelatingtothesixmonthsended31May2018andthesixmonthsended31May2017hasneitherbeenauditednorreviewedpursuanttoguidanceissuedbytheAuditingPracticesBoard.Thefinancialinformation for the 17 month period ended 30 November 2017 does not constitute the full statutory accounts for that period. The AnnualReportandFinancialStatementsforthe17monthperiodended30November2017havebeenfiledwiththeRegistrarof Companies. The Independent Auditors’ Report on the Annual Report and Financial Statement for the 17 month period ended 30November2017wasunqualified,didnotdrawattentiontoanymattersbywayofemphasis,anddidnotcontainastatementunder 498(2) or 498(3) of the Companies Act 2006.
IFRS15‘RevenuefromContractswithCustomers’ismandatoryfortheGroupfrom1December2018withearlyadoptionpermitted. The Group commenced an initial project to assess the effect of the adoption of IFRS 15 in the latter half of 2017 and good progress is being made. The complexities of IFRS 15 require a detailed analysis of the Group’s performance obligations undereachsignificantcontractinordertoassesswhethertheyaredistinctandtodeterminethepointintime,orperiodoverwhich, it is appropriate to recognise revenue. This also includes determining whether customers have a right to use or a right to access the software. There are some contracts where revenue may need to be recognised differently under IFRS 15 than under existing IFRS and these areas include the following:
• Softwarelicenceswheretherearesignificantcustomisationandinstallationobligations• Customerrightsundermulti-yeardeals• Customer rights under hosted services• Bundled software and support services
Work is still ongoing to fully quantify the impact on revenue recognition for these contracts. The Group has tentatively taken the decision to apply the cumulative effect method as of the date of initial application with no restatement of comparatives. The cumulative effect of applying the new standard will be recorded as an adjustment to the opening balance of equity (retained earnings) at the date of initial application. The Group anticipates that further information on the effect of the adoption of IFRS 15 will be made during the coming year and to consider whether the Group will adopt the standard earlier than is mandatory.
IFRS9‘Financialinstruments’ismandatoryfortheGroupfrom1December2018withearlyadoptionpermitted.ThestandardreplacesIAS39FinancialInstruments:RecognitionandMeasurement.IFRS9setsoutanewforwardlooking‘expectedcreditloss(ECL)’modelwhichreplacestheincurredlossmodelinIAS39andappliesto,amongstotherfinancialassetsandliabilities,trade receivables. The new requirements will lead to the earlier recognition of larger credit losses. Unlike IAS 39, entities will berequiredtoconsiderforwardlookinginformationwhenmeasuringECL.Therefore,acreditevent(orimpairment‘trigger’)nolonger has to occur before credit losses are recognised. Therefore, the provision for impairment of trade receivables will take account of the forward looking information. The group is still developing its model for calculating the ECL and until it has been finaliseditisnotpossibletoquantifytheeffectsofthispartofthestandard.
K3 Business Technology Group plc Interim Results for the six months to 31 May 2018

15
2 Loss from operations
During the six month period to 31 May 2018, reorganisation costs of £0.73m have been incurred, most of which are redundancy costs. During the six month period to 31 May 2017, reorganisation costs of £0.84m were incurred relating to the reorganisation programmetocreatemoreunified,streamlinedoperationsandreducedcostbase.
3 Tax expense Unaudited Unaudited Audited Sixmonthsto Sixmonthsto 17monthsto 31May2018 31May2017 30November2017 £’000 £’000 £’000
Current tax expense/(credit)UK corporation tax and income tax of overseasoperationsonprofits/(losses)fortheperiod 183 (181) (388)Adjustment in respect of prior periods 230 (125) (176)Totalcurrenttaxexpense/(credit) 413 (306) (564)Deferred tax incomeOrigination and reversal of temporary differences (238) (960) (2,046)Effect of change in rate of deferred tax – (129) (163)Total deferred tax income (238) (1,089) (2,209)Totaltaxexpense/(credit) 175 (1,395) (2,773)
Chairm
an’s & C
EO’s Report
Operational Review
Financial Statements
Notes
K3 Business Technology Group plc Interim Results for the six months to 31 May 2018
16
Notes to the Unaudited Interim Statement continued
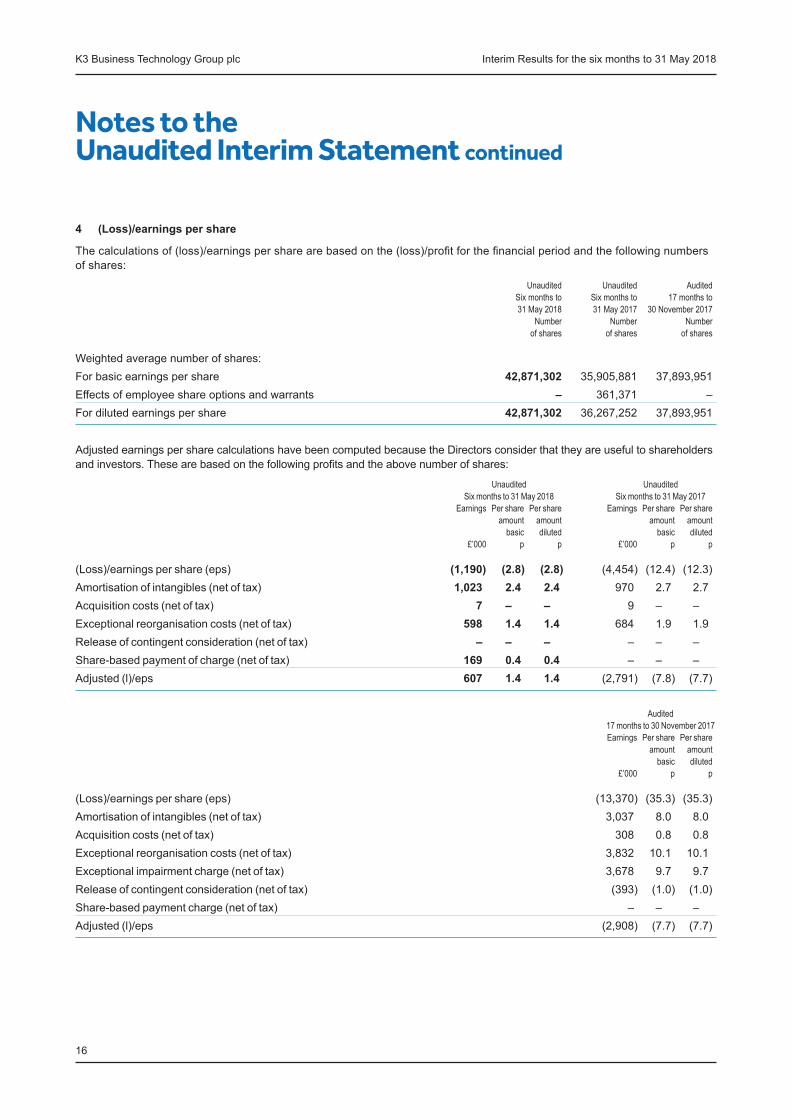
4 (Loss)/earnings per share
Thecalculationsof(loss)/earningspersharearebasedonthe(loss)/profitforthefinancialperiodandthefollowingnumbersof shares:
Unaudited Unaudited Audited Sixmonthsto Sixmonthsto 17monthsto 31May2018 31May2017 30November2017 Number Number Number ofshares ofshares ofshares
Weighted average number of shares:For basic earnings per share 42,871,302 35,905,881 37,893,951Effects of employee share options and warrants – 361,371 –For diluted earnings per share 42,871,302 36,267,252 37,893,951
Adjusted earnings per share calculations have been computed because the Directors consider that they are useful to shareholders andinvestors.Thesearebasedonthefollowingprofitsandtheabovenumberofshares:
Unaudited Unaudited Sixmonthsto31May2018 Sixmonthsto31May2017 Earnings Pershare Pershare Earnings Pershare Pershare amount amount amount amount basic diluted basic diluted £’000 p p £’000 p p
(Loss)/earningspershare(eps) (1,190) (2.8) (2.8) (4,454) (12.4) (12.3)Amortisation of intangibles (net of tax) 1,023 2.4 2.4 970 2.7 2.7Acquisition costs (net of tax) 7 – – 9 – –Exceptional reorganisation costs (net of tax) 598 1.4 1.4 684 1.9 1.9Release of contingent consideration (net of tax) – – – – – –Share-basedpaymentofcharge(netoftax) 169 0.4 0.4 – – –Adjusted(l)/eps 607 1.4 1.4 (2,791) (7.8) (7.7)
Audited 17monthsto30November2017 Earnings Pershare Pershare amount amount basic diluted £’000 p p
(Loss)/earningspershare(eps) (13,370) (35.3) (35.3) Amortisation of intangibles (net of tax) 3,037 8.0 8.0 Acquisition costs (net of tax) 308 0.8 0.8 Exceptional reorganisation costs (net of tax) 3,832 10.1 10.1 Exceptional impairment charge (net of tax) 3,678 9.7 9.7 Release of contingent consideration (net of tax) (393) (1.0) (1.0) Share-basedpaymentcharge(netoftax) – – – Adjusted(l)/eps (2,908) (7.7) (7.7)
K3 Business Technology Group plc Interim Results for the six months to 31 May 2018

17
5 Loans and borrowings Unaudited Unaudited Audited Asat Asat Asat 31May2018 31May2017 30November2017 £’000 £’000 £’000
Non-currentBank loans (secured) 10,339 19,725 6,124Finance lease creditors 16 74 46 10,355 19,799 6,170
CurrentFinance lease creditors 59 58 59Loans from related parties – 640 – 59 698 59
Total borrowings 10,414 20,497 6,229
The movement in net debt (gross debt less cash and cash equivalents) has been computed as the Directors consider it useful to shareholdersandinvestors.Ascashflowsareseasonal,itismoreusefultopresentthemovementfora12monthperiod.Themovement in net debt during the 12 months to 31 May 2018 is as follows:
Unaudited Unaudited 12monthsto 12monthsto 31May2018 31May2017 £’000 £’000
Net debt at 1 June 2017 (18,510) (11,293) Operating cash generation 1,105 (3,985) Interest paid (731) (964) Taxreceived/(paid) 432 (229) Net proceeds from issue of shares 8,408 – Conversionofloantoequity(non-cash) 640 – Acquisitions 393 (904) Other movements (246) (1,135) Net debt at 31 May 2018 (8,509) (18,510)
Chairm
an’s & C
EO’s Report
Operational Review
Financial Statements
Notes
K3 Business Technology Group plc Interim Results for the six months to 31 May 2018

18
Notes to the Unaudited Interim Statement continued
6 Trade and other payables Unaudited Unaudited Audited Asat Asat Asat 31May2018 31May2017 30November2017 £’000 £’000 £’000
Trade payables 5,084 6,006 4,739Other payables 504 430 594Accruals 7,341 9,999 8,818Totalfinancialliabilities,excludingloansandborrowings,classifiedasfinancialliabilitiesmeasuredatamortisedcost 12,929 16,435 14,151Contingent consideration – 938 –Other tax and social security taxes 2,494 3,419 3,961Deferred revenue 12,466 11,842 11,137 27,889 32,634 29,249
7 Notes to the cash flow statement
Cash generated from operations is stated after exceptional reorganisation costs and acquisition costs. The adjusted cash generated from operations has been computed because the directors consider it more useful to shareholders and investors in assessingtheunderlyingoperatingcashflowoftheGroup.Theadjustedcashgeneratedfromoperationsiscalculatedasfollows:
Unaudited Unaudited Audited Sixmonthsto Sixmonthsto 17monthsto 31May2018 31May2017 30November2017 £’000 £’000 £’000
Cash(utilisedin)/generatedfromoperatingactivities (2,406) (577) 5,954Add:Exceptional reorganisation costs 738 844 4,731Acquisition costs 7 9 308Release of contingent consideration – – (393)Adjusted(utilisedin)/cashgeneratedfromoperations (1,661) 276 10,600
Acquisition of subsidiaries and other business units, net of cash acquired comprises:
Unaudited Unaudited Audited Sixmonthsto Sixmonthsto 17monthsto 31May2018 31May2017 30November2017 £’000 £’000 £’000
Initial consideration – – (1,506)Cash balances acquired – – 324Contingentconsideration(paidinto)/repaidfromescrow – – 393Contingent and deferred consideration paid – (175) (200) – (175) (989)
K3 Business Technology Group plc Interim Results for the six months to 31 May 2018

Chairm
an’s & C
EO’s Report
Operational Review
Financial Statements
Notes
19
8 The above information is being sent to shareholders and is available from the Company’s website, www.k3btg.com, and fromitsregisteredoffice:BaltimoreHouse,50KansasAvenue,ManchesterM502GL.
9 Notes to the Financial Results*1 Groupadjustedprofit/(loss)fromoperationsiscalculatedbeforeamortisationofacquiredintangiblesof£1.3m(2017:
£1.4m),exceptionalreorganisationcostsof£0.7m(2017:£0.8m),andshare-basedpaymentchargeof£0.2m(2017:nil).*2 Groupadjustedprofit/(loss)beforetaxiscalculatedbeforeamortisationofacquiredintangiblesof£1.3m(2017:£1.4m),
exceptionalreorganisationcostsof£0.7m(2017:£0.8m),andshare-basedpaymentchargeof£0.2m(2017:nil).*3 Groupadjustedearnings/(loss)pershareiscalculatedbeforeamortisationofacquiredintangibles(netoftax)of£1.0m
(2017:£1.0m),exceptionalreorganisationcosts(netoftax)of£0.6m(2017:£0.7m),andshare-basedpaymentcharge(netof tax) of £0.2m (2017: nil).
*4 Supplychainsolutionsandmanagedservicesadjustedprofit/(loss)fromoperationsiscalculatedbeforeamortisationofacquired intangibles of £0.7m (2017: £0.7m) and exceptional reorganisation costs of £0.4m (2017: £0.8m).
*5 OwnIPadjustedprofitfromoperationsiscalculatedbeforeamortisationofacquiredintangiblesof£0.5m(2017:£0.7m)andexceptional reorganisation costs of £0.2m (2017: nil).
*6 Supportcostsarecalculatedbeforeexceptionalreorganisationcostsof£0.1m(2017:£0.1m)andshare-basedpaymentcharge of £0.2m (2017: nil).
K3 Business Technology Group plc Interim Results for the six months to 31 May 2018

20
K3 Business Technology Group plc Interim Results for the six months to 31 May 2018


K3 Business Technology Group plcBaltimore House, 50 Kansas Avenue, Manchester M50 2GLwww.k3btg.com