k–12 reforms and california’s english learner … · spanish speakers. some english learner...
TRANSCRIPT

May 2018
Laura Hill
K–12 Reforms and California’s EnglishLearner Achievement Gap
Summary
English Learner (EL) students have been a key part of California’s K–12 system fordecades. They currently make up about 21 percent of the public school population.English Learner status is meant to be temporary, and indeed, reclassified EnglishLearners (those who are deemed English proficient) are among the best-performingstudents in the state. But students who remain ELs for longer periods generally havepoor outcomes.
An important aim of recent reforms is to change how we fund, educate, assess, andhold districts accountable for EL students, and there are more changes on the horizon.This report highlights key demographic facts about English Learners, their progressthrough our schools, recent reforms that aim (at least in part) to narrow the achievementgap for English Learner students, and ways to improve EL outcomes in the future.
Most English Learner students were born in the United States; the vast majority areSpanish speakers.
Some English Learner students are reclassified relatively quickly, while others remainELs for more than six years. There are new English Learner students enteringCalifornia’s schools at every grade level, including grade 12.
The Local Control Funding Formula is designed to elevate performance of EnglishLearner students. Yet it is challenging to track spending and difficult to attributeoutcomes to increased funding.
The state’s accountability system has expanded district reporting requirements forEnglish Learner students, but educators and policymakers could monitor progressmore effectively with the use of longitudinal statewide data.
In the coming months, the state will be revamping its reclassification policies. It shouldconsider three key ways to accelerate the progress of this important group of students.First, the new reclassification policies should be consistent across districts. Second, thenew policies should take advantage of the new alignment between English languagedevelopment standards and the Common Core standards. Finally, the state shouldconsider allowing reclassification criteria to vary across types of ELs (e.g., studentsentering at different grade levels).

IntroductionIn total, more than 40 percent of the students in California’s public schools speak a language other
than English at home. In the 2016–17 school year, 21 percent (or more than 1.3 million) of all students
were English Learners. When students who were formerly English Learners are added in, the
population of “ever ELs” expands to 38 percent of all K–12 students in the state.
Students entering K–12 schools in California are classified as English Learners if they speak a
language other than English at home and score below a proficiency threshold on the California
English Language Development Text (CELDT). EL status is meant to be temporary—when students
demonstrate sufficient English language proficiency, their official designation changes to
Reclassified Fluent English Proficient (RFEP).
English Learners are meant to have English language development instruction, either in stand-alone
English language development classes (“designated”) or as part of regular instruction (“integrated”).
EL students do receive core subject instruction, but English language development instruction may
mean they have less of it. After they are reclassified, these students no longer receive English
language development instruction and take core subjects without additional support.
In order to be reclassified, students must demonstrate English language proficiency on assessments
administered only to EL students and demonstrate basic skills in English that are comparable to
native English speakers. Individual school districts make the decision to reclassify EL students
based on a number of criteria recommended by the state.
Student outcome data has long revealed that EL students do not fare as well as their non-EL peers.
Districts and schools with large numbers and/or proportions of EL students tend to have lower
performance than districts and schools with lower numbers and/or shares of EL students. This was a
key motivator for the Local Control Funding Formula (LCFF), enacted in 2013–14. The LCFF sends
more funding per pupil to districts for English Learner and other “high need” students (those who
are economically disadvantaged or foster youth), because these students have greater (and more
expensive) educational needs. In 2017, the California Department of Education (CDE) reported that
85 percent of EL students were economically disadvantaged, as were 79 percent of former EL
students. However, reclassified students perform much better than current EL students, and they
sometimes perform better than students who do not speak a foreign language at home.
Recent policy changes demonstrate broad interest in reforming EL education. The state’s new
academic standards, assessments, and instructional models, as well as a new funding formula are
aimed, at least in part, at closing the EL achievement gap. These myriad policy changes prompted a
group of stakeholders, including the California Department of Education (CDE) to come together to
create a “roadmap” for English Learner policy in the state. The roadmap’s aim is to help districts
align their accountability plans with guidelines for ELs from the State Board of Education. In
addition, California voters recently voted overwhelmingly in favor of Proposition 58, which loosens
restrictions on bilingual education offered by districts that date back to the late 1990s. If schools
and school districts expand their bilingual course offerings, demand for bilingual instructors may
increase.
This report provides a demographic overview of California’s English Learner students, describes a
number of recent educational policy changes that impact these students, and highlights policy
changes and opportunities going forward.
1
2
3
4
5
6
2

Who Are California’s English Learner Students?California’s English Learner students are a diverse group. Of the more than 60 languages spoken,
Spanish is by far the most common: 83 percent of ELs in California schools speak it at home. The
next most common languages are Vietnamese and Mandarin, spoken by 2 percent and 1.6 percent
of EL students, respectively. Arabic, Filipino, and Cantonese each make up about 1 percent of
languages spoken.
Figure 1. Spanish dominates languages spoken by California ELs
SOURCE: CDE Dataquest 2016–17.
Most English Learners are not foreign born. Nationally, the Migration Policy Institute reports that 82
percent of EL students in grades pre-K through 5 are US born. The share of US-born EL students in
grades 6 through 12 is lower (65%), mainly because of the arrival of older EL students and the
reclassification of many students who started school as ELs. Overall, about 1.5 percent of all EL
students in California have lived in the United States for less than one year. However, this share is
higher among secondary students (2% of 7th and 8th graders and 3.7% of 12th graders). About 3
percent of all EL students in California have a parent who has moved within the last three years to
pursue employment in agriculture or related industries.
Many US-born EL students come from families with a mix of immigration statuses. The Pew
Research Center estimates that 12 percent of California’s K–12 students have a least one
undocumented parent (Passel and Cohn 2016). In the current political climate, the state
superintendent of instruction has suggested that parents and students should be told that their
schools are safe havens from deportation (Jones 2017), and many school districts with EL student
populations are eager to assure families that their students (and student data) are safe at school.
WHERE ARE THE STATE’S ENGLISH LEARNER STUDENTS?
English Learner students are an important part of the student populations in rural, urban, and
suburban school districts (Figure 2). Almost every county in the state has EL students—the lone
exception is Alpine County, which has only 82 students. The counties with the largest shares of ELs
are Imperial (43%), Monterey (40%), Colusa (38%), and Santa Barbara (33%). Not surprisingly, Los
Angeles, Orange, and San Diego Counties have the largest numbers of EL students.
7
8
3
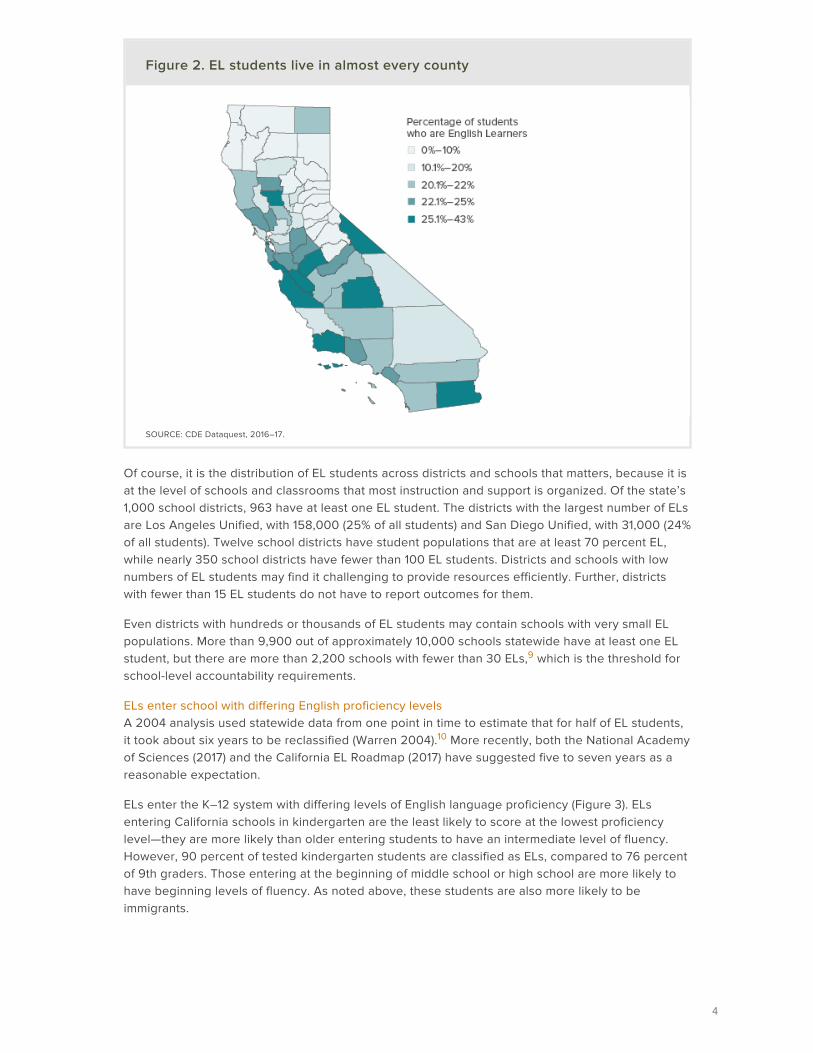
Figure 2. EL students live in almost every county
SOURCE: CDE Dataquest, 2016–17.
Of course, it is the distribution of EL students across districts and schools that matters, because it is
at the level of schools and classrooms that most instruction and support is organized. Of the state’s
1,000 school districts, 963 have at least one EL student. The districts with the largest number of ELs
are Los Angeles Unified, with 158,000 (25% of all students) and San Diego Unified, with 31,000 (24%
of all students). Twelve school districts have student populations that are at least 70 percent EL,
while nearly 350 school districts have fewer than 100 EL students. Districts and schools with low
numbers of EL students may find it challenging to provide resources efficiently. Further, districts
with fewer than 15 EL students do not have to report outcomes for them.
Even districts with hundreds or thousands of EL students may contain schools with very small EL
populations. More than 9,900 out of approximately 10,000 schools statewide have at least one EL
student, but there are more than 2,200 schools with fewer than 30 ELs, which is the threshold for
school-level accountability requirements.
ELs enter school with differing English proficiency levels
A 2004 analysis used statewide data from one point in time to estimate that for half of EL students,
it took about six years to be reclassified (Warren 2004). More recently, both the National Academy
of Sciences (2017) and the California EL Roadmap (2017) have suggested five to seven years as a
reasonable expectation.
ELs enter the K–12 system with differing levels of English language proficiency (Figure 3). ELs
entering California schools in kindergarten are the least likely to score at the lowest proficiency
level—they are more likely than older entering students to have an intermediate level of fluency.
However, 90 percent of tested kindergarten students are classified as ELs, compared to 76 percent
of 9th graders. Those entering at the beginning of middle school or high school are more likely to
have beginning levels of fluency. As noted above, these students are also more likely to be
immigrants.
9
10
4

Figure 3. ELs enter California schools with varying levels of Englishproficiency
SOURCE: CDE Dataquest 2016-17.
NOTE: Scores on initial CELDT for students scoring below Early Advanced.
A student’s initial level of English language proficiency is related to how long he or she remains an
EL. California recently started recording the number of long-term ELs—students who remain ELs for
six or more years—as well as students who are “at risk” of becoming long-term ELs—those who
remain ELs for four to five years. The reasoning is threefold: (1) for many students, progress toward
reclassification diminishes the longer they remain in the program; (2) the need for core content
instruction becomes more acute in middle and high school; and (3) there is a stigma associated with
being an EL student beyond elementary school (Olsen 2010). Some districts, such as Los Angeles
Unified, have begun offering specialized instruction for long-term ELs in an effort to accelerate their
progress.
Entering school with a higher level of English fluency generally results in earlier reclassification:
English Learner students who start as kindergartners at higher English language proficiency levels
are reclassified sooner than others (Thompson 2017). The varying strength of EL programs across
districts and schools also plays a role in the amount of time it takes students to be reclassified.
When we examine EL students by grade, we find that many have entered the ranks of reclassified
ELs by the 6th grade but that a nearly equal number have become long-term ELs by that point in
time. At higher grade levels, there are fewer new ELs (enrolled for three years or less) and more
reclassified students. The number of long-term ELs is lower in grades 11 and 12, both because these
students get reclassified and because they are more likely than other students to drop out of high
school.
Figure 4. Some students take many years to reclassify
SOURCE: CDE Dataquest 2016–17.
11
5
Assessing EL Student PerformanceThe K–12 policy changes that aim to reduce inequality and improve educational outcomes for all
students are particularly important for English Learner students. This section outlines the impact of
these recent changes on English Learners.
ACADEMIC STANDARDS AND ASSESSMENTS
California has adopted a number of new standards—for math, English Language Arts (ELA), science,
and English language development (for ELs)—over the past decade. In addition, there are new
assessments to measure students’ mastery of and progress toward meeting each of these new
standards.
Common Core standards and Smarter Balanced assessments
California adopted the Common Core State Standards in 2010. As has been widely reported, this
transition has been uneven across the state (Warren and Murphy 2014). The Common Core
standards were expected to present additional challenges for EL students due to the increase in
language demands in the new standards, not just in English, but also in mathematics and other
subject areas (Pompa and Hakuta, 2012). If language demands are not adequately addressed
through good curriculum, EL students could miss access to core content. Beginning in 2014–15,
California started administering the new standardized tests that measure student mastery of the
Common Core standards (the Smarter Balanced, or CAASP).
English language development standards
In 2012, the state adopted new English language development standards for EL students. These
standards are aligned with the Common Core ELA standards. The transition to the new
assessment, the English Language Proficiency Assessment for California (ELPAC), began in the
2017–18 school year. Unlike the old English proficiency assessment, the English language
development standards measured are now connected to the Common Core standards. The
expectation is that ELPAC scores tell educators not only how well EL students are progressing on
measures of English listening, speaking, writing, and reading, but also whether they are mastering
the English skills required for core courses. This alignment makes some educators optimistic that EL
students will no longer need to reach certain benchmarks on the ELA basic skills assessments
(currently the Smarter Balanced) in order to be reclassified. Many have noted that English-only
students who cannot meet these benchmarks are afforded full access to core academic content.
RECLASSIFICATION
In the 2016–17 school year, the reclassification rate for EL students was 13 percent (CDE Dataquest,
2016–17). Prior research has found that reclassified EL students perform much better than current
ELs. This is unsurprising, given that these students have met certain English proficiency and English
basic skills standards.
The most recent Smarter Balanced results for California indicate that the gap in performance is
substantial. Across the tested grades, 58 percent of reclassified students met the ELA standard,
compared to only 12 percent of EL students. Reclassified students were more likely to meet the ELA
standard than students who speak English only (54%). In math, RFEP students vastly outperformed
EL students (41% met the standards, compared to only 12% of ELs) but did not outperform English-
only students (43%). Prior research has found similar performance across a variety of academic
outcomes and school district settings.
12
13
6

Figure 5. Reclassified ELs are among the state’s strongest performers
SOURCE: CDE Smarter Balanced Results, 2016–17 school year.
Educators and policymakers are interested in reclassifying more EL students and doing so more
quickly. However, research is somewhat limited on the question of whether reclassification causes
improved outcomes for EL students, or serves a way to screen for high performing students.
In recent years, the question of how to reclassify students more quickly has been complicated by
changing reclassification criteria. The State Board of Education recommends that districts base their
decisions on four basic criteria: (1) English proficiency (as measured by the CELDT), (2) basic skills in
English (per the ELA assessment from the California Standards Test (CST)), (3) teacher
recommendations, and (4) parent consultation. However, the CST was replaced in 2015–16 and
the CELDT is being replaced this year (2017–18). Table 1 provides a broad overview of recent
changes in the reclassification criteria for basic skills and English proficiency.
Table 1. Reclassification standards have changed almost every year for thelast five years
SOURCES: CDE Reclassification Guidance memos, 2014, 2015, 2017.
NOTES: CAHSEE is the California High School Exit Exam, administered for the last time in 2014–15.CDE did not issue cut pointguidelines for the Smarter Balanced assessments to be used for reclassification. Cut points for the ELPAC will be recommended infall 2018.
The CDE has allowed districts some flexibility in choosing assessments and reclassification
thresholds. However, the federal education law, the Every Student Succeeds Act (ESSA) enacted
in 2016 requires states to standardize reclassification policies across school districts. Moreover,
reclassification is one of the state’s most important policy levers, given that curricular decisions are
made primarily at the district level. As the state grapples with a reclassification standard for all 1,000
school districts, there are a number of questions to consider.
14
15
7

Should we use fewer criteria and consider dropping the test of basic skills?
Should we allow for—but not require—multiple measures for reclassification?
Should reclassification criteria vary across types of EL student?
Because the new English Language Proficiency Assessment (ELPAC) is aligned not only with the
state’s English language development standards but also with the Common Core standards, there is
reason to be optimistic that a strong performance on the new assessment would indicate an ability
to perform well in the core curriculum. Research undertaken on behalf of CDE will investigate the
correspondence between performance on the ELPAC and the Smarter Balanced. The use of one
assessment has been supported by a number of English Learner researchers. Analyses of Los
Angeles Unified and San Diego Unified School districts found that the test of English language
proficiency (the CELDT) was almost as useful in predicting English Learner success as the CELDT in
combination with the CST (Hill et al. 2014). Based on their work with California school districts,
Umansky et al. (2015) similarly suggest that the test of English language proficiency might be
sufficient.
The Smarter Balanced assessment, which has replaced the CST, has been widely demonstrated to
be more challenging for all students, but especially for English Learners. Only 12 percent of English
Learners met the standard for ELA. Since more than half of California’s school children are not
meeting the ELA standard (at least as of 2016–17), this threshold seems unreasonable for English
Learners. If English Learner status causes students to miss out on at least some core academic
content (Callahan 2005), it can prevent them from taking all of the courses required to graduate and
be eligible for California’s state universities. To prevent this from happening, some districts have
decided that ELs are eligible for reclassification if their scores match the average district student
score on the ELA assessment.
Currently, all four criteria must be met for a student to be reclassified. In most cases, school districts
consider only the most recent score in determining whether a student can be reclassified. Research
on remediation policies at state community colleges has demonstrated that allowing more than one
measure to be used to determine student placement leads to better outcomes than using a single
measure, such as a placement test (Cuellar Mejia, Rodriguez, and Johnson 2016). Given these
findings, the state should consider allowing either the ELPAC or the Smarter Balanced to be used
for reclassification determination.
Finally, federal law requires policies be the same across school districts, but it does not appear to
require that the same reclassification criteria apply to all types of English Learner students.
Elementary school ELs are quite different from secondary school ELs. Most elementary school ELs
enrolled in school as kindergartners, and we can expect different rates of progress for kindergarten
ELs, depending on their initial language proficiency scores (Thompson 2017; Hopkins et al. 2013) or
instructional program (Umansky and Reardon 2014). Secondary school ELs are a combination of
long-term ELs and new arrivals to the United States. Each of these secondary school ELs can be
expected to make different rates of progress with English language fluency. But secondary school
ELs face a time crunch: instruction in English language proficiency often takes time away from
courses in core academic content. Finding the right moment to launch these students out of English
Learner instruction and into core content is critical to their ability to complete high school. Research
currently under way at PPIC hopes to address the question of whether it is helpful to students’
academic outcomes to base different reclassification policies on the grade level and type of EL
students (for example, late arriving ELs or long-term ELs).
Supporting ProgressTo monitor the impact of the reforms being implemented on EL achievement, the state needs to be
able to track state funding for EL students and assess whether and how it is helping students
succeed. In this section, we consider increased transparency in district spending of LCFF grants and
improvements to the way the state monitors student outcomes.
16
8
There is tremendousvariation in the waydistricts documentspending for ELstudents and explaininghow this spending mightaffect outcomes.
LCFF FUNDING
English Learners generate extra funding for the school districts that serve them in the form of three
per pupil grants from the state. These weighted funding formulas were enacted beginning in 2013–
14 and are about to be fully funded. All students (including ELs) generate a base grant for their
district based on grade level. Each high-need student (an English Learner or economically
disadvantaged or foster youth) generates a supplemental grant that is 20 percent of the base grant.
In districts with more than 55 percent high-need students, each high-need student above the 55
percent threshold generates a concentration grant that is 50 percent of the base grant.
At the time the new funding formula was being debated, English Learner advocates were pleased
that districts with higher shares of high-need students would be receiving more funding but
concerned that districts were not required to demonstrate that the extra funding for EL and other
high-need students was spent on those students. In response, the legislature required that districts
use Local Control Accountability Plans (LCAPs) to document the extra support and services
provided to high-need students.
However, research has yet to demonstrate that the funding formula has led to improved outcomes
for English Learner students. Many advocates, legislators, and researchers have repeatedly noted
that is very difficult, if not impossible, to track spending on EL students at either the school or
district level. The governor’s 2018–19 budget proposal suggests a new willingness on his part to
reconsider what these groups have argued was a flaw in the 2013 legislation by increasing fiscal
transparency in LCAPs (Fensterwald 2018). If educators and researchers are able to trace the way
districts direct funds to support EL students, we might be able to learn about effective efforts.
ACCOUNTABILITY
California recently changed its accountability system to align with the LCFF. Starting in 2013–14,
school districts needed to articulate how they plan to serve their students (especially those
generating supplemental and concentration grants), including how their plans accounted for the
state’s priority areas, and demonstrate how their spending supports their goals. Most research on
LCAPs has found that there is tremendous variation in the way districts document spending for EL
students and explaining how this spending might affect outcomes.
At the state level, the CDE currently reports on five indicators of school and district performance:
high school graduation rates, college and career readiness, suspension rates, academic
performance (Smarter Balanced results), and English Learner progress, a new measure. Each
indicator combines status (level) and change, sorting them into five color-coded performance
categories. Districts (and eventually schools) that are low performing across multiple student groups
or multiple indicators are identified as in need of assistance.
English Learners are covered by each of the indicators. The
graduation and college and career readiness indicators
include students who were ELs at any point in high school,
and reclassified EL students remain in the EL group for four
years after reclassification—this is a federal requirement that
will help the state evaluate both progress and status. The new
indicator of EL progress measures performance on the test of
English proficiency (currently the CELDT) and reclassification;
it awards extra credit for progress with long-term EL
students. In addition, CDE now reports annual Smarter
Balanced results for ELs, reclassified students, and ever-EL
students separately.
However, these accountability measures do not follow individual students over time. The change
measure compares, for example, grade 3 ELs to grade 4 ELs one year later, but there are changes
in the students enrolled over time. Tracking individual student growth would make it easier for
17
18
19
20
21
22
23
9
educators to evaluate which instruction programs and resources are most effective in helping
English Learners succeed.
The dashboard and standardized testing reporting changes are helping the public monitor
academic outcomes for English Learners. However, the state could consider at least two additional
changes:
1. Reporting progress separately for long-term ELs.
2. Adding an academic indicator for reclassified students.
An even more effective change would be to provide information on individual students’ scores over
time; this would allow growth measures to track the progress of ever-EL students. The CDE should
analyze its data this way and make it readily available to researchers and policymakers (Warren and
Hough 2013; Warren forthcoming).
ConclusionRecent reforms to California’s K–12 education system aim to elevate overall student performance
while narrowing the achievement gap for high-need students. Improving educational outcomes for
current and former English Learner students, who make up 38 percent of the student population, is
a key goal. The heightened focus on English Learners is evident in the funding formula changes, the
new EL Roadmap, new English language development standards, and an emphasis on measuring
EL outcomes in state and federal accountability measures.
Ensuring that these new policies improve outcomes will require sustained effort as well as policy
refinements. Specifically, three areas need attention. California needs to refine its reclassification
policies so that they are consistent across districts, take advantage of the new alignment between
English language development standards and the Common Core standards by making the ELPAC
the primary reclassification tool, and consider creating different reclassification criteria for high
school and elementary school ELs.
The state also needs to ensure the LCFF supplemental and concentration grant funds are reaching
EL students. The governor’s most recent budget proposal suggests new openness to improving
transparency in district spending.
Finally, the state should further highlight the performance of EL students in its accountability
measures by incorporating measures that follow individual students over time, giving researchers
access to CDE’s student-level database, and linking this database to the state’s higher education
data.
10
NOTES
1. All families of entering students fill out the Home Language Survey. For most students, this happens in kindergarten;students transferring within California school districts should not be assessed again. Students who speak a languageother than English at home take the CELDT. Recent research has found mixed results regarding the benefit of ELdesignation on later educational outcomes, at least for students who almost scored high enough to avoid the ELdesignation on the CELDT (Umansky 2016 and Shin 2017).
2. There are multiple instructional models for English Learners, including Structured English Immersion, EnglishLanguage Mainstream, and bilingual instruction. EL students may also be in sheltered core subject courses. Forexample, they may take math with other EL students and get additional support in math from aides or teachers toensure the EL students understand the material being presented to all the students in the class.
3. Proficiency is measured in reading, writing, speaking, and listening. Basic skills are typically assessed using district orstatewide standardized tests of ELA. In addition, students must meet district-set teacher evaluation thresholds, whichcan include grades in ELA classes, providing a portfolio of work, or simply having a teacher indicate that a student isready for reclassification. Parent consultations are also required.
4. This roadmap is still being rolled out to educators and the public.
5. Since Proposition 58 became law on July 1, 2017, parents no longer need to submit waivers so their children can optout of English-immersion instruction. Instead, parents can request alternative forms of instruction, and if more than 20parents in a grade or 30 parents in a school do so, the school is obligated to explore the possibility of providing theinstruction. (Hopkinson 2017, Californians Together 2016).
6. Fourteen percent of surveyed school districts reported that they did not have enough bilingual teachers prior to anyexpansion in bilingual course offerings that may occur (Learning Policy Institute 2016).
7. US data from 2015 ACS data tabulated by Migration Policy Institute, cited in Corey Mitchell, “Majority of English-Learner Students are Born in the United States, Analysis Finds,” EdWeek Blog, Dec 7, 2016.
8. Among EL students tested with the Smarter Balanced Assessment in the 2016–17 school year, CDE Dataquest.
9. After excluding schools with fewer than 30 students in total.
10. Parrish el al. (2006) found that, on average, ELs in California have 40 percent chance of reclassification within 10years.
11. To be classified as a long-term EL, a student must remain at the same proficiency level for two years and score belowa certain threshold on an ELA basic skills test. To be “at risk,” a student must score below a certain level on theEnglish language proficiency test as well as below a certain level on the ELA basic skills test.
12. ESSA, the Federal education law requires alignment between English language development and ELA standards.
13. The old assessment, the California English Language Development Test (CELDT) is being replaced by the ELPAC.
14. In practice, most districts relied heavily on the CST and CELDT. Teacher recommendations range from requiringparticular course marks in English courses to sending teachers a list of students to be reclassified so that anyobjections could be raised. Most districts treated parent consultation as a notification process rather thanconsultation. See Hill, Weston, and Hayes (2014).
15. In our 2014 survey of school districts, we found that fewer than 10 percent of school districts used the minimumrecommendations of the State Board of Education, choosing instead to exceed them (Hill, Weston, and Hayes),resulting in diversity in the definition of an EL student across school districts.
16. See, for example, an April 2017 letter from several researchers to California policymakers.
17. Governor Jerry Brown’s most recent budget proposal indicates that the formula will be fully funded in 2018-19, with anaddition of $3 billion (Governor’s Budget Summary 2018-19, January 10, 2018).
18. However, Johnson and Tanner (2018) found that districts with larger increases in per pupil school funding andincreased flexibility in spending saw improved graduation rates.
19. See Aramas, Lavadenz, and Olsen (2015) and Education Trust West (2017) for examples. Recently, Humphrey et al(2018) highlight three districts with strong LCAPs when it came to resource allocation, stakeholder engagement, andcommon core implementation, and they argue did in part because of their intentional and increased parental andcommunity engagement.
20. Other indicators will be added soon. Parent engagement and local indicators are also part of the accountabilityframework. See most recent dashboard information.
21. Although a district or school with red and orange for their ELA and math indicators would also be identified forassistance. See California School Dashboard, Technical Assistance Guide 2017-2018 School Year.
22. There is one exception: ELs who have been in the United States for less than a year are excluded from the academicindicator.
23. See California School Dashboard, Technical Assistance Guide 2017-2018 School Year.
11

REFERENCES
Aramas, Elvira, Magaly Lavadenz, and Laurie Olson. 2015. Falling Short on the Promise to English Learners: A Reporton Year One LCAPs. Californians Together.
Callahan, Rebecca. 2005. “Tracking and high school English learners: Limiting opportunity to learn,” AmericanEducational Research Journal, 42(2) 305-328.
California Department of Education. 2014. Academic Criterion for Reclassification.
California Department of Education. 2015. Academic Criterion for Reclassification.
California Department of Education. 2017a. California School Dashboard, Technical Assistance Guide 2017-2018School Year.
California Department of Education. 2017b. EL Roadmap Policy.
California Department of Education. 2017c. Reclassification Guidance for 2017–18.
Californians Together. 2016. Victory for Proposition 58 Guarantees that Parents and Educators Can Choose the BestLanguage Education Program for Students in California, Press Release, November 9.
Carver-Thomas, Desiree, and Linda Darling-Hammond. 2017. “Bilingual Teacher Shortages in California: A ProblemLikely to Grow.” Learning Policy Institute, February 8.
Cuellar Mejia, Marisol, Olga Rodriguez, and Hans Johnson. 2016. Preparing Students for Success in California’sCommunity Colleges. Public Policy Institute of California.
Education Trust West. 2017. The Steep Road to Resource Equity in California Education: The Local Control FundingFormula after Three Years.
English Learner Policy. 2017. Letter to legislators and other policymakers. Accessed January 17, 2018.
Fensterwald, John. 2018. “Governor Brown Proposes Ambitious Education Agenda in his Final Sate Budget.”EdSource. January 9.
Hill, Laura, J. Betts, B. Chavez, A.C. Zau, K. Volz Bachofer. 2014. Pathways to Fluency: Examining the Link betweenLanguage Reclassification Policies and Student Success. Public Policy Institute of California.
Hill, Laura E., Margaret Weston, and Joseph Hayes. 2014. Reclassification of English Learner Students in California.Public Policy Institute of California.
Hopkins, Megan, Karen D. Thompson, Robert Linquanti, Kenji Hakuta, Diane August. 2013. “Fully Accounting forEnglish Learner Performance: A Key Issue in ESEA Reauthorization.” Educational Researcher. Vol 42, Issue 2.
Hopkinson, Ashley. 2017. “A New Era for Bilingual Education: Explaining California’s Prop 58.” EdSource, January 6.
Humphrey, Daniel, J. Koppich, M. Lavadenz, J. Marsh, J. O’Day, D. Plank, l Stokes, M. Hall. 2018. How StakeholderEngagement Fuels Improvement efforts in Three California School Districts. Local Control Funding Formula researchCollaborative.
Johnson, Rucker C., and Sean Tanner. 2018. Money and Freedom: The Impact of California’s School Finance Reform.The Learning Policy Institute.
Jones, Carolyn. 2017. “School Districts Step Up Protections for Immigrant Students.” EdSource, February 5.
Legislative Analyst’s Office. 2016. Proposition 58. English Language Education (SB 1174, Chapter 753, Statuses of2014).
Mitchell, Corey. 2016. “Majority of English-Learner Students are Born in the United States, Analysis Finds,” EdWeekBlog, Dec 7,
National Academy of Sciences. 2017. Promoting the Educational Success of Children and Youth Learning English:Promising Futures. A Consensus Study Report of the National Academies Press.
Olsen, Laurie. 2010. Reparable Harm: Fulfilling the Unkept Promise of Educational Opportunity for California’s LongTerm English Learners. Californians Together.
Parrish, T. B. 2001. Effects of the Implementation of Proposition 227 on the Education of English Leaners K12: Year 1Report. American Institutes for Research.
Parrish, T. B., A. Merickel, M. Perez, R. Linquanti, M. Socias, A. Spain. 2006. Effects of the Implementation ofProposition 227 on the Education of English Leaners K12: Findings from a Five-Year Evaluation. Final report for AB 56and AB 1116 submitted to the California Department of Education. American Institutes for Research.
Passel, Jeffery, and D’Vera Cohn. 2016. Children of Unauthorized Immigrants Represent Rising Share of K–12Students. Pew Research Center.
12
Pompa, D., and K. Hakuta. 2012. “Opportunities for Policy Advancement for ELs Created by the New StandardsMovement.” Stanford Graduate School of Education, Stanford University.
Nami Shin. 2017. “The Effects of the Initial English Language Learner Classification on Students’ Later AcademicOutcomes.” Educational Evaluation and Policy Analysis, November 3.
Thompson, Karen. 2017. “English Learner’s Time to Reclassification: An Analysis.” Educational Policy, 31 (3).
Umansky, Ilana M. 2016. “To Be or Not to Be EL: An Examination of the Impact of Classifying Students as EnglishLearners.” Educational Evaluation and Policy Analysis 38 (4): 714–37.
Umansky, Ilana M., and Sean F. Reardon. 2014. “Reclassification Patterns among Latino English Learner Students inBilingual, Dual Immersion, and English Immersion Classrooms.” American Educational Research Journal 51 (5): 879–912.
Umansky, Ilana M., Sean Reardon, Kenji Hakuta, Karen D. Thompson, Peggy Estrada, Katherine Hayes, HildaMaldonado, Susan Tandberg, Claude Goldenberg. 2015. Improving the Opportunities and Outcomes of California’sStudents Learning English: Findings from School District-University Collaborative Partnerships. PACE.
Warren, Paul. 2004. A Look at the Progress of English Learner Students. Legislative Analyst’s Office.
Warren, Paul, and Heather Hough. 2013. Increasing the Usefulness of California’s Education Data. Public PolicyInstitute of California.
Warren, Paul, and Patrick Murphy. 2014. California’s Transition to the Common Core State Standards: The State’sRole in Local Capacity Building. Public Policy Institute of California.
ABOUT THE AUTHOR
Laura Hill is a senior fellow at the Public Policy Institute of California. Her areas of expertise are K–12 education andimmigration. She is currently researching English Learners in California schools, special education, and ESL students incommunity colleges. Her recent publications examine student achievement on the state’s K–12 assessments and the linkbetween language reclassification policies and student success. Prior to joining PPIC, she was a research associate at theSPHERE Institute and a National Institute of Aging postdoctoral fellow. She holds a PhD in demography and an MA ineconomics from the University of California, Berkeley.
ACKNOWLEDGMENTS
Many thanks to Eric McGhee, Paul Warren, Carrie Hahnel, Megan Hopkins, Lynette Ubois, and Mary Severance for theirthoughtful reviews, and to Kate Reber and Jenny Miyasaki for editorial support. Any errors are my own.
13
© 2018 Public Policy Institute of California
The Public Policy Institute of California is dedicated to informing and improving public policy in Californiathrough independent, objective, nonpartisan research. PPIC is a public charity. It does not take orsupport positions on any ballot measure or on any local, state, or federal legislation, nor does it endorse,support, or oppose any political parties or candidates for public office.
Short sections of text, not to exceed three paragraphs, may be quoted without written permissionprovided that full attribution is given to the source.
Research publications reflect the views of the authors and do not necessarily reflect the views of ourfunders or of the staff, officers, advisory councils, or board of directors of the Public Policy Institute ofCalifornia.
PUBLIC POLICY INSTITUTE OF CALIFORNIA500 Washington Street, Suite 600 San Francisco, CA 94111 T 415 291 4400 F 415 291 4401
PPIC SACRAMENTO CENTERSenator Office Building 1121 L Street, Suite 801 Sacramento, CA 95814 T 916 440 1120 F 916 440 1121
ppic.org