k–12 mathematics · ospi k-12 mathematics computational fluency supplemental program review final...
TRANSCRIPT

W A S H I N G T O N S T A T E P r o g r a m R e v i e w R e p o r t
K–12
Mathematics Computational Fluency Supplemental Programs June 2007
Washington State Office of Superintendent of Public Instruction

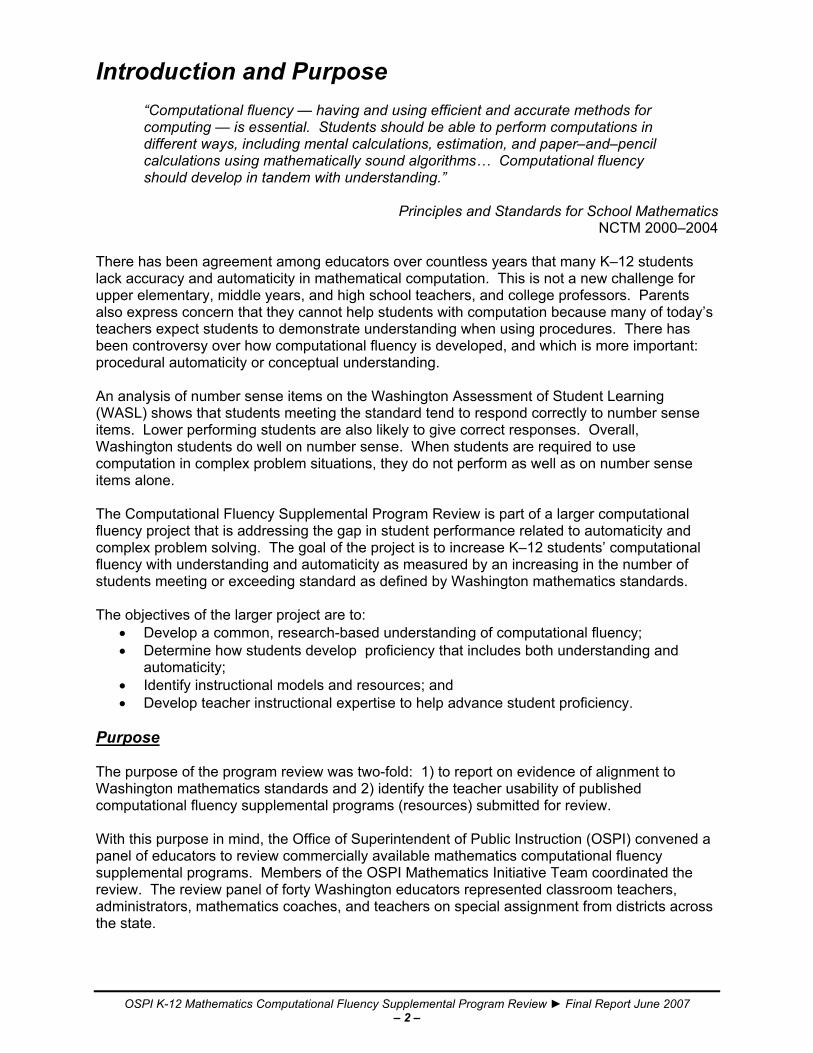
Table of Contents Introduction and Purpose .......................................................................................................................... 2
Mathematics Teaching and Learning ........................................................................................................ 4
Scope of the Review ................................................................................................................................... 5
Programs Reviewed .................................................................................................................................... 7
Overview of Review Process ..................................................................................................................... 9
A full description of each of the two parts of the review process follows. Part 1: Grade Level Review ....................................................................................................... 9
Part 1: Grade Level Review ..................................................................................................................... 11
Part 1: Grade Level Review Results ....................................................................................................... 17
General Findings .............................................................................................................................. 17
Results for All Programs by Grades ................................................................................................. 19
Results by Grade Spans and Programs ........................................................................................... 21
Results by Programs and Grades..................................................................................................... 29
Part 2: Program Feature Review ............................................................................................................. 71
Part 2: Program Feature Review Results by Category .......................................................................... 72
Appendix A: Resources ........................................................................................................................... 77
Appendix B: Publisher Notice ................................................................................................................ 79
Appendix C: Reviewer Training Resources .......................................................................................... 85
Appendix C: Reviewer Training Resources ........................................................................................ 104
Appendix D: Program Review Document – EXAMPLE* ..................................................................... 106
Appendix E: Data Analysis Approach .................................................................................................. 118
Grade 3, Program A ................................................................................................................... 120
Grade 5, Program B ................................................................................................................... 121
Grade 9/10, Program D ............................................................................................................. 123
Grade 11/12, Program E ........................................................................................................... 124
Grade 11/12, Program F ............................................................................................................ 125
Acknowledgments .................................................................................................................................. 126
*Full documents may be downloaded at http://www.k12.wa.us/CurriculumInstruct/Mathematics/default.aspx.

OSPI K-12 Mathematics Computational Fluency Supplemental Program Review ► Final Report June 2007 – 2 –
Introduction and Purpose
“Computational fluency — having and using efficient and accurate methods for computing — is essential. Students should be able to perform computations in different ways, including mental calculations, estimation, and paper–and–pencil calculations using mathematically sound algorithms… Computational fluency should develop in tandem with understanding.”
Principles and Standards for School Mathematics NCTM 2000–2004
There has been agreement among educators over countless years that many K–12 students lack accuracy and automaticity in mathematical computation. This is not a new challenge for upper elementary, middle years, and high school teachers, and college professors. Parents also express concern that they cannot help students with computation because many of today’s teachers expect students to demonstrate understanding when using procedures. There has been controversy over how computational fluency is developed, and which is more important: procedural automaticity or conceptual understanding. An analysis of number sense items on the Washington Assessment of Student Learning (WASL) shows that students meeting the standard tend to respond correctly to number sense items. Lower performing students are also likely to give correct responses. Overall, Washington students do well on number sense. When students are required to use computation in complex problem situations, they do not perform as well as on number sense items alone. The Computational Fluency Supplemental Program Review is part of a larger computational fluency project that is addressing the gap in student performance related to automaticity and complex problem solving. The goal of the project is to increase K–12 students’ computational fluency with understanding and automaticity as measured by an increasing in the number of students meeting or exceeding standard as defined by Washington mathematics standards. The objectives of the larger project are to:
• Develop a common, research-based understanding of computational fluency; • Determine how students develop proficiency that includes both understanding and
automaticity; • Identify instructional models and resources; and • Develop teacher instructional expertise to help advance student proficiency.
Purpose The purpose of the program review was two-fold: 1) to report on evidence of alignment to Washington mathematics standards and 2) identify the teacher usability of published computational fluency supplemental programs (resources) submitted for review. With this purpose in mind, the Office of Superintendent of Public Instruction (OSPI) convened a panel of educators to review commercially available mathematics computational fluency supplemental programs. Members of the OSPI Mathematics Initiative Team coordinated the review. The review panel of forty Washington educators represented classroom teachers, administrators, mathematics coaches, and teachers on special assignment from districts across the state.
OSPI K-12 Mathematics Computational Fluency Supplemental Program Review ► Final Report June 2007 – 3 –
This report provides alignment information about the computational fluency supplemental programs submitted for review. The intent of this report is not to endorse specific commercially published programs or materials. Districts should further investigate programs and take into consideration the needs of their students, resources available, and professional development required to implement a program with fidelity. An additional resource available on the OSPI Web site is Using Response to Intervention (RTI) for Washington’s Students. Periodically updated reviews of current research as to the efficacy of mathematics programs can be located at What Works Clearinghouse, U.S. Department of Education; Metiri Group, Technology Solutions That Work; and The Best Evidence Encyclopedia, Johns Hopkins University. (See Appendix A)
OSPI K-12 Mathematics Computational Fluency Supplemental Program Review ► Final Report June 2007 – 4 –
Mathematics Teaching and Learning OSPI subscribes to a philosophy of teaching and learning mathematics in which:
Mathematics is a language and science of patterns. Mathematical content (Essential Academic Learning Requirements - EALR 1: NS, ME,
GS, PS, AS) must be embedded in the mathematical processes (EALRs 2–5: SP, RL, CU, MC).
For all students to learn significant mathematics, content must be taught and assessed
in meaningful situations. Connecting Content and Process in a Meaningful Context
“The relationship between content and process in mathematics is critical in developing mathematically proficient students. The combination of content and process gives students mathematical power. Teachers need to use instructional practices that provide opportunities for students to practice and demonstrate proficiency in both content and process on a regular basis. All process requires mathematical content. Lessons designed by the teacher must have content at or below grade level. A student cannot reason without something to reason about.”
Washington Mathematics Grade Level Expectations (GLEs), 2006
OSPI K-12 Mathematics Computational Fluency Supplemental Program Review ► Final Report June 2007 – 5 –
Scope of the Review A Publisher Notice was posted on the OSPI Web site inviting publishers to submit K–12 computational fluency supplemental programs for review during the week of March 26–30, 2007. Publishers submitted Intent to Submit forms that indicated which programs would be submitted for the review. Upon confirmation of inclusion in the review, publishers completed the Program Information Document and Computational Fluency Matrix for each program submitted. Both text-based and/or computer-based programs were included in the review. (See Appendix B) Washington educators were invited to apply to participate in the review. The goal was to have enough reviewers to complete four “reads” for each grade level for each program. The review week schedule was intensive, with many reviewers staying later or arriving earlier than the scheduled times.
Monday 8 a.m.–5 p.m. Training/Review Tuesday 8 a.m.–5 p.m. Review Wednesday 8 a.m.–5 p.m. Review Thursday 8 a.m.–5 p.m. Review Friday 8 a.m.–3:30 p.m. Review
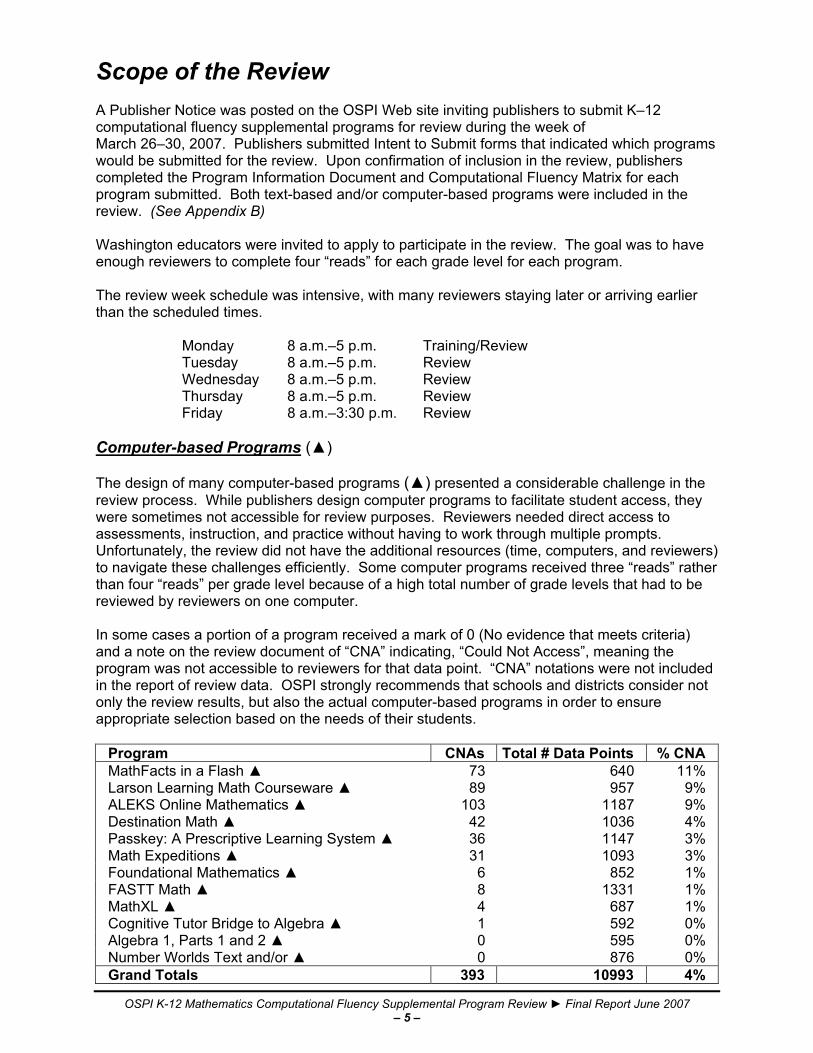
Computer-based Programs (▲) The design of many computer-based programs (▲) presented a considerable challenge in the review process. While publishers design computer programs to facilitate student access, they were sometimes not accessible for review purposes. Reviewers needed direct access to assessments, instruction, and practice without having to work through multiple prompts. Unfortunately, the review did not have the additional resources (time, computers, and reviewers) to navigate these challenges efficiently. Some computer programs received three “reads” rather than four “reads” per grade level because of a high total number of grade levels that had to be reviewed by reviewers on one computer. In some cases a portion of a program received a mark of 0 (No evidence that meets criteria) and a note on the review document of “CNA” indicating, “Could Not Access”, meaning the program was not accessible to reviewers for that data point. “CNA” notations were not included in the report of review data. OSPI strongly recommends that schools and districts consider not only the review results, but also the actual computer-based programs in order to ensure appropriate selection based on the needs of their students.
Program CNAs Total # Data Points % CNA MathFacts in a Flash ▲ 73 640 11% Larson Learning Math Courseware ▲ 89 957 9% ALEKS Online Mathematics ▲ 103 1187 9% Destination Math ▲ 42 1036 4% Passkey: A Prescriptive Learning System ▲ 36 1147 3% Math Expeditions ▲ 31 1093 3% Foundational Mathematics ▲ 6 852 1% FASTT Math ▲ 8 1331 1% MathXL ▲ 4 687 1% Cognitive Tutor Bridge to Algebra ▲ 1 592 0% Algebra 1, Parts 1 and 2 ▲ 0 595 0% Number Worlds Text and/or ▲ 0 876 0% Grand Totals 393 10993 4%

OSPI K-12 Mathematics Computational Fluency Supplemental Program Review ► Final Report June 2007 – 6 –
Grade Level Review During the course of the review, it became apparent that some programs submitted might address GLEs at grades other than those indicated by the publisher. While students struggling with computational fluency likely need to begin below grade level, instruction still needs to accelerate students to grade level standards. It was not in the scope of this review to determine to which grade level the program best aligned. Reviewers reviewed programs at the grade level(s) indicated by publishers. Instruction and Practice or Practice-Only Programs While publishers did not indicate whether the computational fluency programs submitted were for the purpose of instruction and practice or solely for additional practice of particular concepts or procedures, the K–12 Mathematics Computational Fluency Supplemental Program Review Panel reviewed both types of programs. OSPI strongly recommends that schools and districts consider not only the review results, but also the actual programs in order to ensure appropriate selection based on the needs of their students that may not be sufficiently addressed by their core/comprehensive program and therefore needs supplementation (e.g., assessment, instruction, and/or practice). Professional Development and Implementation Support Programs vary in terms of the amount and intensity of the professional development needed to use the program with fidelity. Some programs require little or no training to implement while others require more training with ongoing support. It was not in the scope of this review to determine the professional development and support needed to implement and use programs with fidelity. Districts should investigate programs to determine the professional development required to implement a program efficaciously.
OSPI K-12 Mathematics Computational Fluency Supplemental Program Review ► Final Report June 2007 – 7 –
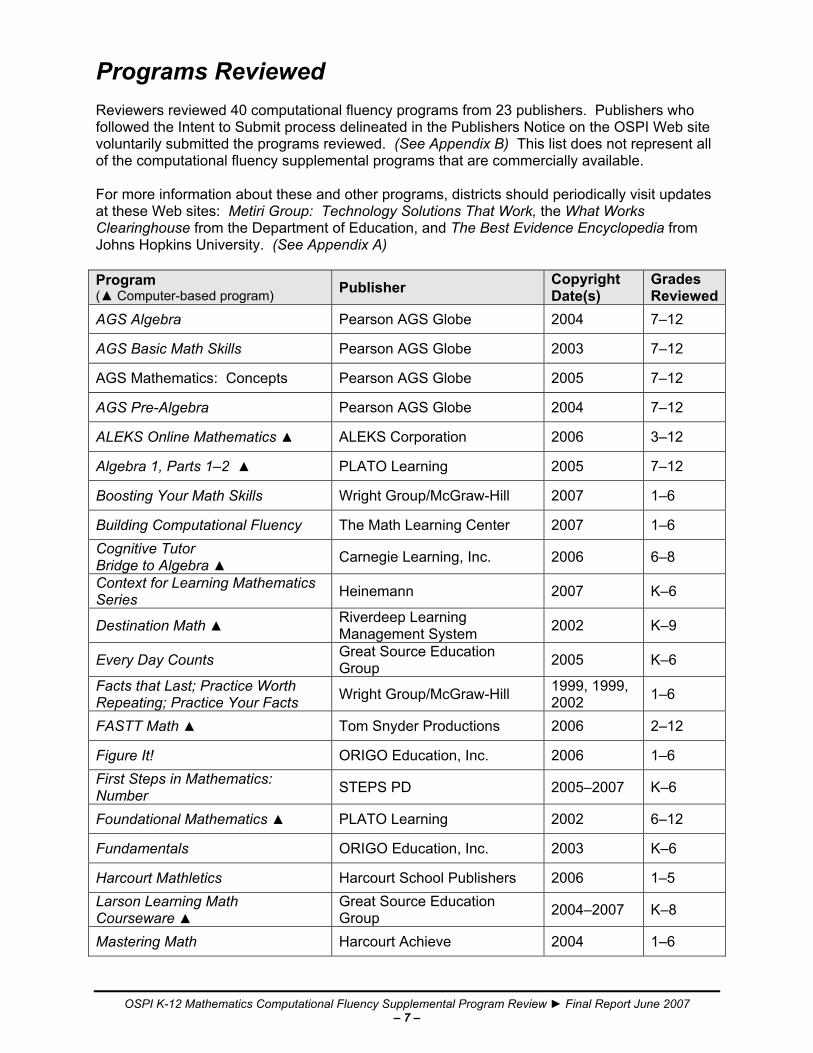
Programs Reviewed Reviewers reviewed 40 computational fluency programs from 23 publishers. Publishers who followed the Intent to Submit process delineated in the Publishers Notice on the OSPI Web site voluntarily submitted the programs reviewed. (See Appendix B) This list does not represent all of the computational fluency supplemental programs that are commercially available. For more information about these and other programs, districts should periodically visit updates at these Web sites: Metiri Group: Technology Solutions That Work, the What Works Clearinghouse from the Department of Education, and The Best Evidence Encyclopedia from Johns Hopkins University. (See Appendix A) Program (▲ Computer-based program) Publisher Copyright
Date(s) Grades Reviewed
AGS Algebra Pearson AGS Globe 2004 7–12
AGS Basic Math Skills Pearson AGS Globe 2003 7–12
AGS Mathematics: Concepts Pearson AGS Globe 2005 7–12
AGS Pre-Algebra Pearson AGS Globe 2004 7–12
ALEKS Online Mathematics ▲ ALEKS Corporation 2006 3–12
Algebra 1, Parts 1–2 ▲ PLATO Learning 2005 7–12
Boosting Your Math Skills Wright Group/McGraw-Hill 2007 1–6
Building Computational Fluency The Math Learning Center 2007 1–6 Cognitive Tutor Bridge to Algebra ▲ Carnegie Learning, Inc. 2006 6–8
Context for Learning Mathematics Series Heinemann 2007 K–6
Destination Math ▲ Riverdeep Learning Management System 2002 K–9
Every Day Counts Great Source Education Group 2005 K–6
Facts that Last; Practice Worth Repeating; Practice Your Facts Wright Group/McGraw-Hill 1999, 1999,
2002 1–6
FASTT Math ▲ Tom Snyder Productions 2006 2–12
Figure It! ORIGO Education, Inc. 2006 1–6 First Steps in Mathematics: Number STEPS PD 2005–2007 K–6
Foundational Mathematics ▲ PLATO Learning 2002 6–12
Fundamentals ORIGO Education, Inc. 2003 K–6
Harcourt Mathletics Harcourt School Publishers 2006 1–5 Larson Learning Math Courseware ▲
Great Source Education Group 2004–2007 K–8
Mastering Math Harcourt Achieve 2004 1–6

OSPI K-12 Mathematics Computational Fluency Supplemental Program Review ► Final Report June 2007 – 8 –
Program (▲ Computer-based program) Publisher Copyright
Date(s) Grades Reviewed
Math Around the Clock Pearson Scott-Foresman 2003 1–6
Math Expeditions ▲ PLATO Learning 2000 K–8
Math Skill Builder Pearson Prentice Hall 2007 6–8
Mathematics Navigator America’s Choice 2006 2–10
Mathementals ORIGO Education, Inc. 2003 1–6
MathFacts in a Flash ▲ Renaissance Learning, Inc. 2006 1–5
MathSteps Houghton Mifflin Company 1999 K–7
MathXL ▲ Pearson Prentice Hall 2004 6–12
Nimble with Numbers Modern Curriculum Press 2002 1–6
Number Corner The Math Learning Center 2007 K–5
Number Worlds Text and/or ▲ SRA/McGraw-Hill 2007 K–6 ORIGOmath: A Step by Step Approach to Computation ORIGO Education, Inc. 2007 1
Passkey: A Prescriptive Learning System ▲
Glencoe/McGraw-Hill Technology Group 2004 2–12
Skills Intervention Kit Pearson Prentice Hall 2005 6–9
The Book of Facts ORIGO Education, Inc. 2007 1–5
The Box of Facts ORIGO Education, Inc. 2007 1–6
The Think Tank ORIGO Education, Inc. 2005 2–6
Top Line Math Harcourt Achieve 2006 8–12
Working with Numbers Harcourt Achieve 2004 1–6
OSPI K-12 Mathematics Computational Fluency Supplemental Program Review ► Final Report June 2007 – 9 –
Overview of Review Process Prior to the review, all submitted programs were pre-screened based on the Program Information Document to confirm they were supplemental computational fluency, and not core/comprehensive mathematics, programs. No programs submitted were excluded before the review. During the K–12 Mathematics Computational Fluency Supplemental Program Review, the reviewers followed a two-part program review process. Reviewers participated in training, completed their reviews independently, and refrained from sharing information, ratings, and comments with other reviewers. A minimum of four1 reviewers conducted the two parts of the review for each program and grade level. (See Appendix C)
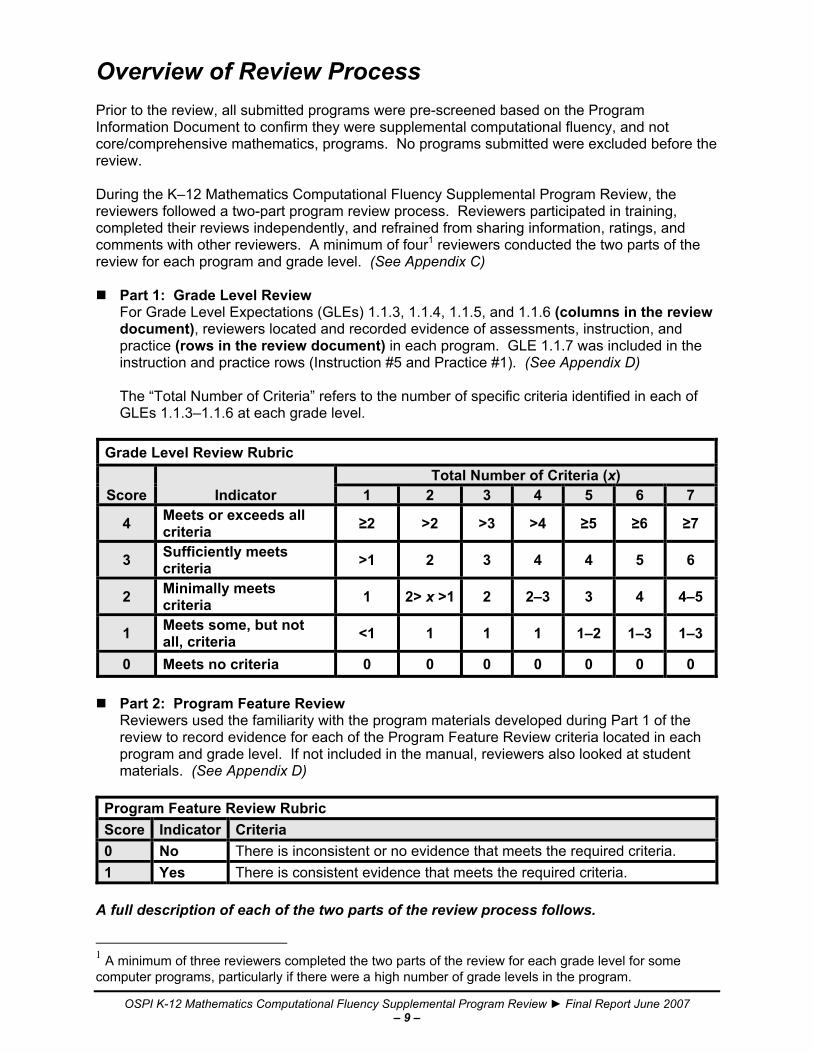
Part 1: Grade Level Review For Grade Level Expectations (GLEs) 1.1.3, 1.1.4, 1.1.5, and 1.1.6 (columns in the review document), reviewers located and recorded evidence of assessments, instruction, and practice (rows in the review document) in each program. GLE 1.1.7 was included in the instruction and practice rows (Instruction #5 and Practice #1). (See Appendix D) The “Total Number of Criteria” refers to the number of specific criteria identified in each of GLEs 1.1.3–1.1.6 at each grade level.
Grade Level Review Rubric
Score Indicator Total Number of Criteria (x)
1 2 3 4 5 6 7
4 Meets or exceeds all criteria ≥2 >2 >3 >4 ≥5 ≥6 ≥7
3 Sufficiently meets criteria >1 2 3 4 4 5 6
2 Minimally meets criteria 1 2> x >1 2 2–3 3 4 4–5
1 Meets some, but not all, criteria <1 1 1 1 1–2 1–3 1–3
0 Meets no criteria 0 0 0 0 0 0 0
Part 2: Program Feature Review Reviewers used the familiarity with the program materials developed during Part 1 of the review to record evidence for each of the Program Feature Review criteria located in each program and grade level. If not included in the manual, reviewers also looked at student materials. (See Appendix D)
Program Feature Review Rubric Score Indicator Criteria 0 No There is inconsistent or no evidence that meets the required criteria. 1 Yes There is consistent evidence that meets the required criteria.
A full description of each of the two parts of the review process follows.
1 A minimum of three reviewers completed the two parts of the review for each grade level for some computer programs, particularly if there were a high number of grade levels in the program.

OSPI K-12 Mathematics Computational Fluency Supplemental Program Review ► Final Report June 2007 – 10 –
OSPI K-12 Mathematics Computational Fluency Supplemental Program Review ► Final Report June 2007 – 11 –
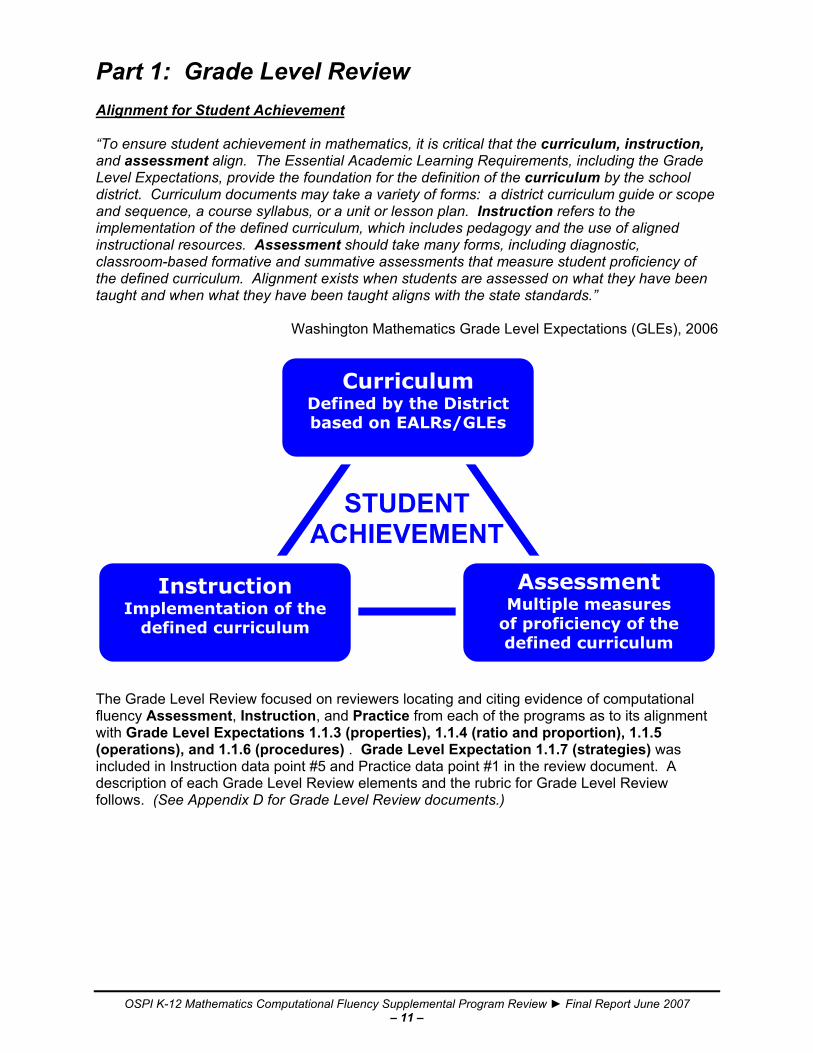
Part 1: Grade Level Review Alignment for Student Achievement “To ensure student achievement in mathematics, it is critical that the curriculum, instruction, and assessment align. The Essential Academic Learning Requirements, including the Grade Level Expectations, provide the foundation for the definition of the curriculum by the school district. Curriculum documents may take a variety of forms: a district curriculum guide or scope and sequence, a course syllabus, or a unit or lesson plan. Instruction refers to the implementation of the defined curriculum, which includes pedagogy and the use of aligned instructional resources. Assessment should take many forms, including diagnostic, classroom-based formative and summative assessments that measure student proficiency of the defined curriculum. Alignment exists when students are assessed on what they have been taught and when what they have been taught aligns with the state standards.”
Washington Mathematics Grade Level Expectations (GLEs), 2006
The Grade Level Review focused on reviewers locating and citing evidence of computational fluency Assessment, Instruction, and Practice from each of the programs as to its alignment with Grade Level Expectations 1.1.3 (properties), 1.1.4 (ratio and proportion), 1.1.5 (operations), and 1.1.6 (procedures) . Grade Level Expectation 1.1.7 (strategies) was included in Instruction data point #5 and Practice data point #1 in the review document. A description of each Grade Level Review elements and the rubric for Grade Level Review follows. (See Appendix D for Grade Level Review documents.)
Curriculum Defined by the District based on EALRs/GLEs
Instruction Implementation of the
defined curriculum
Assessment Multiple measures
of proficiency of the defined curriculum
STUDENT ACHIEVEMENT
OSPI K-12 Mathematics Computational Fluency Supplemental Program Review ► Final Report June 2007 – 12 –
Assessment Effective mathematics instruction utilizes different types of assessment for different purposes. Reviewers cited evidence of pre-assessment, formative assessment, and summative/post-assessment for each GLE specified at the grade level reviewed.
Pre-assessment is a process (test, task, or interview) used to establish a starting point prior to instruction by determining what the student already knows and is able to do. Pre-assessments used with post-assessments measure student learning for a specific period of instruction or time span.
Screening assessments identify both at-risk and at-grade-level students. Teachers
may use student work from the core/comprehensive mathematics program for this purpose.
Diagnostic Assessment identifies what a student knows, identifies the nature of a student’s misconceptions, and indicates the intervention/instruction needed to move the student to standard.
Formative Assessment is a process (test, task, or interview) used frequently to identify
conceptual and computational errors, to guide learner and teacher to corrective instruction/practice, and to adjust learning and instruction.
Progress Monitoring Assessments determine a student’s rate of progress toward
achieving proficiency on the EALRS/GLES, identify students who are not demonstrating adequate progress in daily lessons, and influence instructional decisions.
Summative Assessment, or post-assessment, is a process (test, task, or interview)
used at the end of a period of intervention/instruction, which includes all concepts taught over a given time, unit, and/or strand. They may be used to identify the cumulative understandings for each learner, to indicate strengths and weaknesses of program and instruction provided, and to provide a map of conceptual development and progress. Along with pre-assessments, summative assessments can be used to measure student learning resulting from of a period of intervention/instruction.
Outcome Assessments can serve as a screening at the beginning of the school year
as well as a measure of growth at the end of the year. Data may be used to identify students in terms of those who achieved grade level expectations, those who made progress, and those who did not.
Statewide achievement tests, such as the Washington Assessment of Student Learning (WASL), measure the level of proficiency that students have achieved based on the state standards (EALRs and the GLEs).
Reviewers sought and cited a minimum number of pieces of evidence for each GLE criterion, as applicable to each grade:
1. Pre/Diagnostic Assessment – at least 1 piece of evidence for each GLE criterion 2. Formative Assessment/Progress Monitoring – at least 2 pieces of evidence for each
GLE criterion 3. Summative Assessment – at least 1 piece of evidence for each GLE criterion

OSPI K-12 Mathematics Computational Fluency Supplemental Program Review ► Final Report June 2007 – 13 –
Instruction
“Learning mathematics involves learning ways of thinking. It involves learning powerful mathematical ideas…it also entails learning how to generate those ideas, how to express them using words and symbols, and how to justify to oneself and to others that those ideas are true.”
Thomas Carpenter, 2003 Focused instruction helps students whose mathematics achievement is significantly below current grade level standards and accelerates their learning to grade level standard. Reviewers followed each mathematics concept or procedure specified from the Grade Level Expectations through the program and cited a minimum number of pieces of evidence within the program for each GLE criterion as applicable to each grade for instruction that:
1. Develops conceptual understanding using multiple representations (e.g., symbolically, with a model, or a real-world situation) – at least 2 pieces of evidence for each GLE criterion
2. Makes connections explicit among representations – at least 2 pieces of evidence for each GLE criterion
3. Uses a variety of problem types (e.g. start, change, and result unknown; compare;
grouping, rate, price, multiplicative comparison; partitive and measurement division) (See Problem Types and Examples in Appendix B) – at least 2 pieces of evidence for each GLE criterion
4. Uses computation in a variety of problem situations (contexts) – at least 2 pieces of
evidence for each GLE criterion
5. Develops efficient, accurate strategies (See Children’s Strategies in Appendix B) – at least 2 pieces of evidence for each GLE criterion
6. Develops efficient, accurate procedures and algorithms – at least 2 pieces of
evidence for each GLE criterion

OSPI K-12 Mathematics Computational Fluency Supplemental Program Review ► Final Report June 2007 – 14 –
Practice
“…evidence clearly suggests that for most students, mastery and understanding come through, not after, meaningful interaction with ideas.”
Carol Ann Tomlinson and Jay McTighe Integrating Differentiated Instruction and Understanding by Design, 2006
Focused practice opportunities accelerate student learning and facilitate their acquisition of and proficiency with a new concept or procedure. Practice should provide multiple, varied opportunities scheduled over time to develop and strengthen proficiency. Practice should also integrate new learning with previous learning. Reviewers followed each mathematics concept or procedure specified from the Grade Level Expectations through the program and cited a minimum number of pieces of evidence within the program for each GLE criterion as applicable to each grade:
1. Use efficient, accurate strategies – at least 2 pieces of evidence for each GLE criterion
2. Use efficient, accurate procedures and algorithms – at least 2 pieces of evidence for
each GLE criterion 3. Solve a variety of problem types (e.g. start, change, and result unknown; compare;
partitive and measurement division) – at least 2 pieces of evidence for each GLE criterion
4. Solve problems in a variety of situations (contexts) – at least 2 pieces of evidence for
each GLE criterion
OSPI K-12 Mathematics Computational Fluency Supplemental Program Review ► Final Report June 2007 – 15 –
Grade Level Expectations Grade Level Expectations (GLEs) 1.1.3, 1.1.4, 1.1.5, 1.1.6, and 1.1.7 are all related to computational fluency and provided the grade level content foundation for the Grade Level Review.
Grade Level Expectations
EALR 1: The student understands and applies the concepts and procedures of mathematics. • GLE 1.1.3 (properties of operations) • GLE 1.1.4 (ratio and proportion) • GLE 1.1.5 (understanding of operations) • GLE 1.1.6 (computational procedures with specific operations and number sets) • GLE 1.1.7 (computational strategies)*
*Included in Instruction and Practice (rows) in the review document (See Appendix C for GLEs 1.1.3–1.1.7 for each grade level.)
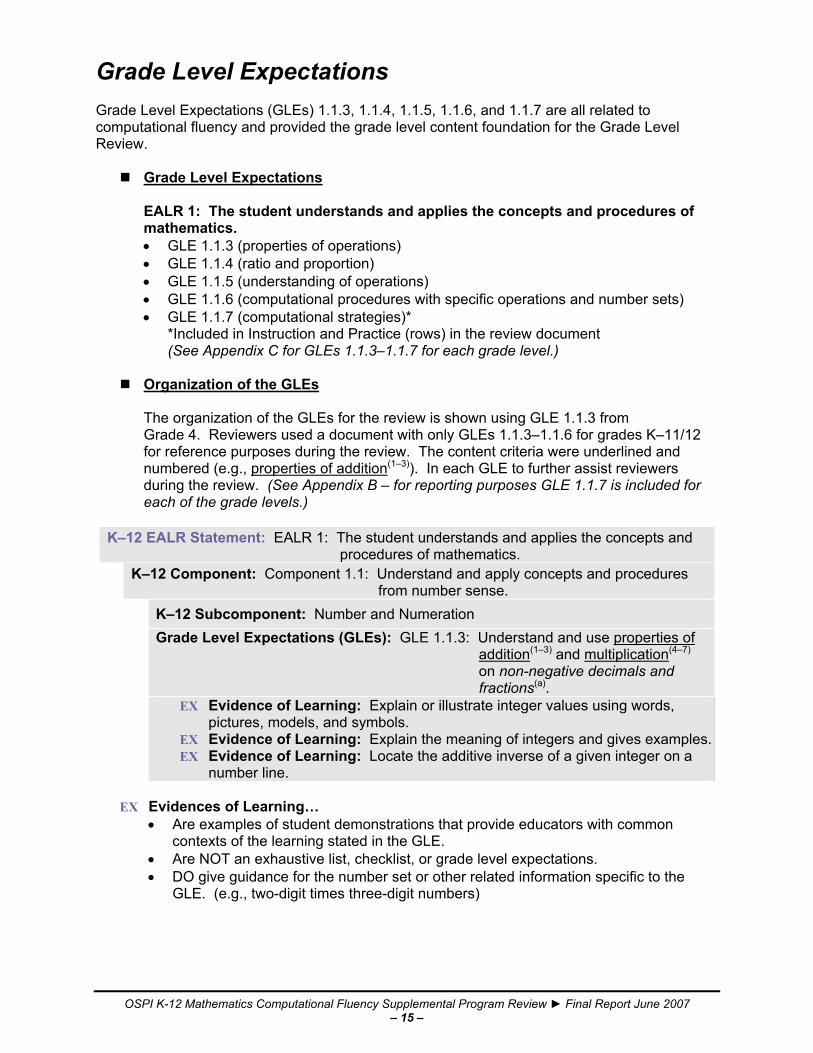
Organization of the GLEs
The organization of the GLEs for the review is shown using GLE 1.1.3 from Grade 4. Reviewers used a document with only GLEs 1.1.3–1.1.6 for grades K–11/12 for reference purposes during the review. The content criteria were underlined and numbered (e.g., properties of addition(1–3)). In each GLE to further assist reviewers during the review. (See Appendix B – for reporting purposes GLE 1.1.7 is included for each of the grade levels.)
K–12 EALR Statement: EALR 1: The student understands and applies the concepts and procedures of mathematics.
K–12 Component: Component 1.1: Understand and apply concepts and procedures from number sense.
K–12 Subcomponent: Number and Numeration
Grade Level Expectations (GLEs): GLE 1.1.3: Understand and use properties of
addition(1–3) and multiplication(4–7) on non-negative decimals and fractions(a).
EX Evidence of Learning: Explain or illustrate integer values using words, pictures, models, and symbols.
EX Evidence of Learning: Explain the meaning of integers and gives examples.EX Evidence of Learning: Locate the additive inverse of a given integer on a
number line.
EX Evidences of Learning… • Are examples of student demonstrations that provide educators with common
contexts of the learning stated in the GLE. • Are NOT an exhaustive list, checklist, or grade level expectations. • DO give guidance for the number set or other related information specific to the
GLE. (e.g., two-digit times three-digit numbers)

OSPI K-12 Mathematics Computational Fluency Supplemental Program Review ► Final Report June 2007 – 16 –

OSPI K-12 Mathematics Computational Fluency Supplemental Program Review ► Final Report June 2007 – 17 –
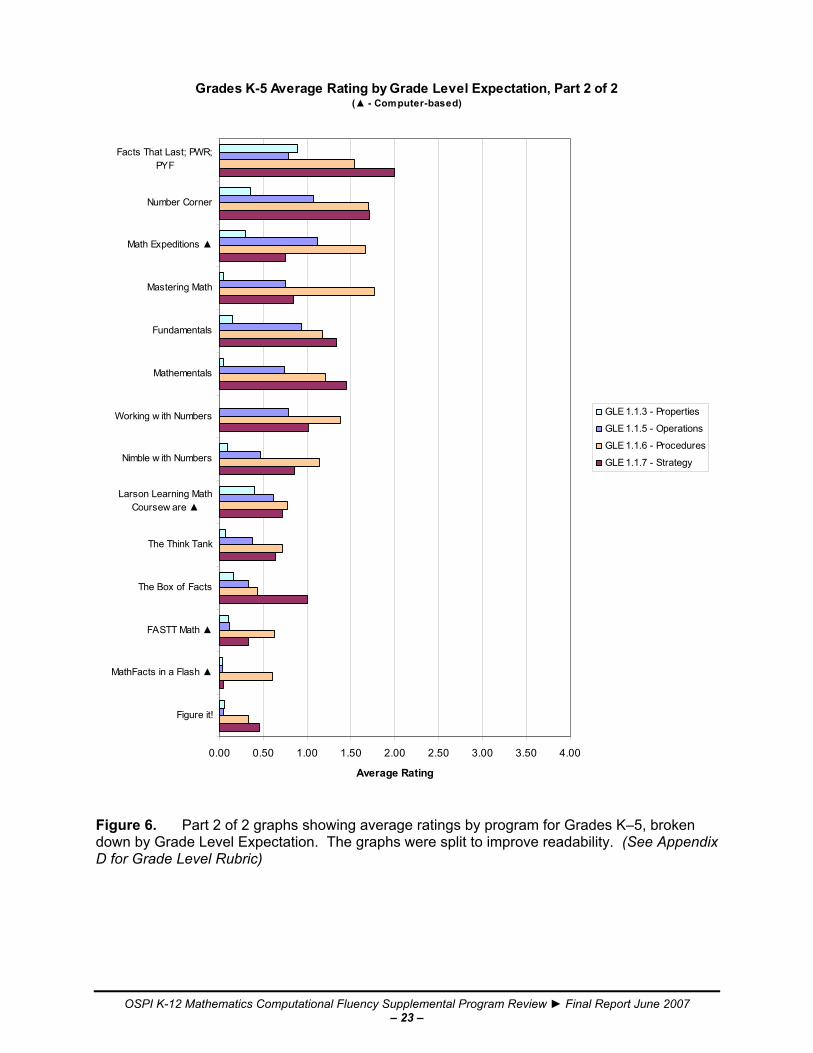
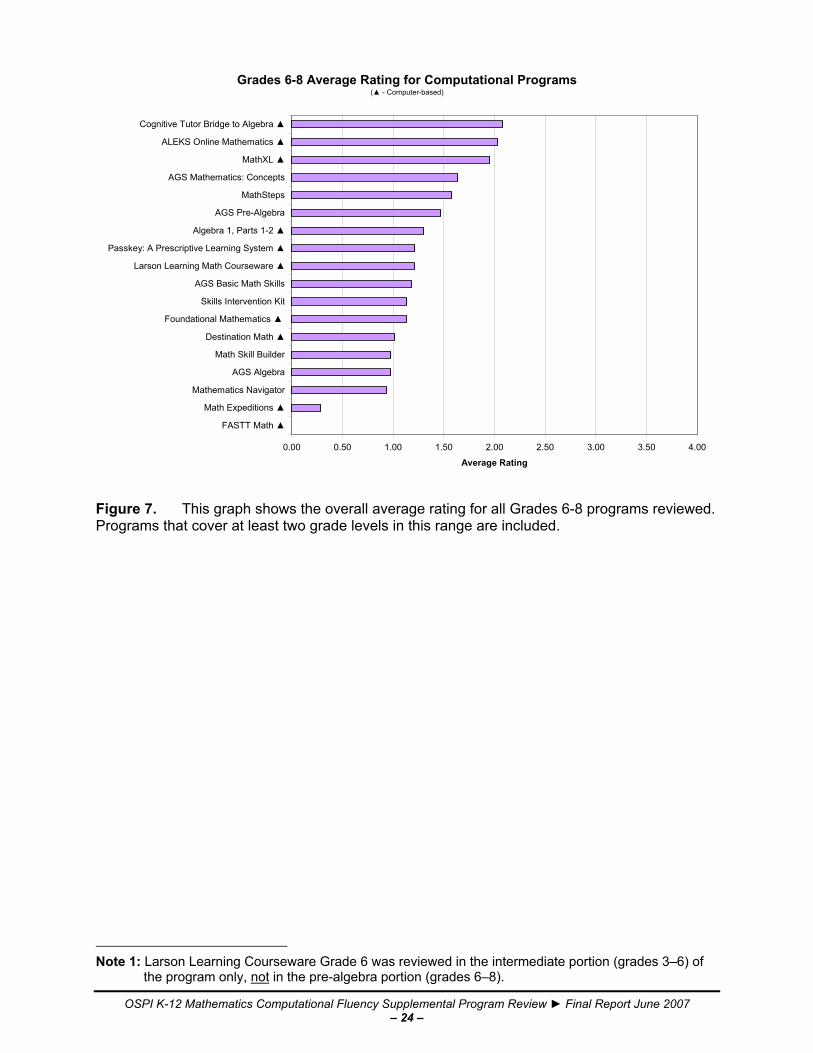
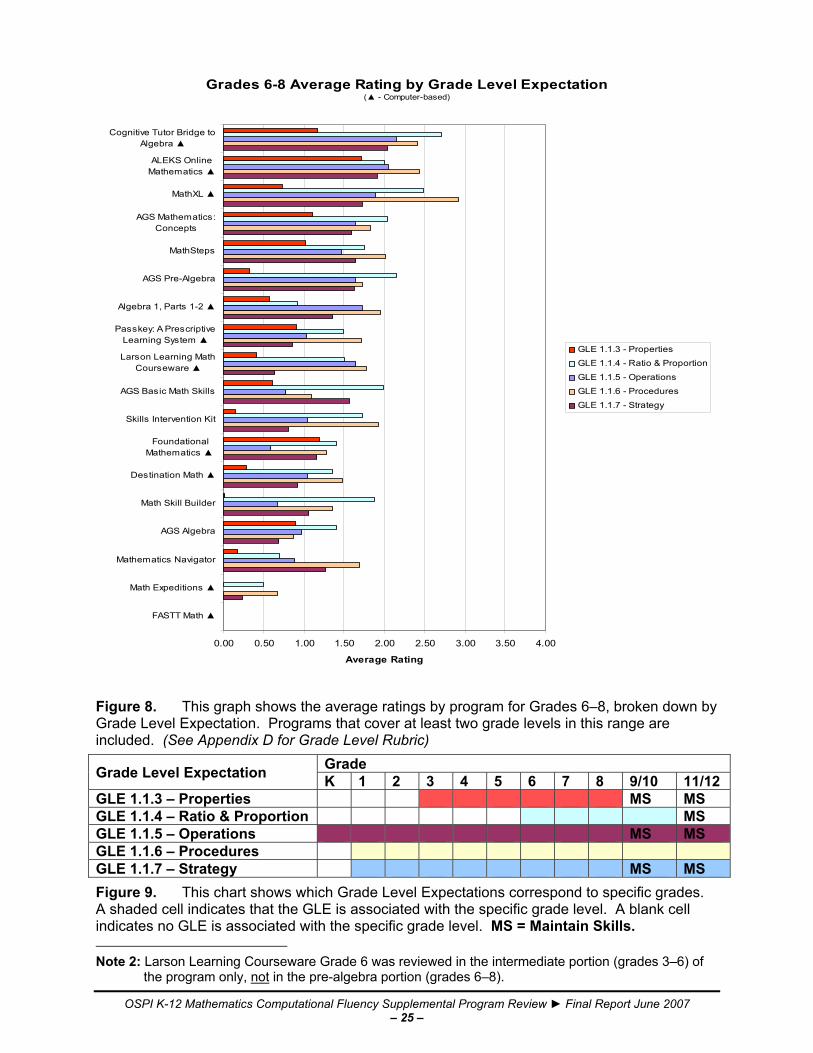
Part 1: Grade Level Review Results General Findings In comparing the data for all programs by grade level (Figure 1Error! Reference source not found.and Figure 2), it is worth noting that, on average, programs for grades K–3 rated significantly higher than any other grade range. Another trend of increased ratings occurred in programs designed for grades 7 and 8. Grades 9–12 had an average rating of less than 1 (Met some, but not all, criteria), as did grades 4–6. This distribution of ratings may be explained by the relative focus on computational fluency early in the elementary grades and a focus on computational remediation in the pre-algebra grades 7 and 8, along with emphasis on other mathematical concepts in grades 4–6 and 9–12. All Programs Figure 4 represents an ordered average rating for all programs that cover at least two grades within K–5. It is important to note that small differences between similar programs are not statistically significant, but that a difference of 0.1 or more is statistically significant. Thus, it would not be warranted to say that Harcourt Mathletics has a significantly higher average rating than Number Worlds. However, one could draw the conclusion that Destination Math has a significantly higher overall average rating than FASTT Math, for example. Note that the overall ratings measure specific criteria for Grade Level Expectations in Assessment, Instruction, and Practice. Many factors influence the relative value of a specific program. Overall ratings are one such factor. It is not necessarily appropriate to claim that one program is better or worse than another, based on this analysis. Rather the claim is that a program may have a better match to the standards-based criteria used in this review than another program. Elementary Programs Figure 5 and Figure 6 show the average ratings by program for grades K–5, broken down by Grade Level Expectation. Note that the data was split into two graphs of fourteen programs each (28 total), to improve readability. The programs are ordered by their overall average rating across all Grade Level Expectations (GLEs). Overall, in grades 3–5, GLE 1.1.3 (Properties), fared relatively poorly, compared to the other GLEs, in terms of an average rating. GLEs 1.1.5–1.1.7 (Operations, Procedures, and Strategy) were generally stronger and internally consistent than GLE 1.1.3 (Properties). That is, programs that tended to have a higher average rating for GLE 1.1.5 (Operations) also tended to have similar ratings for GLE 1.1.6 (Procedures) and GLE 1.1.7 (Strategy) as well. Slightly more than one-third of the programs had an average rating of 1.5 or greater. Middle School Programs Figure 7 and Figure 8 show average ratings for middle school grades 6–8. Of the 18 programs reviewed, 5 had an average rating of 1.5 or greater. Statistically significant differences of 0.1 or greater are seen across the broad range of average ratings (0 to 2.1), but many individual comparisons between similarly rated programs do not show a statistically significant difference, like Mathematics Navigator and AGS Algebra. In grades 6–8, like the elementary grades, GLE 1.1.3 (Properties) had a lower average rating than did the other GLEs 1.1.4–1.1.7 (Ratio & Proportion, Operations, Procedures, and Strategy). For most programs, Ratio & Proportion (GLE 1.1.4) and Procedures (GLE 1.1.6) were the highest rated GLEs, indicating that middle school supplemental computational fluency curricula conforms more closely to Washington State standards in those two GLEs than curricula at grade spans K–5 and 9–12.

OSPI K-12 Mathematics Computational Fluency Supplemental Program Review ► Final Report June 2007 – 18 –
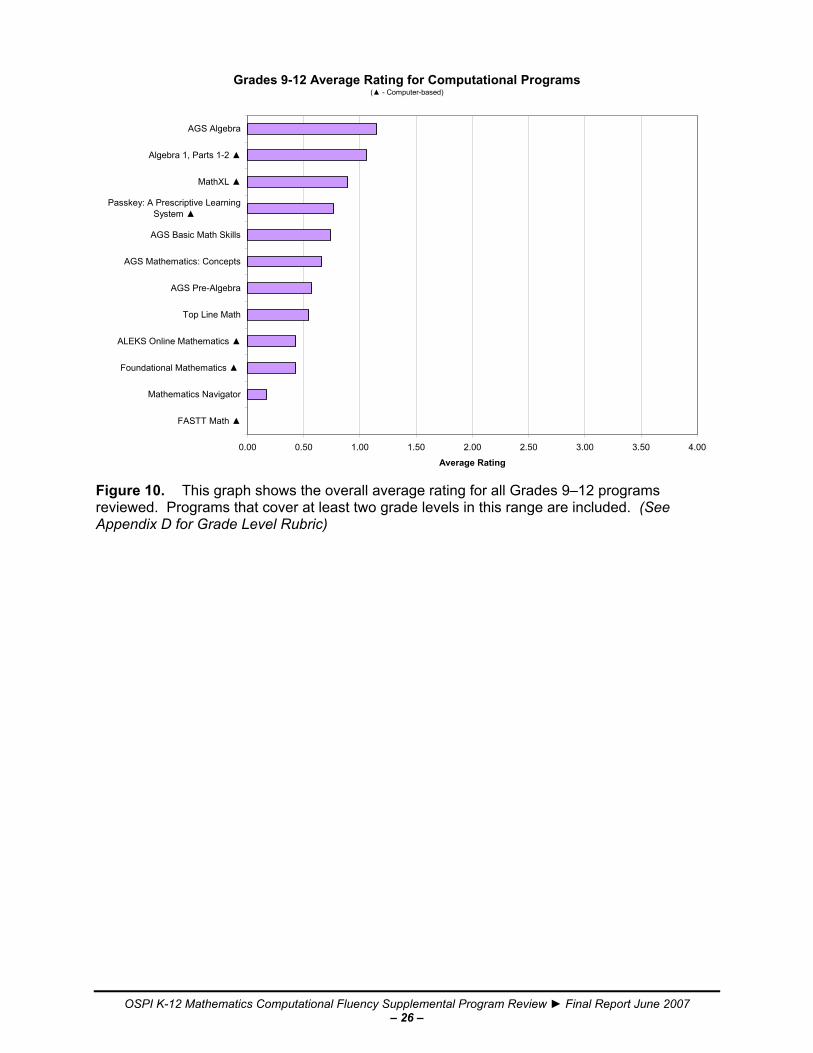
High School Programs Figure 10 and Figure 11show average ratings for grades 9-12. High school programs had the lowest overall average ratings, compared to elementary and middle school programs. A statistically significant difference of 0.15 is seen between the broad range of programs, but again, similarly rated programs like AGS Mathematics: Concepts and AGS Pre-Algebra do not show a statistically significant difference between their average ratings. In general, for high school grades, GLE 1.1.6 (Procedures) had the highest average rating, compared to Ratio & Proportion, Operations, and Strategy (GLEs 1.1.4, 1.1.5, and 1.1.7, respectively). It is important to note, however, that compared to elementary and middle school grades, programs at the high school level received a significantly lower average rating across all GLEs. It is difficult to draw conclusions about the reasons for the difference between elementary, middle and high school, however.

OSPI K-12 Mathematics Computational Fluency Supplemental Program Review ► Final Report June 2007 – 19 –
Results for All Programs by Grades Arithmetic mean was used as the statistical average for the grade level review data. (See Appendix E for Data Analysis Approach) Average ratings for all programs are reported two ways:
1. Grades and Program Elements of Assessment, Instruction, and Practice 2. Grades and GLEs 1.1.3–1.1.7
Average Rating for All Programs by Grade and Program Element
0.00 0.50 1.00 1.50 2.00 2.50 3.00 3.50 4.00
K
1
2
3
4
5
6
7
8
9/10
11/12
Gra
de
Average Rating
AssessmentInstructionPractice
Figure 1. This graph shows the average rating for all programs by grade, broken down by Program Element – Assessment, Instruction, and Practice. Overall, early elementary grades have higher average ratings than other grade levels. There is a smaller peak of higher average ratings during middle school, where presumably, more emphasis on remediation is occurring. (See Appendix D for Grade Level Rubric)
OSPI K-12 Mathematics Computational Fluency Supplemental Program Review ► Final Report June 2007 – 20 –
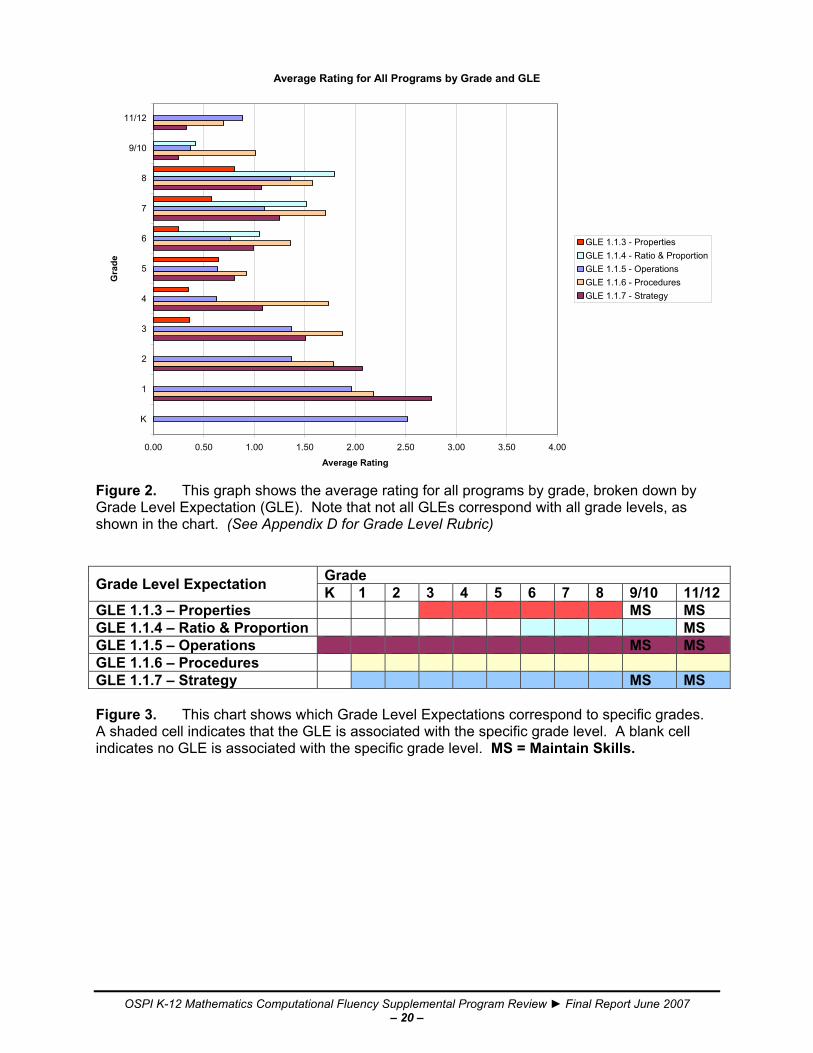
Average Rating for All Programs by Grade and GLE
0.00 0.50 1.00 1.50 2.00 2.50 3.00 3.50 4.00
K
1
2
3
4
5
6
7
8
9/10
11/12G
rade
Average Rating
GLE 1.1.3 - PropertiesGLE 1.1.4 - Ratio & ProportionGLE 1.1.5 - OperationsGLE 1.1.6 - ProceduresGLE 1.1.7 - Strategy
Figure 2. This graph shows the average rating for all programs by grade, broken down by Grade Level Expectation (GLE). Note that not all GLEs correspond with all grade levels, as shown in the chart. (See Appendix D for Grade Level Rubric)
Figure 3. This chart shows which Grade Level Expectations correspond to specific grades. A shaded cell indicates that the GLE is associated with the specific grade level. A blank cell indicates no GLE is associated with the specific grade level. MS = Maintain Skills.
Grade Level Expectation Grade K 1 2 3 4 5 6 7 8 9/10 11/12
GLE 1.1.3 – Properties MS MS GLE 1.1.4 – Ratio & Proportion MS GLE 1.1.5 – Operations MS MS GLE 1.1.6 – Procedures GLE 1.1.7 – Strategy MS MS
OSPI K-12 Mathematics Computational Fluency Supplemental Program Review ► Final Report June 2007 – 21 –
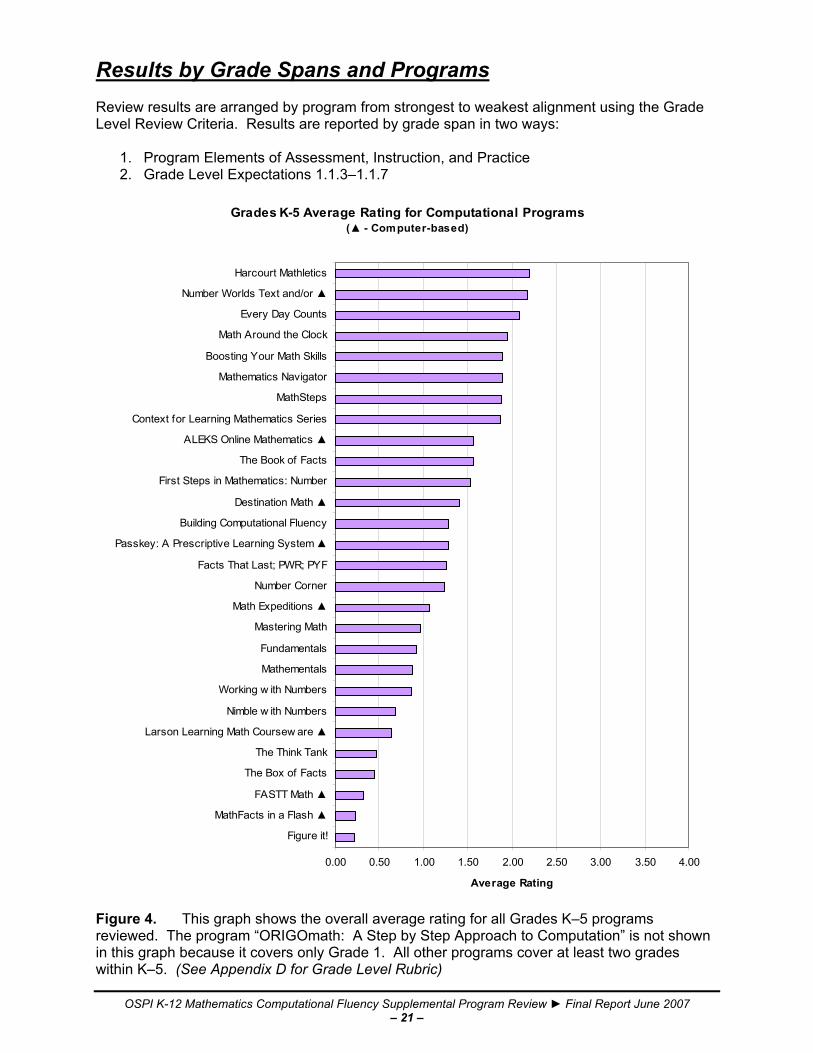
Results by Grade Spans and Programs Review results are arranged by program from strongest to weakest alignment using the Grade Level Review Criteria. Results are reported by grade span in two ways:
1. Program Elements of Assessment, Instruction, and Practice 2. Grade Level Expectations 1.1.3–1.1.7
Grades K-5 Average Rating for Computational Programs(▲ - Computer-based)
0.00 0.50 1.00 1.50 2.00 2.50 3.00 3.50 4.00
Figure it!
MathFacts in a Flash ▲
FASTT Math ▲
The Box of Facts
The Think Tank
Larson Learning Math Coursew are ▲
Nimble w ith Numbers
Working w ith Numbers
Mathementals
Fundamentals
Mastering Math
Math Expeditions ▲
Number Corner
Facts That Last; PWR; PYF
Passkey: A Prescriptive Learning System ▲
Building Computational Fluency
Destination Math ▲
First Steps in Mathematics: Number
The Book of Facts
ALEKS Online Mathematics ▲
Context for Learning Mathematics Series
MathSteps
Mathematics Navigator
Boosting Your Math Skills
Math Around the Clock
Every Day Counts
Number Worlds Text and/or ▲
Harcourt Mathletics
Average Rating
Figure 4. This graph shows the overall average rating for all Grades K–5 programs reviewed. The program “ORIGOmath: A Step by Step Approach to Computation” is not shown in this graph because it covers only Grade 1. All other programs cover at least two grades within K–5. (See Appendix D for Grade Level Rubric)

OSPI K-12 Mathematics Computational Fluency Supplemental Program Review ► Final Report June 2007 – 22 –
Figure 5. Part 1 of 2 graphs showing average ratings by program for Grades K–5, broken down by Grade Level Expectation. Note that the program “ORIGOmath: A Step by Step Approach to Computation” is not shown in this graph series because it covers only Grade 1. All other programs cover at least two grades within K–5. The graphs were split to improve readability. (See Appendix D for Grade Level Rubric)
Grades K-5 Average Rating by Grade Level Expectation, Part 1 of 2 (? - Computer-based)
0.00 0.50 1.00 1.50 2.00 2.50 3.00 3.50 4.00
Passkey: A Prescriptive Learning System ?
Building Computational Fluency
Destination Math ?
First Steps inMathematics: Number
The Book of Facts
ALEKS Online Mathematics?
Context for Learning Mathematics Series
MathSteps
Mathematics Navigator
Boosting Your Math Skills
Math Around the Clock
Every Day Counts
Number Worlds Text and/or ▲
Harcourt Mathletics
Average Rating
GLE 1.1.3 - Properties
GLE 1.1.5 - Operations
GLE 1.1.6 - Procedures
GLE 1.1.7 - Strategy
OSPI K-12 Mathematics Computational Fluency Supplemental Program Review ► Final Report June 2007 – 23 –
Grades K-5 Average Rating by Grade Level Expectation, Part 2 of 2(▲ - Computer-based)
0.00 0.50 1.00 1.50 2.00 2.50 3.00 3.50 4.00
Figure it!
MathFacts in a Flash ▲
FASTT Math ▲
The Box of Facts
The Think Tank
Larson Learning MathCoursew are ▲
Nimble w ith Numbers
Working w ith Numbers
Mathementals
Fundamentals
Mastering Math
Math Expeditions ▲
Number Corner
Facts That Last; PWR;PYF
Average Rating
GLE 1.1.3 - Properties
GLE 1.1.5 - Operations
GLE 1.1.6 - Procedures
GLE 1.1.7 - Strategy
Figure 6. Part 2 of 2 graphs showing average ratings by program for Grades K–5, broken down by Grade Level Expectation. The graphs were split to improve readability. (See Appendix D for Grade Level Rubric)
OSPI K-12 Mathematics Computational Fluency Supplemental Program Review ► Final Report June 2007 – 24 –
Grades 6-8 Average Rating for Computational Programs(▲ - Computer-based)
0.00 0.50 1.00 1.50 2.00 2.50 3.00 3.50 4.00
FASTT Math ▲
Math Expeditions ▲
Mathematics Navigator
AGS Algebra
Math Skill Builder
Destination Math ▲
Foundational Mathematics ▲
Skills Intervention Kit
AGS Basic Math Skills
Larson Learning Math Courseware ▲
Passkey: A Prescriptive Learning System ▲
Algebra 1, Parts 1-2 ▲
AGS Pre-Algebra
MathSteps
AGS Mathematics: Concepts
MathXL ▲
ALEKS Online Mathematics ▲
Cognitive Tutor Bridge to Algebra ▲
Average Rating
2 Figure 7. This graph shows the overall average rating for all Grades 6-8 programs reviewed. Programs that cover at least two grade levels in this range are included.
Note 1: Larson Learning Courseware Grade 6 was reviewed in the intermediate portion (grades 3–6) of
the program only, not in the pre-algebra portion (grades 6–8).
OSPI K-12 Mathematics Computational Fluency Supplemental Program Review ► Final Report June 2007 – 25 –
Grades 6-8 Average Rating by Grade Level Expectation(▲ - Computer-based)
0.00 0.50 1.00 1.50 2.00 2.50 3.00 3.50 4.00
FASTT Math ▲
Math Expeditions ▲
Mathematics Navigator
AGS Algebra
Math Skill Builder
Destination Math ▲
FoundationalMathematics ▲
Skills Intervention Kit
AGS Basic Math Skills
Larson Learning MathCourseware ▲
Passkey: A PrescriptiveLearning System ▲
Algebra 1, Parts 1-2 ▲
AGS Pre-Algebra
MathSteps
AGS Mathematics:Concepts
MathXL ▲
ALEKS OnlineMathematics ▲
Cognitive Tutor Bridge toAlgebra ▲
Average Rating
GLE 1.1.3 - Properties
GLE 1.1.4 - Ratio & Proportion
GLE 1.1.5 - Operations
GLE 1.1.6 - Procedures
GLE 1.1.7 - Strategy
3 Figure 8. This graph shows the average ratings by program for Grades 6–8, broken down by Grade Level Expectation. Programs that cover at least two grade levels in this range are included. (See Appendix D for Grade Level Rubric)
Figure 9. This chart shows which Grade Level Expectations correspond to specific grades. A shaded cell indicates that the GLE is associated with the specific grade level. A blank cell indicates no GLE is associated with the specific grade level. MS = Maintain Skills. Note 2: Larson Learning Courseware Grade 6 was reviewed in the intermediate portion (grades 3–6) of
the program only, not in the pre-algebra portion (grades 6–8).
Grade Level Expectation Grade K 1 2 3 4 5 6 7 8 9/10 11/12
GLE 1.1.3 – Properties MS MS GLE 1.1.4 – Ratio & Proportion MS GLE 1.1.5 – Operations MS MS GLE 1.1.6 – Procedures GLE 1.1.7 – Strategy MS MS
OSPI K-12 Mathematics Computational Fluency Supplemental Program Review ► Final Report June 2007 – 26 –
Grades 9-12 Average Rating for Computational Programs(▲ - Computer-based)
0.00 0.50 1.00 1.50 2.00 2.50 3.00 3.50 4.00
FASTT Math ▲
Mathematics Navigator
Foundational Mathematics ▲
ALEKS Online Mathematics ▲
Top Line Math
AGS Pre-Algebra
AGS Mathematics: Concepts
AGS Basic Math Skills
Passkey: A Prescriptive LearningSystem ▲
MathXL ▲
Algebra 1, Parts 1-2 ▲
AGS Algebra
Average Rating
Figure 10. This graph shows the overall average rating for all Grades 9–12 programs reviewed. Programs that cover at least two grade levels in this range are included. (See Appendix D for Grade Level Rubric)
OSPI K-12 Mathematics Computational Fluency Supplemental Program Review ► Final Report June 2007 – 27 –
Grades 9-12 Average Rating by Grade Level Expectation(▲ - Computer-based)
0.00 0.50 1.00 1.50 2.00 2.50 3.00 3.50 4.00
FASTT Math ▲
Mathematics Navigator
Foundational Mathematics ▲
ALEKS Online Mathematics ▲
Top Line Math
AGS Pre-Algebra
AGS Mathematics: Concepts
AGS Basic Math Skills
Passkey: A PrescriptiveLearning System ▲
MathXL ▲
Algebra 1, Parts 1-2 ▲
AGS Algebra
Average Rating
GLE 1.1.4 - Ratio & ProportionGLE 1.1.5 - OperationsGLE 1.1.6 - ProceduresGLE 1.1.7 - Strategy
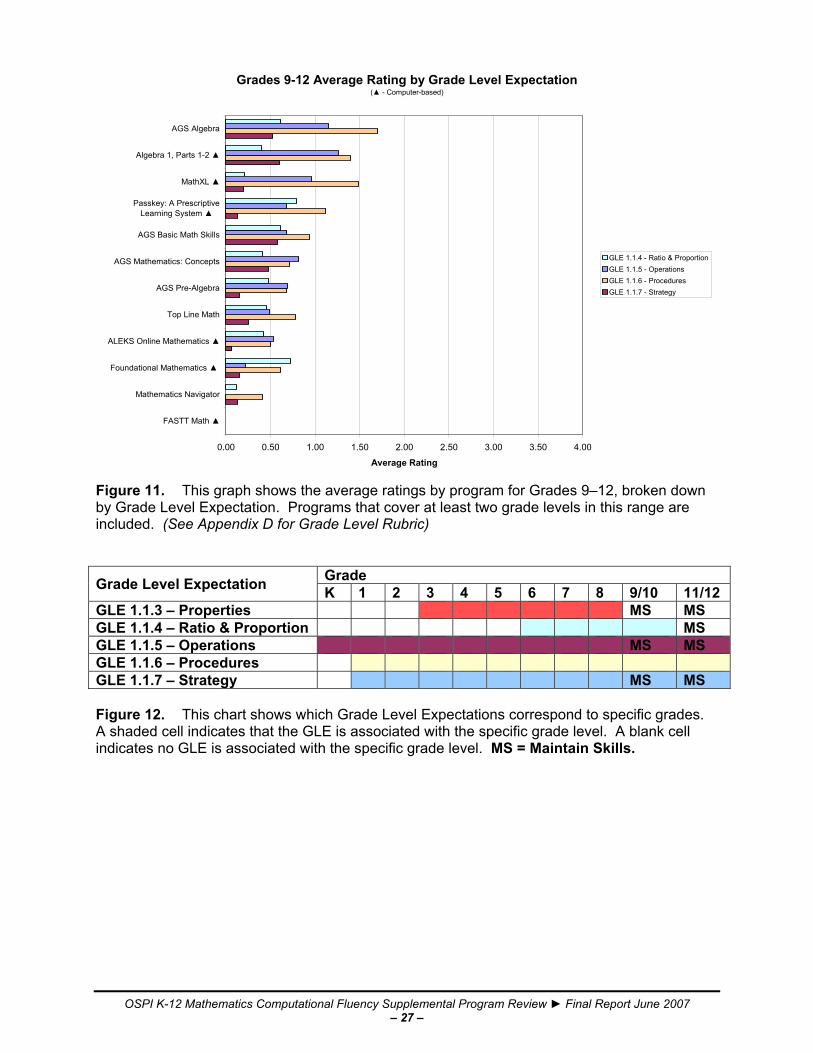
Figure 11. This graph shows the average ratings by program for Grades 9–12, broken down by Grade Level Expectation. Programs that cover at least two grade levels in this range are included. (See Appendix D for Grade Level Rubric)
Figure 12. This chart shows which Grade Level Expectations correspond to specific grades. A shaded cell indicates that the GLE is associated with the specific grade level. A blank cell indicates no GLE is associated with the specific grade level. MS = Maintain Skills.
Grade Level Expectation Grade K 1 2 3 4 5 6 7 8 9/10 11/12
GLE 1.1.3 – Properties MS MS GLE 1.1.4 – Ratio & Proportion MS GLE 1.1.5 – Operations MS MS GLE 1.1.6 – Procedures GLE 1.1.7 – Strategy MS MS

OSPI K-12 Mathematics Computational Fluency Supplemental Program Review ► Final Report June 2007 – 28 –

OSPI K-12 Mathematics Computational Fluency Supplemental Program Review ► Final Report June 2007 – 29 –
Results by Programs and Grades Review Results are reported in alphabetical order by program name and grade span in two ways:
1. Program Elements of Assessment, Instruction, and Practice 2. Grade Level Expectations 1.1.3–1.1.7
This chart shows which Grade Level Expectations correspond to specific grades. A shaded cell indicates that the GLE is associated with the specific grade level. A blank cell indicates no GLE is associated with the specific grade level. MS = Maintain Skills.
Grade Level Expectation Grade K 1 2 3 4 5 6 7 8 9/10 11/12
GLE 1.1.3 – Properties MS MS GLE 1.1.4 – Ratio & Proportion MS GLE 1.1.5 – Operations MS MS GLE 1.1.6 – Procedures GLE 1.1.7 – Strategy MS MS

OSPI K-12 Mathematics Computational Fluency Supplemental Program Review ► Final Report June 2007 – 30 –
AGS AlgebraAverage Rating by Grade and Program Element
0.00 0.50 1.00 1.50 2.00 2.50 3.00 3.50 4.00
7
8
9/10
11/12
Gra
de
Average Rating
AssessmentInstructionPractice
AGS Algebra
Average Rating by Grade and GLE
0.00 0.50 1.00 1.50 2.00 2.50 3.00 3.50 4.00
7
8
9/10
11/12
Gra
de
Average Rating
GLE 1.1.3 - PropertiesGLE 1.1.4 - Ratio & ProportionGLE 1.1.5 - OperationsGLE 1.1.6 - ProceduresGLE 1.1.7 - Strategy
OSPI K-12 Mathematics Computational Fluency Supplemental Program Review ► Final Report June 2007 – 31 –
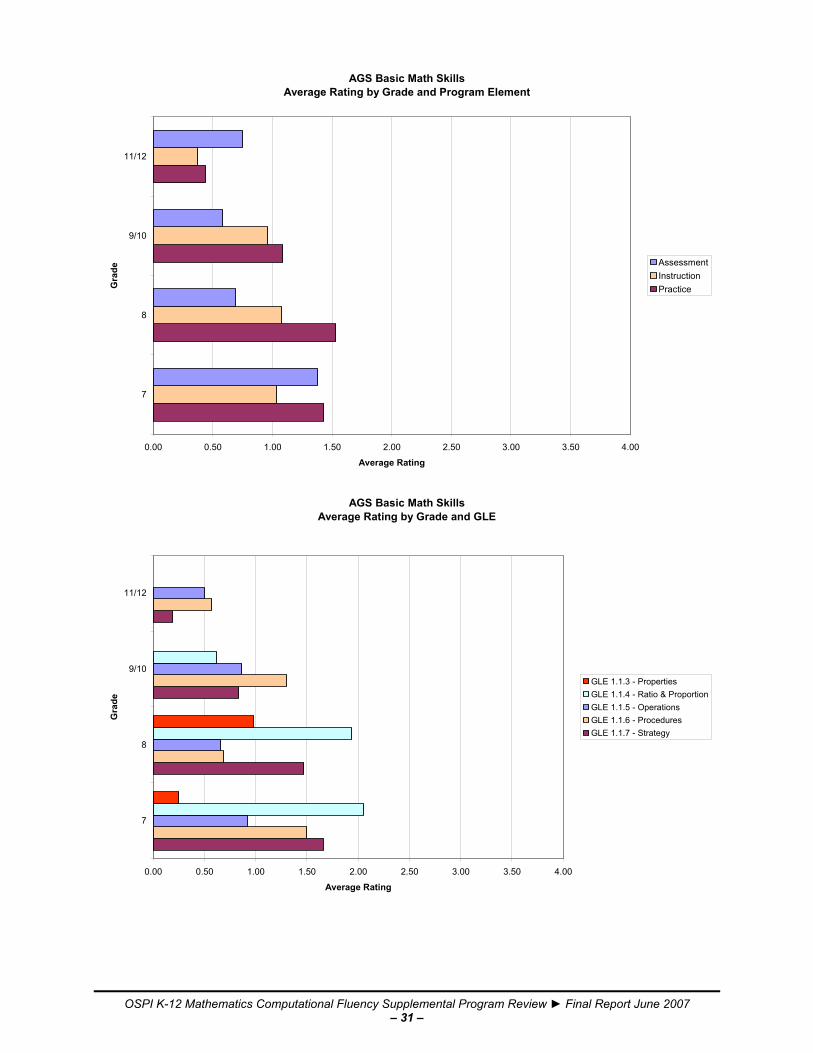
AGS Basic Math SkillsAverage Rating by Grade and Program Element
0.00 0.50 1.00 1.50 2.00 2.50 3.00 3.50 4.00
7
8
9/10
11/12
Gra
de
Average Rating
AssessmentInstructionPractice
AGS Basic Math Skills
Average Rating by Grade and GLE
0.00 0.50 1.00 1.50 2.00 2.50 3.00 3.50 4.00
7
8
9/10
11/12
Gra
de
Average Rating
GLE 1.1.3 - PropertiesGLE 1.1.4 - Ratio & ProportionGLE 1.1.5 - OperationsGLE 1.1.6 - ProceduresGLE 1.1.7 - Strategy

OSPI K-12 Mathematics Computational Fluency Supplemental Program Review ► Final Report June 2007 – 32 –
AGS Mathematics: ConceptsAverage Rating by Grade and Program Element
0.00 0.50 1.00 1.50 2.00 2.50 3.00 3.50 4.00
7
8
9/10
11/12
Gra
de
Average Rating
AssessmentInstructionPractice
AGS Mathematics: Concepts
Average Rating by Grade and GLE
0.00 0.50 1.00 1.50 2.00 2.50 3.00 3.50 4.00
7
8
9/10
11/12
Gra
de
Average Rating
GLE 1.1.3 - PropertiesGLE 1.1.4 - Ratio & ProportionGLE 1.1.5 - OperationsGLE 1.1.6 - ProceduresGLE 1.1.7 - Strategy
OSPI K-12 Mathematics Computational Fluency Supplemental Program Review ► Final Report June 2007 – 33 –
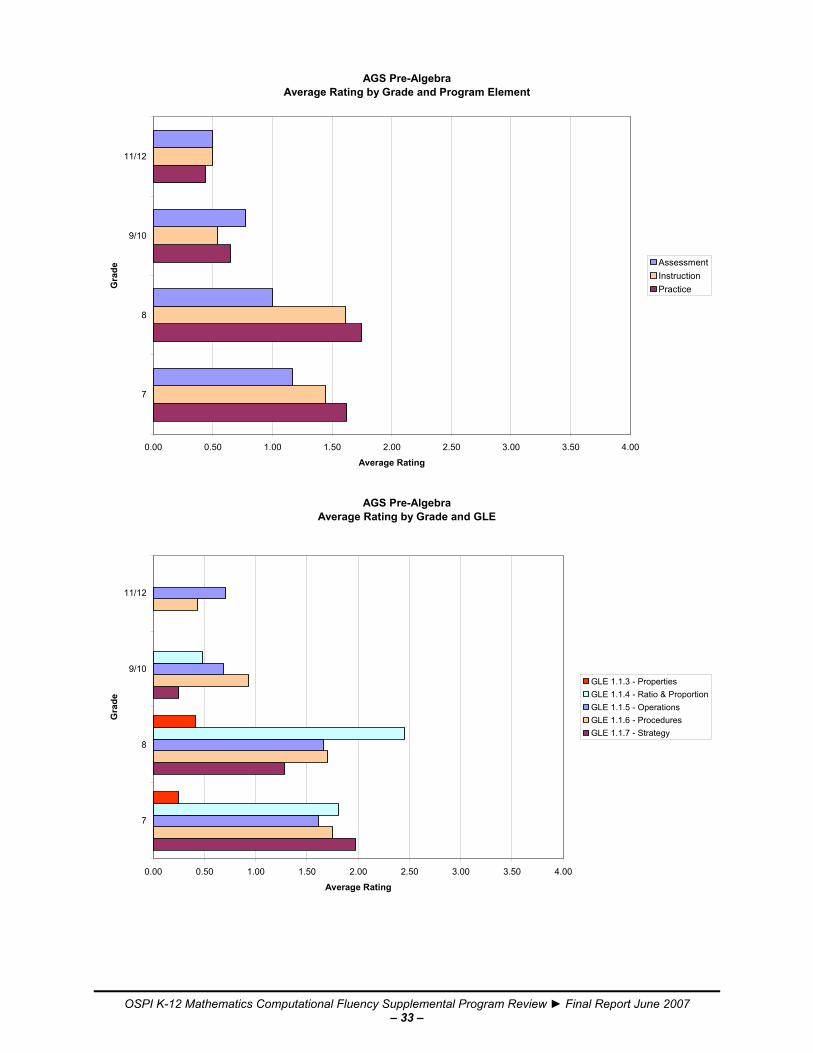
AGS Pre-AlgebraAverage Rating by Grade and Program Element
0.00 0.50 1.00 1.50 2.00 2.50 3.00 3.50 4.00
7
8
9/10
11/12
Gra
de
Average Rating
AssessmentInstructionPractice
AGS Pre-Algebra
Average Rating by Grade and GLE
0.00 0.50 1.00 1.50 2.00 2.50 3.00 3.50 4.00
7
8
9/10
11/12
Gra
de
Average Rating
GLE 1.1.3 - PropertiesGLE 1.1.4 - Ratio & ProportionGLE 1.1.5 - OperationsGLE 1.1.6 - ProceduresGLE 1.1.7 - Strategy
OSPI K-12 Mathematics Computational Fluency Supplemental Program Review ► Final Report June 2007 – 34 –
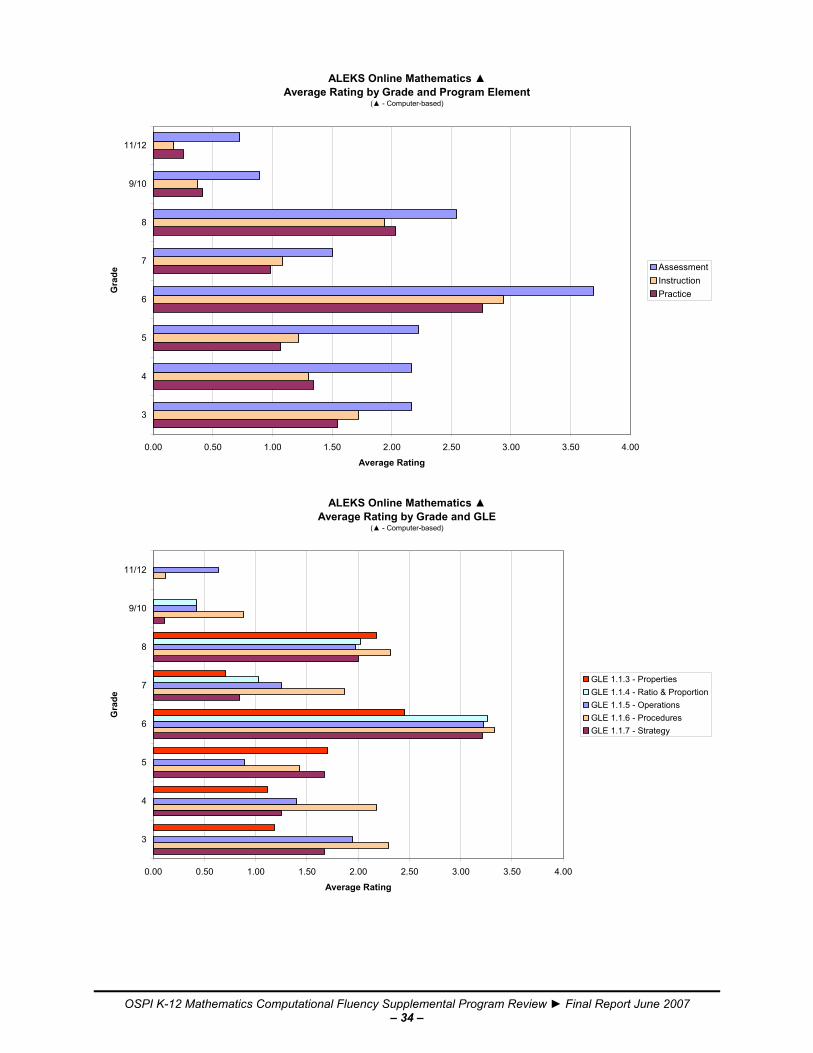
ALEKS Online Mathematics ▲ Average Rating by Grade and Program Element
(▲ - Computer-based)
0.00 0.50 1.00 1.50 2.00 2.50 3.00 3.50 4.00
3
4
5
6
7
8
9/10
11/12
Gra
de
Average Rating
AssessmentInstructionPractice
ALEKS Online Mathematics ▲
Average Rating by Grade and GLE(▲ - Computer-based)
0.00 0.50 1.00 1.50 2.00 2.50 3.00 3.50 4.00
3
4
5
6
7
8
9/10
11/12
Gra
de
Average Rating
GLE 1.1.3 - PropertiesGLE 1.1.4 - Ratio & ProportionGLE 1.1.5 - OperationsGLE 1.1.6 - ProceduresGLE 1.1.7 - Strategy
OSPI K-12 Mathematics Computational Fluency Supplemental Program Review ► Final Report June 2007 – 35 –
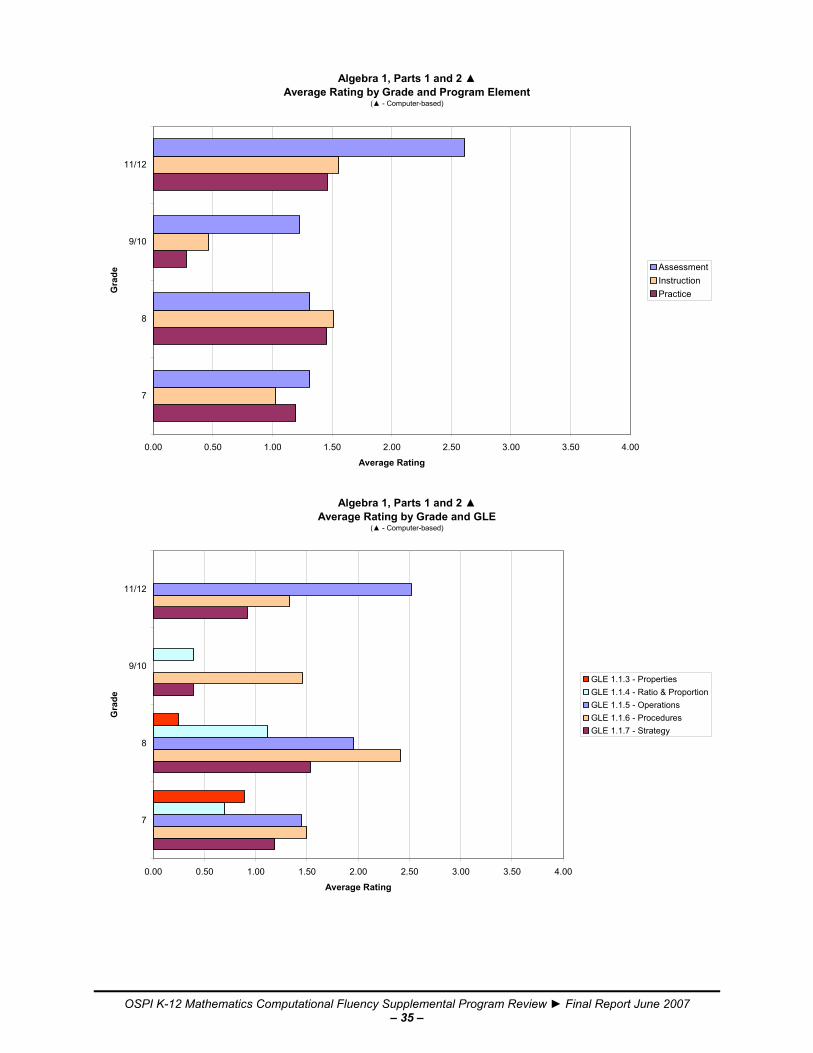
Algebra 1, Parts 1 and 2 ▲ Average Rating by Grade and Program Element
(▲ - Computer-based)
0.00 0.50 1.00 1.50 2.00 2.50 3.00 3.50 4.00
7
8
9/10
11/12
Gra
de
Average Rating
AssessmentInstructionPractice
Algebra 1, Parts 1 and 2 ▲
Average Rating by Grade and GLE(▲ - Computer-based)
0.00 0.50 1.00 1.50 2.00 2.50 3.00 3.50 4.00
7
8
9/10
11/12
Gra
de
Average Rating
GLE 1.1.3 - PropertiesGLE 1.1.4 - Ratio & ProportionGLE 1.1.5 - OperationsGLE 1.1.6 - ProceduresGLE 1.1.7 - Strategy

OSPI K-12 Mathematics Computational Fluency Supplemental Program Review ► Final Report June 2007 – 36 –
Boosting Your Math SkillsAverage Rating by Grade and Program Element
0.00 0.50 1.00 1.50 2.00 2.50 3.00 3.50 4.00
1
2
3
4
5
6
Gra
de
Average Rating
AssessmentInstructionPractice
Boosting Your Math Skills
Average Rating by Grade and GLE
0.00 0.50 1.00 1.50 2.00 2.50 3.00 3.50 4.00
1
2
3
4
5
6
Gra
de
Average Rating
GLE 1.1.3 - PropertiesGLE 1.1.4 - Ratio & ProportionGLE 1.1.5 - OperationsGLE 1.1.6 - ProceduresGLE 1.1.7 - Strategy
OSPI K-12 Mathematics Computational Fluency Supplemental Program Review ► Final Report June 2007 – 37 –
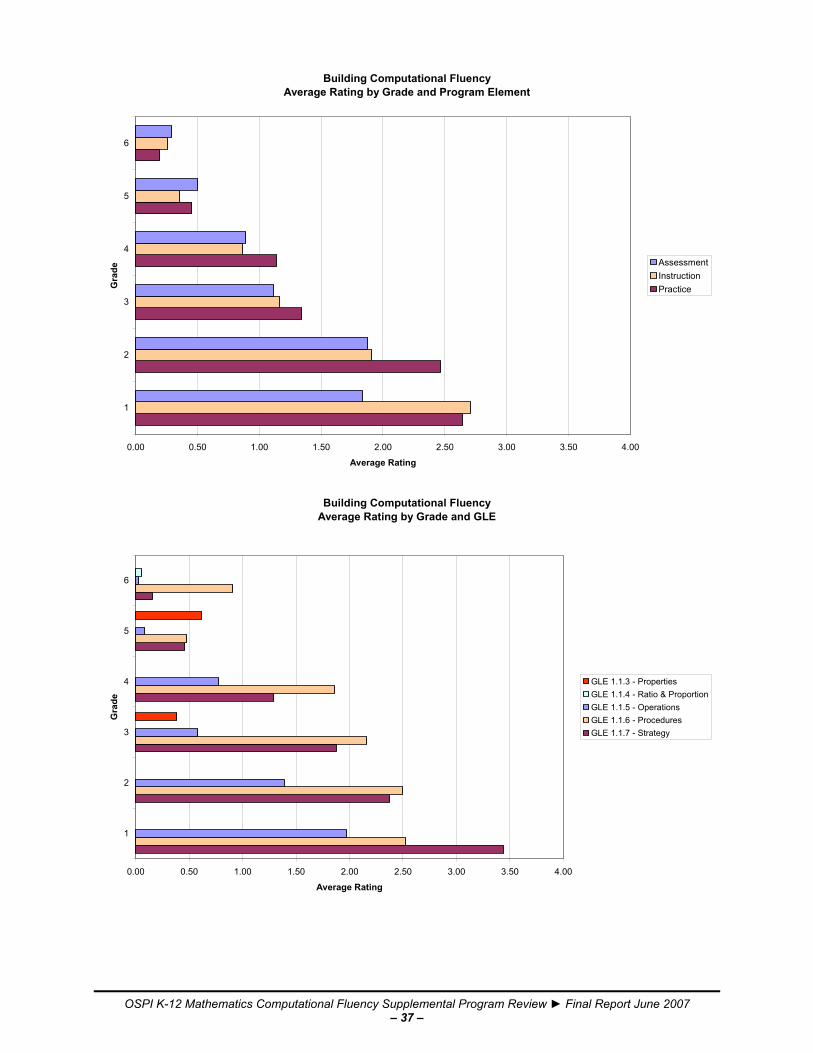
Building Computational FluencyAverage Rating by Grade and Program Element
0.00 0.50 1.00 1.50 2.00 2.50 3.00 3.50 4.00
1
2
3
4
5
6
Gra
de
Average Rating
AssessmentInstructionPractice
Building Computational Fluency
Average Rating by Grade and GLE
0.00 0.50 1.00 1.50 2.00 2.50 3.00 3.50 4.00
1
2
3
4
5
6
Gra
de
Average Rating
GLE 1.1.3 - PropertiesGLE 1.1.4 - Ratio & ProportionGLE 1.1.5 - OperationsGLE 1.1.6 - ProceduresGLE 1.1.7 - Strategy

OSPI K-12 Mathematics Computational Fluency Supplemental Program Review ► Final Report June 2007 – 38 –
Cognitive Tutor Bridge to Algebra ▲ Average Rating by Grade and Program Element
(▲ - Computer-based)
0.00 0.50 1.00 1.50 2.00 2.50 3.00 3.50 4.00
6
7
8
Gra
de
Average Rating
AssessmentInstructionPractice
Cognitive Tutor Bridge to Algebra ▲Average Rating by Grade and GLE
(▲ - Computer-based)
0.00 0.50 1.00 1.50 2.00 2.50 3.00 3.50 4.00
6
7
8
Gra
de
Average Rating
GLE 1.1.3 - PropertiesGLE 1.1.4 - Ratio & ProportionGLE 1.1.5 - OperationsGLE 1.1.6 - ProceduresGLE 1.1.7 - Strategy

OSPI K-12 Mathematics Computational Fluency Supplemental Program Review ► Final Report June 2007 – 39 –
Context for Learning Mathematics SeriesAverage Rating by Grade and Program Element
0.00 0.50 1.00 1.50 2.00 2.50 3.00 3.50 4.00
K
1
2
3
4
5
6
Gra
de
Average Rating
AssessmentInstructionPractice
Context for Learning Mathematics Series
Average Rating by Grade and GLE
0.00 0.50 1.00 1.50 2.00 2.50 3.00 3.50 4.00
K
1
2
3
4
5
6
Gra
de
Average Rating
GLE 1.1.3 - PropertiesGLE 1.1.4 - Ratio & ProportionGLE 1.1.5 - OperationsGLE 1.1.6 - ProceduresGLE 1.1.7 - Strategy

OSPI K-12 Mathematics Computational Fluency Supplemental Program Review ► Final Report June 2007 – 40 –
Destination Math ▲ Average Rating by Grade and Program Element
(▲ - Computer-based)
0.00 0.50 1.00 1.50 2.00 2.50 3.00 3.50 4.00
K
1
2
3
4
5
6
7
8
9/10
Gra
de
Average Rating
AssessmentInstructionPractice
Destination Math ▲
Average Rating by Grade and GLE(▲ - Computer-based)
0.00 0.50 1.00 1.50 2.00 2.50 3.00 3.50 4.00
K
1
2
3
4
5
6
7
8
9/10
Gra
de
Average Rating
GLE 1.1.3 - PropertiesGLE 1.1.4 - Ratio & ProportionGLE 1.1.5 - OperationsGLE 1.1.6 - ProceduresGLE 1.1.7 - Strategy

OSPI K-12 Mathematics Computational Fluency Supplemental Program Review ► Final Report June 2007 – 41 –
Everyday CountsAverage Rating by Grade and Program Element
0.00 0.50 1.00 1.50 2.00 2.50 3.00 3.50 4.00
K
1
2
3
4
5
6
Gra
de
Average Rating
AssessmentInstructionPractice
Everyday Counts
Average Rating by Grade and GLE
0.00 0.50 1.00 1.50 2.00 2.50 3.00 3.50 4.00
K
1
2
3
4
5
6
Gra
de
Average Rating
GLE 1.1.3 - PropertiesGLE 1.1.4 - Ratio & ProportionGLE 1.1.5 - OperationsGLE 1.1.6 - ProceduresGLE 1.1.7 - Strategy

OSPI K-12 Mathematics Computational Fluency Supplemental Program Review ► Final Report June 2007 – 42 –
Facts That Last; PWR; PYFAverage Rating by Grade and Program Element
0.00 0.50 1.00 1.50 2.00 2.50 3.00 3.50 4.00
1
2
3
4
5
6
Gra
de
Average Rating
AssessmentInstructionPractice
Facts That Last; PWR; PYF
Average Rating by Grade and GLE
0.00 0.50 1.00 1.50 2.00 2.50 3.00 3.50 4.00
1
2
3
4
5
6
Gra
de
Average Rating
GLE 1.1.3 - PropertiesGLE 1.1.4 - Ratio & ProportionGLE 1.1.5 - OperationsGLE 1.1.6 - ProceduresGLE 1.1.7 - Strategy
OSPI K-12 Mathematics Computational Fluency Supplemental Program Review ► Final Report June 2007 – 43 –
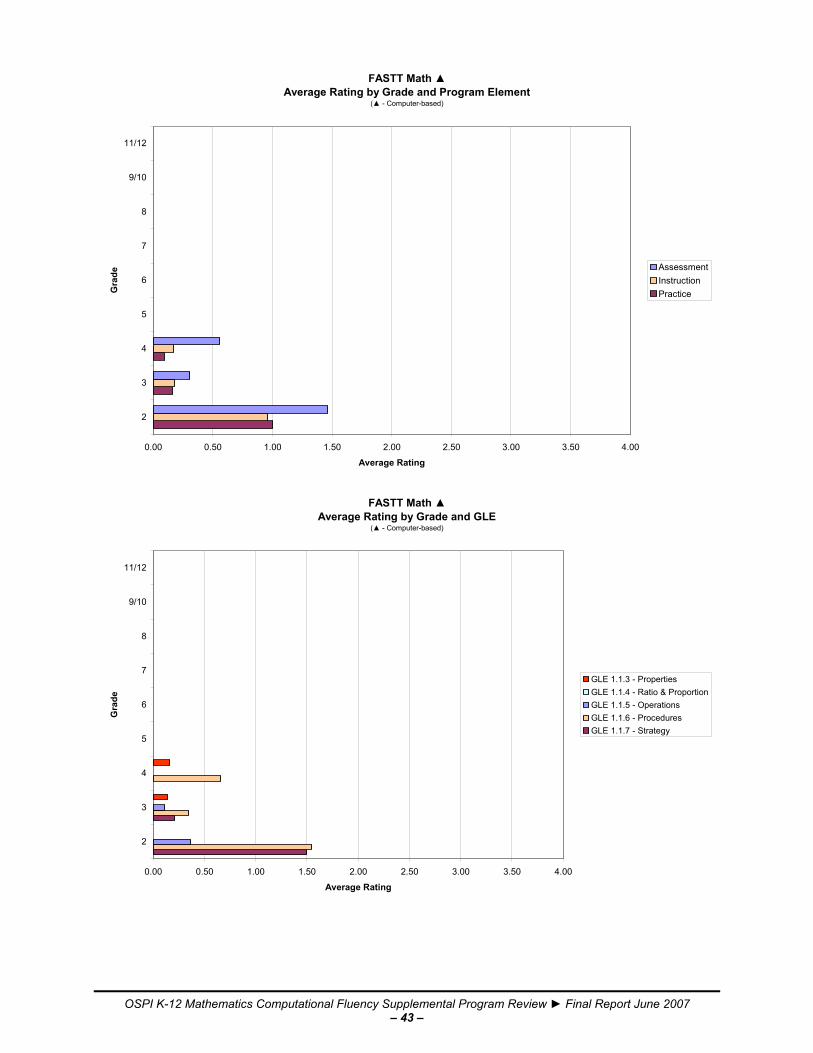
FASTT Math ▲ Average Rating by Grade and Program Element
(▲ - Computer-based)
0.00 0.50 1.00 1.50 2.00 2.50 3.00 3.50 4.00
2
3
4
5
6
7
8
9/10
11/12
Gra
de
Average Rating
AssessmentInstructionPractice
FASTT Math ▲
Average Rating by Grade and GLE(▲ - Computer-based)
0.00 0.50 1.00 1.50 2.00 2.50 3.00 3.50 4.00
2
3
4
5
6
7
8
9/10
11/12
Gra
de
Average Rating
GLE 1.1.3 - PropertiesGLE 1.1.4 - Ratio & ProportionGLE 1.1.5 - OperationsGLE 1.1.6 - ProceduresGLE 1.1.7 - Strategy
OSPI K-12 Mathematics Computational Fluency Supplemental Program Review ► Final Report June 2007 – 44 –
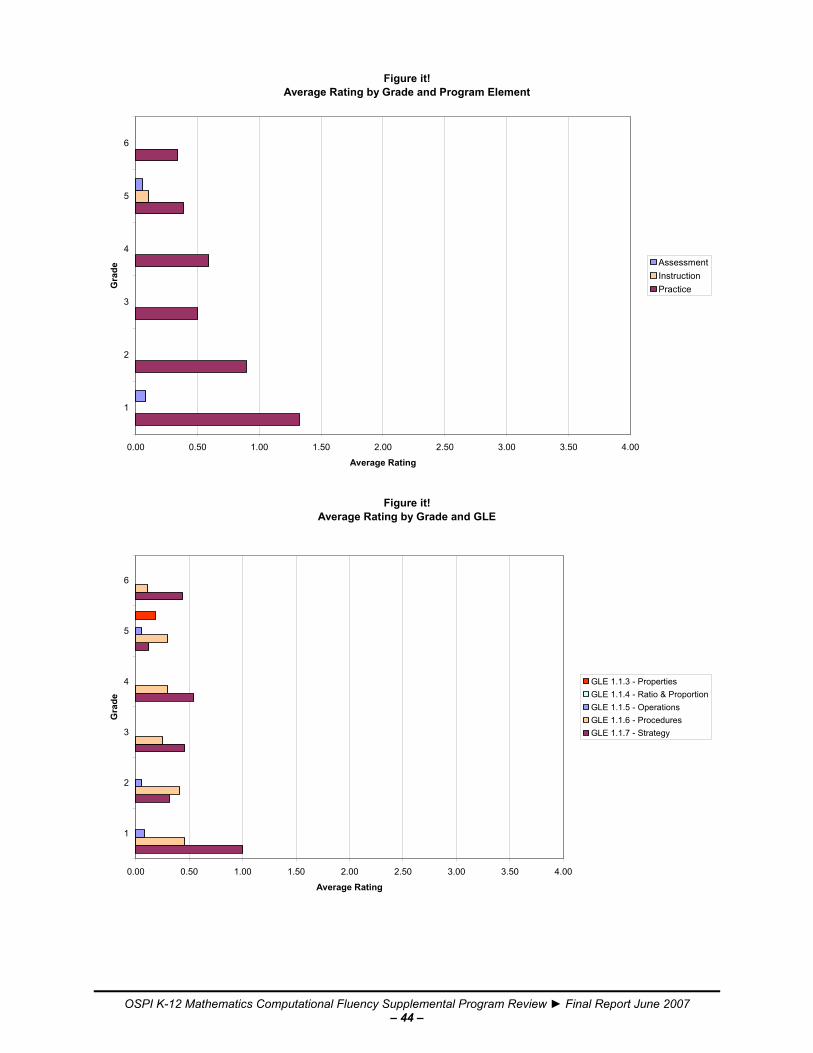
Figure it!Average Rating by Grade and Program Element
0.00 0.50 1.00 1.50 2.00 2.50 3.00 3.50 4.00
1
2
3
4
5
6
Gra
de
Average Rating
AssessmentInstructionPractice
Figure it!
Average Rating by Grade and GLE
0.00 0.50 1.00 1.50 2.00 2.50 3.00 3.50 4.00
1
2
3
4
5
6
Gra
de
Average Rating
GLE 1.1.3 - PropertiesGLE 1.1.4 - Ratio & ProportionGLE 1.1.5 - OperationsGLE 1.1.6 - ProceduresGLE 1.1.7 - Strategy

OSPI K-12 Mathematics Computational Fluency Supplemental Program Review ► Final Report June 2007 – 45 –
First Steps in Mathematics: NumberAverage Rating by Grade and Program Element
0.00 0.50 1.00 1.50 2.00 2.50 3.00 3.50 4.00
K
1
2
3
4
5
6
Gra
de
Average Rating
AssessmentInstructionPractice
First Steps in Mathematics: NumberAverage Rating by Grade and GLE
0.00 0.50 1.00 1.50 2.00 2.50 3.00 3.50 4.00
K
1
2
3
4
5
6
Gra
de
Average Rating
GLE 1.1.3 - PropertiesGLE 1.1.4 - Ratio & ProportionGLE 1.1.5 - OperationsGLE 1.1.6 - ProceduresGLE 1.1.7 - Strategy
OSPI K-12 Mathematics Computational Fluency Supplemental Program Review ► Final Report June 2007 – 46 –
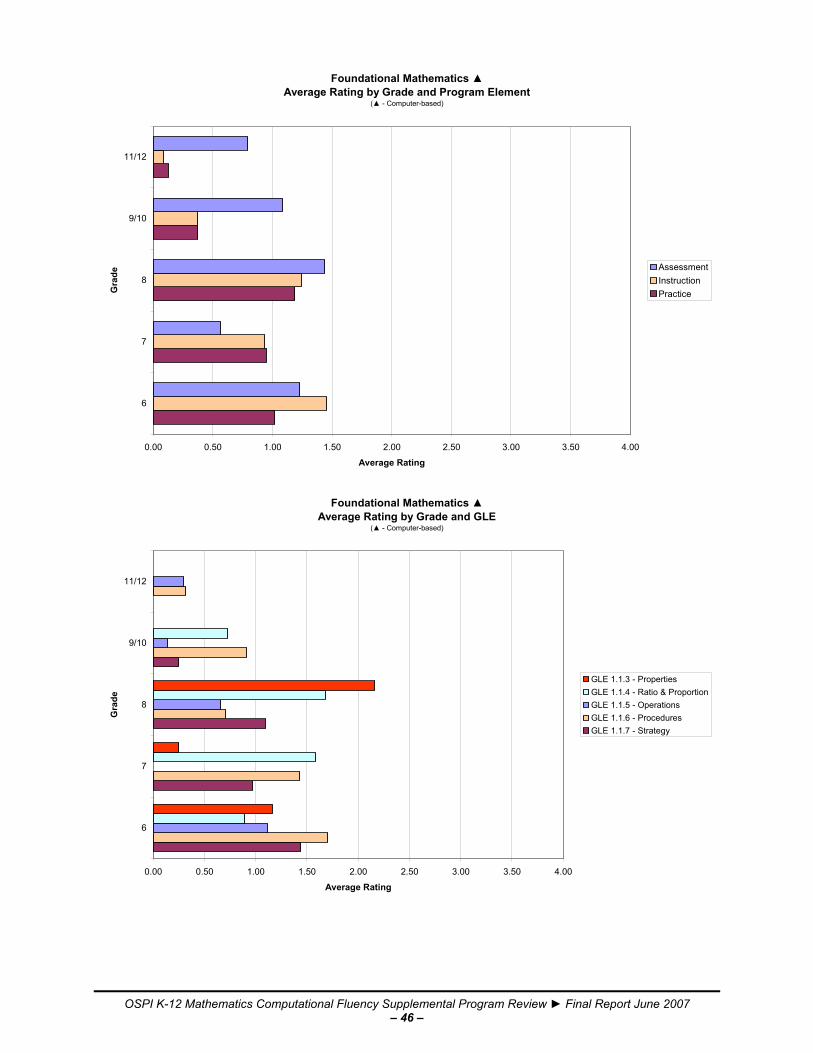
Foundational Mathematics ▲ Average Rating by Grade and Program Element
(▲ - Computer-based)
0.00 0.50 1.00 1.50 2.00 2.50 3.00 3.50 4.00
6
7
8
9/10
11/12
Gra
de
Average Rating
AssessmentInstructionPractice
Foundational Mathematics ▲
Average Rating by Grade and GLE(▲ - Computer-based)
0.00 0.50 1.00 1.50 2.00 2.50 3.00 3.50 4.00
6
7
8
9/10
11/12
Gra
de
Average Rating
GLE 1.1.3 - PropertiesGLE 1.1.4 - Ratio & ProportionGLE 1.1.5 - OperationsGLE 1.1.6 - ProceduresGLE 1.1.7 - Strategy
OSPI K-12 Mathematics Computational Fluency Supplemental Program Review ► Final Report June 2007 – 47 –
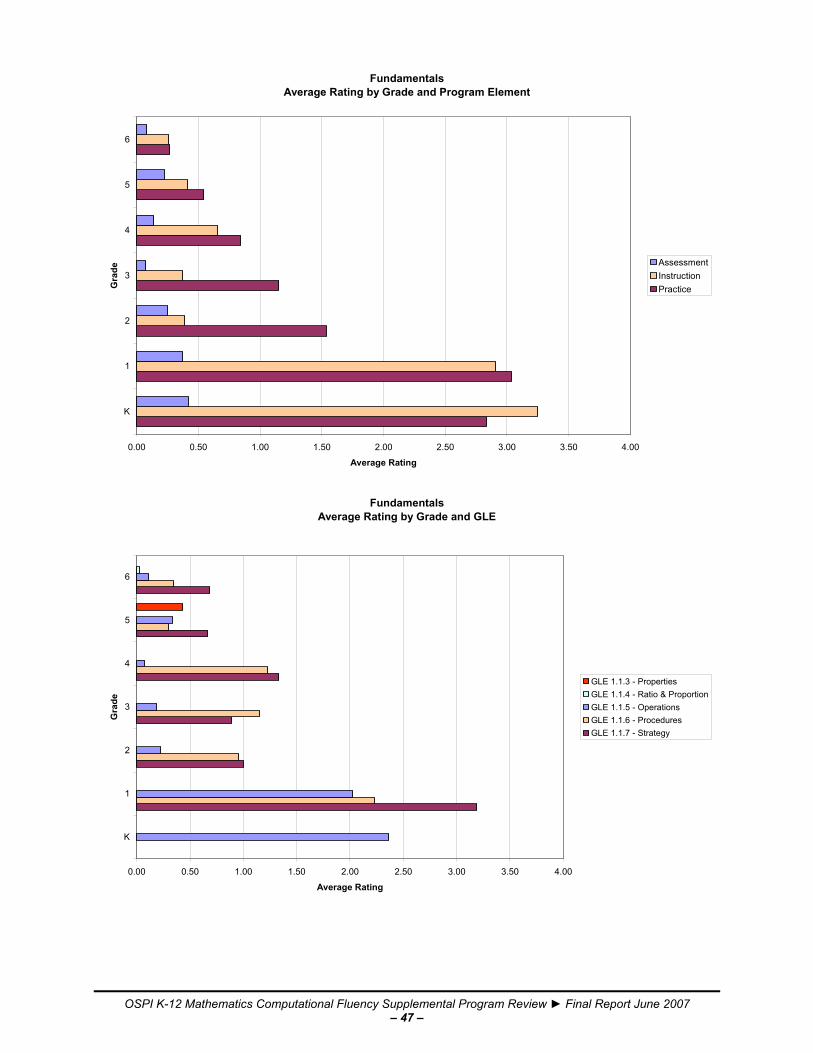
FundamentalsAverage Rating by Grade and Program Element
0.00 0.50 1.00 1.50 2.00 2.50 3.00 3.50 4.00
K
1
2
3
4
5
6
Gra
de
Average Rating
AssessmentInstructionPractice
Fundamentals
Average Rating by Grade and GLE
0.00 0.50 1.00 1.50 2.00 2.50 3.00 3.50 4.00
K
1
2
3
4
5
6
Gra
de
Average Rating
GLE 1.1.3 - PropertiesGLE 1.1.4 - Ratio & ProportionGLE 1.1.5 - OperationsGLE 1.1.6 - ProceduresGLE 1.1.7 - Strategy
OSPI K-12 Mathematics Computational Fluency Supplemental Program Review ► Final Report June 2007 – 48 –
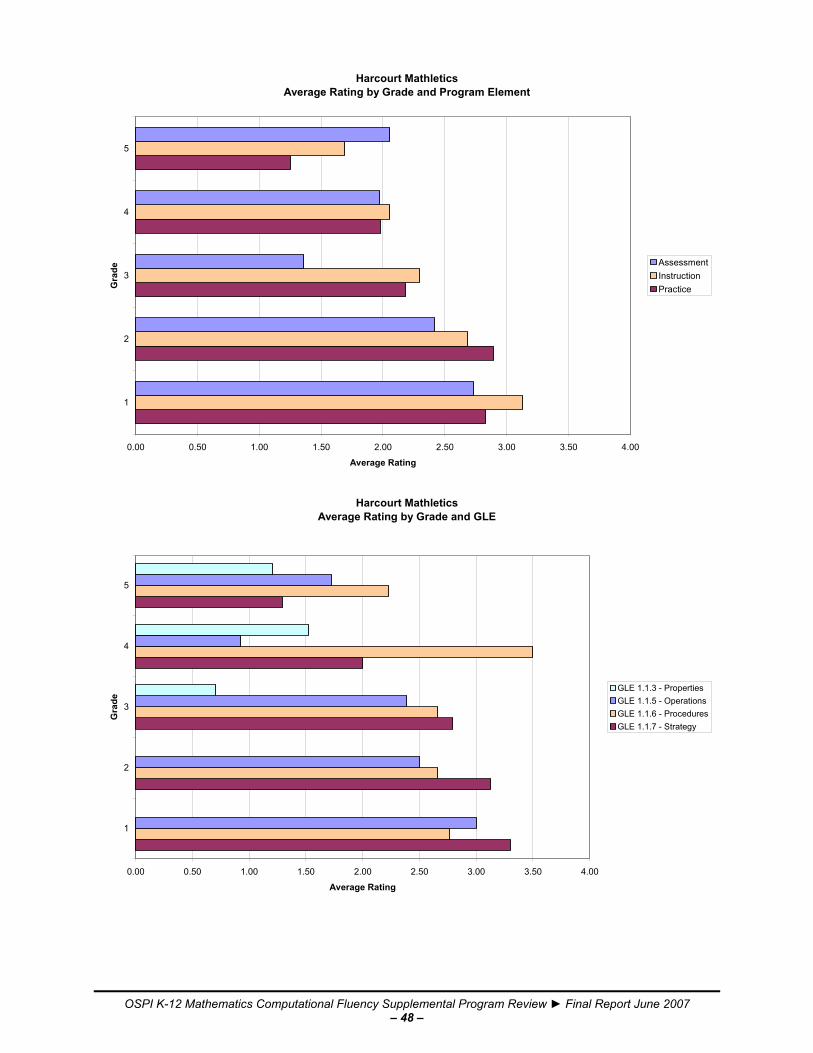
Harcourt MathleticsAverage Rating by Grade and Program Element
0.00 0.50 1.00 1.50 2.00 2.50 3.00 3.50 4.00
1
2
3
4
5
Gra
de
Average Rating
AssessmentInstructionPractice
Harcourt Mathletics
Average Rating by Grade and GLE
0.00 0.50 1.00 1.50 2.00 2.50 3.00 3.50 4.00
1
2
3
4
5
Gra
de
Average Rating
GLE 1.1.3 - PropertiesGLE 1.1.5 - OperationsGLE 1.1.6 - ProceduresGLE 1.1.7 - Strategy

OSPI K-12 Mathematics Computational Fluency Supplemental Program Review ► Final Report June 2007 – 49 –
Larson Learning Math CoursewareAverage Rating by Grade and Program Element
0.00 0.50 1.00 1.50 2.00 2.50 3.00 3.50 4.00
K
1
2
3
4
5
6
7
8
Gra
de
Average Rating
AssessmentInstructionPractice
Larson Learning Math CoursewareAverage Rating by Grade and GLE
0.00 0.50 1.00 1.50 2.00 2.50 3.00 3.50 4.00
K
1
2
3
4
5
6
7
8
Gra
de
Average Rating
GLE 1.1.3 - PropertiesGLE 1.1.4 - Ratio & ProportionGLE 1.1.5 - OperationsGLE 1.1.6 - ProceduresGLE 1.1.7 - Strategy
4
Note 3: The intermediate grades (3–6) were reviewed in a new online version of the program. Reviewers
marked 60% of the data points for those grades “0” with a note of “CNA” – for “could not access. Note 4: Grade 6 was reviewed in the intermediate portion (grades 3–6) of the program only, not in the
pre-algebra portion (grades 6–8).
OSPI K-12 Mathematics Computational Fluency Supplemental Program Review ► Final Report June 2007 – 50 –
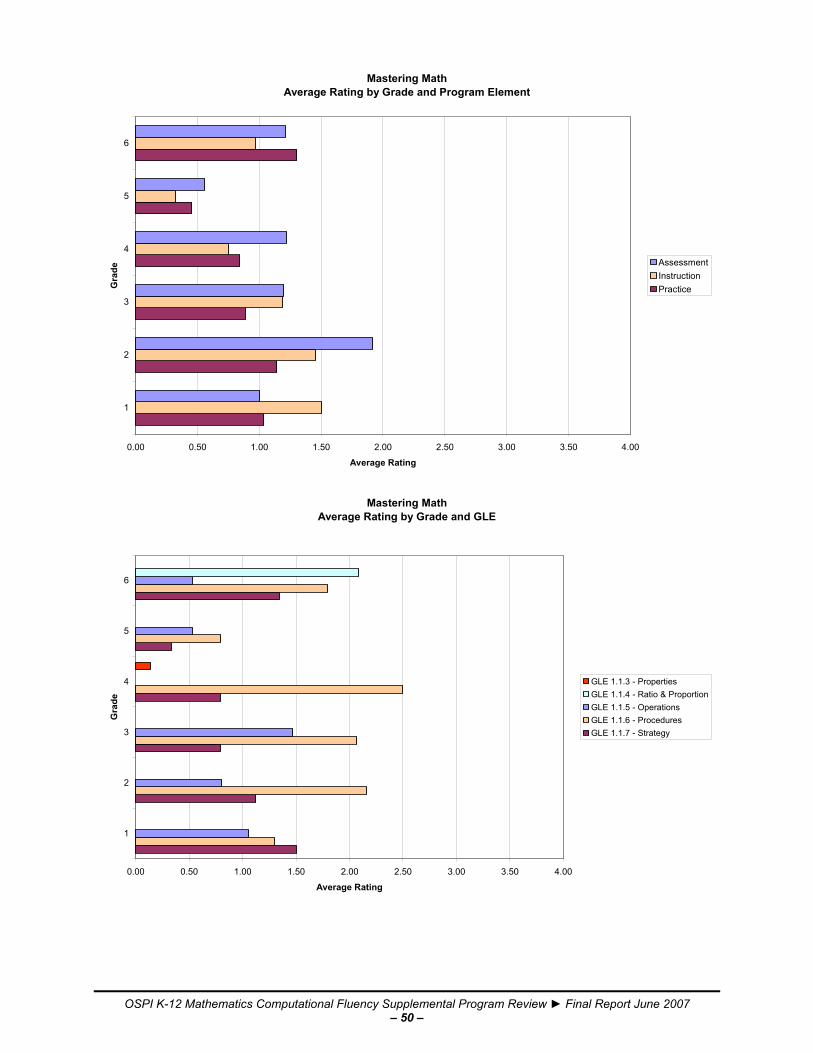
Mastering MathAverage Rating by Grade and Program Element
0.00 0.50 1.00 1.50 2.00 2.50 3.00 3.50 4.00
1
2
3
4
5
6
Gra
de
Average Rating
AssessmentInstructionPractice
Mastering Math
Average Rating by Grade and GLE
0.00 0.50 1.00 1.50 2.00 2.50 3.00 3.50 4.00
1
2
3
4
5
6
Gra
de
Average Rating
GLE 1.1.3 - PropertiesGLE 1.1.4 - Ratio & ProportionGLE 1.1.5 - OperationsGLE 1.1.6 - ProceduresGLE 1.1.7 - Strategy
OSPI K-12 Mathematics Computational Fluency Supplemental Program Review ► Final Report June 2007 – 51 –
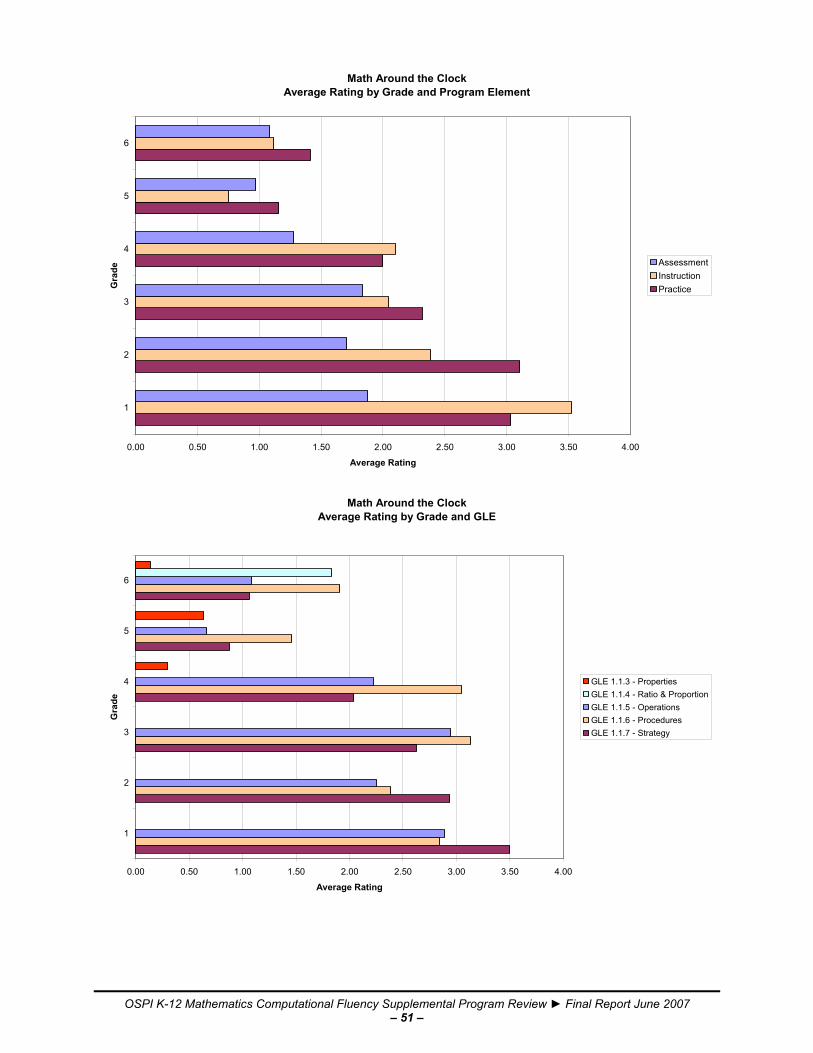
Math Around the ClockAverage Rating by Grade and Program Element
0.00 0.50 1.00 1.50 2.00 2.50 3.00 3.50 4.00
1
2
3
4
5
6
Gra
de
Average Rating
AssessmentInstructionPractice
Math Around the Clock
Average Rating by Grade and GLE
0.00 0.50 1.00 1.50 2.00 2.50 3.00 3.50 4.00
1
2
3
4
5
6
Gra
de
Average Rating
GLE 1.1.3 - PropertiesGLE 1.1.4 - Ratio & ProportionGLE 1.1.5 - OperationsGLE 1.1.6 - ProceduresGLE 1.1.7 - Strategy

OSPI K-12 Mathematics Computational Fluency Supplemental Program Review ► Final Report June 2007 – 52 –
Math Expeditions ▲ Average Rating by Grade and Program Element
(▲ - Computer-based)
0.00 0.50 1.00 1.50 2.00 2.50 3.00 3.50 4.00
K
1
2
3
4
5
6
7
8
Gra
de
Average Rating
AssessmentInstructionPractice
Math Expeditions ▲
Average Rating by Grade and GLE(▲ - Computer-based)
0.00 0.50 1.00 1.50 2.00 2.50 3.00 3.50 4.00
K
1
2
3
4
5
6
7
8
Gra
de
Average Rating
GLE 1.1.3 - PropertiesGLE 1.1.4 - Ratio & ProportionGLE 1.1.5 - OperationsGLE 1.1.6 - ProceduresGLE 1.1.7 - Strategy
OSPI K-12 Mathematics Computational Fluency Supplemental Program Review ► Final Report June 2007 – 53 –
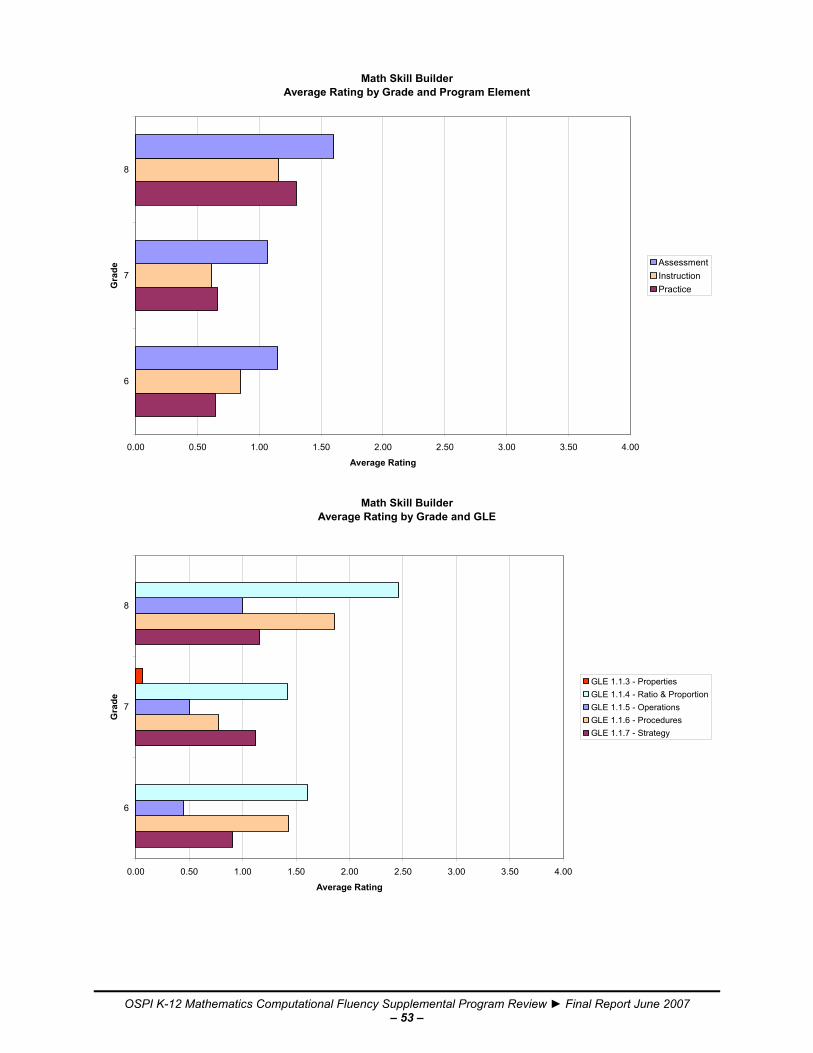
Math Skill BuilderAverage Rating by Grade and Program Element
0.00 0.50 1.00 1.50 2.00 2.50 3.00 3.50 4.00
6
7
8
Gra
de
Average Rating
AssessmentInstructionPractice
Math Skill Builder
Average Rating by Grade and GLE
0.00 0.50 1.00 1.50 2.00 2.50 3.00 3.50 4.00
6
7
8
Gra
de
Average Rating
GLE 1.1.3 - PropertiesGLE 1.1.4 - Ratio & ProportionGLE 1.1.5 - OperationsGLE 1.1.6 - ProceduresGLE 1.1.7 - Strategy
OSPI K-12 Mathematics Computational Fluency Supplemental Program Review ► Final Report June 2007 – 54 –
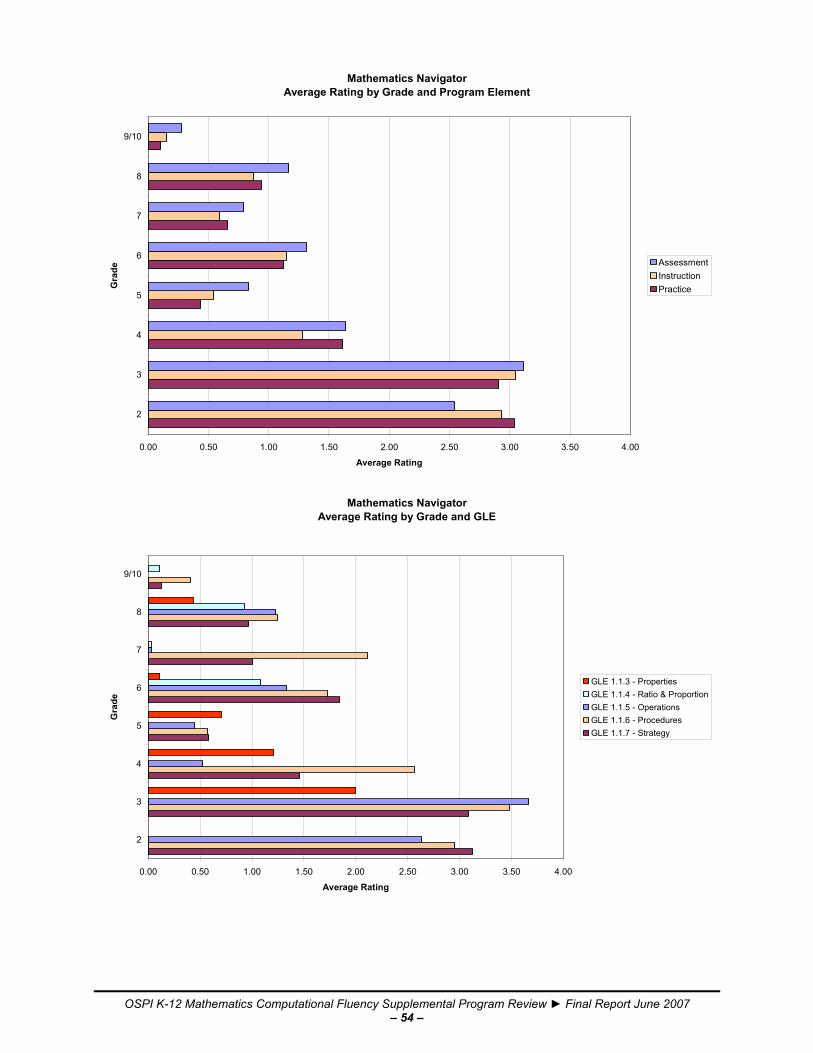
Mathematics NavigatorAverage Rating by Grade and Program Element
0.00 0.50 1.00 1.50 2.00 2.50 3.00 3.50 4.00
2
3
4
5
6
7
8
9/10
Gra
de
Average Rating
AssessmentInstructionPractice
Mathematics Navigator
Average Rating by Grade and GLE
0.00 0.50 1.00 1.50 2.00 2.50 3.00 3.50 4.00
2
3
4
5
6
7
8
9/10
Gra
de
Average Rating
GLE 1.1.3 - PropertiesGLE 1.1.4 - Ratio & ProportionGLE 1.1.5 - OperationsGLE 1.1.6 - ProceduresGLE 1.1.7 - Strategy

OSPI K-12 Mathematics Computational Fluency Supplemental Program Review ► Final Report June 2007 – 55 –
MathementalsAverage Rating by Grade and Program Element
0.00 0.50 1.00 1.50 2.00 2.50 3.00 3.50 4.00
1
2
3
4
5
6
Gra
de
Average Rating
AssessmentInstructionPractice
Mathementals
Average Rating by Grade and GLE
0.00 0.50 1.00 1.50 2.00 2.50 3.00 3.50 4.00
1
2
3
4
5
6
Gra
de
Average Rating
GLE 1.1.3 - PropertiesGLE 1.1.4 - Ratio & ProportionGLE 1.1.5 - OperationsGLE 1.1.6 - ProceduresGLE 1.1.7 - Strategy
OSPI K-12 Mathematics Computational Fluency Supplemental Program Review ► Final Report June 2007 – 56 –
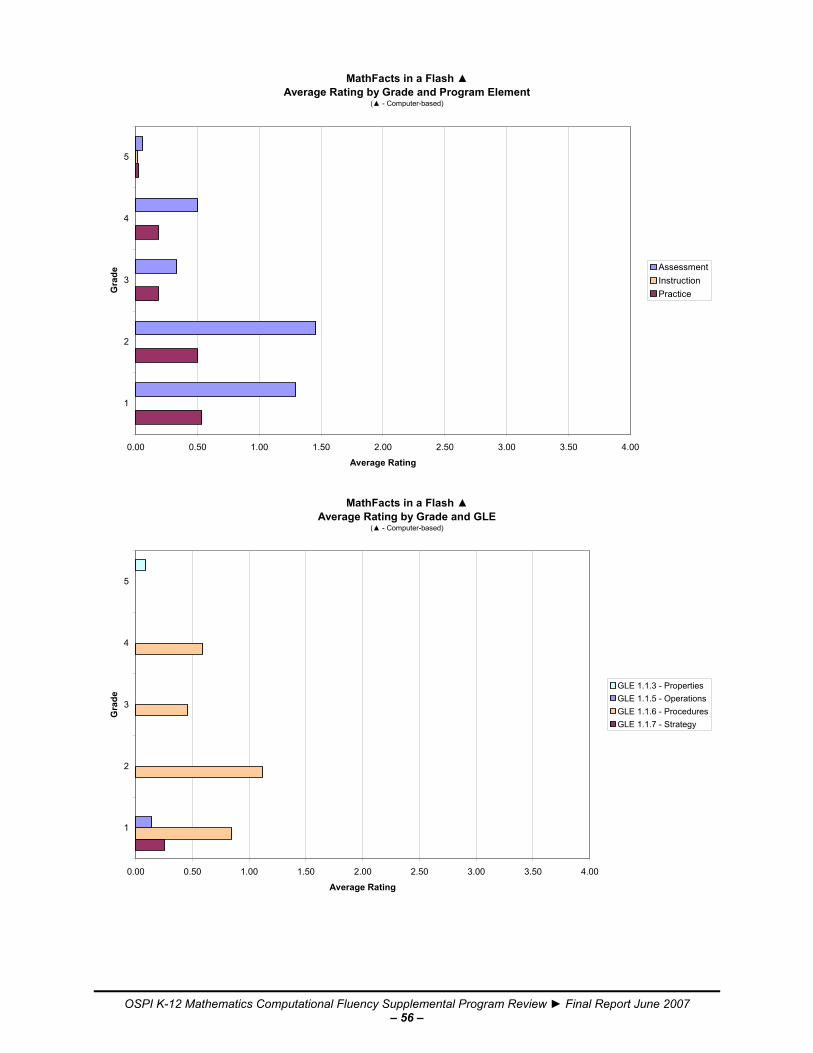
MathFacts in a Flash ▲ Average Rating by Grade and Program Element
(▲ - Computer-based)
0.00 0.50 1.00 1.50 2.00 2.50 3.00 3.50 4.00
1
2
3
4
5
Gra
de
Average Rating
AssessmentInstructionPractice
MathFacts in a Flash ▲
Average Rating by Grade and GLE(▲ - Computer-based)
0.00 0.50 1.00 1.50 2.00 2.50 3.00 3.50 4.00
1
2
3
4
5
Gra
de
Average Rating
GLE 1.1.3 - PropertiesGLE 1.1.5 - OperationsGLE 1.1.6 - ProceduresGLE 1.1.7 - Strategy

OSPI K-12 Mathematics Computational Fluency Supplemental Program Review ► Final Report June 2007 – 57 –
MathStepsAverage Rating by Grade and Program Element
0.00 0.50 1.00 1.50 2.00 2.50 3.00 3.50 4.00
K
1
2
3
4
5
6
7
Gra
de
Average Rating
AssessmentInstructionPractice
MathSteps
Average Rating by Grade and GLE
0.00 0.50 1.00 1.50 2.00 2.50 3.00 3.50 4.00
K
1
2
3
4
5
6
7
Gra
de
Average Rating
GLE 1.1.3 - PropertiesGLE 1.1.4 - Ratio & ProportionGLE 1.1.5 - OperationsGLE 1.1.6 - ProceduresGLE 1.1.7 - Strategy

OSPI K-12 Mathematics Computational Fluency Supplemental Program Review ► Final Report June 2007 – 58 –
MathXL ▲ Average Rating by Grade and Program Element
(▲ - Computer-based)
0.00 0.50 1.00 1.50 2.00 2.50 3.00 3.50 4.00
6
7
8
9/10
11/12
Gra
de
Average Rating
AssessmentInstructionPractice
MathXL ▲
Average Rating by Grade and GLE(▲ - Computer-based)
0.00 0.50 1.00 1.50 2.00 2.50 3.00 3.50 4.00
6
7
8
9/10
11/12
Gra
de
Average Rating
GLE 1.1.3 - PropertiesGLE 1.1.4 - Ratio & ProportionGLE 1.1.5 - OperationsGLE 1.1.6 - ProceduresGLE 1.1.7 - Strategy

OSPI K-12 Mathematics Computational Fluency Supplemental Program Review ► Final Report June 2007 – 59 –
Nimble with NumbersAverage Rating by Grade and Program Element
0.00 0.50 1.00 1.50 2.00 2.50 3.00 3.50 4.00
1
2
3
4
5
6
Gra
de
Average Rating
AssessmentInstructionPractice
Nimble with Numbers
Average Rating by Grade and GLE
0.00 0.50 1.00 1.50 2.00 2.50 3.00 3.50 4.00
1
2
3
4
5
6
Gra
de
Average Rating
GLE 1.1.3 - PropertiesGLE 1.1.4 - Ratio & ProportionGLE 1.1.5 - OperationsGLE 1.1.6 - ProceduresGLE 1.1.7 - Strategy
OSPI K-12 Mathematics Computational Fluency Supplemental Program Review ► Final Report June 2007 – 60 –
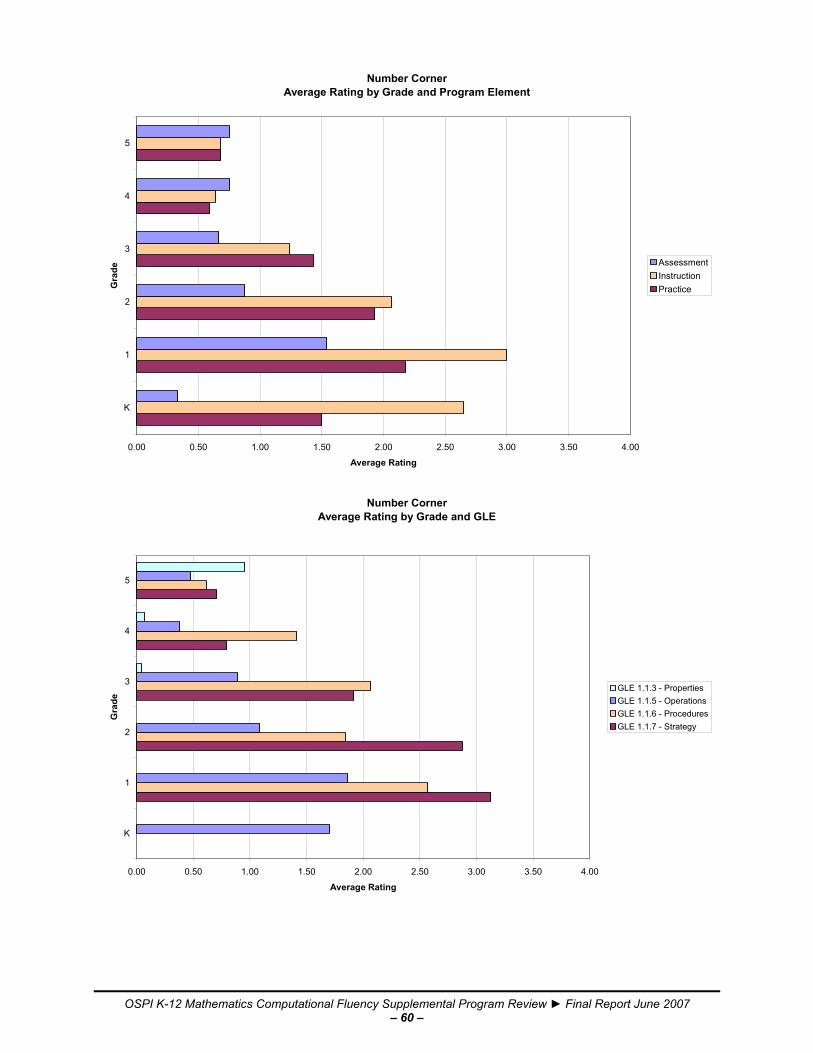
Number CornerAverage Rating by Grade and Program Element
0.00 0.50 1.00 1.50 2.00 2.50 3.00 3.50 4.00
K
1
2
3
4
5
Gra
de
Average Rating
AssessmentInstructionPractice
Number Corner
Average Rating by Grade and GLE
0.00 0.50 1.00 1.50 2.00 2.50 3.00 3.50 4.00
K
1
2
3
4
5
Gra
de
Average Rating
GLE 1.1.3 - PropertiesGLE 1.1.5 - OperationsGLE 1.1.6 - ProceduresGLE 1.1.7 - Strategy
OSPI K-12 Mathematics Computational Fluency Supplemental Program Review ► Final Report June 2007 – 61 –
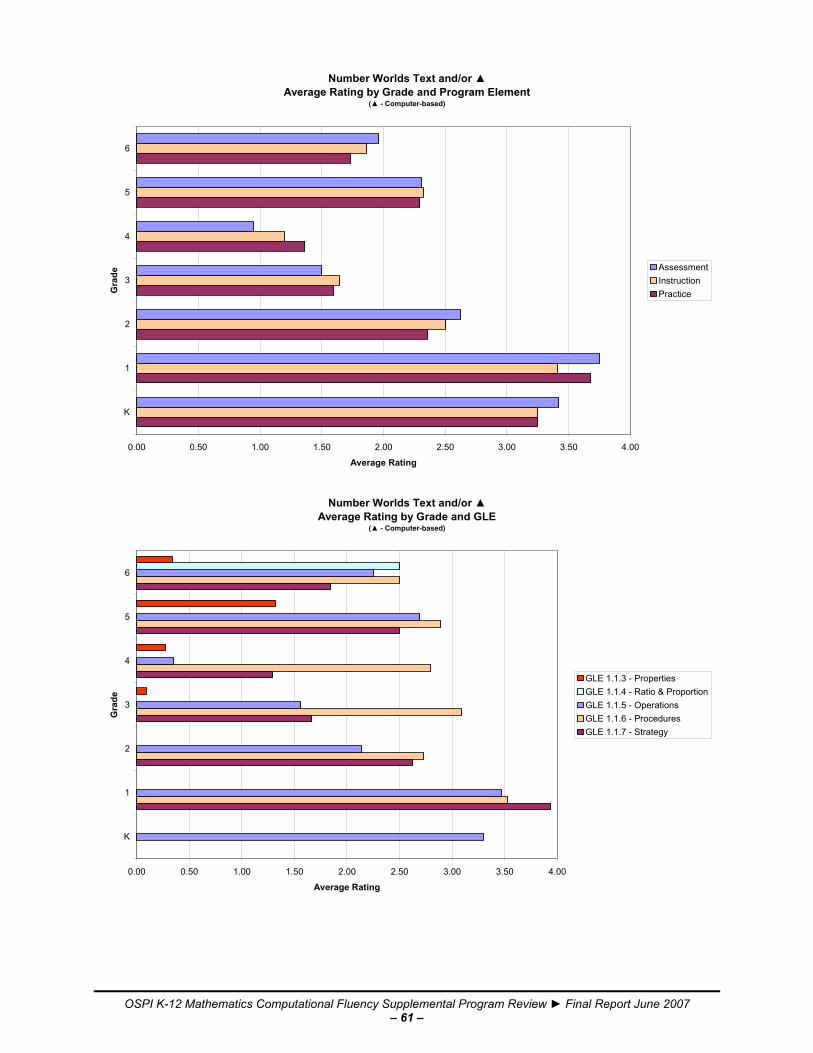
Number Worlds Text and/or ▲Average Rating by Grade and Program Element
(▲ - Computer-based)
0.00 0.50 1.00 1.50 2.00 2.50 3.00 3.50 4.00
K
1
2
3
4
5
6
Gra
de
Average Rating
AssessmentInstructionPractice
Number Worlds Text and/or ▲
Average Rating by Grade and GLE(▲ - Computer-based)
0.00 0.50 1.00 1.50 2.00 2.50 3.00 3.50 4.00
K
1
2
3
4
5
6
Gra
de
Average Rating
GLE 1.1.3 - PropertiesGLE 1.1.4 - Ratio & ProportionGLE 1.1.5 - OperationsGLE 1.1.6 - ProceduresGLE 1.1.7 - Strategy
OSPI K-12 Mathematics Computational Fluency Supplemental Program Review ► Final Report June 2007 – 62 –
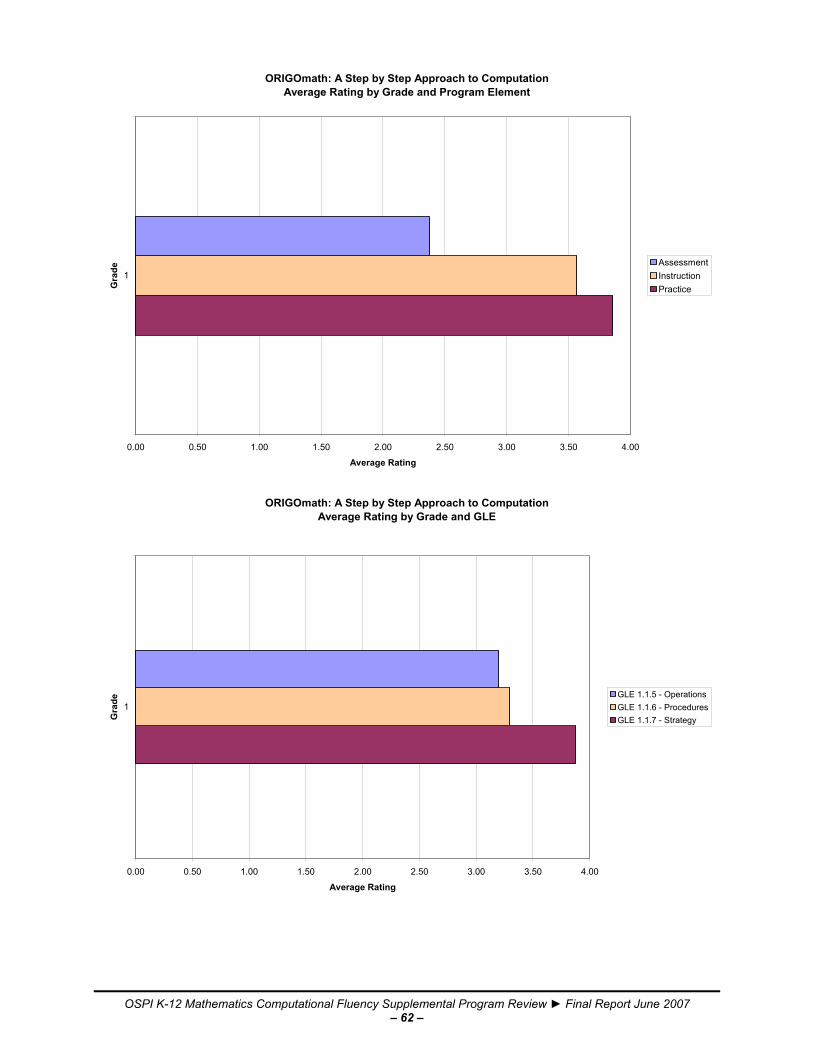
ORIGOmath: A Step by Step Approach to ComputationAverage Rating by Grade and Program Element
0.00 0.50 1.00 1.50 2.00 2.50 3.00 3.50 4.00
1
Gra
de
Average Rating
AssessmentInstructionPractice
ORIGOmath: A Step by Step Approach to Computation
Average Rating by Grade and GLE
0.00 0.50 1.00 1.50 2.00 2.50 3.00 3.50 4.00
1
Gra
de
Average Rating
GLE 1.1.5 - OperationsGLE 1.1.6 - ProceduresGLE 1.1.7 - Strategy
OSPI K-12 Mathematics Computational Fluency Supplemental Program Review ► Final Report June 2007 – 63 –
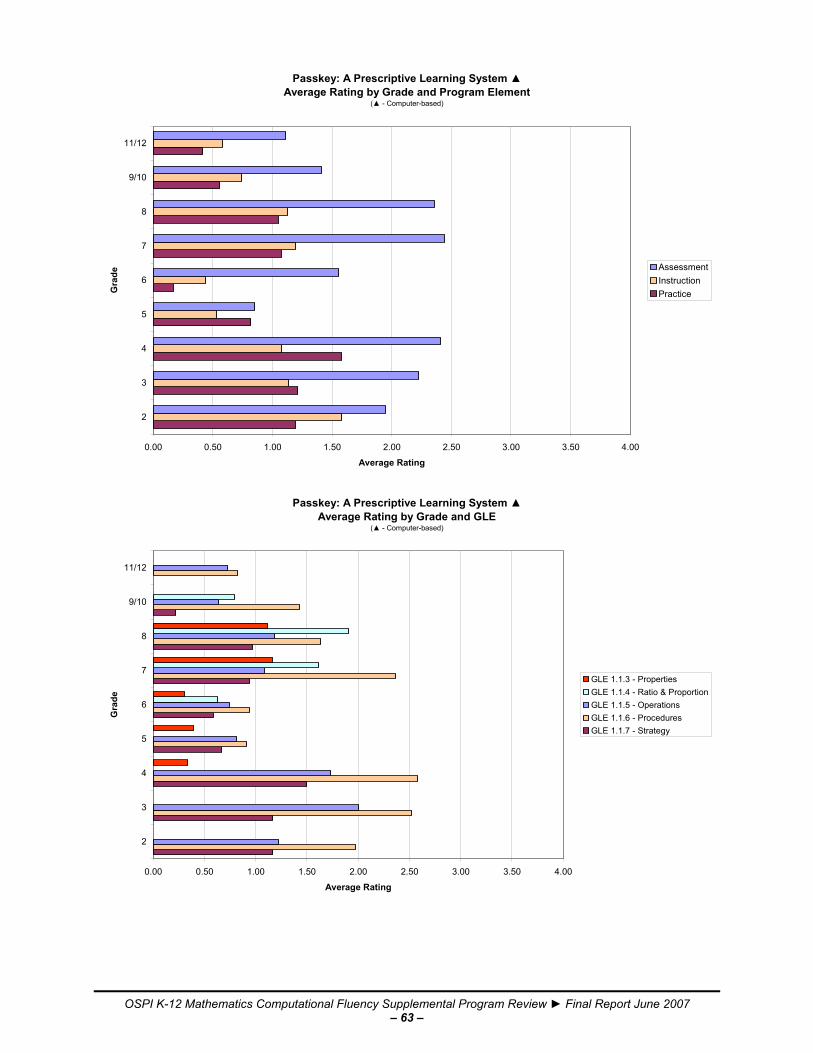
Passkey: A Prescriptive Learning System ▲ Average Rating by Grade and Program Element
(▲ - Computer-based)
0.00 0.50 1.00 1.50 2.00 2.50 3.00 3.50 4.00
2
3
4
5
6
7
8
9/10
11/12
Gra
de
Average Rating
AssessmentInstructionPractice
Passkey: A Prescriptive Learning System ▲
Average Rating by Grade and GLE(▲ - Computer-based)
0.00 0.50 1.00 1.50 2.00 2.50 3.00 3.50 4.00
2
3
4
5
6
7
8
9/10
11/12
Gra
de
Average Rating
GLE 1.1.3 - PropertiesGLE 1.1.4 - Ratio & ProportionGLE 1.1.5 - OperationsGLE 1.1.6 - ProceduresGLE 1.1.7 - Strategy

OSPI K-12 Mathematics Computational Fluency Supplemental Program Review ► Final Report June 2007 – 64 –
Skills Intervention KitAverage Rating by Grade and Program Element
0.00 0.50 1.00 1.50 2.00 2.50 3.00 3.50 4.00
6
7
8
9/10
Gra
de
Average Rating
AssessmentInstructionPractice
Skills Intervention Kit
Average Rating by Grade and GLE
0.00 0.50 1.00 1.50 2.00 2.50 3.00 3.50 4.00
6
7
8
9/10
Gra
de
Average Rating
GLE 1.1.3 - PropertiesGLE 1.1.4 - Ratio & ProportionGLE 1.1.5 - OperationsGLE 1.1.6 - ProceduresGLE 1.1.7 - Strategy
OSPI K-12 Mathematics Computational Fluency Supplemental Program Review ► Final Report June 2007 – 65 –
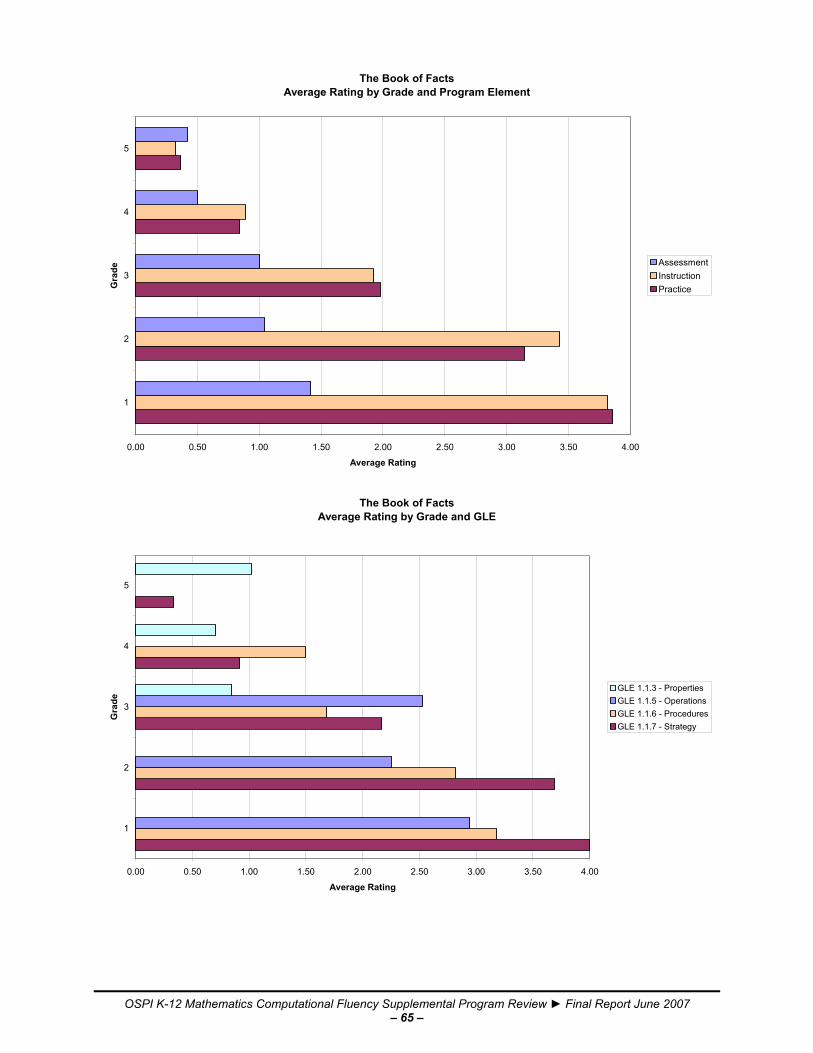
The Book of FactsAverage Rating by Grade and Program Element
0.00 0.50 1.00 1.50 2.00 2.50 3.00 3.50 4.00
1
2
3
4
5
Gra
de
Average Rating
AssessmentInstructionPractice
The Book of Facts
Average Rating by Grade and GLE
0.00 0.50 1.00 1.50 2.00 2.50 3.00 3.50 4.00
1
2
3
4
5
Gra
de
Average Rating
GLE 1.1.3 - PropertiesGLE 1.1.5 - OperationsGLE 1.1.6 - ProceduresGLE 1.1.7 - Strategy

OSPI K-12 Mathematics Computational Fluency Supplemental Program Review ► Final Report June 2007 – 66 –
The Box of FactsAverage Rating by Grade and Program Element
0.00 0.50 1.00 1.50 2.00 2.50 3.00 3.50 4.00
1
2
3
4
5
6
Gra
de
Average Rating
AssessmentInstructionPractice
The Box of Facts
Average Rating by Grade and GLE
0.00 0.50 1.00 1.50 2.00 2.50 3.00 3.50 4.00
1
2
3
4
5
6
Gra
de
Average Rating
GLE 1.1.3 - PropertiesGLE 1.1.4 - Ratio & ProportionGLE 1.1.5 - OperationsGLE 1.1.6 - ProceduresGLE 1.1.7 - Strategy

OSPI K-12 Mathematics Computational Fluency Supplemental Program Review ► Final Report June 2007 – 67 –
The Think TankAverage Rating by Grade and Program Element
0.00 0.50 1.00 1.50 2.00 2.50 3.00 3.50 4.00
2
3
4
5
6
Gra
de
Average Rating
AssessmentInstructionPractice
The Think Tank
Average Rating by Grade and GLE
0.00 0.50 1.00 1.50 2.00 2.50 3.00 3.50 4.00
2
3
4
5
6
Gra
de
Average Rating
GLE 1.1.3 - PropertiesGLE 1.1.4 - Ratio & ProportionGLE 1.1.5 - OperationsGLE 1.1.6 - ProceduresGLE 1.1.7 - Strategy
OSPI K-12 Mathematics Computational Fluency Supplemental Program Review ► Final Report June 2007 – 68 –
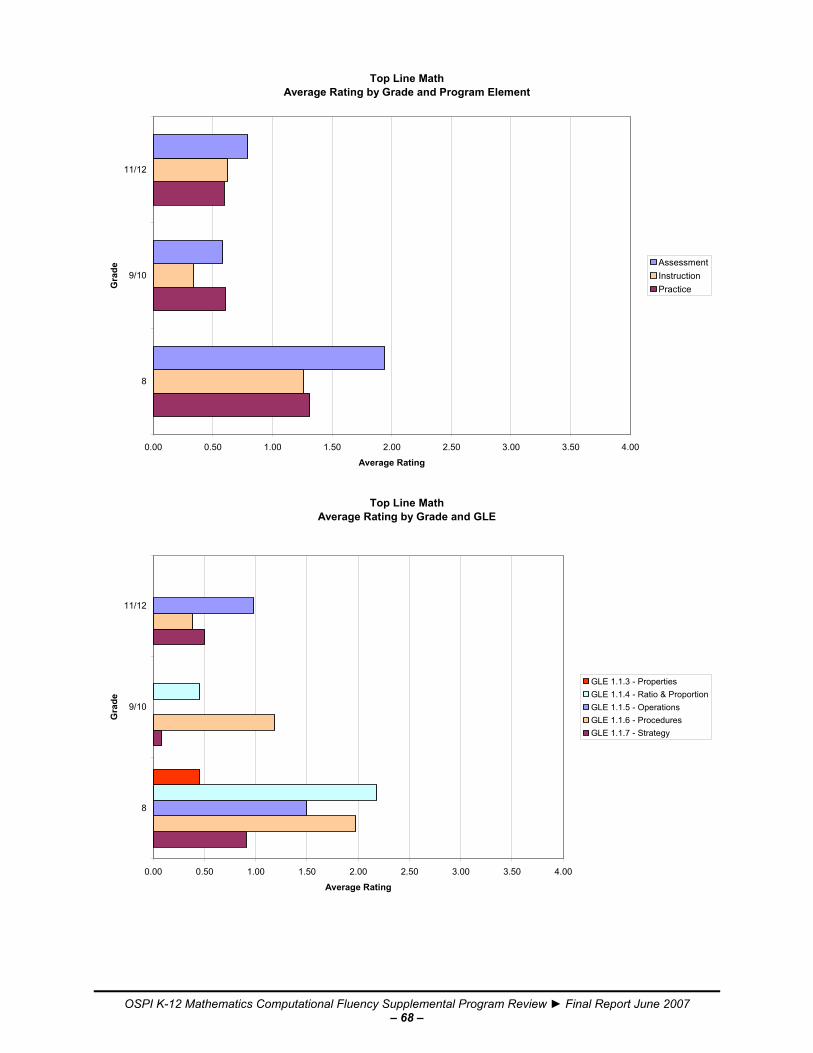
Top Line MathAverage Rating by Grade and Program Element
0.00 0.50 1.00 1.50 2.00 2.50 3.00 3.50 4.00
8
9/10
11/12
Gra
de
Average Rating
AssessmentInstructionPractice
Top Line Math
Average Rating by Grade and GLE
0.00 0.50 1.00 1.50 2.00 2.50 3.00 3.50 4.00
8
9/10
11/12
Gra
de
Average Rating
GLE 1.1.3 - PropertiesGLE 1.1.4 - Ratio & ProportionGLE 1.1.5 - OperationsGLE 1.1.6 - ProceduresGLE 1.1.7 - Strategy

OSPI K-12 Mathematics Computational Fluency Supplemental Program Review ► Final Report June 2007 – 69 –
Working with NumbersAverage Rating by Grade and Program Element
0.00 0.50 1.00 1.50 2.00 2.50 3.00 3.50 4.00
1
2
3
4
5
6
Gra
de
Average Rating
AssessmentInstructionPractice
Working With Numbers
Average Rating by Grade and GLE
0.00 0.50 1.00 1.50 2.00 2.50 3.00 3.50 4.00
1
2
3
4
5
6
Gra
de
Average Rating
GLE 1.1.3 - PropertiesGLE 1.1.4 - Ratio & ProportionGLE 1.1.5 - OperationsGLE 1.1.6 - ProceduresGLE 1.1.7 - Strategy

OSPI K-12 Mathematics Computational Fluency Supplemental Program Review ► Final Report June 2007 – 70 –
OSPI K-12 Mathematics Computational Fluency Supplemental Program Review ► Final Report June 2007 – 71 –
Part 2: Program Feature Review
In addition to mathematical content, assessment, instruction, and practice, an effective mathematics computational fluency supplemental program includes components that make it accessible for teachers and to students. (See Appendix C.)
1. Assessment
The program provides a variety of assessments that measure the understanding and application of concepts, strategies, procedures, and algorithms taught within the program at strategic points in time (pre-assessment, formative, and summative assessment). It provides guidelines to teachers for using assessments to differentiate instruction and report progress.
2. Explicit Instructional Guidance Explicit instructional guidance includes various aspects of explicit and clear support for the teacher and for the student. Reviewers reviewed programs for ease and clarity of use, guidance for pacing, coherence within its component parts, and instructional options based on frequent monitoring and feedback of student performance.
3. Program Design
The design facilitates easily using all program components in an efficacious manner that is mathematically accurate.
4. Universal Access/Cultural Relevance
The program offers a variety of options for moving students to the standards. Such options include scaffolding techniques, English Language Learner (ELL) strategies, and using age appropriate illustrations, examples, and contexts.
OSPI K-12 Mathematics Computational Fluency Supplemental Program Review ► Final Report June 2007 – 72 –
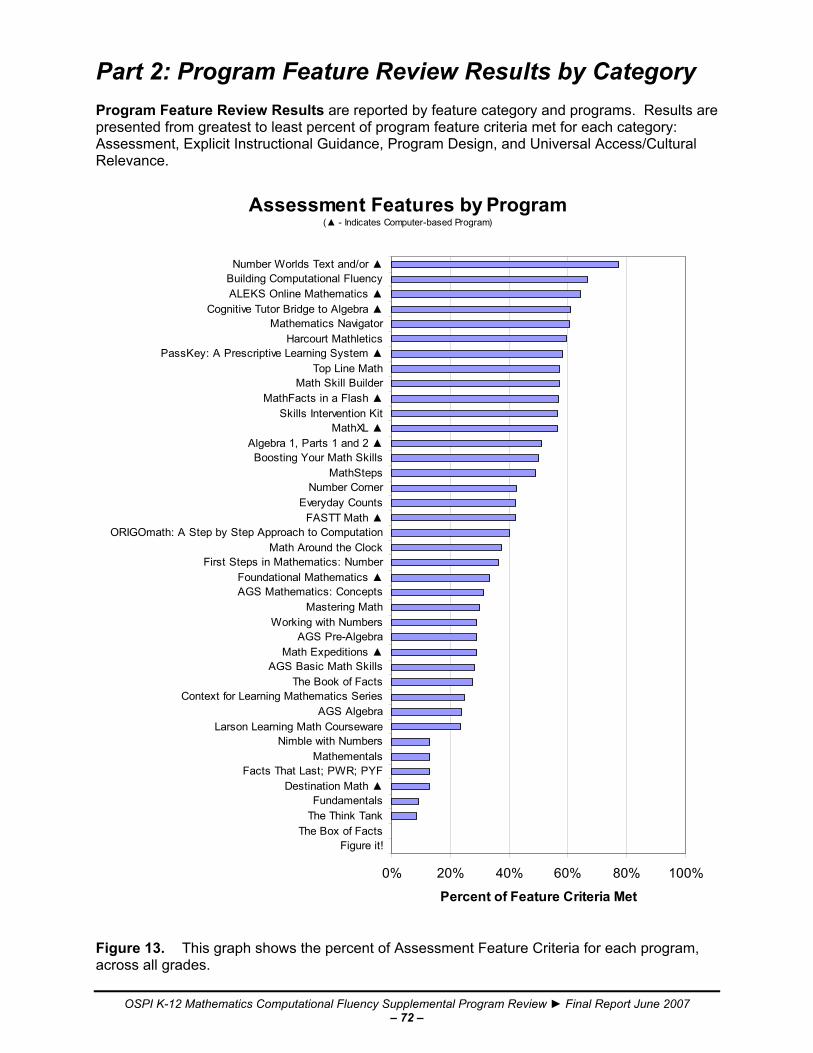
Part 2: Program Feature Review Results by Category Program Feature Review Results are reported by feature category and programs. Results are presented from greatest to least percent of program feature criteria met for each category: Assessment, Explicit Instructional Guidance, Program Design, and Universal Access/Cultural Relevance.
Assessment Features by Program(▲ - Indicates Computer-based Program)
0% 20% 40% 60% 80% 100%
Figure it!The Box of Facts
The Think TankFundamentals
Destination Math ▲Facts That Last; PWR; PYF
MathementalsNimble with Numbers
Larson Learning Math CoursewareAGS Algebra
Context for Learning Mathematics SeriesThe Book of Facts
AGS Basic Math SkillsMath Expeditions ▲
AGS Pre-AlgebraWorking with Numbers
Mastering MathAGS Mathematics: ConceptsFoundational Mathematics ▲
First Steps in Mathematics: NumberMath Around the Clock
ORIGOmath: A Step by Step Approach to ComputationFASTT Math ▲
Everyday CountsNumber Corner
MathStepsBoosting Your Math Skills
Algebra 1, Parts 1 and 2 ▲MathXL ▲
Skills Intervention KitMathFacts in a Flash ▲
Math Skill BuilderTop Line Math
PassKey: A Prescriptive Learning System ▲Harcourt Mathletics
Mathematics NavigatorCognitive Tutor Bridge to Algebra ▲
ALEKS Online Mathematics ▲Building Computational FluencyNumber Worlds Text and/or ▲
Percent of Feature Criteria Met
Figure 13. This graph shows the percent of Assessment Feature Criteria for each program, across all grades.
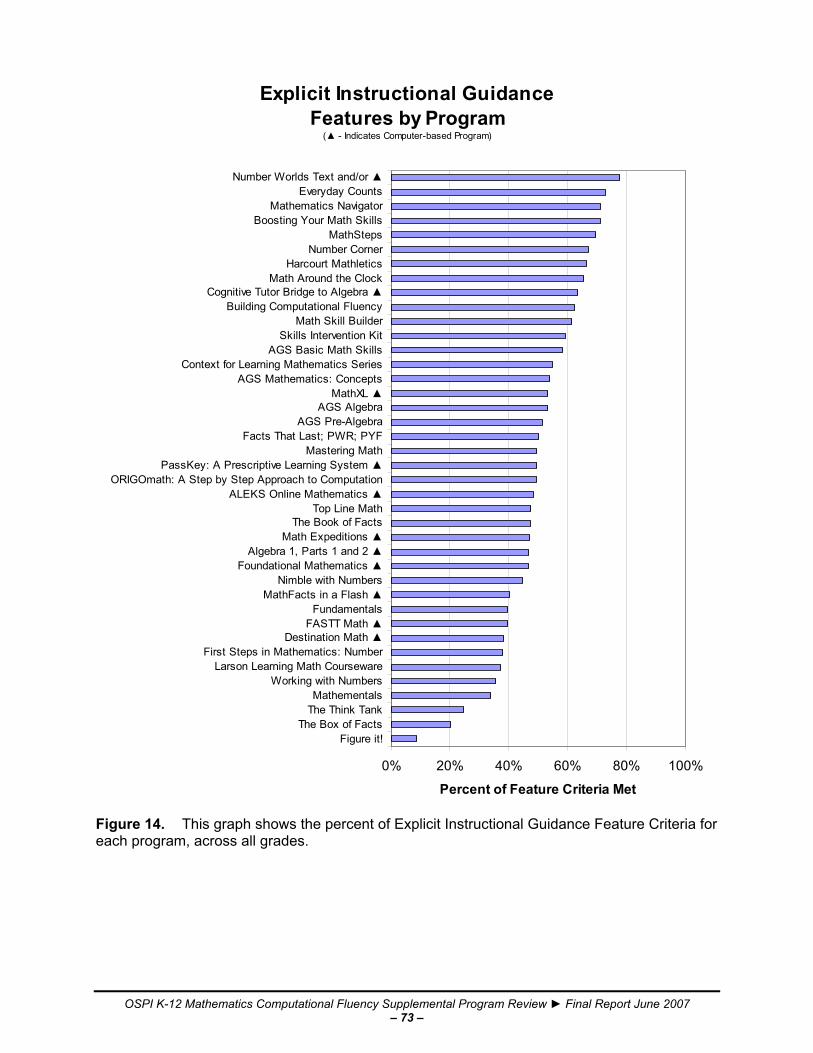
OSPI K-12 Mathematics Computational Fluency Supplemental Program Review ► Final Report June 2007 – 73 –
Explicit Instructional GuidanceFeatures by Program
(▲ - Indicates Computer-based Program)
0% 20% 40% 60% 80% 100%
Figure it!The Box of Facts
The Think TankMathementals
Working with NumbersLarson Learning Math Courseware
First Steps in Mathematics: NumberDestination Math ▲
FASTT Math ▲Fundamentals
MathFacts in a Flash ▲Nimble with Numbers
Foundational Mathematics ▲Algebra 1, Parts 1 and 2 ▲
Math Expeditions ▲The Book of Facts
Top Line MathALEKS Online Mathematics ▲
ORIGOmath: A Step by Step Approach to ComputationPassKey: A Prescriptive Learning System ▲
Mastering MathFacts That Last; PWR; PYF
AGS Pre-AlgebraAGS Algebra
MathXL ▲AGS Mathematics: Concepts
Context for Learning Mathematics SeriesAGS Basic Math Skills
Skills Intervention KitMath Skill Builder
Building Computational FluencyCognitive Tutor Bridge to Algebra ▲
Math Around the ClockHarcourt Mathletics
Number CornerMathSteps
Boosting Your Math SkillsMathematics Navigator
Everyday CountsNumber Worlds Text and/or ▲
Percent of Feature Criteria Met
Figure 14. This graph shows the percent of Explicit Instructional Guidance Feature Criteria for each program, across all grades.
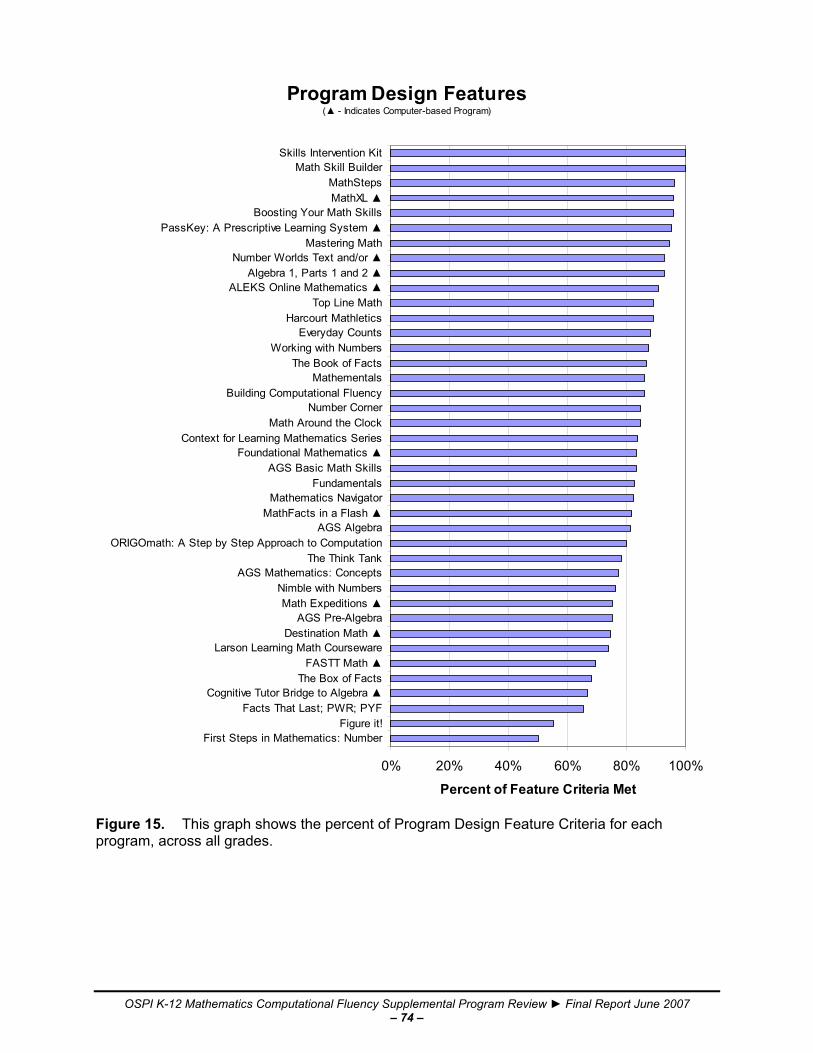
OSPI K-12 Mathematics Computational Fluency Supplemental Program Review ► Final Report June 2007 – 74 –
Program Design Features(▲ - Indicates Computer-based Program)
0% 20% 40% 60% 80% 100%
First Steps in Mathematics: NumberFigure it!
Facts That Last; PWR; PYFCognitive Tutor Bridge to Algebra ▲
The Box of FactsFASTT Math ▲
Larson Learning Math CoursewareDestination Math ▲
AGS Pre-AlgebraMath Expeditions ▲
Nimble with NumbersAGS Mathematics: Concepts
The Think TankORIGOmath: A Step by Step Approach to Computation
AGS AlgebraMathFacts in a Flash ▲
Mathematics NavigatorFundamentals
AGS Basic Math SkillsFoundational Mathematics ▲
Context for Learning Mathematics SeriesMath Around the Clock
Number CornerBuilding Computational Fluency
MathementalsThe Book of Facts
Working with NumbersEveryday Counts
Harcourt MathleticsTop Line Math
ALEKS Online Mathematics ▲Algebra 1, Parts 1 and 2 ▲
Number Worlds Text and/or ▲Mastering Math
PassKey: A Prescriptive Learning System ▲Boosting Your Math Skills
MathXL ▲MathSteps
Math Skill BuilderSkills Intervention Kit
Percent of Feature Criteria Met
Figure 15. This graph shows the percent of Program Design Feature Criteria for each program, across all grades.

OSPI K-12 Mathematics Computational Fluency Supplemental Program Review ► Final Report June 2007 – 75 –
Universal Access/Cultural RelevanceFeatures by Program
(▲ - Indicates Computer-based Program)
0% 20% 40% 60% 80% 100%
The Box of FactsFigure it!
MathFacts in a Flash ▲Working with Numbers
Nimble with NumbersThe Think Tank
Math Skill BuilderFirst Steps in Mathematics: Number
Mastering MathMathementalsFundamentals
Boosting Your Math SkillsFASTT Math ▲
Facts That Last; PWR; PYFSkills Intervention Kit
The Book of FactsBuilding Computational Fluency
AGS Basic Math SkillsMath Around the Clock
Foundational Mathematics ▲AGS Pre-Algebra
Destination Math ▲Math Expeditions ▲
AGS Mathematics: ConceptsHarcourt Mathletics
AGS AlgebraCognitive Tutor Bridge to Algebra ▲
Top Line MathPassKey: A Prescriptive Learning System ▲
ORIGOmath: A Step by Step Approach toALEKS Online Mathematics ▲
MathStepsContext for Learning Mathematics Series
Number CornerMathXL ▲
Mathematics NavigatorLarson Learning Math Courseware
Algebra 1, Parts 1 and 2 ▲Everyday Counts
Number Worlds Text and/or ▲
Percent of Feature Criteria Met
Figure 16. This graph shows the percent of Universal Access/Cultural Relevance Feature Criteria for each program, across all grades.

OSPI K-12 Mathematics Computational Fluency Supplemental Program Review ► Final Report June 2007 – 76 –

OSPI K-12 Mathematics Computational Fluency Supplemental Program Review ► Final Report June 2007 – 77 –
Appendix A: Resources Office of Superintendent of Public Instruction, Using Response to Intervention (RTI) for
Washington’s Students, Office of Superintendent of Public Instruction, Olympia, Washington, 2006, http://www.k12.wa.us/SpecialEd/RTI.aspx.
Response to Intervention and the Three-Tiered Model The Three-Tiered Model is grounded in assessment data that is collected and immediately analyzed and interpreted for strategically planning targeted instruction. Key instructional decisions are based on data from assessments. The Three-Tiered Model includes pre-assessments (screening and diagnostic), formative assessment, progress monitoring, and summative assessments (outcome or performance). In the Three-Tiered Model, assessment is done more frequently with students who struggle (Tier II and III). Tier I All students receive core classroom instruction and prevention. Tier II Struggling students receive strategic instruction approximately three times a week
in addition to core classroom instruction. Tier III Students who continue to struggle in spite of Tier II services receive intensive
intervention approximately one to two hours a day in addition to core classroom instruction.
The Response to Intervention (RTI) manual, Using Response to Intervention for Washington’s Students, explains and provides guidelines for the use of a multi-tiered problem-solving approach (including the Three-Tiered Model). It is designed to bring high quality instruction to all students. “RTI is the practice of (1) providing high-quality instruction/intervention matched to student needs and (2) using learning rate over time and level of performance to (3) make important educational decisions to guide instruction.” (National Association of State Directors of Special Education 2005)
OSPI K-12 Mathematics Computational Fluency Supplemental Program Review ► Final Report June 2007 – 78 –
Appendix A: Resources Office of Superintendent of Public Instruction, Washington Mathematics K–12 Grade Level
Expectations, ed. 2, Office of Superintendent of Public Instruction, Olympia, Washington, 2006, http://www.k12.wa.us/assessment/WASL/mathematics/MathGLEDraft.aspx.
Reviews of current research as to the efficacy of mathematics programs are periodically updated at these Web sites: Metiri Group, Technology Solutions That Work,
http://www.k12.wa.us/EdTech/whatworks.aspx. This database provides a comprehensive analysis of what research says works and does not work with software intended to increase academic achievement in mathematics, especially for at-risk students. It also gives information about the targeted audience for which the programs were designed to impact. This resource is free to educators throughout the state of Washington. Availability of this database does not imply endorsement by OSPI of any software programs listed, but rather is intended to be a resource to assist districts and schools in their consideration of software purchases. In order to access the information contained on this site, it is necessary to obtain a ‘token’ from your district technology or mathematics specialist. If your district does not have a token, please contact your regional Educational Technology Support Center (ETSC) director at http://www.edtech.wednet.edu/etsccorner/directory.shtml or the Mathematics or Educational Technology office at OSPI. For more information on technology and learning, visit the OSPI Education Technology Web site link to http://www.k12.wa.us/EdTech/whatworks.aspx. For additional "how-to" directions on getting started with the database, go to http://www.edtech.wednet.edu/resources/metiri/.
Slavin, Robert E., and Lake, Cynthia, “Effective Programs in Elementary Mathematics: A
Best Evidence Synthesis”, The Best Evidence Encyclopedia, Johns Hopkins University, http://www.bestevidence.org/math/math_summary.htm. What mathematics programs have been proven to help elementary students to succeed? To find out, this review summarizes evidence on three types of programs designed to improve the mathematics achievement of students in grades K–6: Mathematics Curricula (MC), such as Everyday Mathematics, Saxon Math, and other
standard and alternative textbooks. Computer assisted instruction (CAI), such as Jostens/Compass Learning and
SuccessMaker. Instructional process programs (IP), such as cooperative learning, classroom
management programs, and other approaches primarily intended to change teachers’ instructional strategies rather than curriculum or textbooks.
U.S. Department of Education, What Works Clearinghouse,
http://www.whatworksclearinghouse.org/Topic.asp?tid=04&ReturnPage=default.aspx. The What Works Clearinghouse (WWC) review of this topic focuses on math curricula designed for use in elementary schools with attention to student outcomes related to math achievement. Elementary school is defined in this review as a school with any of the six grades, kindergarten through fifth grade. Elementary school math curricula are math programs that specify clear learning goals for students; extend over the course of a semester or more; are central to students’ regular instruction; and are based on text materials, manipulatives, computer software, videotapes, other materials, or any combination thereof. Closely related programs such as supplemental math programs, and instructional practices such as computer-assisted instruction, may be addressed in future WWC reviews, but are not included in the current review.
OSPI K-12 Mathematics Computational Fluency Supplemental Program Review ► Final Report June 2007 – 79 –
Appendix B: Publisher Notice
Publisher Notice Office of Superintendent of Public Instruction
K–12 Mathematics Computational Fluency Supplemental Program Review
Spring 2007 Publisher Notice: February 9, 2007 In March 2007, the Office of Superintendent of Public Instruction (OSPI) will review supplemental programs that are designed to increase computational fluency for students in kindergarten through high school. As defined in the Principles and Standards for School Mathematics (NCTM 2000–2004), “Computational fluency – having and using efficient and accurate methods for computing – is essential. Students should be able to perform computations in different ways, including mental calculations, estimation, and paper-and-pencil calculations using mathematically sound algorithms… Computational fluency should develop in tandem with understanding.” Publishers are invited to indicate an Intent to Submit any supplemental program that addresses foundational skills and concepts that develop fluency with operations with at least one of the following: whole numbers, fractions, mixed numbers, decimals, and percentages. Dates: March 25–30, 2007 Location: TBA Submission of Instructional Materials for Evaluation The program review will include only mathematics computational fluency supplemental instruction materials. The programs should meet this definition: they are tools that teachers use in tandem with, or in addition to, the core/comprehensive mathematics program to ensure that students meet or exceed grade level standards in computation. Core/comprehensive mathematics programs will not be considered in this review. Master Price Agreement Publishers must be willing to participate in a Master Price Agreement with OSPI if, as a result of the review process, the programs meet or exceed standards determined in the review process. Standards for the Review Process Standards for the review process are being developed from a review of research on the development of computational fluency. Those standards will include:
OSPI K-12 Mathematics Computational Fluency Supplemental Program Review ► Final Report June 2007 – 80 –
Appendix B: Publisher Notice Characteristics of Effective Computational Fluency Programs A computational fluency program needs to facilitate:
Development of meaning for numbers and operations. Recognizing the relationships among numbers and operations. Understanding computational strategies and using them appropriately and efficiently. Making sense of numerical and quantitative situations.
A computational fluency program needs to provide:
Opportunity for students to develop strategies for learning math facts AND explicit strategy intstruction.
Practice of known facts to develop automaticity. Practice using known computational procedures on the whole range of problems on
which the procedures may be used. Knowledge of progress over practice sessions.
The Program Information Document, Program Computational Fluency Matrix and the program materials will serve as the foundation for the review process for each program. (NOT a Publisher Self-Study Document as used previously in some OSPI reviews) accompanies the Publisher Notice – see also the SAMPLE Program Computational Fluency Matrix – both located at http://www.k12.wa.us/CurriculumInstruct/publishernotices.aspx). The results of the program review are the sole judgment of the OSPI review panel members. Scores assigned by the reviewers shall be final. There is not an appeals process. Publisher representatives will not present materials to, or have conversations with, any reviewers. Publishers will not be present during the week when panel members are evaluating materials. We ask that publisher representatives identify how the Review Manager, Karrin Lewis, may reach them during the review week to answer any questions that may arise. Preliminary results of the review will be shared at a Publisher Representative Meeting on May 21, 2007, location and time to be announced.

OSPI K-12 Mathematics Computational Fluency Supplemental Program Review ► Final Report June 2007 – 81 –
Appendix B: Publisher Notice Step One: Publisher Notice of Intent to Submit Materials and
Program Information Document Due: March 5, 2007, 4 p.m. We respectfully require that publishers complete the following information by email:
1. Notify OSPI via email at [email protected] to confirm your Intent to Submit
programs for review. Please send a separate Intent to Submit for each program to be reviewed.
2. Include in your email notice a completed Program Information Document. NOTES:
If it is determined that the Program Information Document has not been completed, program materials will NOT be accepted into the review.
OSPI staff will NOT meet with individual publisher representatives regarding this
process. Please do not request to do so. All representatives are respectfully asked to contact the OSPI Mathematics Initiative Office for clarifications regarding the review process. Responses to inquiries will be posted as Frequently Asked Questions (FAQs) on the OSPI Web site: http://www.k12.wa.us/CurriculumInstruct/publishernotices.aspx.
OSPI Contact:
Lee Ann Mills Mathematics Initiative Office Office of Superintendent of Public Instruction 600 Washington Street SE PO Box 47200 Olympia, WA 98504-7200 [email protected] Phone: 360-725-6445 Fax: 360-725-6023
OSPI K-12 Mathematics Computational Fluency Supplemental Program Review ► Final Report June 2007 – 82 –
Appendix B: Publisher Notice Step Two: Materials Submission and Set-up
Date: March 25, 2007, 2 p.m.–4 p.m. Location: TBA Program Submission – Program Review Materials Submission Checklist: Prior to set-up, publisher representatives will bring all program materials for the review including the completed Program Review Materials Submission Checklist (see page 6) to check-in with the Review Manager. OSPI Mathematics Initiative staff will verify with each publisher representative that each step on the checklist has been completed. Materials Set-up:
1. Set-up will occur following sign-off by OSPI personnel on the Program Review Materials Submission Checklist.
2. Each publisher sets up his/her own program materials. If the program is computer-based, one computer per program and all accessories necessary to use the program must be provided. The publisher will pay all costs, if any, associated with internet access necessary to use the program.
3. Mark materials clearly, so reviewers understand all the components of the program. 4. Each program will be provided ½ a table (size 3’ x 6’) only. Please do not bring table
skirts, stand up displays or visual advertisement posters. 5. Materials will NOT be accepted after 4 p.m.
Materials Submitted for Review:
Four copies of the Program Information Document, each in a separate labeled letter-sized file folder. (These four copies are in addition to the one copy submitted with the Publisher’s Intent to Submit.)
Four copies of the Program Computational Fluency Matrix, each in a separate
labeled letter-sized file folder (accompanies the Publisher Notice – see also the SAMPLE Program Computational Fluency Matrix – both located at http://www.k12.wa.us/CurriculumInstruct/publishernotices.aspx)http://www.k12.wa.us/CurriculumInstruct/publishernotices.aspx).
Four (4) labeled sets of the computational fluency supplemental program that
include:
All teacher materials for specified grade level(s), K–12 All student materials for specified grade level(s), K–12 – needed only if not
replicated inside the teacher materials
NOTE: Do not ship any materials to OSPI. OSPI will not be responsible for transporting materials to or from the review site.
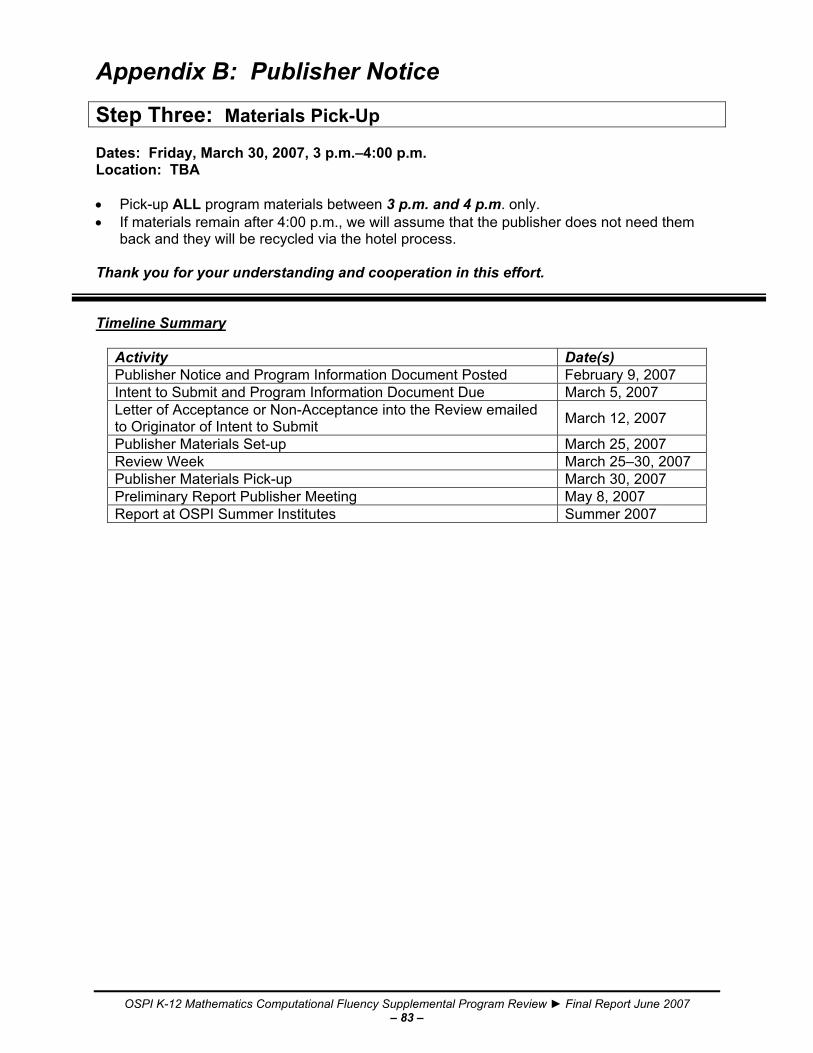
OSPI K-12 Mathematics Computational Fluency Supplemental Program Review ► Final Report June 2007 – 83 –
Appendix B: Publisher Notice Step Three: Materials Pick-Up Dates: Friday, March 30, 2007, 3 p.m.–4:00 p.m. Location: TBA • Pick-up ALL program materials between 3 p.m. and 4 p.m. only. • If materials remain after 4:00 p.m., we will assume that the publisher does not need them
back and they will be recycled via the hotel process. Thank you for your understanding and cooperation in this effort. Timeline Summary
Activity Date(s) Publisher Notice and Program Information Document Posted February 9, 2007 Intent to Submit and Program Information Document Due March 5, 2007 Letter of Acceptance or Non-Acceptance into the Review emailed to Originator of Intent to Submit March 12, 2007
Publisher Materials Set-up March 25, 2007 Review Week March 25–30, 2007 Publisher Materials Pick-up March 30, 2007 Preliminary Report Publisher Meeting May 8, 2007 Report at OSPI Summer Institutes Summer 2007

OSPI K-12 Mathematics Computational Fluency Supplemental Program Review ► Final Report June 2007 – 84 –

OSPI K-12 Mathematics Computational Fluency Supplemental Program Review ► Final Report June 2007 – 85 –
Appendix C: Reviewer Training Resources
Kindergarten GLEs 1.1.3–1.1.7 1.1.3 (NONE at this Grade Level) 1.1.4 (NONE at this Grade Level) 1.1.5 Understand the meaning of addition(1). (1 criterion)
For example: Express stories involving addition with words, pictures, and numbers. Show how addition can be used with objects or situations in the classroom. …
1.1.6 (NONE at this Grade Level) 1.1.7 (NONE at this Grade Level)
OSPI K-12 Mathematics Computational Fluency Supplemental Program Review ► Final Report June 2007 – 86 –
Appendix C: Reviewer Training Resources
Grade 1 GLEs 1.1.3–1.1.7 1.1.3 (NONE at this Grade Level) 1.1.4 (NONE at this Grade Level) 1.1.5 Understand the meaning of subtraction(1). (1 criterion)
For example: Express stories involving subtraction with words, pictures, and numbers. Show relationships between addition and subtraction using physical models,
diagrams, and acting out situations. …
1.1.6 Use computational procedures for addition(1) of whole numbers to 12(a).
(1 criterion)
For example: Apply strategies, including counting on, counting back, and doubling, for addition
facts to at least 12. Use addition procedures in a given situation. Explain strategies or procedures used to determine sums. …
1.1.7 Apply appropriate strategies and use tools for adding whole numbers.
For example: Use appropriate tools including mental math, paper and pencil, manipulatives, or
calculator to add or subtract in a given situation. …
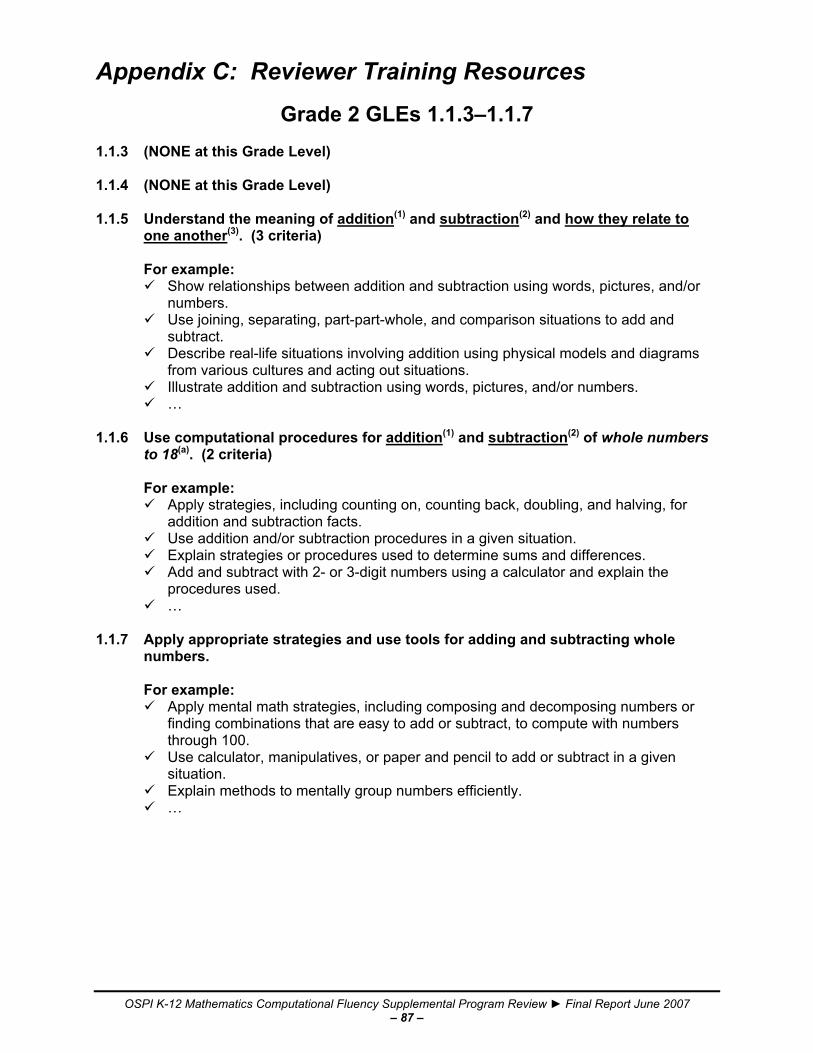
OSPI K-12 Mathematics Computational Fluency Supplemental Program Review ► Final Report June 2007 – 87 –
Appendix C: Reviewer Training Resources
Grade 2 GLEs 1.1.3–1.1.7 1.1.3 (NONE at this Grade Level) 1.1.4 (NONE at this Grade Level) 1.1.5 Understand the meaning of addition(1) and subtraction(2) and how they relate to
one another(3). (3 criteria)
For example: Show relationships between addition and subtraction using words, pictures, and/or
numbers. Use joining, separating, part-part-whole, and comparison situations to add and
subtract. Describe real-life situations involving addition using physical models and diagrams
from various cultures and acting out situations. Illustrate addition and subtraction using words, pictures, and/or numbers. …
1.1.6 Use computational procedures for addition(1) and subtraction(2) of whole numbers
to 18(a). (2 criteria)
For example: Apply strategies, including counting on, counting back, doubling, and halving, for
addition and subtraction facts. Use addition and/or subtraction procedures in a given situation. Explain strategies or procedures used to determine sums and differences. Add and subtract with 2- or 3-digit numbers using a calculator and explain the
procedures used. …
1.1.7 Apply appropriate strategies and use tools for adding and subtracting whole
numbers.
For example: Apply mental math strategies, including composing and decomposing numbers or
finding combinations that are easy to add or subtract, to compute with numbers through 100.
Use calculator, manipulatives, or paper and pencil to add or subtract in a given situation.
Explain methods to mentally group numbers efficiently. …
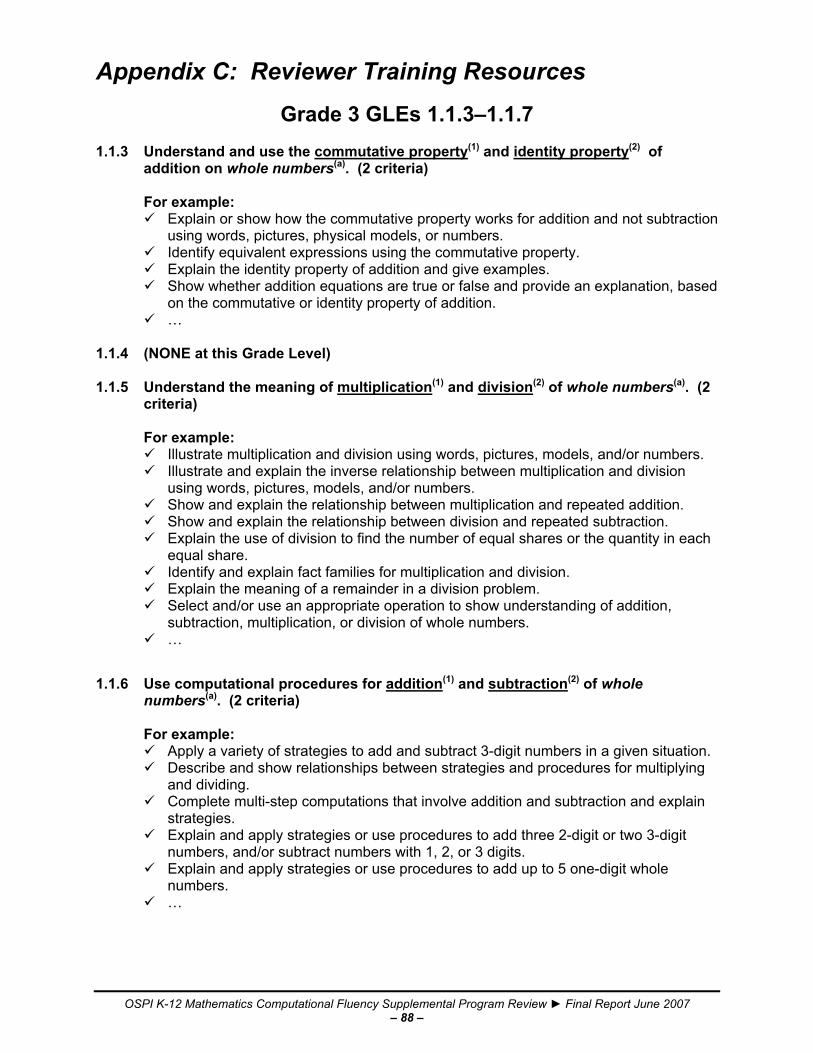
OSPI K-12 Mathematics Computational Fluency Supplemental Program Review ► Final Report June 2007 – 88 –
Appendix C: Reviewer Training Resources
Grade 3 GLEs 1.1.3–1.1.7 1.1.3 Understand and use the commutative property(1) and identity property(2) of
addition on whole numbers(a). (2 criteria)
For example: Explain or show how the commutative property works for addition and not subtraction
using words, pictures, physical models, or numbers. Identify equivalent expressions using the commutative property. Explain the identity property of addition and give examples. Show whether addition equations are true or false and provide an explanation, based
on the commutative or identity property of addition. …
1.1.4 (NONE at this Grade Level) 1.1.5 Understand the meaning of multiplication(1) and division(2) of whole numbers(a). (2
criteria)
For example: Illustrate multiplication and division using words, pictures, models, and/or numbers. Illustrate and explain the inverse relationship between multiplication and division
using words, pictures, models, and/or numbers. Show and explain the relationship between multiplication and repeated addition. Show and explain the relationship between division and repeated subtraction. Explain the use of division to find the number of equal shares or the quantity in each
equal share. Identify and explain fact families for multiplication and division. Explain the meaning of a remainder in a division problem. Select and/or use an appropriate operation to show understanding of addition,
subtraction, multiplication, or division of whole numbers. …
1.1.6 Use computational procedures for addition(1) and subtraction(2) of whole
numbers(a). (2 criteria)
For example: Apply a variety of strategies to add and subtract 3-digit numbers in a given situation. Describe and show relationships between strategies and procedures for multiplying
and dividing. Complete multi-step computations that involve addition and subtraction and explain
strategies. Explain and apply strategies or use procedures to add three 2-digit or two 3-digit
numbers, and/or subtract numbers with 1, 2, or 3 digits. Explain and apply strategies or use procedures to add up to 5 one-digit whole
numbers. …

OSPI K-12 Mathematics Computational Fluency Supplemental Program Review ► Final Report June 2007 – 89 –
Appendix C: Reviewer Training Resources 1.1.7 Apply strategies and use tools appropriate to tasks involving addition and
subtraction of whole numbers.
For example: Select and use appropriate tools from among mental computation, estimation,
calculators, manipulatives, and paper and pencil to compute in a given situation. Explain why a selected tool is most efficient for a given situation. …

OSPI K-12 Mathematics Computational Fluency Supplemental Program Review ► Final Report June 2007 – 90 –
Appendix C: Reviewer Training Resources
Grade 4 GLEs 1.1.3–1.1.7 1.1.3 Understand and use the associative property of addition(1) and multiplication(2),
and the commutative(3–4), identity(5–6), and zero properties(7) of multiplication on whole numbers(a). (7 criteria)
For example:
Explain the commutative property of multiplication and give examples. Explain the identity property of addition and multiplication and give examples. Explain why equations are true or false based on one of the properties of addition or
multiplication. Illustrate and demonstrate the use of the commutative, associative, or identity
property of addition or multiplication using words, pictures, numbers, or objects. Use addition or multiplication properties to replicate a computational strategy when
given an example. Illustrate and demonstrate the use of the zero property of multiplication on whole
numbers. …
1.1.4 (NONE at this Grade Level) 1.1.5 Understand the meaning of addition(1) and subtraction(2) of like-denominator
fractions(a). (2 criteria)
For example: Represent addition and subtraction of fractions with like-denominators using
numbers, pictures, and models including everyday objects, fraction circles, number lines, and geoboards.
Use joining, separating, part-part-whole, and comparison situations to add and subtract like-denominator fractions.
Translate a given picture or illustration into an equivalent symbolic representation of addition and subtraction of like denominator fractions.
Select and/or use an appropriate operation to show understanding of addition and subtraction of like-denominator fractions.
… 1.1.6 Use computational procedures for multiplication(1) and division(2) of whole
numbers(a). (2 criteria)
For example: Select and develop strategies that help with recall of multiplication and division
through 12s. Select and test algorithms used in computational situations that involve multiplication
and division of whole numbers and explain strategies. Compute with whole numbers using a combination of any two operations in a given
situation. Explain and apply strategies or use procedures to multiply 2-digit numbers by 3-digit
numbers and/or divide 3- or 4-digit numbers by 2-digit numbers without remainders. Appropriately apply and explain the concept of remainder in a given context. …

OSPI K-12 Mathematics Computational Fluency Supplemental Program Review ► Final Report June 2007 – 91 –
Appendix C: Reviewer Training Resources 1.1.7 Apply strategies and use tools appropriate to tasks involving multiplication and
division of whole numbers.
For example: Select and use appropriate tools from among mental computation, estimation,
calculators, manipulatives, and paper and pencil to compute in a given situation. Explain why a selected tool is most efficient for a situation. …

OSPI K-12 Mathematics Computational Fluency Supplemental Program Review ► Final Report June 2007 – 92 –
Appendix C: Reviewer Training Resources
Grade 5 GLEs 1.1.3–1.1.7 1.1.3 Understand and apply the concept of divisibility including primes(1), composites(2),
factors(3), and multiples(4). (4 criteria)
For example: Use the concepts of odd and even numbers to check for divisibility. Illustrate prime or composite numbers by creating a physical model. Identify prime or composite numbers between 1 and 100 and explain why a whole
number is prime or composite. Explain how to find the least common multiple (LCM) and greatest common factor
(GCF) of two numbers. Use factors, multiples, and prime and composite numbers in a variety of situations. Factor a number into its prime factorization or into factor pairs. Explain or show whether one number is a factor of another number. Explain or demonstrate why a number is prime or composite …
1.1.4 (NONE at this Grade Level) 1.1.5 Understand the meaning of addition(1) and subtraction(2) of non-negative
decimals(a) and fractions(b). (4 criteria)
For example: Represent addition and subtraction of fractions with denominators of 2, 4, 8 or 2, 3,
6, 12 or 2, 5, 10. Represent or explain addition and subtraction of non-negative decimals through
thousandths using words, pictures, models, or numbers. Explain a strategy for adding and subtracting fractions. Select and/or use an appropriate operation(s) to show understanding of addition and
subtraction of non-negative decimals and/or fractions. Explain the relationship between addition and subtraction of non-negative decimals
and fractions. Translate a picture or illustration into an equivalent symbolic representation of
addition and subtraction of non-negative fractions and decimals. …
1.1.6 Apply strategies or use computational procedures to add(1) and subtract(2)
non-negative decimals(a) and like-denominator fractions(b). (4 criteria)
For example: Add and subtract non-negative decimals and like-denominator fractions with
denominators of 2, 3, 4, 5, 6, 8, 10, 12, and/or 15. Find sums or differences of decimals or like-denominator fractions in given
situations. Calculate sums of two numbers with decimals to the thousandths or three numbers
with decimals to hundredths. Calculate difference of numbers with decimals to thousandths. …

OSPI K-12 Mathematics Computational Fluency Supplemental Program Review ► Final Report June 2007 – 93 –
Appendix C: Reviewer Training Resources 1.1.7 Apply strategies and uses tools appropriate to tasks involving addition and
subtraction of non-negative decimals or like-denominator fractions.
For example: Select and use appropriate tools from among mental computation, estimation,
calculators, manipulatives, and paper and pencil to compute in a given situation. Explain why a selected strategy or tool is more efficient or more appropriate than
another strategy or tool for a situation. Describe strategies for mentally adding or subtracting non-negative decimals and/or
like-denominator fractions. …

OSPI K-12 Mathematics Computational Fluency Supplemental Program Review ► Final Report June 2007 – 94 –
Appendix C: Reviewer Training Resources
Grade 6 GLEs 1.1.3–1.1.7
1.1.3 Understand and use properties of addition(1–3) and multiplication(4–7) on non-negative decimals and fractions(a). (7 criteria)
For example:
Illustrate and explain the commutative, associative, and identity properties of addition and multiplication and the zero property of multiplication on non-negative decimals and fractions.
Use addition and multiplication properties to assist in computations. Determine whether a computation is reasonable based on application of the
commutative, associative, and identity properties of addition and/or multiplication. …
1.1.4 Understand the concepts of ratio(1) and percent(2). (2 criteria)
For example: Write or show and explain ratios in part/part and part/whole relationships using
words, objects, pictures, models, and/or symbols. Represent equivalent ratios using objects, pictures, or symbols. Represent equivalent percentages using objects, pictures, and symbols. Express or represent percent as a ratio based on 100 equal size parts of a set. Explain ratio and percents and give examples of each. Create a ratio equivalent to a given ratio to determine an unknown value for a
dimension or a number of events or objects. …
1.1.5 Understand the meaning of multiplication(1) and division(2) of non-negative
decimals(a) and fractions(b). (4 criteria)
For example: Explain or show the meaning of multiplying and dividing non-negative fractions and
decimals using words, pictures, or models. Explain the effect of multiplying a whole number by a decimal number. Explain why multiplication of fractions involves multiplying denominators. Demonstrate how multiplication and division with decimals affects place value. Explain remainders of a division problem in a given situation. Translate a picture or illustration into an equivalent symbolic representation of
multiplication and division of non-negative fractions and decimals. Select and/or use an appropriate operation to show understanding of addition,
subtraction, multiplication, or division of non-negative rational numbers. …

OSPI K-12 Mathematics Computational Fluency Supplemental Program Review ► Final Report June 2007 – 95 –
Appendix C: Reviewer Training Resources 1.1.6 Apply strategies or uses computational procedures to add(1) and subtract(2)
non-negative decimals(a) and fractions(b). (4 criteria)
For example: Find the sums or differences of non-negative fractions or decimals. Find sums or differences of decimals or fractions in real-world situations. Use the least common multiple and the greatest common factor of whole numbers to
simplify or compute with fractions. Calculate sums of two numbers with decimals to the thousandths or three numbers
with decimals to hundredths. Calculate difference between numbers with decimals to thousandths. Complete multiple-step computations requiring addition and/or subtraction. …
1.1.7 Apply strategies and uses tools appropriate to tasks involving addition and
subtraction of non-negative decimals and fractions.
For example: Select and use appropriate strategies and tools from among mental computation,
estimation, calculators, manipulatives, and paper and pencil to compute in a given situation.
Explain why a selected strategy or tool is more efficient or more appropriate than another strategy or tool for a situation.
Describe strategies for mentally adding and/or subtracting non-negative decimals and fractions.
…
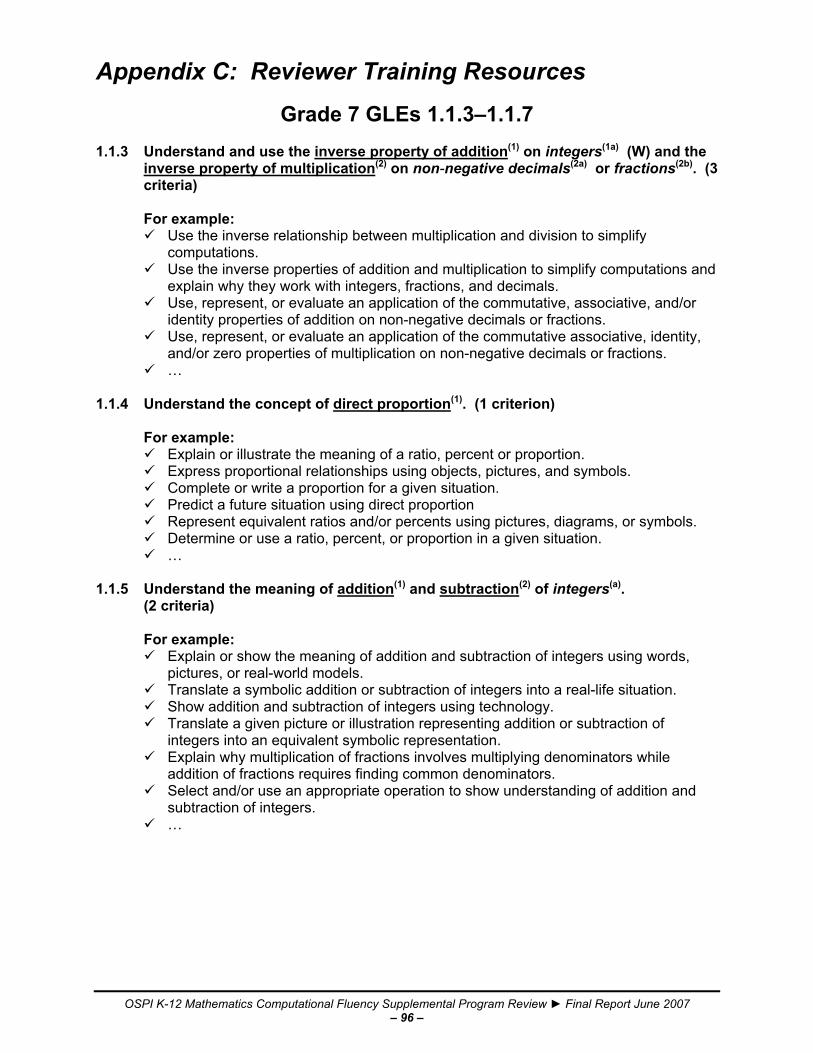
OSPI K-12 Mathematics Computational Fluency Supplemental Program Review ► Final Report June 2007 – 96 –
Appendix C: Reviewer Training Resources
Grade 7 GLEs 1.1.3–1.1.7 1.1.3 Understand and use the inverse property of addition(1) on integers(1a) (W) and the
inverse property of multiplication(2) on non-negative decimals(2a) or fractions(2b). (3 criteria)
For example:
Use the inverse relationship between multiplication and division to simplify computations.
Use the inverse properties of addition and multiplication to simplify computations and explain why they work with integers, fractions, and decimals.
Use, represent, or evaluate an application of the commutative, associative, and/or identity properties of addition on non-negative decimals or fractions.
Use, represent, or evaluate an application of the commutative associative, identity, and/or zero properties of multiplication on non-negative decimals or fractions.
…
1.1.4 Understand the concept of direct proportion(1). (1 criterion)
For example: Explain or illustrate the meaning of a ratio, percent or proportion. Express proportional relationships using objects, pictures, and symbols. Complete or write a proportion for a given situation. Predict a future situation using direct proportion Represent equivalent ratios and/or percents using pictures, diagrams, or symbols. Determine or use a ratio, percent, or proportion in a given situation. …
1.1.5 Understand the meaning of addition(1) and subtraction(2) of integers(a).
(2 criteria)
For example: Explain or show the meaning of addition and subtraction of integers using words,
pictures, or real-world models. Translate a symbolic addition or subtraction of integers into a real-life situation. Show addition and subtraction of integers using technology. Translate a given picture or illustration representing addition or subtraction of
integers into an equivalent symbolic representation. Explain why multiplication of fractions involves multiplying denominators while
addition of fractions requires finding common denominators. Select and/or use an appropriate operation to show understanding of addition and
subtraction of integers. …
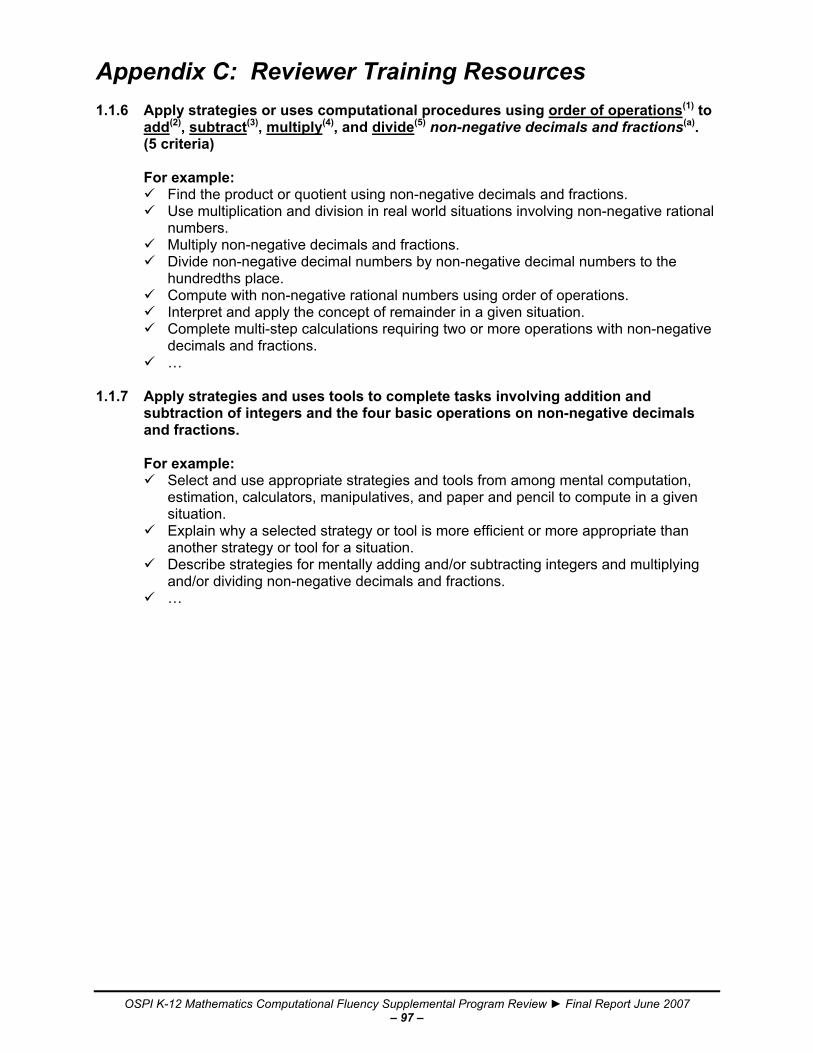
OSPI K-12 Mathematics Computational Fluency Supplemental Program Review ► Final Report June 2007 – 97 –
Appendix C: Reviewer Training Resources 1.1.6 Apply strategies or uses computational procedures using order of operations(1) to
add(2), subtract(3), multiply(4), and divide(5) non-negative decimals and fractions(a). (5 criteria)
For example:
Find the product or quotient using non-negative decimals and fractions. Use multiplication and division in real world situations involving non-negative rational
numbers. Multiply non-negative decimals and fractions. Divide non-negative decimal numbers by non-negative decimal numbers to the
hundredths place. Compute with non-negative rational numbers using order of operations. Interpret and apply the concept of remainder in a given situation. Complete multi-step calculations requiring two or more operations with non-negative
decimals and fractions. …
1.1.7 Apply strategies and uses tools to complete tasks involving addition and
subtraction of integers and the four basic operations on non-negative decimals and fractions.
For example:
Select and use appropriate strategies and tools from among mental computation, estimation, calculators, manipulatives, and paper and pencil to compute in a given situation.
Explain why a selected strategy or tool is more efficient or more appropriate than another strategy or tool for a situation.
Describe strategies for mentally adding and/or subtracting integers and multiplying and/or dividing non-negative decimals and fractions.
…
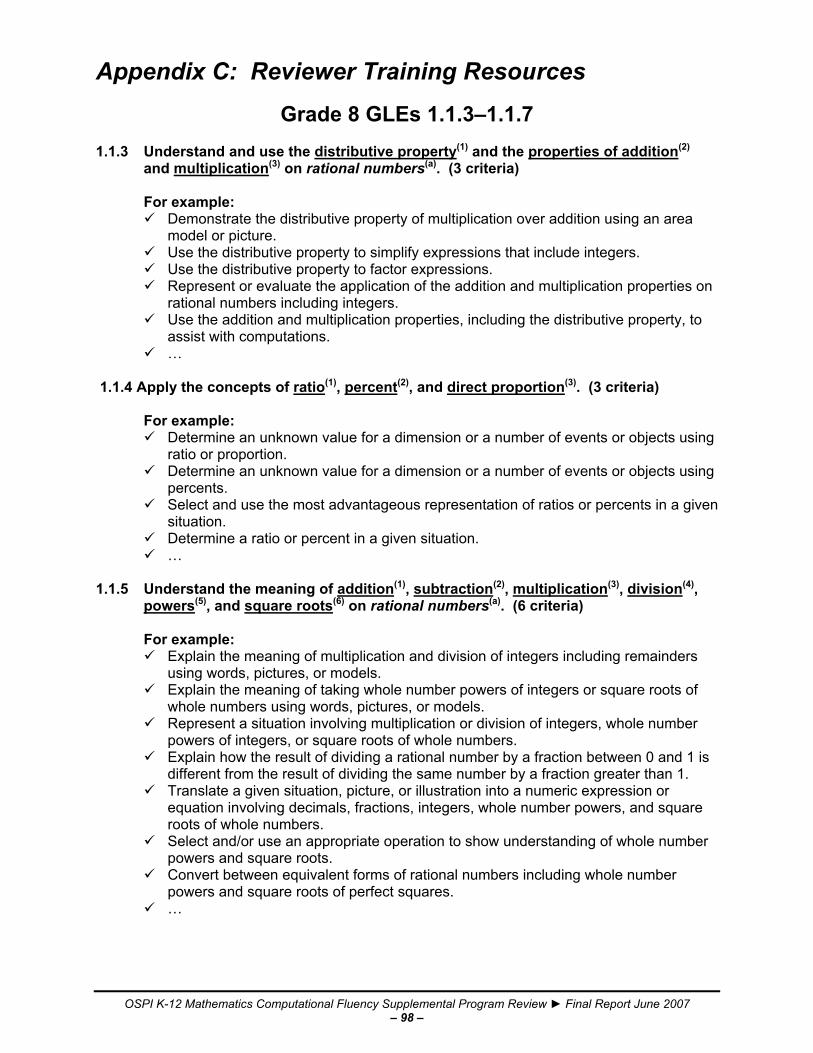
OSPI K-12 Mathematics Computational Fluency Supplemental Program Review ► Final Report June 2007 – 98 –
Appendix C: Reviewer Training Resources
Grade 8 GLEs 1.1.3–1.1.7 1.1.3 Understand and use the distributive property(1) and the properties of addition(2)
and multiplication(3) on rational numbers(a). (3 criteria)
For example: Demonstrate the distributive property of multiplication over addition using an area
model or picture. Use the distributive property to simplify expressions that include integers. Use the distributive property to factor expressions. Represent or evaluate the application of the addition and multiplication properties on
rational numbers including integers. Use the addition and multiplication properties, including the distributive property, to
assist with computations. …
1.1.4 Apply the concepts of ratio(1), percent(2), and direct proportion(3). (3 criteria)
For example: Determine an unknown value for a dimension or a number of events or objects using
ratio or proportion. Determine an unknown value for a dimension or a number of events or objects using
percents. Select and use the most advantageous representation of ratios or percents in a given
situation. Determine a ratio or percent in a given situation. …
1.1.5 Understand the meaning of addition(1), subtraction(2), multiplication(3), division(4),
powers(5), and square roots(6) on rational numbers(a). (6 criteria)
For example: Explain the meaning of multiplication and division of integers including remainders
using words, pictures, or models. Explain the meaning of taking whole number powers of integers or square roots of
whole numbers using words, pictures, or models. Represent a situation involving multiplication or division of integers, whole number
powers of integers, or square roots of whole numbers. Explain how the result of dividing a rational number by a fraction between 0 and 1 is
different from the result of dividing the same number by a fraction greater than 1. Translate a given situation, picture, or illustration into a numeric expression or
equation involving decimals, fractions, integers, whole number powers, and square roots of whole numbers.
Select and/or use an appropriate operation to show understanding of whole number powers and square roots.
Convert between equivalent forms of rational numbers including whole number powers and square roots of perfect squares.
…
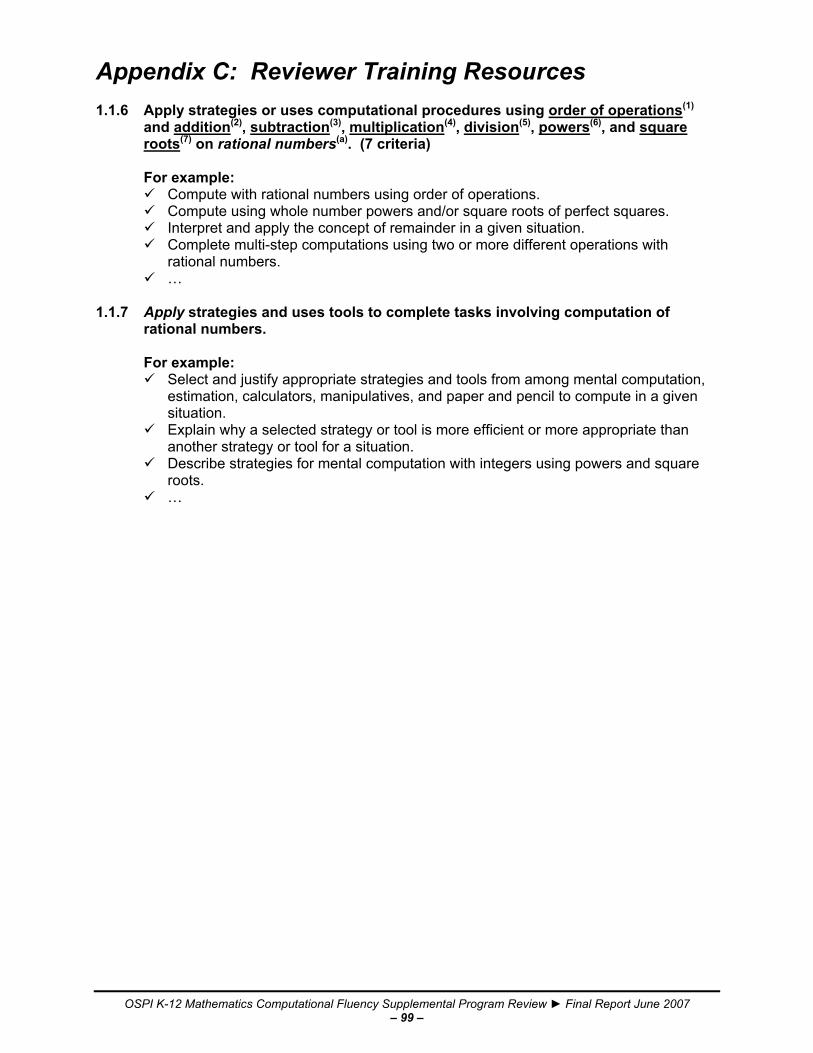
OSPI K-12 Mathematics Computational Fluency Supplemental Program Review ► Final Report June 2007 – 99 –
Appendix C: Reviewer Training Resources 1.1.6 Apply strategies or uses computational procedures using order of operations(1)
and addition(2), subtraction(3), multiplication(4), division(5), powers(6), and square roots(7) on rational numbers(a). (7 criteria)
For example:
Compute with rational numbers using order of operations. Compute using whole number powers and/or square roots of perfect squares. Interpret and apply the concept of remainder in a given situation. Complete multi-step computations using two or more different operations with
rational numbers. …
1.1.7 Apply strategies and uses tools to complete tasks involving computation of
rational numbers.
For example: Select and justify appropriate strategies and tools from among mental computation,
estimation, calculators, manipulatives, and paper and pencil to compute in a given situation.
Explain why a selected strategy or tool is more efficient or more appropriate than another strategy or tool for a situation.
Describe strategies for mental computation with integers using powers and square roots.
…
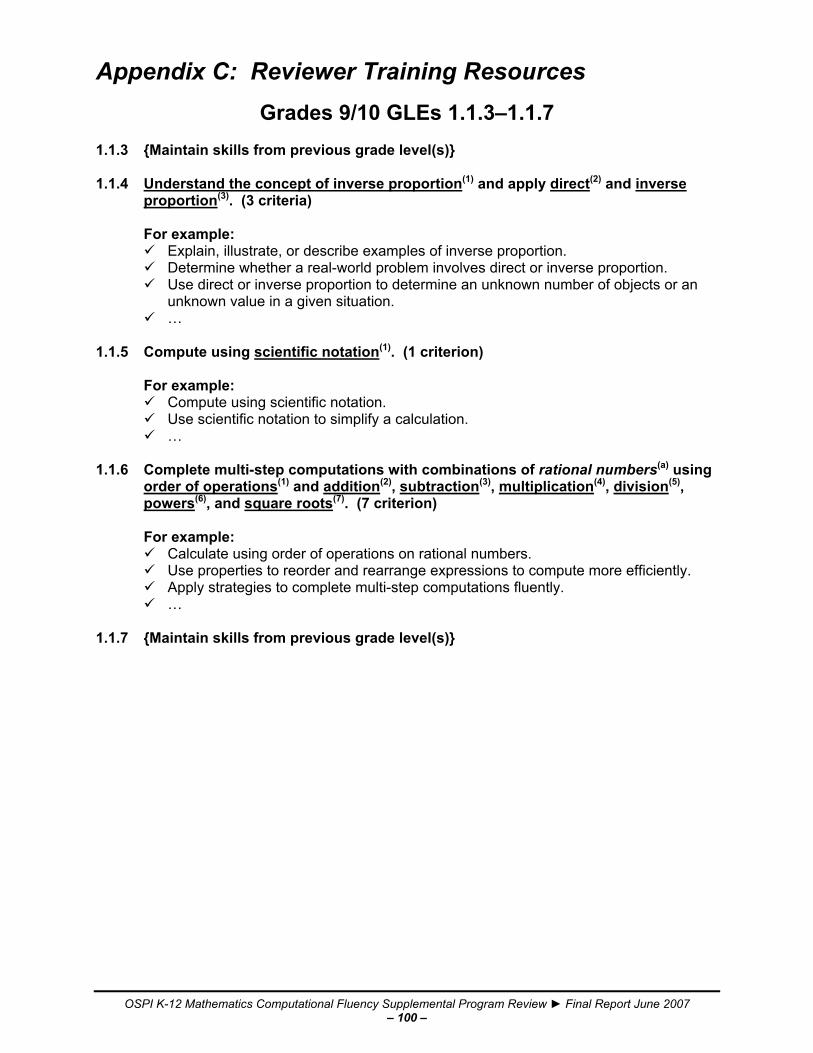
OSPI K-12 Mathematics Computational Fluency Supplemental Program Review ► Final Report June 2007 – 100 –
Appendix C: Reviewer Training Resources
Grades 9/10 GLEs 1.1.3–1.1.7 1.1.3 {Maintain skills from previous grade level(s)} 1.1.4 Understand the concept of inverse proportion(1) and apply direct(2) and inverse
proportion(3). (3 criteria)
For example: Explain, illustrate, or describe examples of inverse proportion. Determine whether a real-world problem involves direct or inverse proportion. Use direct or inverse proportion to determine an unknown number of objects or an
unknown value in a given situation. …
1.1.5 Compute using scientific notation(1). (1 criterion)
For example: Compute using scientific notation. Use scientific notation to simplify a calculation. …
1.1.6 Complete multi-step computations with combinations of rational numbers(a) using
order of operations(1) and addition(2), subtraction(3), multiplication(4), division(5), powers(6), and square roots(7). (7 criterion)
For example:
Calculate using order of operations on rational numbers. Use properties to reorder and rearrange expressions to compute more efficiently. Apply strategies to complete multi-step computations fluently. …
1.1.7 {Maintain skills from previous grade level(s)}
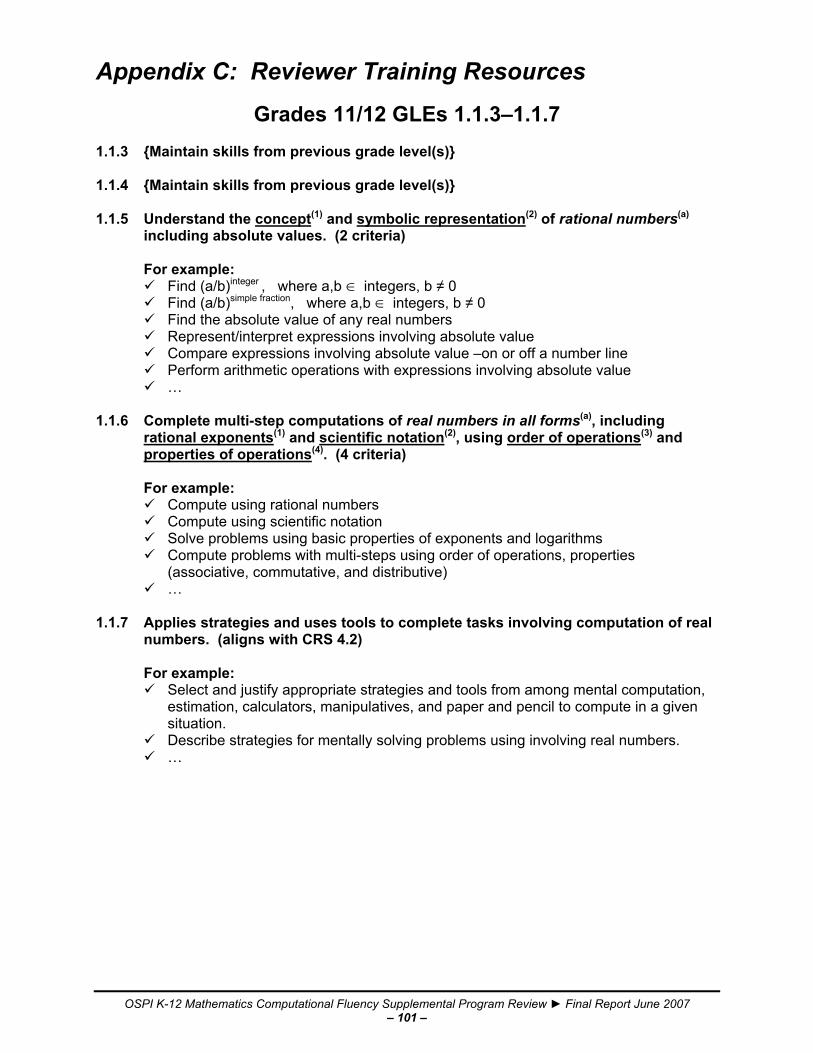
OSPI K-12 Mathematics Computational Fluency Supplemental Program Review ► Final Report June 2007 – 101 –
Appendix C: Reviewer Training Resources
Grades 11/12 GLEs 1.1.3–1.1.7 1.1.3 {Maintain skills from previous grade level(s)} 1.1.4 {Maintain skills from previous grade level(s)} 1.1.5 Understand the concept(1) and symbolic representation(2) of rational numbers(a)
including absolute values. (2 criteria)
For example: Find (a/b)integer , where a,b ∈ integers, b ≠ 0 Find (a/b)simple fraction, where a,b ∈ integers, b ≠ 0 Find the absolute value of any real numbers Represent/interpret expressions involving absolute value Compare expressions involving absolute value –on or off a number line Perform arithmetic operations with expressions involving absolute value …
1.1.6 Complete multi-step computations of real numbers in all forms(a), including
rational exponents(1) and scientific notation(2), using order of operations(3) and properties of operations(4). (4 criteria)
For example:
Compute using rational numbers Compute using scientific notation Solve problems using basic properties of exponents and logarithms Compute problems with multi-steps using order of operations, properties
(associative, commutative, and distributive) …
1.1.7 Applies strategies and uses tools to complete tasks involving computation of real
numbers. (aligns with CRS 4.2)
For example: Select and justify appropriate strategies and tools from among mental computation,
estimation, calculators, manipulatives, and paper and pencil to compute in a given situation.
Describe strategies for mentally solving problems using involving real numbers. …

OSPI K-12 Mathematics Computational Fluency Supplemental Program Review ► Final Report June 2007 – 102 –
Appendix C: Reviewer Training Resources
Some Mathematics Properties
Operations
Properties
Commutative Associative Distributive Identity Inverse Zero
Addition a + b = b + a a+(b+c) = (a+b)+c a+0 =a Id. element= 0 -a
Multiplication a b = b a
or ab=ba
a (b c) = (a b) c a(b+c) =ab+ac a 1 = a Id. element =1 1/a, a≠0 a 0 =0
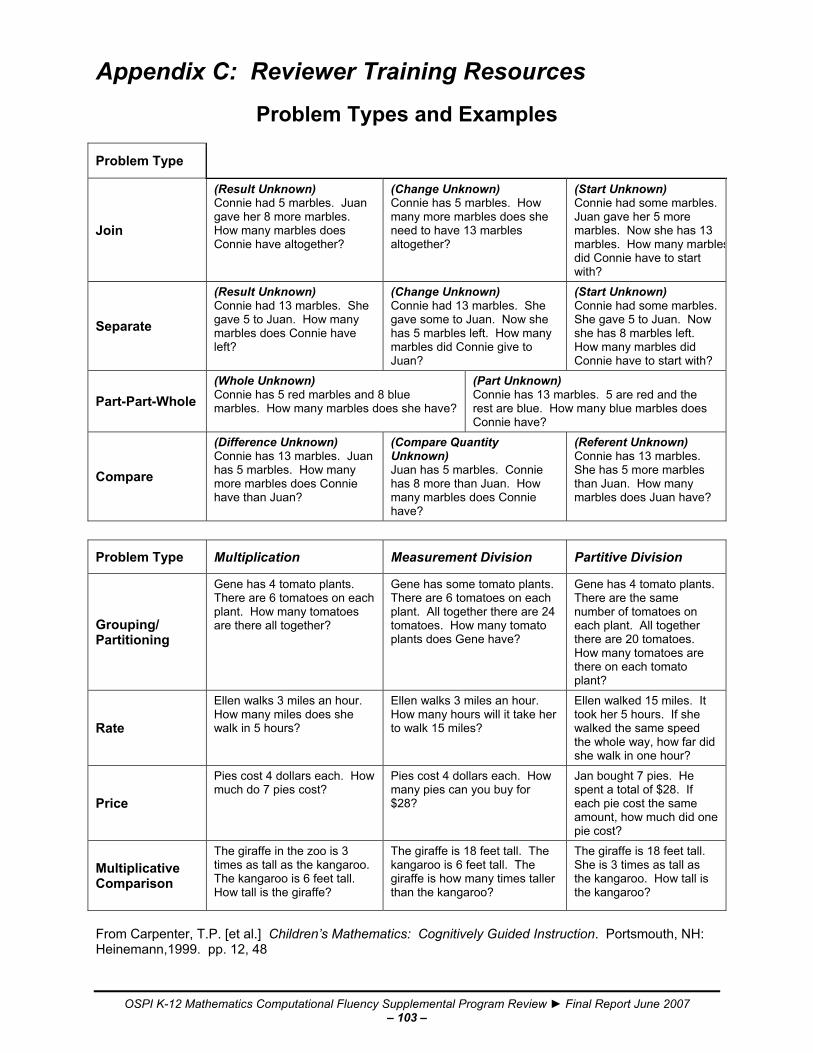
OSPI K-12 Mathematics Computational Fluency Supplemental Program Review ► Final Report June 2007 – 103 –
Appendix C: Reviewer Training Resources
Problem Types and Examples
Problem Type
Join
(Result Unknown) Connie had 5 marbles. Juan gave her 8 more marbles. How many marbles does Connie have altogether?
(Change Unknown) Connie has 5 marbles. How many more marbles does she need to have 13 marbles altogether?
(Start Unknown) Connie had some marbles. Juan gave her 5 more marbles. Now she has 13 marbles. How many marblesdid Connie have to start with?
Separate
(Result Unknown) Connie had 13 marbles. She gave 5 to Juan. How many marbles does Connie have left?
(Change Unknown) Connie had 13 marbles. She gave some to Juan. Now she has 5 marbles left. How many marbles did Connie give to Juan?
(Start Unknown) Connie had some marbles. She gave 5 to Juan. Now she has 8 marbles left. How many marbles did Connie have to start with?
Part-Part-Whole (Whole Unknown) Connie has 5 red marbles and 8 blue marbles. How many marbles does she have?
(Part Unknown) Connie has 13 marbles. 5 are red and the rest are blue. How many blue marbles does Connie have?
Compare
(Difference Unknown) Connie has 13 marbles. Juan has 5 marbles. How many more marbles does Connie have than Juan?
(Compare Quantity Unknown) Juan has 5 marbles. Connie has 8 more than Juan. How many marbles does Connie have?
(Referent Unknown) Connie has 13 marbles. She has 5 more marbles than Juan. How many marbles does Juan have?
Problem Type Multiplication Measurement Division Partitive Division
Grouping/ Partitioning
Gene has 4 tomato plants. There are 6 tomatoes on each plant. How many tomatoes are there all together?
Gene has some tomato plants. There are 6 tomatoes on each plant. All together there are 24 tomatoes. How many tomato plants does Gene have?
Gene has 4 tomato plants. There are the same number of tomatoes on each plant. All together there are 20 tomatoes. How many tomatoes are there on each tomato plant?
Rate
Ellen walks 3 miles an hour. How many miles does she walk in 5 hours?
Ellen walks 3 miles an hour. How many hours will it take her to walk 15 miles?
Ellen walked 15 miles. It took her 5 hours. If she walked the same speed the whole way, how far did she walk in one hour?
Price
Pies cost 4 dollars each. How much do 7 pies cost?
Pies cost 4 dollars each. How many pies can you buy for $28?
Jan bought 7 pies. He spent a total of $28. If each pie cost the same amount, how much did one pie cost?
Multiplicative Comparison
The giraffe in the zoo is 3 times as tall as the kangaroo. The kangaroo is 6 feet tall. How tall is the giraffe?
The giraffe is 18 feet tall. The kangaroo is 6 feet tall. The giraffe is how many times taller than the kangaroo?
The giraffe is 18 feet tall. She is 3 times as tall as the kangaroo. How tall is the kangaroo?
From Carpenter, T.P. [et al.] Children’s Mathematics: Cognitively Guided Instruction. Portsmouth, NH: Heinemann,1999. pp. 12, 48
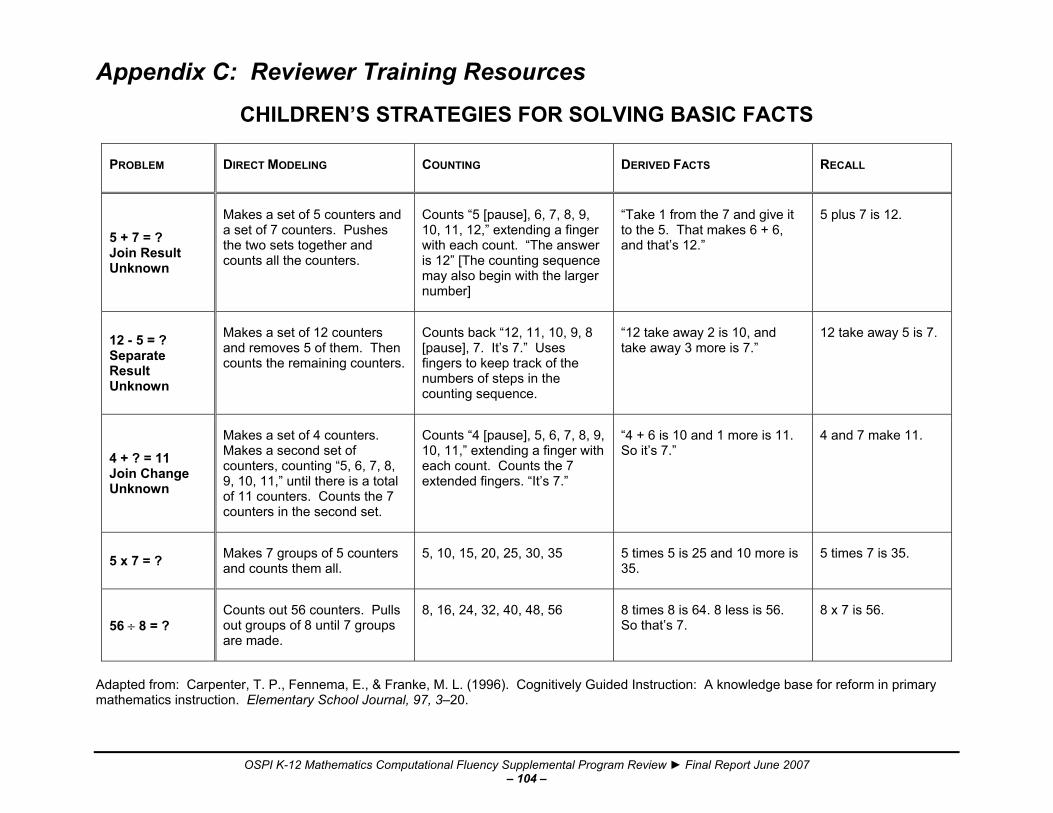
OSPI K-12 Mathematics Computational Fluency Supplemental Program Review ► Final Report June 2007 – 104 –
Appendix C: Reviewer Training Resources
CHILDREN’S STRATEGIES FOR SOLVING BASIC FACTS
PROBLEM DIRECT MODELING COUNTING DERIVED FACTS RECALL
5 + 7 = ? Join Result Unknown
Makes a set of 5 counters and a set of 7 counters. Pushes the two sets together and counts all the counters.
Counts “5 [pause], 6, 7, 8, 9, 10, 11, 12,” extending a finger with each count. “The answer is 12” [The counting sequence may also begin with the larger number]
“Take 1 from the 7 and give it to the 5. That makes 6 + 6, and that’s 12.”
5 plus 7 is 12.
12 - 5 = ? Separate Result Unknown
Makes a set of 12 counters and removes 5 of them. Then counts the remaining counters.
Counts back “12, 11, 10, 9, 8 [pause], 7. It’s 7.” Uses fingers to keep track of the numbers of steps in the counting sequence.
“12 take away 2 is 10, and take away 3 more is 7.”
12 take away 5 is 7.
4 + ? = 11 Join Change Unknown
Makes a set of 4 counters. Makes a second set of counters, counting “5, 6, 7, 8, 9, 10, 11,” until there is a total of 11 counters. Counts the 7 counters in the second set.
Counts “4 [pause], 5, 6, 7, 8, 9, 10, 11,” extending a finger with each count. Counts the 7 extended fingers. “It’s 7.”
“4 + 6 is 10 and 1 more is 11. So it’s 7.”
4 and 7 make 11.
5 x 7 = ? Makes 7 groups of 5 counters and counts them all.
5, 10, 15, 20, 25, 30, 35 5 times 5 is 25 and 10 more is 35.
5 times 7 is 35.
56 ÷ 8 = ? Counts out 56 counters. Pulls out groups of 8 until 7 groups are made.
8, 16, 24, 32, 40, 48, 56 8 times 8 is 64. 8 less is 56. So that’s 7.
8 x 7 is 56.
Adapted from: Carpenter, T. P., Fennema, E., & Franke, M. L. (1996). Cognitively Guided Instruction: A knowledge base for reform in primary mathematics instruction. Elementary School Journal, 97, 3–20.
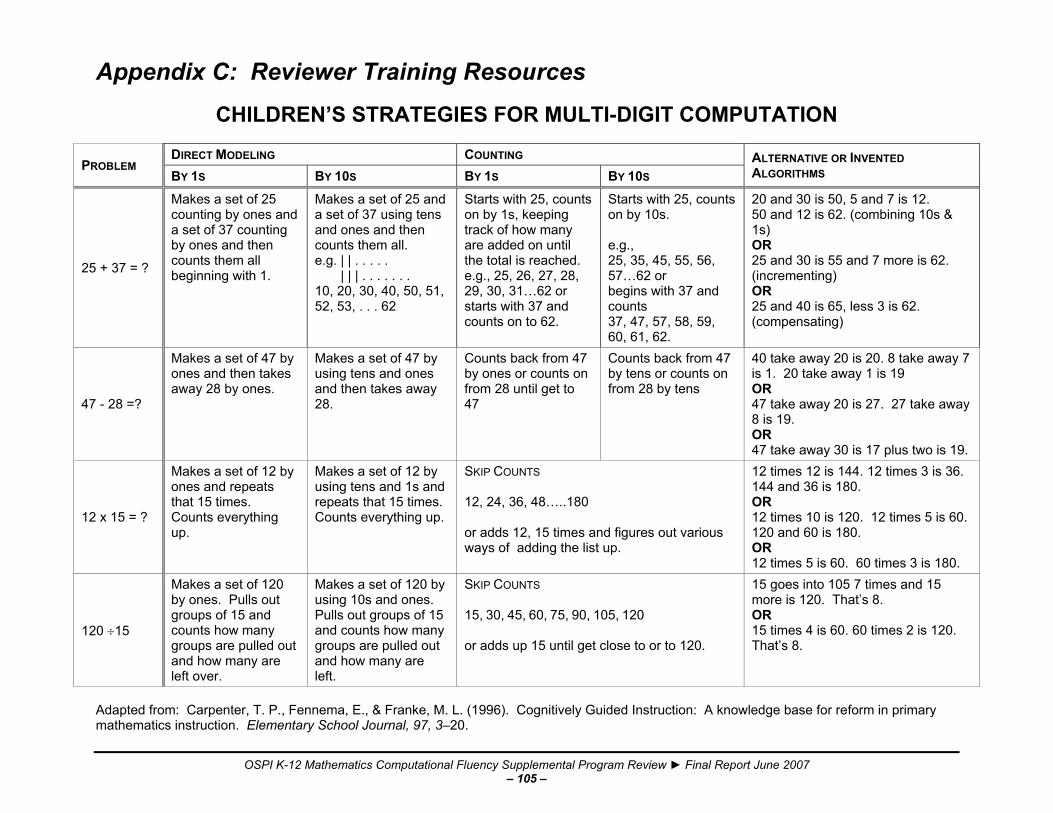
OSPI K-12 Mathematics Computational Fluency Supplemental Program Review ► Final Report June 2007 – 105 –
Appendix C: Reviewer Training Resources
CHILDREN’S STRATEGIES FOR MULTI-DIGIT COMPUTATION
PROBLEM DIRECT MODELING COUNTING ALTERNATIVE OR INVENTED
ALGORITHMS BY 1S BY 10S BY 1S BY 10S
25 + 37 = ?
Makes a set of 25 counting by ones and a set of 37 counting by ones and then counts them all beginning with 1.
Makes a set of 25 and a set of 37 using tens and ones and then counts them all. e.g. | | . . . . . | | | . . . . . . . 10, 20, 30, 40, 50, 51, 52, 53, . . . 62
Starts with 25, counts on by 1s, keeping track of how many are added on until the total is reached. e.g., 25, 26, 27, 28, 29, 30, 31…62 or starts with 37 and counts on to 62.
Starts with 25, counts on by 10s. e.g., 25, 35, 45, 55, 56, 57…62 or begins with 37 and counts 37, 47, 57, 58, 59, 60, 61, 62.
20 and 30 is 50, 5 and 7 is 12. 50 and 12 is 62. (combining 10s & 1s) OR 25 and 30 is 55 and 7 more is 62. (incrementing) OR 25 and 40 is 65, less 3 is 62. (compensating)
47 - 28 =?
Makes a set of 47 by ones and then takes away 28 by ones.
Makes a set of 47 by using tens and ones and then takes away 28.
Counts back from 47 by ones or counts on from 28 until get to 47
Counts back from 47 by tens or counts on from 28 by tens
40 take away 20 is 20. 8 take away 7 is 1. 20 take away 1 is 19 OR 47 take away 20 is 27. 27 take away 8 is 19. OR 47 take away 30 is 17 plus two is 19.
12 x 15 = ?
Makes a set of 12 by ones and repeats that 15 times. Counts everything up.
Makes a set of 12 by using tens and 1s and repeats that 15 times. Counts everything up.
SKIP COUNTS 12, 24, 36, 48…..180 or adds 12, 15 times and figures out various ways of adding the list up.
12 times 12 is 144. 12 times 3 is 36. 144 and 36 is 180. OR 12 times 10 is 120. 12 times 5 is 60. 120 and 60 is 180. OR 12 times 5 is 60. 60 times 3 is 180.
120 ÷15
Makes a set of 120 by ones. Pulls out groups of 15 and counts how many groups are pulled out and how many are left over.
Makes a set of 120 by using 10s and ones. Pulls out groups of 15 and counts how many groups are pulled out and how many are left.
SKIP COUNTS 15, 30, 45, 60, 75, 90, 105, 120 or adds up 15 until get close to or to 120.
15 goes into 105 7 times and 15 more is 120. That’s 8. OR 15 times 4 is 60. 60 times 2 is 120. That’s 8.
Adapted from: Carpenter, T. P., Fennema, E., & Franke, M. L. (1996). Cognitively Guided Instruction: A knowledge base for reform in primary mathematics instruction. Elementary School Journal, 97, 3–20.

OSPI K-12 Mathematics Computational Fluency Supplemental Program Review ► Final Report June 2007 – 106 –
Appendix D: Program Review Document – EXAMPLE* *GRADE LEVEL DOCUMENTS MAY BE DOWNLOADED FROM http://www.k12.wa.us/CurriculumInstruct/Mathematics/default.aspx
Grade 4 Program Number Reviewer Number Review Start Review Finish Total Time on Task
Assessment GLE 1.1.3 GLE 1.1.4 GLE 1.1.5 GLE 1.1.6 Evidence (e.g. p 5, 7)
Score 0 [1 2 3 4]
Evidence (e.g. p 5, 7)
Score 0 [1 2 3 4]
Evidence (e.g. p 5, 7)
Score 0 [1 2 3 4]
Evidence (e.g. p 5, 7)
Score 0 [1 2 3 4]
1. Pre-/ Diagnostic
(min. 1 ea. criteria)
Comm add
___
Meaning of addition for like-denom fractions
___
Multiply whole numbers
___
Comm mult
Assoc add
Assoc mult
Meaning of subtraction for like-denom fractions
Divide whole numbers
Identity add
Identity mult
Zero mult
2. Formative/ Progress Monitoring
(min. 2 ea. criteria)
Comm add
___
Meaning of addition for like-denom fractions
___
Multiply whole numbers
___
Comm mult
Assoc add
Assoc mult
Meaning of subtraction for like-denom fractions
Divide whole numbers
Identity add
Identity mult
Zero mult

OSPI K-12 Mathematics Computational Fluency Supplemental Program Review ► Final Report June 2007 – 107 –
Appendix D: Program Review Document
Grade 4 Program Number Reviewer Number Review Start Review Finish Total Time on Task
Assessment GLE 1.1.3 GLE 1.1.4 GLE 1.1.5 GLE 1.1.6 Evidence (e.g. p 5, 7)
Score 0 [1 2 3 4]
Evidence (e.g. p 5, 7)
Score 0 [1 2 3 4]
Evidence (e.g. p 5, 7)
Score 0 [1 2 3 4]
Evidence (e.g. p 5, 7)
Score 0 [1 2 3 4]
3. Summative/ Post- assessment
(min. 1 ea. criteria)
Comm add
___
Meaning of addition for like-denom fractions
___
Multiply whole numbers
___
Comm mult
Assoc add
Assoc mult
Meaning of subtraction for like-denom fractions
Divide whole numbers
Identity add
Identity mult
Zero mult
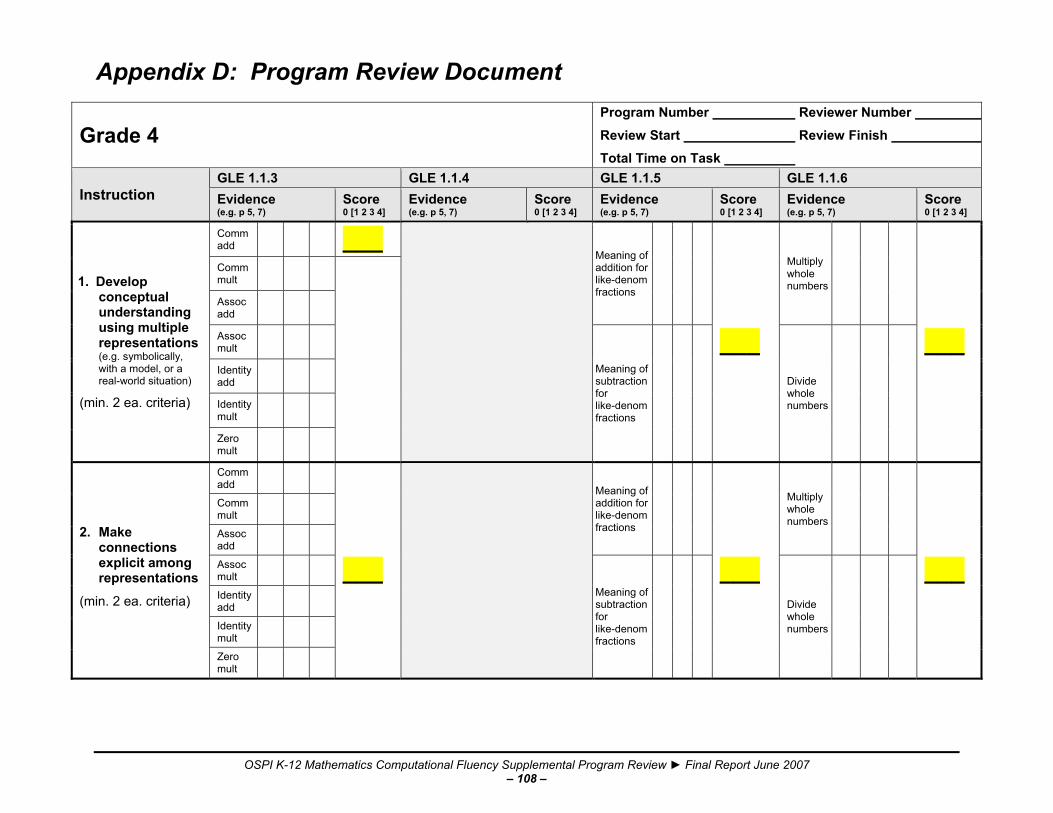
OSPI K-12 Mathematics Computational Fluency Supplemental Program Review ► Final Report June 2007 – 108 –
Appendix D: Program Review Document
Grade 4 Program Number Reviewer Number Review Start Review Finish Total Time on Task
Instruction GLE 1.1.3 GLE 1.1.4 GLE 1.1.5 GLE 1.1.6 Evidence (e.g. p 5, 7)
Score 0 [1 2 3 4]
Evidence (e.g. p 5, 7)
Score 0 [1 2 3 4]
Evidence (e.g. p 5, 7)
Score 0 [1 2 3 4]
Evidence (e.g. p 5, 7)
Score 0 [1 2 3 4]
1. Develop conceptual understanding using multiple representations (e.g. symbolically, with a model, or a real-world situation)
(min. 2 ea. criteria)
Comm add
___
Meaning of addition for like-denom fractions
___
Multiply whole numbers
___
Comm mult
Assoc add
Assoc mult
Meaning of subtraction for like-denom fractions
Divide whole numbers
Identity add
Identity mult
Zero mult
2. Make connections explicit among representations
(min. 2 ea. criteria)
Comm add
___
Meaning of addition for like-denom fractions
___
Multiply whole numbers
___
Comm mult
Assoc add
Assoc mult
Meaning of subtraction for like-denom fractions
Divide whole numbers
Identity add
Identity mult
Zero mult

OSPI K-12 Mathematics Computational Fluency Supplemental Program Review ► Final Report June 2007 – 109 –
Appendix D: Program Review Document
Grade 4 Program Number Reviewer Number Review Start Review Finish Total Time on Task
Instruction GLE 1.1.3 GLE 1.1.4 GLE 1.1.5 GLE 1.1.6 Evidence (e.g. p 5, 7)
Score 0 [1 2 3 4]
Evidence (e.g. p 5, 7)
Score 0 [1 2 3 4]
Evidence (e.g. p 5, 7)
Score 0 [1 2 3 4]
Evidence (e.g. p 5, 7)
Score 0 [1 2 3 4]
3. Use a variety of problem types (e.g. start, change, and result unknown; compare; grouping, rate, price, multiplicative comparison; partitive and measurement division)
(min. 2 ea. criteria)
Comm add
___
Meaning of addition for like-denom fractions
___
Multiply whole numbers
___
Comm mult
Assoc add
Assoc mult
Meaning of subtraction for like-denom fractions
Divide whole numbers
Identity add
Identity mult
Zero mult
4. Use computation in a variety of problem situations (contexts)
(min. 2 ea. criteria)
Comm add
___
Meaning of addition for like-denom fractions
___
Multiply whole numbers
___
Comm mult
Assoc add
Assoc mult
Meaning of subtraction for like-denom fractions
Divide whole numbers
Identity add
Identity mult
Zero mult
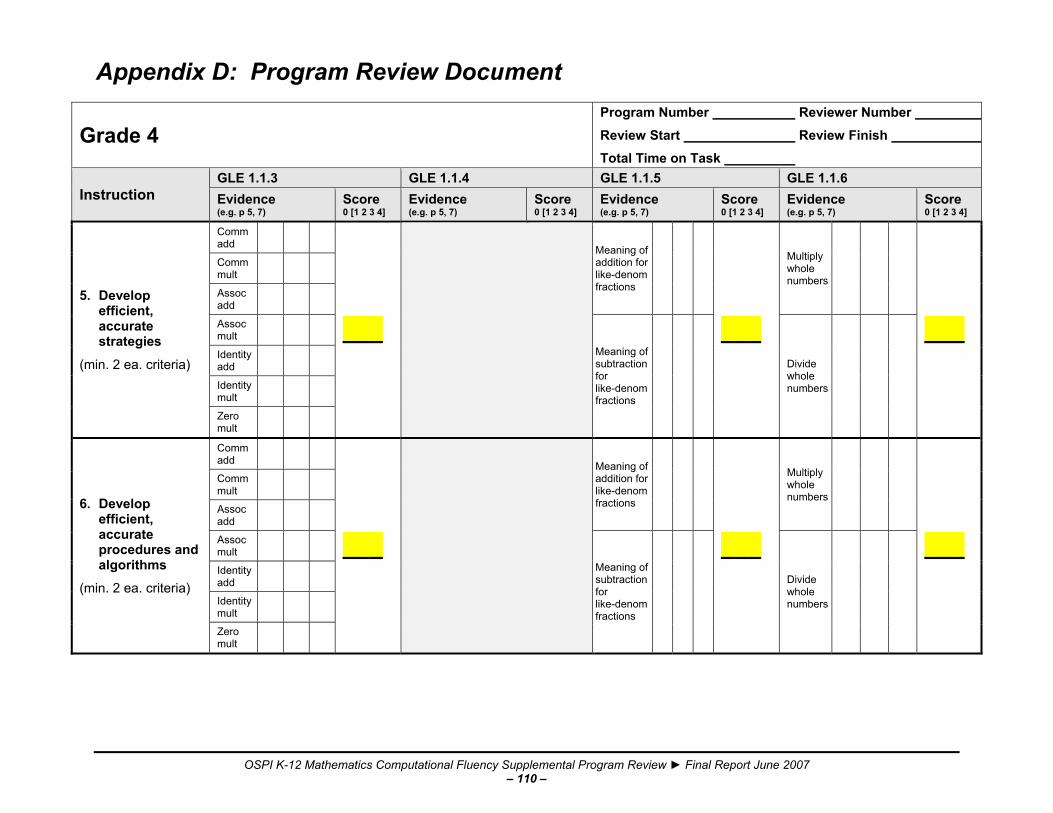
OSPI K-12 Mathematics Computational Fluency Supplemental Program Review ► Final Report June 2007 – 110 –
Appendix D: Program Review Document
Grade 4 Program Number Reviewer Number Review Start Review Finish Total Time on Task
Instruction GLE 1.1.3 GLE 1.1.4 GLE 1.1.5 GLE 1.1.6 Evidence (e.g. p 5, 7)
Score 0 [1 2 3 4]
Evidence (e.g. p 5, 7)
Score 0 [1 2 3 4]
Evidence (e.g. p 5, 7)
Score 0 [1 2 3 4]
Evidence (e.g. p 5, 7)
Score 0 [1 2 3 4]
5. Develop efficient, accurate strategies
(min. 2 ea. criteria)
Comm add
___
Meaning of addition for like-denom fractions
___
Multiply whole numbers
___
Comm mult
Assoc add
Assoc mult
Meaning of subtraction for like-denom fractions
Divide whole numbers
Identity add
Identity mult
Zero mult
6. Develop efficient, accurate procedures and algorithms
(min. 2 ea. criteria)
Comm add
___
Meaning of addition for like-denom fractions
___
Multiply whole numbers
___
Comm mult
Assoc add
Assoc mult
Meaning of subtraction for like-denom fractions
Divide whole numbers
Identity add
Identity mult
Zero mult

OSPI K-12 Mathematics Computational Fluency Supplemental Program Review ► Final Report June 2007 – 111 –
Appendix D: Program Review Document
Grade 4 Program Number Reviewer Number Review Start Review Finish Total Time on Task
Practice GLE 1.1.3 GLE 1.1.4 GLE 1.1.5 GLE 1.1.6 Evidence (e.g. p 5, 7)
Score 0 [1 2 3 4]
Evidence (e.g. p 5, 7)
Score 0 [1 2 3 4]
Evidence (e.g. p 5, 7)
Score 0 [1 2 3 4]
Evidence (e.g. p 5, 7)
Score 0 [1 2 3 4]
1. Use efficient, accurate strategies
(min. 2 ea. criteria)
Comm add
___
Meaning of addition for like-denom fractions
___
Multiply whole numbers
___
Comm mult
Assoc add
Assoc mult
Meaning of subtraction for like-denom fractions
Divide whole numbers
Identity add
Identity mult
Zero mult
2. Use efficient, accurate procedures and algorithms
(min. 2 ea. criteria)
Comm add
___
Multiply whole numbers
___
Comm mult
Assoc add
Assoc mult
Divide whole numbers
Identity add
Identity mult
Zero mult
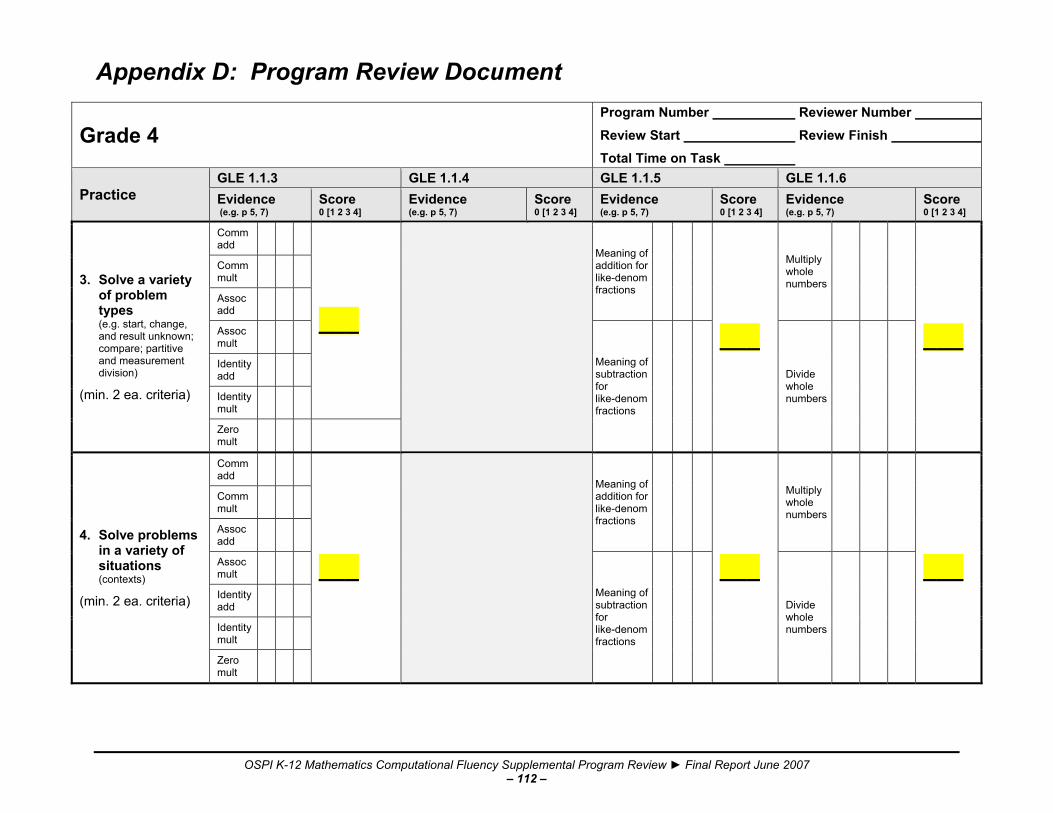
OSPI K-12 Mathematics Computational Fluency Supplemental Program Review ► Final Report June 2007 – 112 –
Appendix D: Program Review Document
Grade 4 Program Number Reviewer Number Review Start Review Finish Total Time on Task
Practice GLE 1.1.3 GLE 1.1.4 GLE 1.1.5 GLE 1.1.6 Evidence (e.g. p 5, 7)
Score 0 [1 2 3 4]
Evidence (e.g. p 5, 7)
Score 0 [1 2 3 4]
Evidence (e.g. p 5, 7)
Score 0 [1 2 3 4]
Evidence (e.g. p 5, 7)
Score 0 [1 2 3 4]
3. Solve a variety of problem types (e.g. start, change, and result unknown; compare; partitive and measurement division)
(min. 2 ea. criteria)
Comm add
___
Meaning of addition for like-denom fractions
___
Multiply whole numbers
___
Comm mult
Assoc add
Assoc mult
Meaning of subtraction for like-denom fractions
Divide whole numbers
Identity add
Identity mult
Zero mult
4. Solve problems in a variety of situations (contexts)
(min. 2 ea. criteria)
Comm add
___
Meaning of addition for like-denom fractions
___
Multiply whole numbers
___
Comm mult
Assoc add
Assoc mult
Meaning of subtraction for like-denom fractions
Divide whole numbers
Identity add
Identity mult
Zero mult

OSPI K-12 Mathematics Computational Fluency Supplemental Program Review ► Final Report June 2007 – 113 –
Appendix D: Program Review Document – Grade Level Review Rubric The “Total Number of Criteria” refers to the number of specific criteria identified in each of GLEs 1.1.3–1.1.6 at each grade level.
Grade Level Review Rubric
Score Indicator Total Number of Criteria (x)
1 2 3 4 5 6 7 8 9 10 11 12 13 14
4 Meets or exceeds all criteria
≥2 >2 >3 >4 ≥5 ≥6 ≥7 ≥8 ≥9 ≥10 ≥11 ≥12 ≥13 ≥14
3 Sufficiently meets criteria
>1 2 3 4 4 5 6 6–7 7–8 8–9 9–10 10–11 10–12 11–13
2 Minimally meets criteria
1 2> x >1 2 2–3 3 4 4–5 5 5–6 6–7 7–8 7–9 8–9 8–10
1 Meets some, but not all, criteria
Partially met 1
1 1 1 1–2 1–3 1–3 1–4 1–4 1–5 1–6 1–6 1–7 1–7
0 Meets no criteria 0 0 0 0 0 0 0 0 0 0 0 0 0 0
Program Feature Review Rubric
Score Indicator Criteria
0 No There is inconsistent or no evidence that meets the required criteria.
1 Yes There is consistent evidence that meets the required criteria.

OSPI K-12 Mathematics Computational Fluency Supplemental Program Review ► Final Report June 2007 – 114 –
Appendix D: Program Review Document
Review Start Date/Time Review Finish Date/Time Total Time on Task
Program Number Grade Level Reviewer Number
Assessment Supporting Evidence Consistent? 0 = No; 1 =Yes
1. Program has flexibility to use screening assessment to place students at an appropriate entry point.
2. Multiple assessments are provided: pre-/diagnostic assessment, formative assessment/progress monitoring, and summative assessment.
See Grade Level Review
3. Program provides clear guidelines for using assessment information to differentiate instruction and report progress.
4. Assessments measure the understanding and application of concepts, strategies, procedures, and algorithms in the instructional program.
See Grade Level Review
5. Program provides specific criteria for determining student’s recall/automaticity in computation (e.g.: number of correct digits per minute).
6. Assessments vary in administration (group and individual) and in types of tasks (e.g. multiple choice, short answer, extended response).
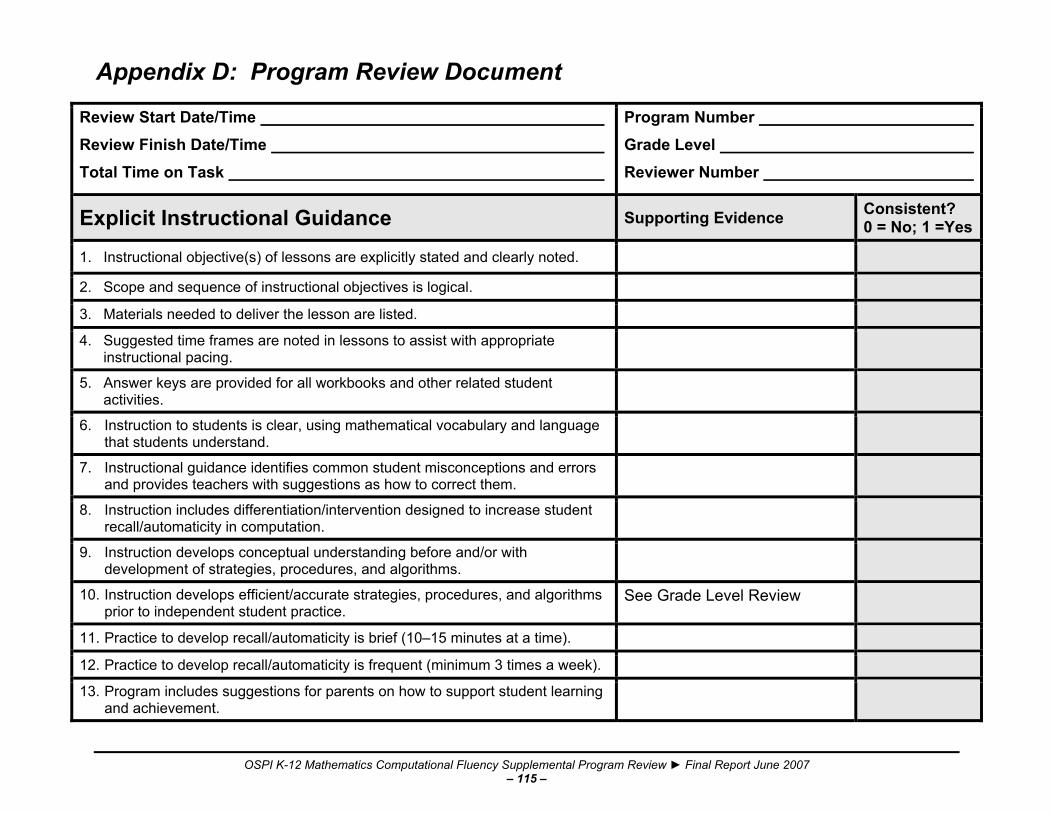
OSPI K-12 Mathematics Computational Fluency Supplemental Program Review ► Final Report June 2007 – 115 –
Appendix D: Program Review Document
Review Start Date/Time Review Finish Date/Time Total Time on Task
Program Number Grade Level Reviewer Number
Explicit Instructional Guidance Supporting Evidence Consistent? 0 = No; 1 =Yes
1. Instructional objective(s) of lessons are explicitly stated and clearly noted.
2. Scope and sequence of instructional objectives is logical.
3. Materials needed to deliver the lesson are listed. 4. Suggested time frames are noted in lessons to assist with appropriate
instructional pacing.
5. Answer keys are provided for all workbooks and other related student activities.
6. Instruction to students is clear, using mathematical vocabulary and language that students understand.
7. Instructional guidance identifies common student misconceptions and errors and provides teachers with suggestions as how to correct them.
8. Instruction includes differentiation/intervention designed to increase student recall/automaticity in computation.
9. Instruction develops conceptual understanding before and/or with development of strategies, procedures, and algorithms.
10. Instruction develops efficient/accurate strategies, procedures, and algorithms prior to independent student practice.
See Grade Level Review
11. Practice to develop recall/automaticity is brief (10–15 minutes at a time). 12. Practice to develop recall/automaticity is frequent (minimum 3 times a week). 13. Program includes suggestions for parents on how to support student learning
and achievement.
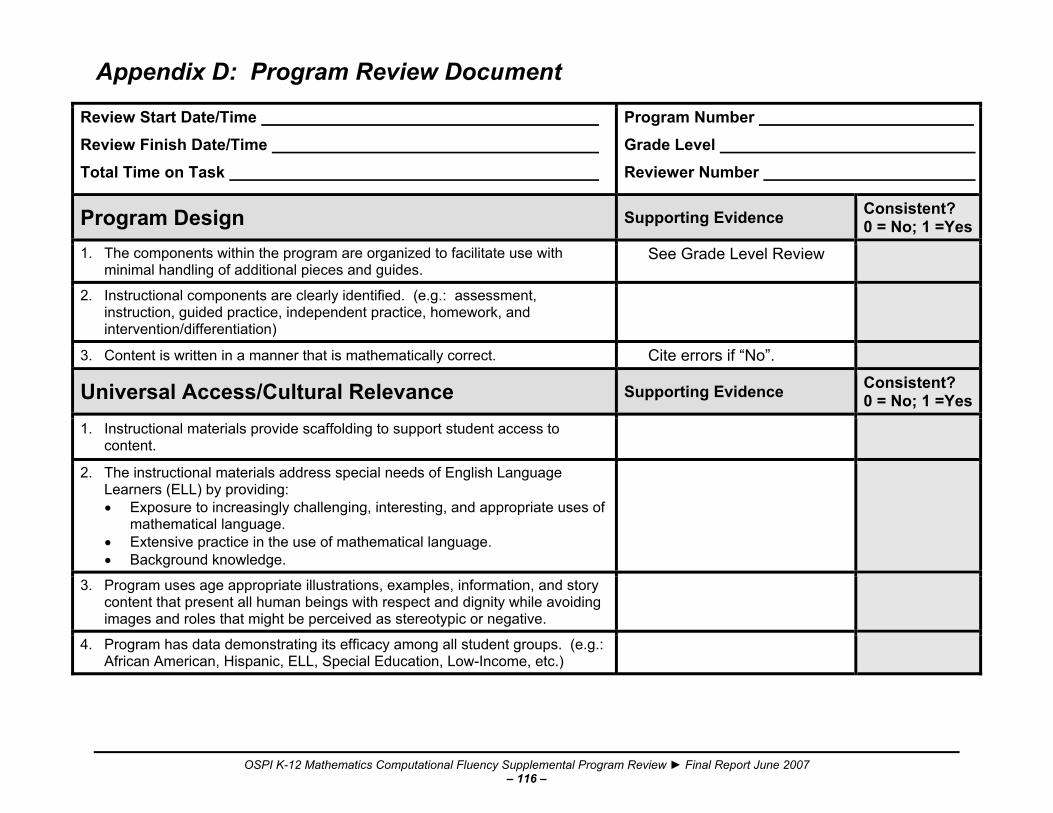
OSPI K-12 Mathematics Computational Fluency Supplemental Program Review ► Final Report June 2007 – 116 –
Appendix D: Program Review Document
Review Start Date/Time Review Finish Date/Time Total Time on Task
Program Number Grade Level Reviewer Number
Program Design Supporting Evidence Consistent? 0 = No; 1 =Yes
1. The components within the program are organized to facilitate use with minimal handling of additional pieces and guides.
See Grade Level Review
2. Instructional components are clearly identified. (e.g.: assessment, instruction, guided practice, independent practice, homework, and intervention/differentiation)
3. Content is written in a manner that is mathematically correct. Cite errors if “No”.
Universal Access/Cultural Relevance Supporting Evidence Consistent? 0 = No; 1 =Yes
1. Instructional materials provide scaffolding to support student access to content.
2. The instructional materials address special needs of English Language Learners (ELL) by providing: • Exposure to increasingly challenging, interesting, and appropriate uses of
mathematical language. • Extensive practice in the use of mathematical language. • Background knowledge.
3. Program uses age appropriate illustrations, examples, information, and story content that present all human beings with respect and dignity while avoiding images and roles that might be perceived as stereotypic or negative.
4. Program has data demonstrating its efficacy among all student groups. (e.g.: African American, Hispanic, ELL, Special Education, Low-Income, etc.)

OSPI K-12 Mathematics Computational Fluency Supplemental Program Review ► Final Report June 2007 – 117 –

OSPI K-12 Mathematics Computational Fluency Supplemental Program Review ► Final Report June 2007 – 118 –
Appendix E: Data Analysis Approach Historically, OSPI has used several different approaches to analyze data collected from mathematics material reviews. In the K–12 Mathematics Diagnostic-Intervention Program Review the data was presented using medians. This is because the reports focused on thinly sliced data with 4 data elements per sample. In this instance, the median approach is warranted, to ensure that individual outliers in the 4-sample data set do not unduly influence the outcome. For example, consider the ratings (0, 4, 4, 4). The average of that data set is 3, while the median is 4. Using a median with very small samples reduces the influence of outliers. Based on feedback from users of prior reports, OSPI approached the analysis a different way this year. OSPI recognized that school districts and curriculum specialists wanted a more global aggregate comparison of the available computational fluency curricula. Users were asking questions like how well does each program match Grade Level Expectations across all elementary grades, and which programs have the greatest emphasis on instruction at the high school level? With that in mind, we approached the data analysis in a different way. Shifting from collapsing the data from thousands of individual assessment criteria with 4 data points for each sample to aggregating the data for each program by Grade Level Expectation or Program Element (Assessment, Instruction, Practice) seemed to be a better approach. Then sample sets had hundreds to thousands of data points allowing the use of statistical methods more suited to the sample size and data characteristics. The mathematics computational fluency review data is ordinal in nature. It consists of rankings 0–4. There were 32,000+ rankings, across grades K–12, in 40 programs. Given the number of rankings and the relative value of the ordinal data (e.g. a rating of 4 is better than a rating of 3) the data could be treated as either ordinal or interval. Each program-grade sample was compared to its corresponding population of ratings for all programs within that grade. For example, the sample of ratings from fourth grade Math Expeditions was compared to the population of all ratings for all programs for the fourth grade. Three statistical tests were compared to determine which was the most robust to use with the data. The statistical tests were:
• Student’s t-test (parametric) • Mann-Whitney U Test (non-parametric) • Mood Median Test (non-parametric)
To determine which test to use for subsequent analysis, six random samples were selected from all program-grade samples, and compared to their respective grades. The point of this initial “test” of the statistical tests was to determine if all the tests consistently resulted in the same outcome. In the statistical world, parametric tests are generally considered more robust than non-parametric tests. However, parametric tests generally assume a normal distribution of data. If the data is not normally distributed, and is nominal or ordinal in nature, a non-parametric test may be warranted. If the sample size is sufficiently large, it is possible to use a t-test even if the data is not normally distributed. The sample sets and the population sets in the Mathematics Computational Fluency project were sufficiently large to allow consideration of the t-test, even though the data was not normally distributed.
OSPI K-12 Mathematics Computational Fluency Supplemental Program Review ► Final Report June 2007 – 119 –
Appendix E: Data Analysis Approach Findings The Student’s t-test allowed the most robust analysis of the difference of two sample means. The Mann-Whitney U Test had consistent results with the Student’s t-test. The Mood Median test, considered the weakest of the three, produced inconsistent results compared to the other two tests. Given the equivalent outcomes for the Student’s t-test and the Mann-Whitney U test, and the general propensity to use a parametric test where possible, the project team decided to use the Student’s t-test as the de facto choice of statistical analysis tests for all program-grade combinations. A sample was defined as all the ratings for a particular program-grade combination. The population it was compared to was all the ratings for the specific grade. The null hypothesis was that the sample mean was no different than the population mean. The alternate hypothesis is that a difference of means existed. In all six random samples shown, the Student’s t-test showed that a statistically significant difference of means existed between the sample and the population. In other words, we can demonstrate that the random programs selected did indeed have a difference in average ratings that could not be attributed to chance alone. The results from the three statistical tests for six random program-grade samples are shown.

OSPI K-12 Mathematics Computational Fluency Supplemental Program Review ► Final Report June 2007 – 120 –
Appendix E: Data Analysis Approach Grade 3, Program A
t-test Result for Datasets: Set 1 Range = Grade 3 Set 2 Range = Gr 3, Program A Descriptive Statistics
Variable Mean Std
Dev. Std ErrLower
95% CLUpper 95%
CL NColumn I 1.243 1.656 0.026 1.192 1.295 4033Column I 0.820 1.462 0.052 0.717 0.923 778 2-tailed t-test
Ho. Diff Mean
Diff. SE
Diff. T DF P 0.000 0.423 0.059 7.233 1195.013 0.000
F-Test for Equality of Variances
Variable Variance F DF 1 DF 2 P Column I 2.742 1.283 4032 777 0.000 Column I 2.137 Sample variances differ at the specified alpha of 0.0500 so the individual variances are used in the t-test.
Mann-Whitney Test Results for: Set 1 Range = Grade 3 Set 2 Range = Gr 3, Program A 2-tailed Test
U DF 1 DF 2 P1785416.000 4033 778 0.000
Mood Median Test Results for: Grade 3, Program A Grand Median = 0 Counts
Grade 3 Program A > Grand Median 1626 35 <= Grand Median 2407 113 Test Results
Statistic Value DF P Chi-Square 16.566 1 0.000 Yates Correction 15.877 1 0.000 Cochran Correction 16.155 1 0.000 Log-Likelihood 17.716 1 0.000
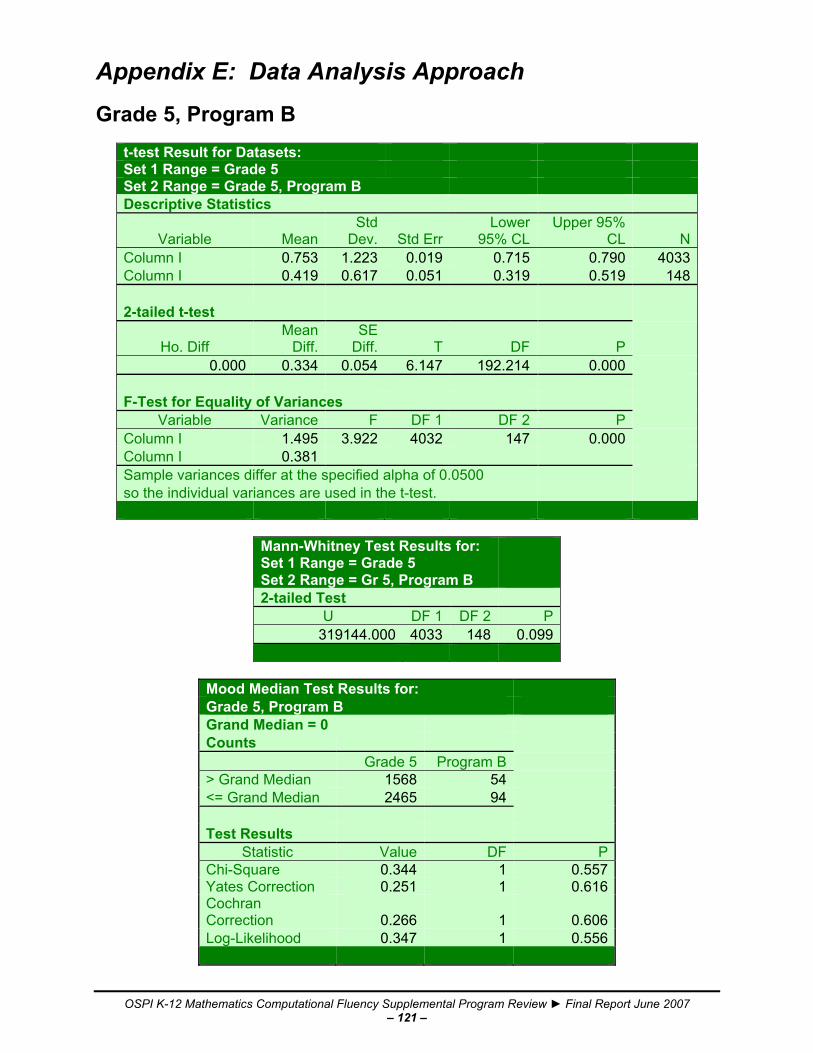
OSPI K-12 Mathematics Computational Fluency Supplemental Program Review ► Final Report June 2007 – 121 –
Appendix E: Data Analysis Approach Grade 5, Program B
t-test Result for Datasets: Set 1 Range = Grade 5 Set 2 Range = Grade 5, Program B Descriptive Statistics
Variable Mean Std
Dev. Std ErrLower
95% CLUpper 95%
CL NColumn I 0.753 1.223 0.019 0.715 0.790 4033Column I 0.419 0.617 0.051 0.319 0.519 148 2-tailed t-test
Ho. Diff Mean
Diff. SE
Diff. T DF P 0.000 0.334 0.054 6.147 192.214 0.000
F-Test for Equality of Variances
Variable Variance F DF 1 DF 2 P Column I 1.495 3.922 4032 147 0.000 Column I 0.381 Sample variances differ at the specified alpha of 0.0500 so the individual variances are used in the t-test.
Mann-Whitney Test Results for: Set 1 Range = Grade 5 Set 2 Range = Gr 5, Program B 2-tailed Test
U DF 1 DF 2 P319144.000 4033 148 0.099
Mood Median Test Results for: Grade 5, Program B Grand Median = 0 Counts
Grade 5 Program B > Grand Median 1568 54 <= Grand Median 2465 94 Test Results
Statistic Value DF P Chi-Square 0.344 1 0.557 Yates Correction 0.251 1 0.616 Cochran Correction 0.266 1 0.606 Log-Likelihood 0.347 1 0.556
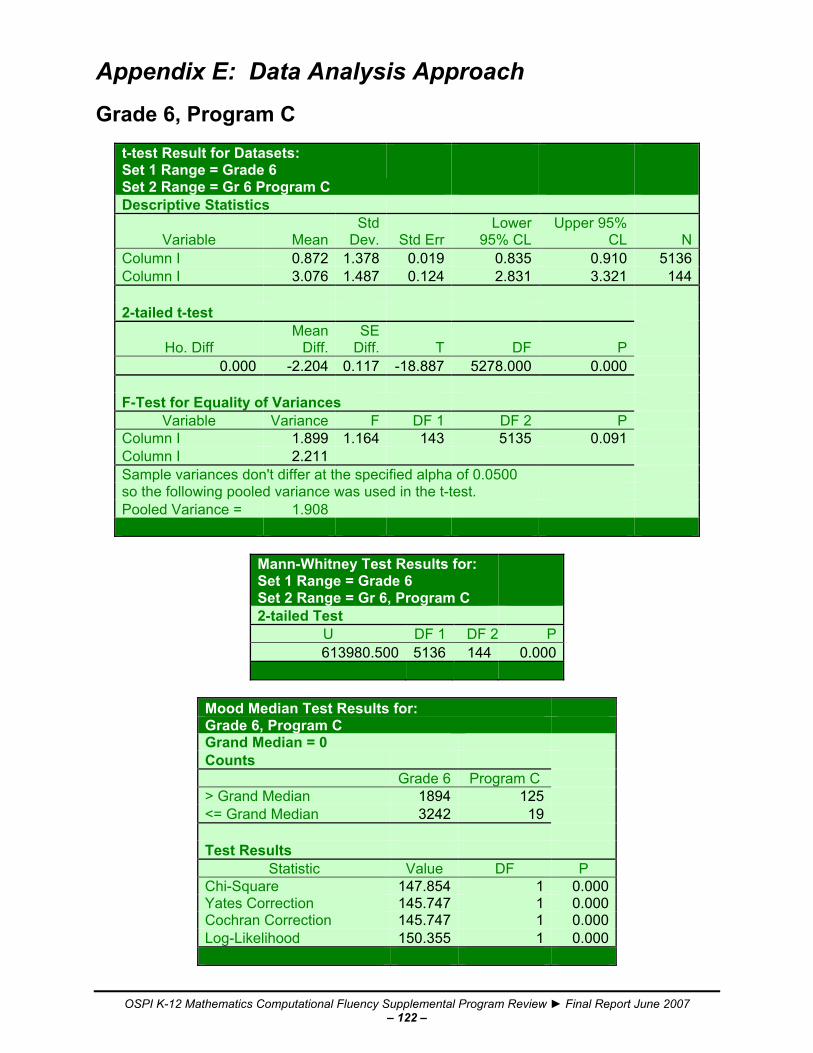
OSPI K-12 Mathematics Computational Fluency Supplemental Program Review ► Final Report June 2007 – 122 –
Appendix E: Data Analysis Approach Grade 6, Program C
t-test Result for Datasets: Set 1 Range = Grade 6 Set 2 Range = Gr 6 Program C Descriptive Statistics
Variable MeanStd
Dev. Std ErrLower
95% CLUpper 95%
CL NColumn I 0.872 1.378 0.019 0.835 0.910 5136Column I 3.076 1.487 0.124 2.831 3.321 144 2-tailed t-test
Ho. Diff Mean
Diff.SE
Diff. T DF P 0.000 -2.204 0.117 -18.887 5278.000 0.000
F-Test for Equality of Variances
Variable Variance F DF 1 DF 2 P Column I 1.899 1.164 143 5135 0.091 Column I 2.211 Sample variances don't differ at the specified alpha of 0.0500 so the following pooled variance was used in the t-test. Pooled Variance = 1.908
Mann-Whitney Test Results for: Set 1 Range = Grade 6 Set 2 Range = Gr 6, Program C 2-tailed Test
U DF 1 DF 2 P613980.500 5136 144 0.000
Mood Median Test Results for: Grade 6, Program C Grand Median = 0 Counts
Grade 6 Program C > Grand Median 1894 125 <= Grand Median 3242 19 Test Results
Statistic Value DF P Chi-Square 147.854 1 0.000 Yates Correction 145.747 1 0.000 Cochran Correction 145.747 1 0.000 Log-Likelihood 150.355 1 0.000

OSPI K-12 Mathematics Computational Fluency Supplemental Program Review ► Final Report June 2007 – 123 –
Appendix E: Data Analysis Approach Grade 9/10, Program D
t-test Result for Datasets: Set 1 Range = Grade 9/10 Set 2 Range = Gr 9/10, Program D Descriptive Statistics
Variable Mean Std
Dev. Std ErrLower
95% CLUpper 95%
CL NColumn I 0.548 0.988 0.022 0.504 0.592 1950Column I 0.838 0.965 0.089 0.661 1.014 117 2-tailed t-test
Ho. Diff Mean
Diff. SE
Diff. T DF P 0.000 -0.289 0.094 -3.081 2065.000 0.002
F-Test for Equality of Variances
Variable Variance F DF 1 DF 2 P Column I 0.976 1.050 1949 116 0.376 Column I 0.930 Sample variances don't differ at the specified alpha of 0.0500 so the following pooled variance was used in the t-test. Pooled Variance = 0.974
Mann-Whitney Test Results for: Set 1 Range = Grade 9/10 Set 2 Range = Gr 9/10, Program D 2-tailed Test
U DF 1 DF 2 P140176.000 1950 117 0.000
Mood Median Test Results for: Grade 9/10 Program D Grand Median = 0 Counts
Grade
9/10 Program D > Grand Median 638 67 <= Grand Median 1312 50 Test Results
Statistic Value DF P Chi-Square 29.593 1 0.000 Yates Correction 28.511 1 0.000 Cochran Correction 29.387 1 0.000 Log-Likelihood 27.821 1 0.000
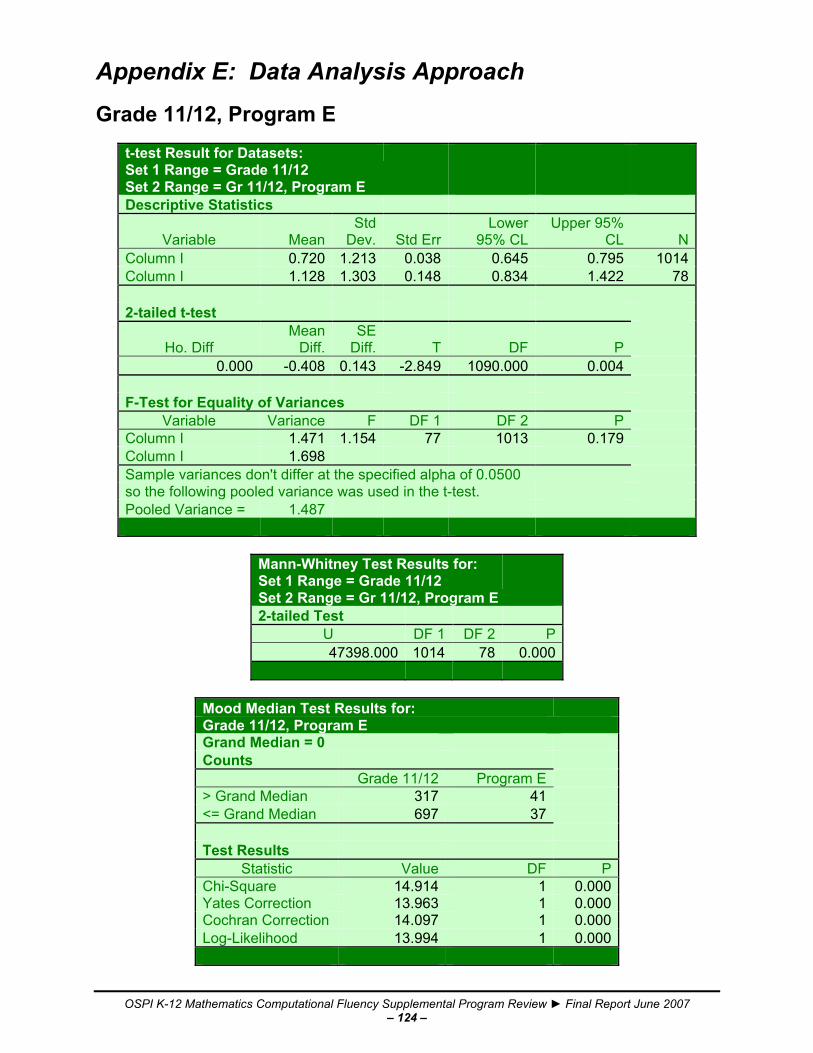
OSPI K-12 Mathematics Computational Fluency Supplemental Program Review ► Final Report June 2007 – 124 –
Appendix E: Data Analysis Approach Grade 11/12, Program E
t-test Result for Datasets: Set 1 Range = Grade 11/12 Set 2 Range = Gr 11/12, Program E Descriptive Statistics
Variable Mean Std
Dev. Std ErrLower
95% CLUpper 95%
CL NColumn I 0.720 1.213 0.038 0.645 0.795 1014Column I 1.128 1.303 0.148 0.834 1.422 78 2-tailed t-test
Ho. Diff Mean
Diff. SE
Diff. T DF P 0.000 -0.408 0.143 -2.849 1090.000 0.004
F-Test for Equality of Variances
Variable Variance F DF 1 DF 2 P Column I 1.471 1.154 77 1013 0.179 Column I 1.698 Sample variances don't differ at the specified alpha of 0.0500 so the following pooled variance was used in the t-test. Pooled Variance = 1.487
Mann-Whitney Test Results for: Set 1 Range = Grade 11/12 Set 2 Range = Gr 11/12, Program E 2-tailed Test
U DF 1 DF 2 P47398.000 1014 78 0.000
Mood Median Test Results for: Grade 11/12, Program E Grand Median = 0 Counts
Grade 11/12 Program E > Grand Median 317 41 <= Grand Median 697 37 Test Results
Statistic Value DF P Chi-Square 14.914 1 0.000 Yates Correction 13.963 1 0.000 Cochran Correction 14.097 1 0.000 Log-Likelihood 13.994 1 0.000

OSPI K-12 Mathematics Computational Fluency Supplemental Program Review ► Final Report June 2007 – 125 –
Appendix E: Data Analysis Approach Grade 11/12, Program F
t-test Result for Datasets: Set 1 Range = Grade 11/12 Set 2 Range = Gr 11/12, Program F Descriptive Statistics
Variable Mean Std
Dev. Std ErrLower
95% CLUpper 95%
CL NColumn I 0.720 1.213 0.038 0.645 0.795 1014Column I 0.321 0.781 0.088 0.144 0.497 78 2-tailed t-test
Ho. Diff Mean
Diff. SE
Diff. T DF P 0.000 0.399 0.096 4.147 107.929 0.000
F-Test for Equality of Variances
Variable Variance F DF 1 DF 2 P Column I 1.471 2.411 1013 77 0.000 Column I 0.610 Sample variances differ at the specified alpha of 0.0500 so the individual variances are used in the t-test.
Mann-Whitney Test Results for: Set 1 Range = Grade 11/12 Set 2 Range = Gr 11/12, Program F 2-tailed Test
U DF 1 DF 2 P45711.500 1014 78 0.005
Mood Median Test Results for: Grade 11/12, Program F Grand Median = 0 Counts
Grade 11/12 Program F > Grand Median 317 13 <= Grand Median 697 65 Test Results
Statistic Value DF P Chi-Square 7.317 1 0.007 Yates Correction 6.641 1 0.010 Cochran Correction 7.218 1 0.007 Log-Likelihood 8.122 1 0.004
OSPI K-12 Mathematics Computational Fluency Supplemental Program Review ► Final Report June 2007 – 126 –
Acknowledgments OSPI would like to thank the reviewers for their extraordinary commitment of time and expertise to this review. Their professionalism and thorough review of each program was invaluable. Our deep appreciation goes to each one. K–12 COMPUTATIONAL FLUENCY SUPPLEMENTAL PROGRAM REVIEW PANEL Debbie Aldous Heidi Cowen Jean Kilian Mary Jo Ormsby Kimberlee Armstrong Jenneifer DeLashmutt Keri Klayum May Ovalles Sharron Aune-Ruland Tammy Droppo Anton Kramer Jeremy Rogers Ida Baird Kathleen Gibson Lillian Lahiri Judith Serrano Catherine Ball Carolyn Gordon Linda Larson Tara Staeheli Jennifer Beymer Shari Hartwig Carole Leininger Pamela Stephens Steve Blum-Anderson Shawna Hoggard Nancy Lenihan Beth Stoebuck Brian Brockmueller Tricia Hukee Deanna Lomax Marge Van Tress Krista Canterbury Paulette Johnson Kristen Maxwell Sherry Vandeventer Kyung Chung Char Kendall Annette Moir Gloria Williamson OSPI STAFF Mickey Venn Lahmann, Assistant Superintendent, Curriculum and Instruction Jessica Vavrus, Program Manager, Curriculum and Instruction Beverly Neitzel, Director, Mathematics Initiative Kathy Dornhecker, Mathematics Initiative Specialist Dorian “Boo” Drury, Mathematics Initiative Specialist Lynda Eich, Mathematics Initiative Specialist Karen Hall, Mathematics Initiative Specialist Robert Hodgman, Mathematics Initiative Specialist Mary Holmberg, Teacher on Special Assignment Karrin Lewis, Mathematics Initiative Specialist Gloria Hong, Mathematics Initiative Support Lee Ann Mills, Mathematics Initiative Support Kristina Quimby, Mathematics Initiative Support EXTERNAL CONSULTANTS Porsche Everson, Relevant Strategies Eugene Ryser, Consultant