k-12 general-education teachers’ voluntary resignations ... · k-12 general-education teachers’...
TRANSCRIPT

Paul R. Brandon, Ph.D.
October 2000
HAWAI‘I EDUCATIONAL POLICY CENTERI n f o r m i n g t h e E d u c a t i o n C o m m u n i t y
K-12 General-Education Teachers’ Voluntary Resignationsfrom the Hawai‘i Department of Education:Demographics, Reasons for Leaving, Dissatisfactions,
and Suggestions for Improvement
The author, who is Research Professor of Educational Evaluation at Curriculum Research & Development Group (CRDG),University of Hawai‘i at Manoa, conducted this study for the Hawai‘i Educational Policy Center (HEPC). HEPC funded CRDG toprovide staffing, supplies, and postage. Much of the author’s time was provided by CRDG as an in-kind contribution. The authorgratefully acknowledges the assistance of Terry Ann F. Higa, who under severe time constraints, carefully and conscientiouslysupervised data collection and assisted in report table preparation and report editing.

HAWAI‘I EDUCATIONAL POLICY CENTER
The Hawai‘i Educational Policy Center (HEPC) is an independent policy researchorganization that provides timely, concise, relevant and objective policy briefs, reports,articles, studies, forums, and workshops that reflect the needs and requests of Hawai‘ipolicymakers. HEPC strives to become a trusted partner with policymakers in efforts tounderstand, nurture, improve, and adopt the best and most appropriate policies for ourlife-long learners in Hawai‘i.
The Hawai‘i Educational Policy Center…
� Works with policymakers to identify what information they need.
� Reviews, collects and distributes information on existing research on issues relevant toHawai‘i.
� Provides concise, objective, independent analysis of research.
� Provides timely, targeted, interpreted data, briefings and testimony for policymakers.
� Maintains a website with links to cutting-edge research and policy.
� Commissions a range of policy briefs, articles, studies and reports that generate newknowledge and insights that inform policy decisions.
� Conducts, facilitates, and participates in educational forums and workshops.
� Initiates research on emerging and enduring issues that affect the quality of schoolsand the quality of learning.
C o n t a c t U s
THE HAWAI‘I EDUCATIONAL POLICY CENTER1776 University Avenue, UES 103 • Honolulu, HI 96822-2463
Phone: (808) 956-9563 • Fax: (808) 956-5665Email: [email protected] • Website: www.hawaii.edu/hepc

K–12 General-Education Teachers’ Voluntary Resignations from theHawai‘i Department of Education: Demographics, Reasons for
Leaving, Dissatisfactions, and Suggestions for Improvement
Executive Summary
This is the executive summary of the report of a teacher-attrition survey of Hawai‘iDepartment of Education (DOE) elementary and secondary general-education teachers. Itspurpose is to inform Hawai‘i policymakers who are addressing issues of DOE teacher supplyand demand. The five questions addressed here are:
1) What are the demographic characteristics of elementary and secondary teachers whorecently resigned their DOE jobs?
2) What reasons do recently resigned teachers give for having left their DOE positions?3) Of the teachers who reported having recently left the DOE because they were
dissatisfied with teaching as a career, what were their primary dissatisfactions with their jobsand the DOE?
4) What are recently resigned teachers’ opinions about the steps the DOE might take toencourage teachers to remain in their jobs?
5) What findings of the report might have implications for educational policy making inHawai‘i?
The survey discussed here was of K–12 general-education teachers who resigned duringSchool Years (SY) 1997–98, 1998–99, and 1999–2000. It was conducted in September 2000.Demographic data provided by the DOE were also analyzed. Of the 681 former teachers whoresigned during the three-year period, 44% responded. Furthermore, with the exceptions ofa somewhat less-than-desirable response rate for younger teachers, and possibly of a lower-than-desirable response rate for former teachers who moved to the mainland, analysesshowed that the survey results are reasonably representative of the total group of resignedteachers.
The highlights of the report’s findings, with some possible implications, include:C On average, 225 teachers (about 2.4% of all DOE teachers) voluntarily leave their
positions each year. This percentage is considerably smaller than the 4.2% of teacherswho typically leave their positions for reasons of retirement, termination, or death eachyear, and it is markedly lower than the 5.6% reported nationwide in the mid-1990s.Unless recent resignation rates in Hawai‘i are anomalous (e.g., because the slow Hawai‘ieconomy did not provide alternative employment opportunities for teachers who wishedto leave teaching), it is reasonable to conclude that teacher attrition is not as critical anissue in Hawai‘i as on the mainland. One possible implication of this finding is that,before taking steps to encourage this group to stay in the DOE, policymakers might wishto speculate whether the benefits will be worth the costs.
C Of all the respondents to the survey, six in ten gave a reason for leaving that had to dowith teaching issues, nearly six in 10 indicated a personal or family reason, about onein four indicated they left to take other jobs, a little less than two in 10 indicated a reasonthat had to do with moving, and about one in 10 gave a reason that had to do withpursuing more education. These results contradict common perceptions about largeproportions of teachers leaving the DOE because they move to the mainland. However,
ii
the proportion of survey respondents who indicated they left the DOE to move to themainland might be small, because this group was more difficult than Hawai‘i residentsto reach by mail.
C A substantial proportion of former teachers reported significant dissatisfaction withteaching. About four in ten of the survey respondents indicated that they left theirpositions because they were dissatisfied with teaching as a career—a much largerproportion than the 8% reported in national studies. The Hawai‘i findings might be duein part to a sample self-selection bias (i.e., highly dissatisfied teachers might have beenmore likely to return questionnaires than less-dissatisfied teachers), but they might alsobe due to problems intrinsic in DOE teaching that are more troublesome than in mostmainland educational jurisdictions.
C A substantial proportion of resigned teachers might be receptive to encouragement tostay in their DOE positions. Of the teachers who voluntarily resigned during the threeyears addressed in the survey, about four in ten are working in education now, and abouthalf stated they plan to work in education next school year. If the DOE, College ofEducation, and other institutions or agencies are to take steps to reduce teacher attrition,this group might be receptive to any remedies that might be devised.
C Of the total group of survey respondents, about two-thirds said that higher salaries and/orbetter fringe benefits would encourage teachers to stay, about four in 10 mentioneddecreasing class sizes, and about three in 10 mentioned issues of inadequate classroomresources and materials or issues of student discipline and school safety.
C Younger teachers make up a substantial proportion of resigning teachers. The proportionof teachers 39 years of age or younger who resigned (66%) is almost double theproportion that this age group comprised of all current DOE teachers. The finding thatthe youngest teachers have the highest resignation rate reflects trends noted in nationalstudies. The survey results do not help us learn precisely how to target this group,because they show no significant differences among age groups’ reasons for leaving, butthe results do show that, across all age groups, women are more likely than men to leavefor personal or family reasons, and men are more likely than women to leave because ofdissatisfaction with salaries or benefits.
C The Leeward and Windward Districts are losing proportionately more teachers than theother five districts.
C Secondary-level teachers are leaving at a higher rate than elementary-level teachers;during the past three years, about 3.0% the former group left their positions, whereasabout 1.8% of the latter group left their positions.

1Except for a few teachers, whom the DOE mistakenly included in the set of names it provided for this study,teachers who retired or left involuntarily during this period were not surveyed.
2This section is not based a comprehensive literature review. The author searched the Internet for reports aboutteacher attrition. Sufficient information was obtained to help (a) prepare the background section of this report,(b) structure and interpret the findings of data analyses, and (c) make conclusions about the findings of thestudy in light of what is known about teacher attrition nationwide. This information (not specifically cited inthe text of this report) was found in Boe, Bobbitt, Cook, Whitener, and Weber (1996); Croasmun, Hampton,& Herrmann (n. d.); Fetler (1997); National Center for Education Statistics. (2000); and Wayne (2000).
K–12 General-Education Teachers’ Voluntary Resignations from theHawai‘i Department of Education: Demographics, Reasons for
Leaving, Dissatisfactions, and Suggestions for Improvement
Purpose and Policy-Research QuestionsThis is a report of a teacher-attrition survey of elementary and secondary general-
education teachers who voluntarily resigned from the Hawai‘i Department of Education(DOE) in recent years. The purpose of the report is inform local policymakers about thedemographics of these teachers, their reasons for leaving their DOE positions, the primarydissatisfactions they expressed about their DOE jobs, and issues that might be addressedwhen developing policy to improve teacher retention.
The focus of the report is on a survey of DOE teachers who resigned during SchoolYears (SY) 1997–98, 1998–99, and 1999–2000.1 The report addresses five policy-researchquestions:
•Question 1. What are the demographic characteristics of elementary and secondaryteachers who recently resigned their DOE jobs?•Question 2. What reasons do recently resigned teachers give for having left their DOEpositions?•Question 3. Of the teachers who reported having recently left the DOE because theywere dissatisfied with teaching as a career, what were their primary dissatisfactions withtheir jobs and the DOE?•Question 4. What are recently resigned teachers’ opinions about the steps the DOEmight take to encourage teachers to remain in their jobs?•Question 5. What findings of the report might have implications for educational policymaking in Hawai‘i?
Background2
The National Center for Education Statistics (NCES) (2000) has projected that public-school K–12 student enrollment will increase 9.9% in Hawai‘i between 2000 and 2010 . Theavailability of teachers to address this deficit typically is affected by several supply-and-demand factors. These include (a) the number of teacher-preparation graduates and thecapacity of teacher colleges to produce new graduates, (b) the availability and success of
3The surveys were the Schools and Staffing Survey and the Teacher Follow-up Survey.
4I am most grateful to the DOE for its prompt assistance in providing these files.
2
programs designed to entice people from industry and business into teaching, (c) class-sizepolicies, (d) standards that teachers must achieve, (e) the number of less-than-fully qualifiedpeople available and willing to enter teaching on an emergency basis, (f) the rate at whichteachers retire or are terminated, and (g) the rate at which teachers voluntarily resign—thatis, the teacher-attrition rate.
Teacher attrition is affected by factors such as salaries, working conditions, family eventsor conditions, departures to pursue educational or employment opportunities, school staffingactions (e.g., undesirable reassignments), and dissatisfaction with teaching as a career.Surveys conducted by NCES in 1990–91 and 1991–92 showed 5.6% attrition amonggeneral-education teachers at public schools and 12.7% at private schools.3 Attrition ratesin California by the beginning of teachers’ 7th year of service have been estimated at abouthalf.
Much of the focus on the demographic characteristics of departing teachers has been ontheir age groups. Attrition is highest among the youngest teachers (except for attrition dueto retirement in the oldest age group); across all age groups, the longer teachers have taught,the less likely they are to leave teaching before retirement. NCES data show that, ofdeparting teachers with less than four years experience, 44% who left cited personal andfamily reasons, 17% left involuntarily (due to staffing actions), and 12% left to go to school;only 8% cited dissatisfaction with teaching as a career. Teachers with young children aremore likely to resign than are teachers with older children. Departing teachers’ age groupis considered in the analyses conducted for this study, as well as other demographiccharacteristics that are of interest, including job positions (elementary vs. secondaryteachers), school district, education levels, gender, and marital status.
Survey MethodsTo answer the five questions addressed in this study, two data-collection and -analysis
efforts were conducted. First, with the help of the Hawai‘i Educational Policy Center(HPEC) director, Dr. Scott Thomas, the author obtained and analyzed computer files fromthe DOE’s Office of Personnel Services and its Information System Services Branch.4 Onefile included demographic information about all DOE personnel who voluntarily resignedduring SYs 1997–98, 1998–99, and 1999–2000. This information was used to identify

5A copy of the HTFS is provided in Appendix A.
6For example, the DOE Evaluation Section has routinely found that the best response rate it can expect in mailsurveys (e.g., alumni surveys) is about 30%.
3
respondents for the survey described in the next paragraph and to analyze the data bydemographic group. Another file included demographic information on all DOE teachersduring the three years. This information was used to compare the demographic characteris-tics of the recently resigned DOE teachers with the full set of DOE teachers. All data werekept in secure computer files and analyzed confidentially.
Second, in collaboration with the HEPC director, the author developed a questionnaire,the Hawai‘i Teacher Follow-Up Survey (HTFS), distributed it to recently resigned DOEteachers, and analyzed the collected data.5 The purpose of the HTFS was to collect dataaddressing the first four research questions. The questionnaire borrowed items from the1994–95 NCES Teacher Follow-Up Survey, with modifications of some items to make themappropriate for Hawai‘i. Questionnaires were distributed in September 2000 by U. S. mailto all general-education elementary and secondary teachers who resigned during SYs1997–98, 1998–99, and 1999–2000. A cover letter from Dr. Thomas and a stamped returnenvelope were included. Respondents who did not return questionnaires were mailed anothercopy, also with a cover letter and return envelope. Data from questionnaires that had beenreturned by October 2, 2000 were entered into SAS computer files. To facilitate the analyses,the HTFS data were electronically merged with the DOE dataset. The merged files did notinclude respondents’ names or addresses.
Of all the 681 mailed questionnaires, 152 (22%) were returned as undeliverable becauseof out-dated addresses or expired forwarding periods. Of those who received the question-naires, the response rate was 57% (N = 300). To confidently generalize our findings to allrecently resigned teachers, a greater rate is desirable; nevertheless, the response rate issatisfactory, because it is quite high for mail surveys.6
Of the 152 undeliverable questionnaires returned to CRDG, 71 (47%) were to mainlandaddresses. This high percentage suggests that the survey responses are more representativeof long-term Hawai‘i residents than of teachers who moved here temporarily from themainland.
To identify other differences between the survey respondents and the entire surveyed

7A comparison of the statistical significance of the differences between the respondents and the non-respondents was made with the chi-square statistic (" = .05). The statistics are not reported here and areavailable from the author upon request.
4
group, statistical tests were conducted.7 (Distributions of demographic characteristics areshown in Table 1.) The results of these tests showed that the respondents differed from non-respondents in three ways. First, teachers who resigned last year tended to return completedquestionnaires more than those who resigned during the two previous years. This probablyoccurred because mail delivery to the teachers who resigned in 1997–98 and 1998-99 wasless successful than it was to those who resigned last school year. There is no reason tobelieve, however, that the responses of those who resigned in 1999–2000 are likely to benotably different from those who resigned during the previous two school years; therefore,the preponderance of newly resigned teachers should not affect the generalizability of thefindings. The second way that the respondents differed from the non-respondents had to dowith age: Respondents older than 40 had a higher rate of questionnaire return, and youngerrespondents had a lower rate of return. This probably is in part an artifact of not being ableto deliver the questionnaires, in that younger former DOE teachers are more likely to havemoved than older former teachers. It might also reflect the daily time demands on youngerteachers. The third way that the respondents differed was that former elementary teachershad a higher rate of return (and secondary teachers a lower rate) than the non-respondents.However, the differences in percentages between the group of respondents and the group ofall resigned teachers was not large: Of the respondent group, 48% were elementary teachersvs. 44% of the total group of resigned teachers, and 52% were secondary teachers vs. 56%of the total group of resigned teachers.
On the remaining demographic variables, no statistically significant differences werefound. As seen in Table 1, the respondent group and the total group were markedly similarin their distribution among DOE districts, education levels, gender groups, andlicensure/certificate status groups. In conclusion, the results of the comparisons ondemographic variables show that the survey findings reasonably generalize to the total groupof resigned teachers, with a somewhat less-than-desirable response rate for younger teachersand possibly a lower-than-desirable response rate for mainland teachers.

5
Table 1. Demographic Characteristics of the DOE Teachers Who Resigned During the Most Recent Three-Year Period and of the Group of Survey Respondents
Characteristic (with percentages for the total group ofelementary and secondary teachers who taught in the DOE
during the three years [mean number = 9,534])a
Resigned DOEteachers (N = 681)
Survey respondents(N = 300)
N % N %
School year of resignation:• 1999–2000• 1998–99• 1997–98
232217232
34%32%34%
138 89 73
46%30%24%
Grade level taught in DOE:• Elementary (56%)• Secondary (44%)
297384
44%56%
144156
48%52%
License or certificate:• License• Certificate
643 38
94% 6%
288 12
96% 4%
District taught in:b
• Honolulu (19%)• Central (18%)• Leeward (19%)• Windward (10%)• Maui (12%)• Kauai (6%)• Hawai‘i (15%)
107103155 96 87 39 94
16%15%23%14%13% 6%14%
47 48 66 39 34 15 51
16%16%22%13%11% 5%17%
Highest degree:• Bachelor’s, professional diploma, or 5-year degree • Master’s or doctorate C Missing data
545121 15
80%18%2%
232 60 8
77%20% 3%
Gender:• Female (77%)• Male (23%)
516165
76%24%
231 69
77%23%
Martial status:• Married (66%)• Single (34%)
386295
43%57%
179121
60%40%
Age group (as of 9/1/00):• Less than 30 (10%)• 30–39 (28%)• 40–49 (25%)• 50 or more (37%)C Missing data
157295129 87 13
23%43%19%13% 2%
62112 68 54 4
21%37%23%18% 1%
aPercentages are averages of the percentages for the three years.bPercentages do not add to 100 because of rounding.
6
FindingsWhat Are the Demographic Characteristics of Elementary and Secondary Teachers WhoRecently Resigned Their DOE Positions?
A demographic analysis is useful because policymakers should (a) have a demographicpicture of recently resigned teachers and (b) understand the extent to which resigned teachersmirror the distributions of the total group of DOE elementary and secondary teachers. Thepercentages given in Table 1 show that:C The numbers of teachers voluntarily resigning from the DOE during the past three years
have remained steady; the percentages resigning are nearly equal for each of the threeyears. The average (mean) number of teachers who voluntarily resigned is 227—2.4%of the average total number of teachers. On average, another 398 teachers (4.2%) wereremoved from the DOE rolls because of retirement, termination, and death. Thus, onaverage, the teacher turnover rate for DOE elementary and secondary teachers during thepast three years has been 6.6%, with nearly two-thirds of this 6.6% due to voluntaryresignation.
C The percentage of teachers who resigned from secondary-school positions (56%) isgreater than the percentage of teachers who resigned from elementary-school positions(44%). Indeed, as seen in Table 1, this percentage distribution is the exact reverse of thedistribution of all elementary and secondary teachers were who employed in the DOEduring the past three years. On average, the attrition of teachers at the secondary level(about 3%) is markedly higher than that at the elementary level (about 1.8%).
C Of the seven DOE administrative districts, the percentages of resigning teachers onMaui, Kaua‘i, and Hawai‘i are quite similar to the percentages of all DOE teachersemployed in these districts. On O‘ahu, the percentages of recently resigned teachers arelower in the Honolulu and Central Districts and notably higher in the Windward andLeeward Districts. The Windward and Leeward Districts are losing proportionately moreteachers than the other five districts.
C In Hawai‘i, there has been a strong tendency, as has been found nationally, for attritionto be the highest among the youngest teachers. Of all DOE teachers during the past threeyears, 38% have been 39 years of age or younger, but of all the teachers who resignedduring the same period, 66% were 39 or younger. Assuming that younger teachers areless likely than older teachers to be married, the marital-status percentages also show thistendency: About two-thirds of all teachers employed by the DOE are married, but only

7
Table 2. Present Occupational Status of Survey Respondents
Present occupational status N %a
Respondents continuing to work in education (subtotal = 41%):Working as a teacher in an elementary or secondary school outside of theHawai‘i DOE
99 33%
Working in an elementary or secondary school with an assignment other thanteaching 10 3%
Substitute teaching 9 3%
Returned to the DOE 7 2%
Respondents no longer working in education (subtotal = 46%):Working in an occupation outside of elementary or secondary education 85 28%
Caring for family members 34 11%
Student at a college or university 18 6%
Disabled 3 1%
Other 23 11%
Missing data 4 1%
Total 300 100%
aPercentages do not total 100 because of rounding.
43% of recently-resigned teachers are married. Survey respondents were also asked about their occupational status this year and about
their plans for next year. In Table 2, their current occupational status is shown, and in Table3, plans for SY 2001–02 are shown. The results in these tables show that:C Of the survey respondents, 33% have teaching positions outside the DOE, 3% are
working as educators in non-teaching positions, 2% have returned to the DOE, and 3%are substitute teachers. Thus, about 40% continue in education, and almost 60% areemployed outside education or participating in other activities. Of all the respondents,only about 10% indicated that they are caring for family members.
C About half of the survey respondents indicated that they plan to hold positions ineducation next school year, with about 45% indicating they plan to teach. Therespondents do not plan to devote more of their time to caring for family members; only12% indicated this activity in their response to the questionnaire.

895% confidence intervals for the percentages shown in Table 4 range from±.94 to ±5.51, with a mean of 3.04.These confidence intervals (indeed, all the confidence intervals discussed in this report) show that not too muchshould be made of small differences between percentages.
8
Table 3. Survey Respondents’ Expected Activities In School Year 2001–02
Expected activity N %a
Respondents planning to work in education (subtotal = 51%):Teaching any of Grades K–12 109 36%
Teaching at the pre-kindergarten or post-secondary level 20 7%
Substitute teaching 5 2%
Working in a non-teaching occupation in the field of education 18 6%
Respondents not planning to work in education (subtotal = 43%):Working in an occupation outside the field of education 68 23%
Caring for family members 37 12%
Student at a college or university 11 4%
Unemployed and seeking work 3 1%
In military 1 .3%
Other 16 7%
Missing data 6 1%
Total 300 100%
aPercentages do not total 100 because of rounding.
What Reasons Do Recently Resigned Teachers Give for Having Left Their DOEPositions?
From a list of reasons why teachers might have resigned their teaching positions,teachers were asked to select up to three. The results of their selections are summarized inTable 4. These results show that four most-frequently given reasons for having resigned theirpositions with the DOE were that (a) they were dissatisfied with teaching as a career (39%),(b) they want better salary or benefits (34%), (c) they made a family or personal move(26%), and (d) they wanted to pursue another career (20%).8 No more than 15% of therespondents selected any of the remaining reasons for leaving their DOE teaching jobs.
9The statistic used was chi-square with a significance level of .05.
10Although the range of the 95% confidence intervals for the percentages shown in Table 5 (±1.87 to ±5.27)is less than the range shown in Table 4, the mean confidence interval (4.15) is higher, indicating generallygreater variability in the percentages shown in Table 5 than in the percentages shown in Table 4.
9
To identify differences (if any) in the selections of these four items among demographicsubgroups, comparisons on each item were made (a) among the four age groups shown inTable 1, (b) between respondents with graduate degrees and respondents with less thangraduate degrees, (c) between elementary and secondary teachers, (d) between males andfemales, and (e) between married and unmarried respondents.9 The results showed thatfemales were more likely than males to report having left the DOE for family or personalreasons (females = 29%, males = 17%) and that males were more likely than females toreport having left because of dissatisfaction with salary or benefits (males = 48%, females= 30%). These were the only statistically significant differences found in comparisonsamong demographic subgroups.
The former teachers’ reasons for leaving their DOE teaching positions roughly fall intofive categories, as shown in Table 4. Because teachers could select more than one reasonwithin each category, analyses were conducted to determine the numbers and percentagesof respondents who selected at least one response within a category. These analyses showthat 60% indicated reasons having to do with teaching, 55% indicated personal reasons, 28%indicated they left to take other jobs, 17% indicated reasons having to do with moving, and9% indicated reasons having to do with pursuing more education. It should be noted,however, that the proportion of survey respondents who indicated they left to move back tothe mainland is probably less than the proportion of the full group of recently resignedteachers who left for this reason, because this group was more difficult than Hawai‘iresidents to reach by mail.Of the Teachers Who Reported Having Recently Left the DOE Because They WereDissatisfied With Teaching as a Career, What Were Their Primary Dissatisfactions WithTheir Jobs and the DOE?
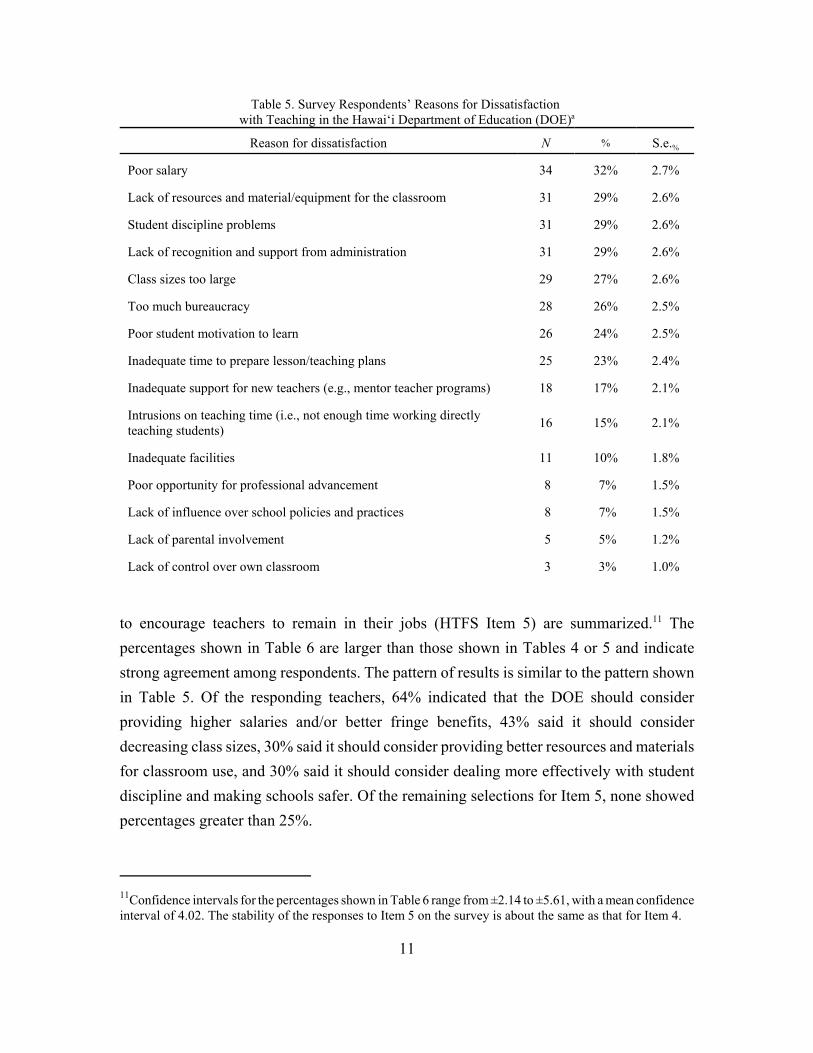
The 116 respondents who indicated that they were dissatisfied with teaching as a careerwere asked in Item 4 of the survey to select (from a list) the reasons for their dissatisfaction.(See Table 5.)10 The reasons most often selected were poor salary (32%), lack of resourcesand material/equipment for the classroom (29%), student discipline problems (29%), lackof recognition and support from administration (29%), class sizes that were too large (27%),

10
Table 4. Survey Respondents’ Reasons for Leaving their Teaching Jobs with the Hawai‘i Department of Educationa
Reasons for leaving N % S.e.%
Reasons having to do with teaching: Dissatisfied with teaching as a career 116 39% 2.8%
For better salary or benefits 102 34% 2.7%
School staffing action (e.g., school reorganization, reassignment) 18 6% 1.4%
To take a sabbatical or other break from teaching 6 2% .8%
Took other jobs:To pursue another career 60 20% 2.3%
Took a job in Hawai‘i’s private sector 25 8% 1.6%
Reasons having to do with pursuing more education:To take courses to improve career opportunities in the field of education 18 6% 1.4%
To take courses to improve career opportunities outside the field of education 11 4% 1.1%
Reasons having to do with moving:Moved back to mainland because Hawai‘i is too expensive 35 12% 1.9%
Moved back to mainland because Hawai‘i is too geographically isolated 12 4% 1.1%
Moved back to mainland (never intended to remain in Hawai‘i for long) 11 4% 1.1%
Moved back to mainland because Hawai‘i is too culturally different 2 1% .5%
Moved to an island in Hawai‘i where a teaching job was unavailable 3 1% .6%
Personal reasons:Family or personal move 79 26% 2.5%
Pregnancy/child rearing 37 12% 1.9%
Health 15 5% 1.3%
To retire 9 3% 1.0%
Other family or personal reason 44 15% 2.0%
aRespondents were asked to select the three most important reasons from the list of 18 shown here.
too much bureaucracy (26%), poor student motivation to learn (24%), and inadequate timeto prepare lesson/teaching plans (23%).What Are Recently Resigned Teachers’ Opinions About the Steps the DOE Might Taketo Encourage Teachers to Remain in Their Jobs?
In Table 6, recently resigned DOE teachers’ opinions about the steps the DOE might take
11Confidence intervals for the percentages shown in Table 6 range from ±2.14 to ±5.61, with a mean confidenceinterval of 4.02. The stability of the responses to Item 5 on the survey is about the same as that for Item 4.
11
Table 5. Survey Respondents’ Reasons for Dissatisfaction with Teaching in the Hawai‘i Department of Education (DOE)a
Reason for dissatisfaction N % S.e.%
Poor salary 34 32% 2.7%
Lack of resources and material/equipment for the classroom 31 29% 2.6%
Student discipline problems 31 29% 2.6%
Lack of recognition and support from administration 31 29% 2.6%
Class sizes too large 29 27% 2.6%
Too much bureaucracy 28 26% 2.5%
Poor student motivation to learn 26 24% 2.5%
Inadequate time to prepare lesson/teaching plans 25 23% 2.4%
Inadequate support for new teachers (e.g., mentor teacher programs) 18 17% 2.1%
Intrusions on teaching time (i.e., not enough time working directlyteaching students) 16 15% 2.1%
Inadequate facilities 11 10% 1.8%
Poor opportunity for professional advancement 8 7% 1.5%
Lack of influence over school policies and practices 8 7% 1.5%
Lack of parental involvement 5 5% 1.2%
Lack of control over own classroom 3 3% 1.0%
to encourage teachers to remain in their jobs (HTFS Item 5) are summarized.11 Thepercentages shown in Table 6 are larger than those shown in Tables 4 or 5 and indicatestrong agreement among respondents. The pattern of results is similar to the pattern shownin Table 5. Of the responding teachers, 64% indicated that the DOE should considerproviding higher salaries and/or better fringe benefits, 43% said it should considerdecreasing class sizes, 30% said it should consider providing better resources and materialsfor classroom use, and 30% said it should consider dealing more effectively with studentdiscipline and making schools safer. Of the remaining selections for Item 5, none showedpercentages greater than 25%.

12
Table 6. Survey Respondents’ Opinions About the Steps the DOE Might Take to Encourage Teachers to Remain in Hawai‘i DOE Teaching Jobs
Steps to encourage teachers N % S.e.%
Providing higher salaries and/or better fringe bene-fits 193 64% 2.8%
Decreasing class size 130 43% 2.9%
Providing better resources and materials for class-room use 91 30% 2.7%
Dealing more effectively with student disciplineand making schools safer 89 30% 2.6%
Reducing teacher workload 73 24% 2.5%
Reducing the paperwork burden on teachers 49 16% 2.1%
Giving teachers more authority in the school andin their own classrooms 45 15% 2.1%
Providing tuition reimbursement for courseworkrequired for certification or career advancement 39 13% 1.9%
Providing more support for new teachers (e.g.,mentor teacher programs) 40 13% 2.0%
Providing merit pay or other pay incentives toteachers 33 11% 1.8%
Improving opportunities for professional advance-ment 30 10% 1.7%
Increasing standards for students’ academic per-formance 23 8% 1.5%
Increasing parent involvement in the schools 11 4% 1.1%
Giving special recognition and/or special assign-ments to excellent or outstanding teachers 11 4% 1.1%
What Findings of the Report Might Have Implications for Educational Policy Making in Hawai‘i?
Some of the findings presented in this report might have implications for policy making.These findings are summarized here, and some suggestions about their implications aremade. C The numbers of teachers voluntarily resigning annually from the DOE (N = approxi-
mately 225) are not large—they constitute about 2.4% of all DOE teachers. Thispercentage is considerably less than the 4.2% leaving the DOE for reasons of retirement,

13
termination, or death. Indeed, the percentage of teachers voluntarily resigning ismarkedly lower than the 5.6% identified in a national survey conducted in the mid-1990s. In contrast to mainland educational jurisdictions, Hawai‘i teachers seeking newteaching positions outside the DOE must make major moves or find positions in privateschools, which probably are infrequently available. Unless resignation rates in Hawai‘iare anomalous (e.g., because the slow Hawai‘i economy in the 1990s did not providealternative employment opportunities for teachers who wished to leave teaching), it isreasonable to conclude that teacher attrition is clearly not as critical an issue in Hawai‘ias on the mainland. One possible implication of this finding is that, before taking stepsto encourage this group to stay in the DOE, policymakers might wish to speculatewhether the benefits will be worth the costs.
C Of all the respondents to the survey, six in 10 gave a reason for leaving that had to dowith teaching issues, nearly as many indicated a personal or family reason, about one infour indicated they left to take other jobs, a little less than two in 10 indicated a reasonthat had to do with moving, and about one in 10 gave a reason that had to do withpursuing more education. These results contradict common perceptions about largeproportions of teachers going to the mainland to teach. However, the proportion ofsurvey respondents who indicated they left the DOE to move back to the mainland mightbe small, because this group was more difficult than Hawai‘i residents to reach by mail.
C Policymakers should be aware that a substantial proportion of former teachers reportedsignificant dissatisfaction with teaching. About four out of 10 of the survey respondentsindicated that they left their positions because they were dissatisfied with teaching as acareer—a much larger proportion than the 8% reported in national studies. The Hawai‘ifindings might be due in part to a sample self-selection bias (i.e., highly dissatisfiedteachers might have been more likely to return questionnaires than less-dissatisfiedteachers), but they might also be due to problems intrinsic in DOE teaching that are moretroublesome than in most mainland educational jurisdictions.
C Administrators and policymakers might be encouraged by findings that suggest asubstantial proportion of resigned teachers might be receptive to encouragement to stayin their DOE positions. Of the teachers who voluntarily resigned during the three yearscovered in the survey, about four in 10 are working in education now, and about halfstated they plan to work in education next year. If the DOE, College of Education, andother institutions or agencies are to take steps to reduce teacher attrition, this group
14
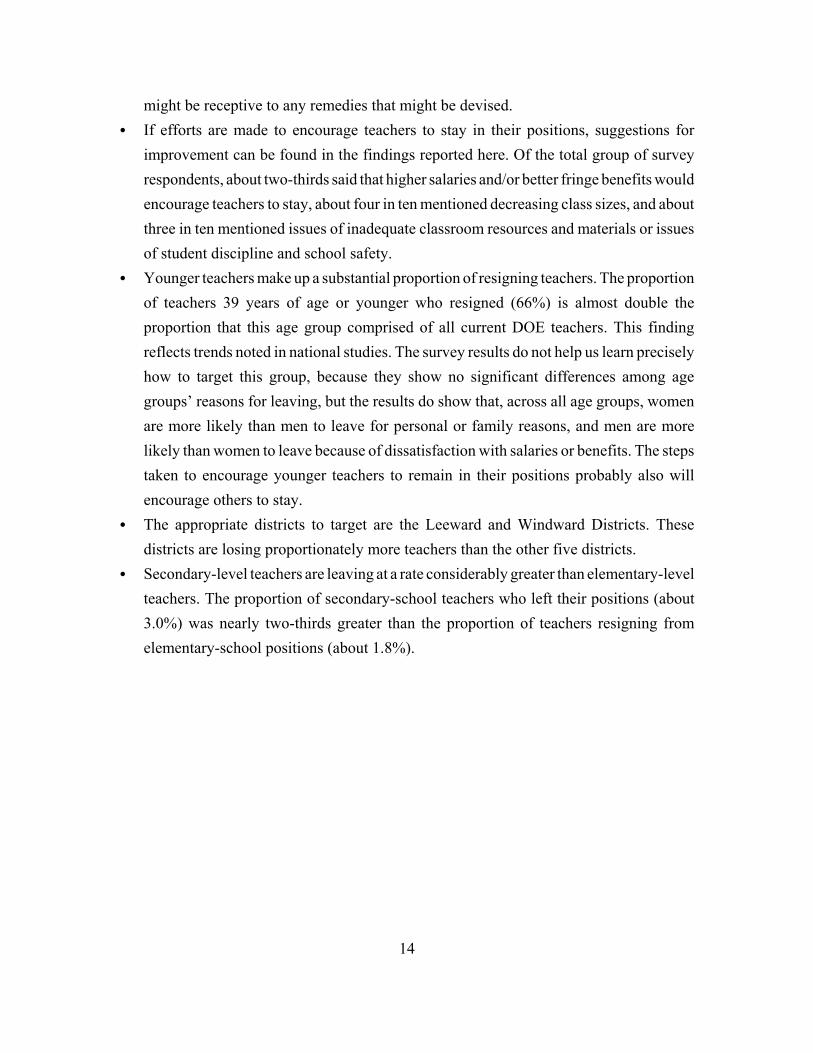
might be receptive to any remedies that might be devised. C If efforts are made to encourage teachers to stay in their positions, suggestions for
improvement can be found in the findings reported here. Of the total group of surveyrespondents, about two-thirds said that higher salaries and/or better fringe benefits wouldencourage teachers to stay, about four in ten mentioned decreasing class sizes, and aboutthree in ten mentioned issues of inadequate classroom resources and materials or issuesof student discipline and school safety.
C Younger teachers make up a substantial proportion of resigning teachers. The proportionof teachers 39 years of age or younger who resigned (66%) is almost double theproportion that this age group comprised of all current DOE teachers. This findingreflects trends noted in national studies. The survey results do not help us learn preciselyhow to target this group, because they show no significant differences among agegroups’ reasons for leaving, but the results do show that, across all age groups, womenare more likely than men to leave for personal or family reasons, and men are morelikely than women to leave because of dissatisfaction with salaries or benefits. The stepstaken to encourage younger teachers to remain in their positions probably also willencourage others to stay.
C The appropriate districts to target are the Leeward and Windward Districts. Thesedistricts are losing proportionately more teachers than the other five districts.
C Secondary-level teachers are leaving at a rate considerably greater than elementary-levelteachers. The proportion of secondary-school teachers who left their positions (about3.0%) was nearly two-thirds greater than the proportion of teachers resigning fromelementary-school positions (about 1.8%).
15
References
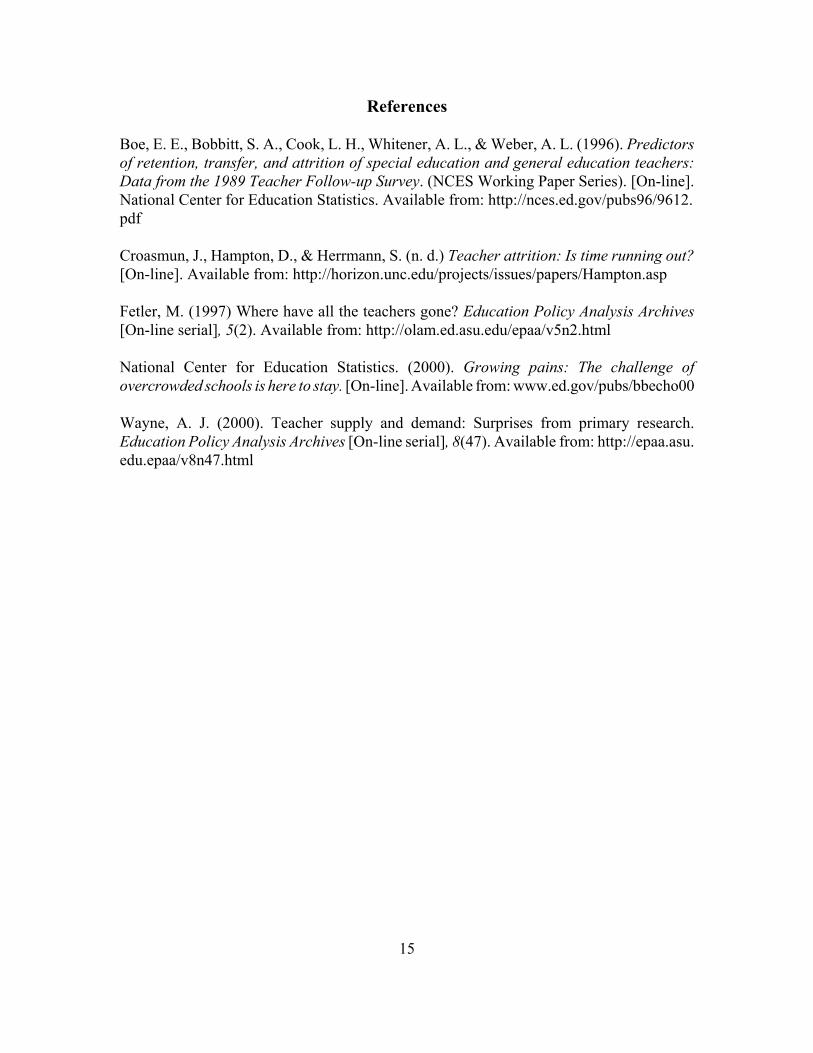
Boe, E. E., Bobbitt, S. A., Cook, L. H., Whitener, A. L., & Weber, A. L. (1996). Predictorsof retention, transfer, and attrition of special education and general education teachers:Data from the 1989 Teacher Follow-up Survey. (NCES Working Paper Series). [On-line].National Center for Education Statistics. Available from: http://nces.ed.gov/pubs96/9612.pdf
Croasmun, J., Hampton, D., & Herrmann, S. (n. d.) Teacher attrition: Is time running out?[On-line]. Available from: http://horizon.unc.edu/projects/issues/papers/Hampton.asp
Fetler, M. (1997) Where have all the teachers gone? Education Policy Analysis Archives[On-line serial], 5(2). Available from: http://olam.ed.asu.edu/epaa/v5n2.html
National Center for Education Statistics. (2000). Growing pains: The challenge ofovercrowded schools is here to stay. [On-line]. Available from: www.ed.gov/pubs/bbecho00
Wayne, A. J. (2000). Teacher supply and demand: Surprises from primary research.Education Policy Analysis Archives [On-line serial], 8(47). Available from: http://epaa.asu.edu.epaa/v8n47.html

16

17
Appendix A
Hawai‘i Teacher Follow-up Survey
(not available on electronic copy of report)