juvenile justice students face barriers to high … justice students face barriers to ......
TRANSCRIPT

October 2010 Report No. 10-55
Juvenile Justice Students Face Barriers to High School Graduation and Job Training at a glance Although most high school youth earn academic credits while in juvenile justice programs, those who enter the system with substantial academic deficits generally do not earn enough credits to resolve their deficits. Such students are at high risk of dropping out of school upon their release. While many of these youth could be prepared for employment after release by earning General Educational Development (GED) diplomas while in their programs, relatively few do so. Similarly, few programs provide job training needed to ensure these students have the skills and competencies for employment upon release.
There are wide variations among juvenile justice facilities in their practices of offering GED and job training services to the youth they serve. Barriers to these services include competing academic priorities, students’ poor reading ability, short lengths of stay, security issues, and insufficient information and coordination among providers. Many of these barriers could be addressed by clarifying funding issues and improving interagency planning.
Scope _________________ As directed by the Legislature, this is the second of two reports that examine educational services for students in Florida’s Department of Juvenile Justice residential and non-residential programs.1
1. Do high school students make reasonable academic progress while in juvenile justice programs?
This report answers two questions.
2. What percentage of juvenile justice students receive GEDs and job skills training, and what barriers do students face in receiving these services?
See Appendix A for a detailed description of the methodologies we used to assess these questions.
Background ____________ Delinquent youth receive educational services while in residential and non-residential juvenile justice programs.2
1 Youth Entering the State’s Juvenile Justice Programs Have Substantial
Educational Deficits; Available Data Is Insufficient to Assess Learning Gains of Students, OPPAGA
Residential programs are facilities that house delinquent youth and
Report No. 10-07, January 2010. 2 In this report non-residential programs include day treatment
programs for adjudicated youth and prevention programs for youth at risk of delinquency.

OPPAGA Report Report 10-55
2
provide delinquency treatment and counseling services, and youth are typically incarcerated in these programs between 6 to 18 months. Non-residential programs provide delinquency prevention and intervention services, and youth typically stay in these programs between 3 to 12 months. The Department of Juvenile Justice contracts with private vendors to operate most residential and all non-residential programs, and operates some residential programs itself.
During the 2008-09 school year, juvenile justice programs served 12,266 youth. About two-thirds of these youth were served in residential programs, while non-residential programs served 30% and the remaining students were served by both types of programs (see Exhibit 1). While both types of programs typically serve youth ages 13 to 18, over half of the youth they served were in the 9th or 10th grades.
Exhibit 1 In 2008-09, 127 Juvenile Justice Residential and Non-Residential Facilities Served Over 12,000 Students
Source: OPPAGA analysis of Department of Education data for youth served and number of residential and non-residential programs in 2008-09.
State law requires that juvenile justice students receive educational services comparable to public schools. School districts are responsible for providing educational services to youth in residential and non-residential facilities. School districts may deliver educational services directly or through a contractor. The districts remain responsible for the quality of education provided in residential and non-residential juvenile justice
facilities regardless of whether they provide these services directly or through a contractor.
Florida law requires district school boards to provide basic, career education, and exceptional student programs to delinquent youth as appropriate. These educational programs must include appropriate curricula and related services that support treatment goals, aid reentry into the community, and may lead to completing a high school diploma or its equivalent. Juvenile justice students must also have access to the appropriate courses and instruction to prepare them for the General Educational Development (GED) test.3, 4
According to data from Florida State University’s Juvenile Justice Educational Enhancement Program, approximately 79% of juvenile justice students in residential programs who were age 16 or older and significantly behind academically did not return to school upon release.
5 Accordingly, the organization recommends that students most at risk for not returning to school upon completing juvenile justice programs obtain GEDs and job training to ensure that they have the basic skills needed to enter the workforce.6
Florida statutes also require juvenile justice programs to provide students with information and activities that can lead to meaningful employment after release.
7
3 Section 1003.52(5), F.S., provides that if the duration of a program
is less than 40 days, the educational component may be limited to tutorial activities and career employability skills.
To achieve this goal, the Department of Juvenile Justice is to work
4 The American Council on Education’s General Educational Development Testing Service develops the GED test, delivery system, and standards.
5 The Juvenile Justice Educational Enhancement Program examined youth in residential programs in 2004-05. The analysis used enrolled grade level compared to the student’s age to determine the number of years students were ‘behind’. Each student’s grade level is determined by school districts; students with even a half credit deficit may be classified by their district as one year behind. Using this data, we defined ‘students who are significantly behind’ as students who are two or more grade levels behind, and thus, likely to be at least six credits behind students of the same age who are on grade level.
6 Juvenile Justice Educational Enhancement Program, Executive Summary, 2006 Annual Report to the Florida Department of Education, p. 3.
7 Section 985.622, F.S.
7,850 Students,
64%
3,632 Students,
30%
6%85 Residential Programs
42 Non-residential Programs
In Multiple Programs
784 Students
Report No. 10-55 OPPAGA Report
3
with local business and trade groups to develop and operate educational and career training programs which can help students obtain the basic skills needed to enter the job force.
The Florida Education Finance Program generally funds educational services. In 2009-10, the most current year for which data is available, the Florida Education Finance Program provided an estimated $63.8 million to school districts for educational services for students in juvenile justice programs. State law requires that students participating in GED preparation programs be funded at the basic program cost factor for Department of Juvenile Justice programs in the Florida Education Finance Program.8
School districts also receive federal funds for serving neglected and delinquent youth and allocate a portion of these funds to Department of Juvenile Justice programs. The department provides supplemental vocational overlay funding for career education courses in juvenile justice programs, which it allocates to select juvenile justice programs. In 2010-11, this funding amounted to $2.3 million.
Questions and Answers __ Do high school students make reasonable academic progress while in juvenile justice programs? Most high school students in juvenile justice programs make reasonable academic progress, earning credits at the rate that typical students must achieve towards a standard high school diploma. However, about half of the high school youth are substantially academically behind when they enter the juvenile justice system. These students generally do not earn credits at a sufficient rate to reduce their academic deficit, increasing their risk of dropping out of school when they complete the delinquency program.
Most students in juvenile justice programs earn high school credits, with the amount earned varying by program type. A primary educational
8 Section 1003.52(3)(a), F.S.
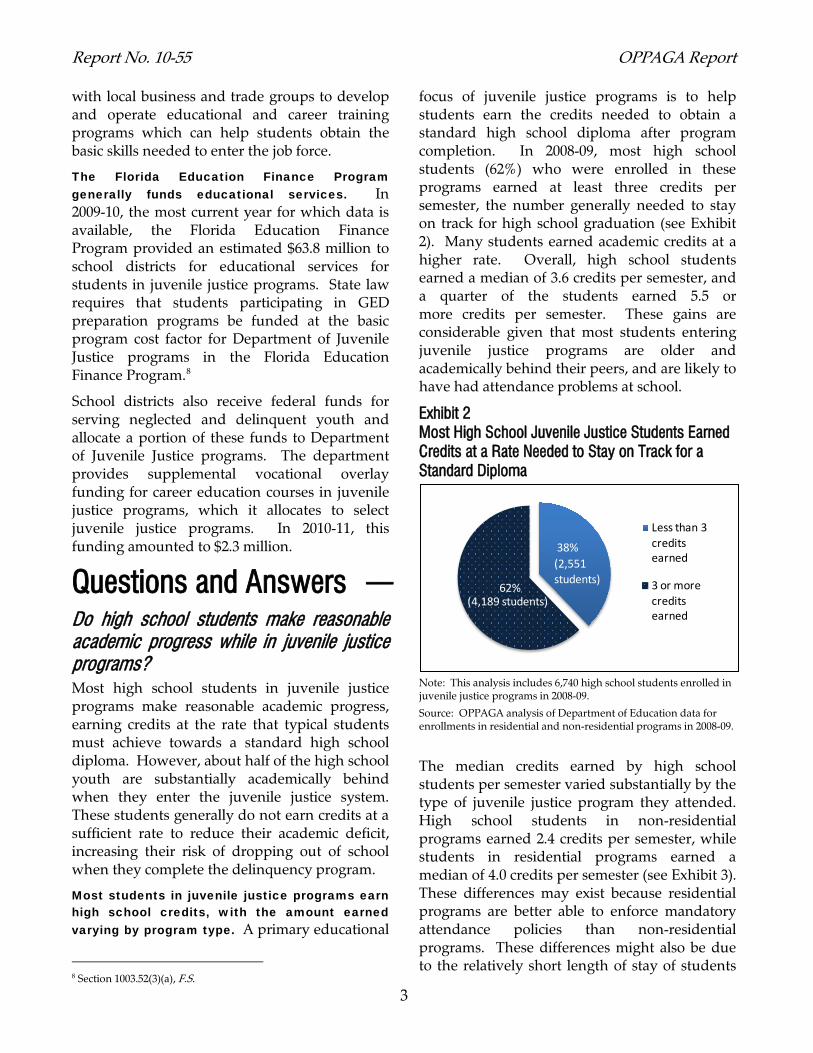
focus of juvenile justice programs is to help students earn the credits needed to obtain a standard high school diploma after program completion. In 2008-09, most high school students (62%) who were enrolled in these programs earned at least three credits per semester, the number generally needed to stay on track for high school graduation (see Exhibit 2). Many students earned academic credits at a higher rate. Overall, high school students earned a median of 3.6 credits per semester, and a quarter of the students earned 5.5 or more credits per semester. These gains are considerable given that most students entering juvenile justice programs are older and academically behind their peers, and are likely to have had attendance problems at school.
Exhibit 2 Most High School Juvenile Justice Students Earned Credits at a Rate Needed to Stay on Track for a Standard Diploma
Note: This analysis includes 6,740 high school students enrolled in juvenile justice programs in 2008-09.
Source: OPPAGA analysis of Department of Education data for enrollments in residential and non-residential programs in 2008-09.
The median credits earned by high school students per semester varied substantially by the type of juvenile justice program they attended. High school students in non-residential programs earned 2.4 credits per semester, while students in residential programs earned a median of 4.0 credits per semester (see Exhibit 3). These differences may exist because residential programs are better able to enforce mandatory attendance policies than non-residential programs. These differences might also be due to the relatively short length of stay of students
38%
62%
Less than 3 credits earned
3 or more credits earned
(4,189 students)
(2,551students)

OPPAGA Report Report 10-55
4
in some non-residential programs. The median length of stay for adjudicated youth in non-residential (day treatment) programs was three months, which is shorter than an academic semester. Thus, the students in these programs are likely to have begun but not completed coursework requirements necessary to earn academic credits while in the program.9
Exhibit 3 Academic Credits Earned Per Semester Varied Substantially by Juvenile Justice Program Type
Note: This analysis includes 6,740 high school students enrolled in juvenile justice programs in 2008-09. The median length of stay for adjudicated youth in non-residential programs was three months. This likely contributes to the low number of academic credits earned per semester in non-residential programs.
Source: OPPAGA analysis of Department of Education data for youth enrolled in residential and non-residential programs in 2008-09.
Most juvenile justice high school students do not earn credits at a sufficient rate to significantly reduce their academic deficits. In 2008-09, approximately 58% of the high school students enrolled in juvenile justice programs in Florida were age 16 or older and at least six academic credits (a full school year) behind when they entered their program. While these students earned a median of 3.5 credits per semester, they typically did not earn credits at a sufficient rate to significantly reduce their academic deficit, putting them at high risk for not completing high school.
High school students with academic deficits made more progress in residential than non- 9 High school students in non-residential programs for adjudicated
youth earned a median of 1.3 academic credits per semester. In contrast, high school students in non-residential prevention programs, which had a median length of stay of six months, earned a median of 3.0 academic credits per semester.
residential programs. Students in non-residential programs who had substantial credit deficits typically fell further behind; half of these students earned 2.0 or fewer credits per semester. In contrast, students in residential facilities who had substantial academic credit deficits earned a median of 3.75 credits per semester.
Older students with significant credit deficits are not likely to complete high school. For many of these students, GEDs and job training are critical to preparing them for self-sufficiency.
What percentage of juvenile justice students receive GEDs and job skills training, and what barriers do students face in receiving these services? Relatively few students in juvenile justice facilities earn high school diplomas or GEDs, and there are wide variations among facilities in GED attainment rates. Similarly, relatively few juvenile justice students receive substantial job training services. Barriers to these services include competing academic priorities, students’ poor reading ability, short lengths of stay, security issues, and insufficient information and coordination.
Few juvenile justice students receive high school diplomas or GEDs, with rates varying widely among programs. Very few students in juvenile justice programs earn high school diplomas and many will likely not return to school upon program completion.10 Therefore, we examined the percentage of youth who earned a GED while in juvenile justice programs. In 2008-09, approximately 14% of juvenile justice students age 16 or older obtained GEDs; students enrolled in residential treatment facilities were twice as likely to obtain GEDs as those in non-residential settings.11
10 In 2008-09, only 4% of the youth age 17 or older earned enough
credits and met other state requirements to receive a regular or special diploma. To evaluate the percentage of regular high school diplomas earned, we examined the population of 5,891 students who were age 17 or older during their stay in a juvenile justice program.
11 Students must be at least 16 years old to take the GED examination. Sixteen percent of students enrolled in residential treatment facilities obtained GEDs compared to 8% of students served in non-residential programs.
3.64.0
2.4
All N = 6,740
Residential N = 5,047
Non-residential N = 1,693
Median Credits Earned by High School Students in Juvenile Justice Programs
Report No. 10-55 OPPAGA Report
5
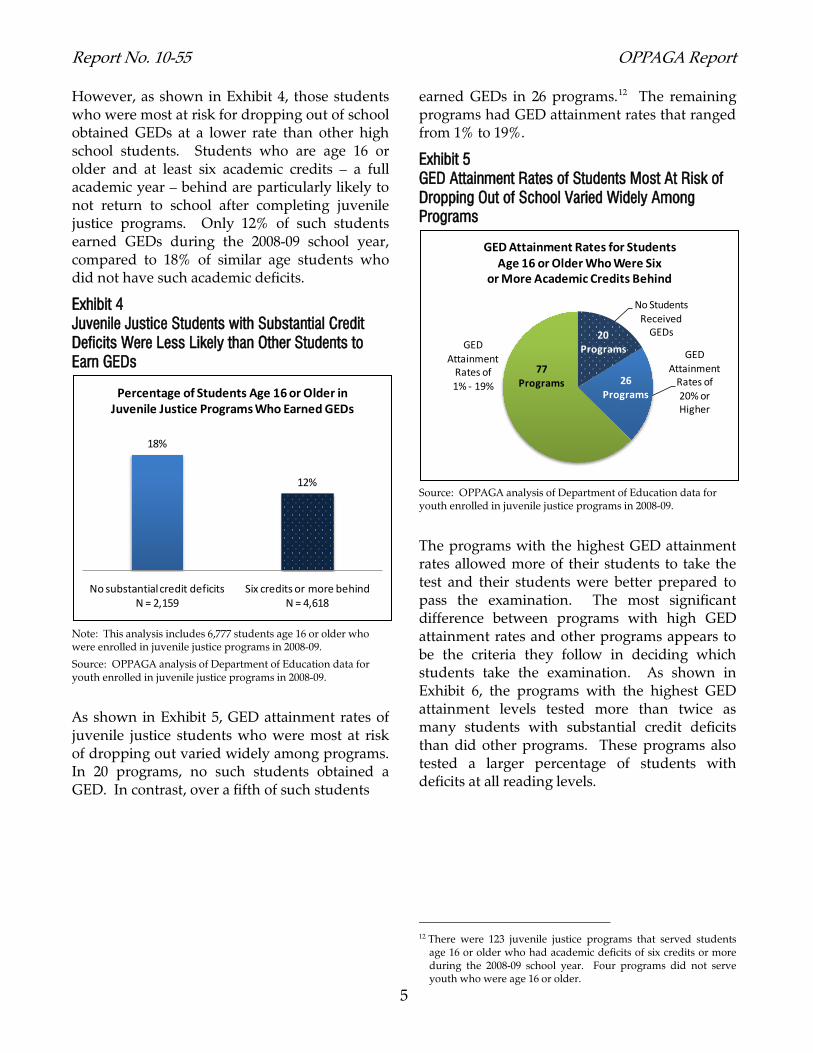
However, as shown in Exhibit 4, those students who were most at risk for dropping out of school obtained GEDs at a lower rate than other high school students. Students who are age 16 or older and at least six academic credits – a full academic year – behind are particularly likely to not return to school after completing juvenile justice programs. Only 12% of such students earned GEDs during the 2008-09 school year, compared to 18% of similar age students who did not have such academic deficits.
Exhibit 4 Juvenile Justice Students with Substantial Credit Deficits Were Less Likely than Other Students to Earn GEDs
Note: This analysis includes 6,777 students age 16 or older who were enrolled in juvenile justice programs in 2008-09.
Source: OPPAGA analysis of Department of Education data for youth enrolled in juvenile justice programs in 2008-09.
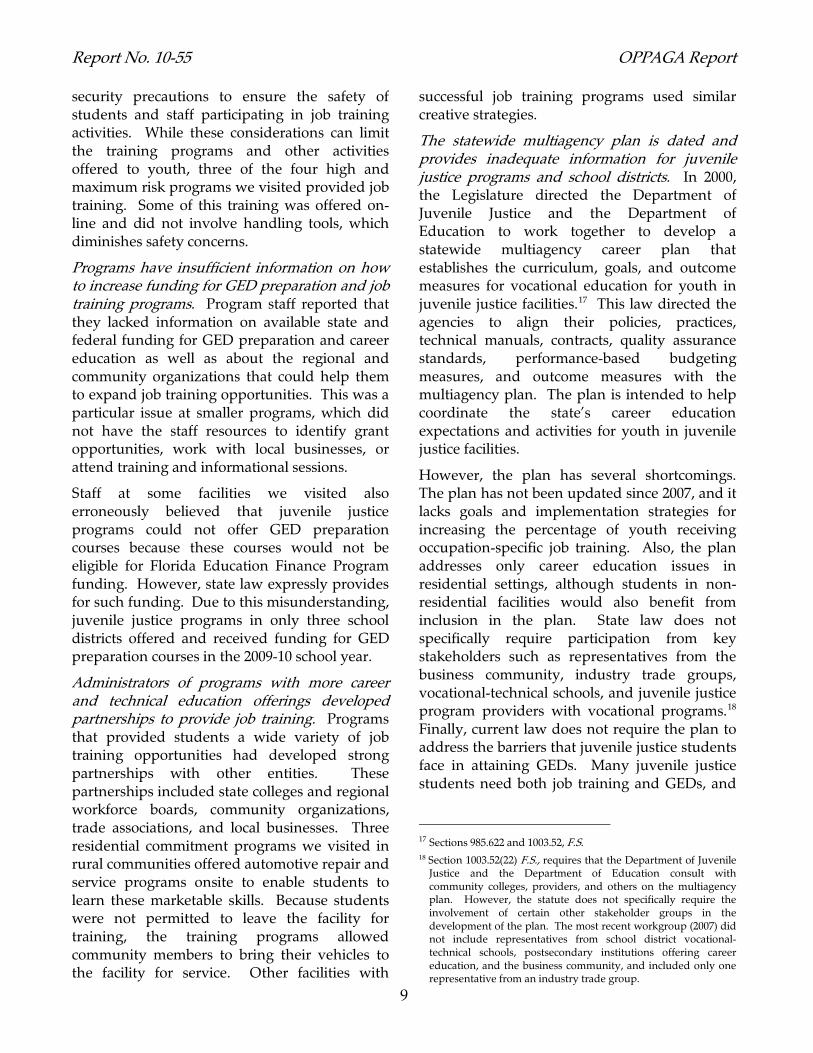
As shown in Exhibit 5, GED attainment rates of juvenile justice students who were most at risk of dropping out varied widely among programs. In 20 programs, no such students obtained a GED. In contrast, over a fifth of such students
earned GEDs in 26 programs.12
Exhibit 5 GED Attainment Rates of Students Most At Risk of Dropping Out of School Varied Widely Among Programs
The remaining programs had GED attainment rates that ranged from 1% to 19%.
Source: OPPAGA analysis of Department of Education data for youth enrolled in juvenile justice programs in 2008-09.
The programs with the highest GED attainment rates allowed more of their students to take the test and their students were better prepared to pass the examination. The most significant difference between programs with high GED attainment rates and other programs appears to be the criteria they follow in deciding which students take the examination. As shown in Exhibit 6, the programs with the highest GED attainment levels tested more than twice as many students with substantial credit deficits than did other programs. These programs also tested a larger percentage of students with deficits at all reading levels.
12 There were 123 juvenile justice programs that served students
age 16 or older who had academic deficits of six credits or more during the 2008-09 school year. Four programs did not serve youth who were age 16 or older.
18%
12%
No substantial credit deficits N = 2,159
Six credits or more behind N = 4,618
Percentage of Students Age 16 or Older in Juvenile Justice Programs Who Earned GEDs
No Students Received
GEDs
GED Attainment
Rates of 20% or Higher
GED Attainment
Rates of 1% - 19%
GED Attainment Rates for Students Age 16 or Older Who Were Six
or More Academic Credits Behind
20 Programs
26 Programs
77 Programs

OPPAGA Report Report 10-55
6
Exhibit 6 Juvenile Justice Programs with the Highest GED Attainment Rates Tested More Students with Credit Deficits at All Reading Levels
Note: This analysis includes 6,446 students age 16 or older who were enrolled in juvenile justice programs in 2008-09, had a recent FCAT score, and were at least six credits behind.
Source: OPPAGA analysis of Department of Education data for youth enrolled in juvenile justice programs in 2008-09.
Staff at the programs we visited asserted that students’ academic skills, such as reading and language ability, is a key indicator of success on the GED examination. These skills are important because the GED test requires students to read and understand short passages and make inferences to determine the correct answer. Programs typically tested students to determine their potential for success on the GED examination and, thus, their suitability for GED preparation.13
13 Programs we visited typically used the Tests of Adult Basic
Education (TABE) or the GED pretest to screen students.
However, as shown in Exhibit 7, while students with reading deficits had lower pass rates than other students on the GED examination, many such students can pass the examination with proper preparation.
Exhibit 7 Students at All Reading Levels Successfully Passed the GED Exam at Programs that Stressed GED Attainment
Note: This analysis includes 849 students age 16 or older who were enrolled in juvenile justice programs in 2008-09, had a recent FCAT score, were at least six credits behind, and took the GED test.
Source: OPPAGA analysis of Department of Education data for youth enrolled in juvenile justice programs in 2008-09.
Most juvenile justice students do not receive substantial job training. It is important to provide job training to students in juvenile justice programs, particularly older students, as many do not return to traditional schools when they complete their programs. Florida statutes require juvenile justice programs to provide students with pre-employment job readiness training.14
However, during the 2008-09 school year, only 14% of juvenile justice students age 16 or older were enrolled in job preparatory courses linked to specific occupational skills.
This training covers topics such as career exploration, interviewing skills, time management, resume writing, and job searching.
15
14 Section 985.622(3), F.S.
These courses provide students with a wide variety of occupational competencies, including administrative assistance, concrete masonry,
15 ‘Job preparatory training’ refers to courses that provide career education competencies or prerequisites for entry into a specific occupation, according to the criteria in s. 985.62, F.S.
53%
43%
30%25%
19%
11%
Reading FCAT Level 3 and Above
N = 795
Reading FCAT Level 2
N = 1,543
Reading FCAT Level 1
N = 4,108
Percentage of Students Age 16 or Older with Substantial Credit Deficits Tested
Programs with GED Attainment Rates of 20% or Higher
Other Programs 84%
71%
50%
85%
56%
30%
Reading FCAT Level 3 and Above
N = 180
Reading FCAT Level 2 N = 245
Reading FCAT Level 1 N = 424
GED Pass Rates of Students Age 16 or Older with Substantial Credit Deficits
Programs with GED Attainment Rates of 20% or Higher
Other Programs

Report No. 10-55 OPPAGA Report
7
culinary arts, and web design. Students enrolled in these courses can earn occupational completion points, which signify that they have mastered the competencies needed for a specific job title. As shown in Exhibit 8, nearly a fifth of students served in residential treatment were enrolled in job training programs, compared to only 1% of students served in non-residential programs.
Exhibit 8 In 2008-09, 14% of Juvenile Justice Students Age 16 or Older Were Enrolled in Job Preparatory Courses
Note: This analysis includes 7,296 students age 16 or older enrolled in juvenile justice programs in 2008-09.
Source: OPPAGA analysis of Department of Education data for youth enrolled in juvenile justice programs in 2008-09.
Students who were most at risk for dropping out of school were not targeted for job training programs. As shown in Exhibit 9, students who were age 16 or older and at least six credits behind academically enrolled in these courses at the same rate as other similar age students.
Exhibit 9 Students Age 16 or Older with Substantial Credit Deficits Were No More Likely than Other Similar Age Students to be Enrolled in Job Preparatory Courses
Note: This analysis includes 7,296 students age 16 or older enrolled in juvenile justice programs in 2008-09.
Source: OPPAGA analysis of Department of Education data for 2008-09.
Further, most of the students enrolled in job training courses did not complete the coursework necessary to obtain the skills and competencies needed for the job for which they were training. Attainment of these competencies is measured by occupational completion points. Only 35% of the students enrolled in one or more job preparatory courses in 2008-09 earned one or more occupational completion points; among students age 16 or older, only 5% earned at least one occupational completion point (see Exhibit 10). While the students enrolled in job preparatory courses likely benefit from the instruction they receive, most will leave juvenile justice programs lacking the skills needed for many occupations unless they receive additional training after their release.
Exhibit 10 Approximately 5% of All Juvenile Justice Students Age 16 or Older Earned At Least One Occupational Completion Point
Note: This analysis includes 7,296 students age 16 or older enrolled in juvenile justice programs in 2008-09.
Source: OPPAGA analysis of Department of Education data for youth enrolled in juvenile justice programs in 2008-09.
Few juvenile justice students receive job training through private trade organizations. Students who complete such programs receive industry-recognized certificates signifying that they have work-ready skills in areas including masonry, carpentry, landscaping, and plumbing. Statewide, two providers offered juvenile justice students an opportunity to earn industry-recognized certificates in seven programs in
14%
19%
1%
Students Age 16 or Older
Residential N = 5,426
Non-residential N = 1,870
Percentage of Students Age 16 or Older Enrolled in Job Preparatory Courses
14.1% 14.0%
No substantial credit deficits Six credits or more behind
Percentage of Juvenile Justice Students Age 16 or Older Enrolled in Job Preparatory
Courses
5%
6%
5%
All N = 7,296
No substantial credit deficits
N = 2,454
Six credits or more behind
N = 4,842
Percentage of Students Age 16 or Older Who Earned at Least One Occupational
Completion Point

OPPAGA Report Report 10-55
8
2008-09. During this period, juvenile justice students received 227 such certificates.16
Program staff identified several barriers to providing GED preparation and job training services. Several factors can limit the ability of juvenile justice students to obtain GEDs and job skills while in the programs. Those identified by program staff included competing academic priorities, poor student reading ability, short lengths of stay, security issues, funding issues, and insufficient information and coordination among providers.
Many juvenile justice programs emphasize academic instruction rather than GED preparation and job training. While all 19 programs we visited provided GED preparation in some form as required by statute, it was not a primary focus of most programs. Instructional staff asserted that juvenile justice students benefitted most from broad-based instruction in core subjects to meet high school graduation requirements. They also believed programs should focus on credit recovery to diminish student credit deficits. As a result, students at these facilities usually were enrolled in academic programs for most of the day, with limited time to study for the GED or complete job training courses. The programs generally allowed students to work on GED preparation materials, primarily by integrating the skills into the regular curriculum, through computer instruction, after school hours, or when they finished their academic work early. In contrast, the program that we visited with the highest percentage of at-risk students obtaining GEDs used individualized computer instruction geared to the GED standards and provided preparation for these students during their instructional time in each subject.
In November 2009, the State Board of Education amended Rule 6A-6.05281, Florida Administrative Code, to provide greater
16 In 2008-09, students earned industry-recognized certificates at the
DOVE Vocational Academy, operated by Twin Oaks, Inc., and in six programs that operated training programs under contract with the Home Builder’s Institute. The six programs are Avon Park Youth Academy, Bristol Youth Academy, CRAFT Orlando, CRAFT Tampa, Dozier School for Boys, and Pembroke Pines.
curricular flexibility to juvenile justice facilities. These changes are intended to allow programs to customize instruction based on individual student needs. According to Department of Education staff, the amendment will allow programs to tailor courses to address academic needs identified in a student’s individual education plan, which could allow more students to have additional time during the school day for job training and GED preparation courses.
Poor reading ability may impede GED attainment for some students. Programs generally tested students for skills such as reading ability to determine whether they could successfully prepare for and pass the GED test. However, as noted above, the programs with relatively high GED attainment rates tested larger percentages of students at all reading levels and did a better job at preparing students with reading deficits to pass the GED examination compared to other programs (see page 5). Thus, programs could better prepare students at all reading levels who are most at risk for dropping out of school upon release to pass the GED examination.
Short lengths of stay and security issues may present challenges to job training at some programs. Instructional staff at some facilities we visited also reported that short treatment duration contributed to the low number of students who received job training. However, length of stay does not appear to be a significant factor for most students in juvenile justice programs whose length of stay is six months or more.
Staff at some programs also noted that safety and security issues can be a barrier to job training opportunities for some students. For example, high and maximum risk residential facilities serve many youth who have committed violent or other serious offenses. Staff at juvenile justice facilities offering job preparation conduct an assessment to identify students who might harm themselves, other students, or personnel and restrict these students from using certain tools and equipment. High and maximum risk programs in particular must take additional
Report No. 10-55 OPPAGA Report
9
security precautions to ensure the safety of students and staff participating in job training activities. While these considerations can limit the training programs and other activities offered to youth, three of the four high and maximum risk programs we visited provided job training. Some of this training was offered on-line and did not involve handling tools, which diminishes safety concerns.
Programs have insufficient information on how to increase funding for GED preparation and job training programs. Program staff reported that they lacked information on available state and federal funding for GED preparation and career education as well as about the regional and community organizations that could help them to expand job training opportunities. This was a particular issue at smaller programs, which did not have the staff resources to identify grant opportunities, work with local businesses, or attend training and informational sessions.
Staff at some facilities we visited also erroneously believed that juvenile justice programs could not offer GED preparation courses because these courses would not be eligible for Florida Education Finance Program funding. However, state law expressly provides for such funding. Due to this misunderstanding, juvenile justice programs in only three school districts offered and received funding for GED preparation courses in the 2009-10 school year.
Administrators of programs with more career and technical education offerings developed partnerships to provide job training. Programs that provided students a wide variety of job training opportunities had developed strong partnerships with other entities. These partnerships included state colleges and regional workforce boards, community organizations, trade associations, and local businesses. Three residential commitment programs we visited in rural communities offered automotive repair and service programs onsite to enable students to learn these marketable skills. Because students were not permitted to leave the facility for training, the training programs allowed community members to bring their vehicles to the facility for service. Other facilities with
successful job training programs used similar creative strategies.
The statewide multiagency plan is dated and provides inadequate information for juvenile justice programs and school districts. In 2000, the Legislature directed the Department of Juvenile Justice and the Department of Education to work together to develop a statewide multiagency career plan that establishes the curriculum, goals, and outcome measures for vocational education for youth in juvenile justice facilities.17
However, the plan has several shortcomings. The plan has not been updated since 2007, and it lacks goals and implementation strategies for increasing the percentage of youth receiving occupation-specific job training. Also, the plan addresses only career education issues in residential settings, although students in non-residential facilities would also benefit from inclusion in the plan. State law does not specifically require participation from key stakeholders such as representatives from the business community, industry trade groups, vocational-technical schools, and juvenile justice program providers with vocational programs.
This law directed the agencies to align their policies, practices, technical manuals, contracts, quality assurance standards, performance-based budgeting measures, and outcome measures with the multiagency plan. The plan is intended to help coordinate the state’s career education expectations and activities for youth in juvenile justice facilities.
18
17 Sections 985.622 and 1003.52, F.S.
Finally, current law does not require the plan to address the barriers that juvenile justice students face in attaining GEDs. Many juvenile justice students need both job training and GEDs, and
18 Section 1003.52(22) F.S., requires that the Department of Juvenile Justice and the Department of Education consult with community colleges, providers, and others on the multiagency plan. However, the statute does not specifically require the involvement of certain other stakeholder groups in the development of the plan. The most recent workgroup (2007) did not include representatives from school district vocational-technical schools, postsecondary institutions offering career education, and the business community, and included only one representative from an industry trade group.

OPPAGA Report Report 10-55
10
the barriers to these two outcomes are often similar and interrelated.
To address these issues, the Legislature may wish to amend s. 985.622, Florida Statutes, to
clarify that the multiagency plan must include curriculum, goals, and outcome measures for youth in non-residential facilities;
require that the plan include specific goals and strategies for identifying and eliminating barriers to increasing occupation-specific job training and GED preparation opportunities particularly for older, higher risk students; and
broaden required stakeholder involvement in plan development to specify participation of representatives from the business community, industry trade groups, district vocational-technical schools, state and school district postsecondary career education, and juvenile justice program providers with vocational programs.
In addition, we recommend that the Department of Education provide information to school
districts and juvenile justice programs regarding available Florida Education Finance Program funding for GED preparation courses and recent administrative rule changes that allow increased curricular flexibility for juvenile justice students.
We also recommend that the Department of Juvenile Justice and the Department of Education report to the Legislature on the effectiveness of their efforts to increase GED attainment and job training services for juvenile justice students. In addition, the agencies should report information on whether these students are employed, in school, in the military, or have re-entered the criminal justice system.
Agency Response ______ In accordance with the provisions of s. 11.51(5), Florida Statutes, a draft of our report was submitted to the Commissioner of the Florida Department of Education and the Secretary of the Florida Department of Juvenile Justice to review and respond.
Their written responses have been reprinted herein in Appendix B.

Report No. 10-55 OPPAGA Report
11
Appendix A
Study Population and Data Definitions
As part of our study, we assessed the educational outcomes for older students in juvenile justice system schools, including their high school credits earned, GED attainment, and participation in job training. We assessed slightly different subgroups of the juvenile justice population for each measure, as described below.
Academic Progression Study Population. To examine the number of high school credits earned by students in juvenile justice programs, we focused our analysis on students in grades 9 through 12, since students in lower grades are not expected to earn high school credits. In addition, we limited our study to those students who were in the juvenile justice programs for at least three months in 2008-09, since a shorter stay likely would not have provide adequate time for students to earn high school credits. We identified 9,674 students who were enrolled in juvenile justice programs at a high school level during the 2008-09 school year; 6,740 of these youth were in these programs for at least three months. We reported credit hours earned in each program that students enrolled in during the period; some students were enrolled in multiple juvenile justice programs during the year. The unduplicated total number of students enrolled in high school grades was 8,830 students, of whom 6,492 were enrolled in the program for at least three months.
To evaluate outcomes of students who had substantial academic deficits when they entered a juvenile justice program, we identified those who were six credits or more behind their age level peers in terms of the academic credits needed for graduation. We counted students in the ninth grade as behind if they were one or more grade levels behind their age level peers when they entered ninth grade.
Outcome Measures. We defined academic progression as earning high school credits, and assessed whether high school students earned at least six credits per year, or three credits per semester, the minimum needed to be on track to earn the required 24 credits for graduation. Juvenile justice educational programs operate year-around since many students enter and exit facilities during any point in a semester and stay for varying lengths of time. We calculated the credits earned by students per semester by dividing the total credits they earned while in the program by the number of months the student was in the program, and multiplying that number by six. We reported these credits as earned at the facility the student was enrolled in at the time; if a student was in more than one juvenile justice program, we reported the credits for each program.
GED Attainment and Job Training Study Population. To identify the percentage of students earning a GED, we examined the population of students who were age 16 or older during the 2008-09 school year regardless of grade level, did not earn a high school diploma, and stayed at least three months in the program. These criteria identified 6,777 youth enrolled in juvenile justice programs in 2008-09.

OPPAGA Report Report 10-55
12
To evaluate outcomes of students who had substantial credit deficits when they entered their juvenile justice program, we identified the students who were six credits or more behind their age level peers. For students not in high school, we classified youth as having a substantial credit deficit if they were one or more grade levels behind the expected grade level for their age cohort when they entered their current grade. Of the 6,777 students who were age 16 and older in this population, 2,159 had no substantial credit deficits, and 4,618 were six credits or more behind.
To evaluate access to GED testing, we compared the percentage of students tested by reading ability at 26 programs where 20% or more of the students received a GED to programs with lower GED attainment rates. This analysis involved students age 16 or older with substantial credit deficits, including
543 students who scored at Level 3 on the reading FCAT, 152 at programs with high GED attainment rates, and 391 at other programs;
972 students who scored at Level 2 on the reading FCAT, 238 at programs with high GED attainment rates, and 734 at other programs; and
2,817 students who scored at Level 1 on the reading FCAT, 652 at programs with high GED attainment rates, and 2,165 at other programs.
To evaluate GED pass rates, we identified 849 students age 16 or older with substantial credit deficits who were tested for a GED, including
180 students who scored at Level 3 on the reading FCAT, 81 at programs with high GED attainment rates, and 99 at other programs;
245 students who scored at Level 2 on the reading FCAT, 103 at programs with high GED attainment rates, and 142 at other programs; and
424 students who scored at Level 1 on the reading FCAT, 194 at programs with high GED attainment rates, and 230 at other programs.
Measures for GED Attainment. We identified 956 GEDs earned by students in juvenile justice programs. We attributed these to the juvenile justice program if the GED test was taken during the student’s stay in a juvenile justice program or within 90 days after. If the test date was missing, we attributed the GED award to the juvenile justice program if it was earned during the year the student was in the juvenile justice program or the year the student exited the juvenile justice program. Since Department of Education data uses end of year dates as withdrawal dates even if students continue in the program, we used a wide timeframe in calculating the number of GEDs earned by students in juvenile justice programs. If a student was enrolled in more than one juvenile justice program during the school year, we attributed the GED to the program where the students’ test date fell between their entry and exit date.
Job Training Study Population. To evaluate the percentage of students enrolled in job training and receiving occupational completion points, we identified the population of 7,296 juvenile justice students who were age 16 or older during the 2008-09 school year. We defined students with substantial credit deficits as those who were six credits or more behind the expected number of credits for their age cohort. For students who were enrolled in more than one juvenile justice program during the school year, we counted each enrollment in a juvenile justice program.

Report No. 10-55 OPPAGA Report
13
Measures for Job Training. We defined job training courses as those that provide career education competencies or prerequisites for entry into a specific occupation, according to the criteria in s. 985.622, Florida Statutes. This is a more restrictive category than ‘job preparatory’ courses as defined by the Department of Education, which includes courses that do not provide career education competencies for entry into a specific occupation. We identified the course enrollments and occupational completion points earned where a juvenile justice school was the school of instruction for students enrolled during the 2008-09 school year.

OPPAGA Report Report 10-55
14
Appendix B

Report No. 10-55 OPPAGA Report
15

OPPAGA Report Report 10-55
16

Report No. 10-55 OPPAGA Report
17

OPPAGA Report Report 10-55
18

Report No. 10-55 OPPAGA Report
19

The Florida Legislature
Office of Program Policy Analysis and Government Accountability
OPPAGA provides performance and accountability information about Florida government in several ways.
Reports deliver program evaluation and policy analysis to assist the Legislature in overseeing government operations, developing policy choices, and making Florida government better, faster, and cheaper.
PolicyCasts, short narrated slide presentations, provide bottom-line briefings of findings and recommendations for select reports.
Government Program Summaries (GPS), an online encyclopedia, www.oppaga.state.fl.us/government, provides descriptive, evaluative, and performance information on more than 200 Florida state government programs.
The Florida Monitor Weekly, an electronic newsletter, delivers brief announcements of research reports, conferences, and other resources of interest for Florida's policy research and program evaluation community.
Visit OPPAGA’s website at www.oppaga.state.fl.us
OPPAGA supports the Florida Legislature by providing data, evaluative research, and objective analyses that assist legislative budget and policy deliberations. This project was conducted in accordance with applicable evaluation standards. Copies of this report in print or alternate accessible format may be obtained by telephone (850/488-0021), by FAX (850/487-3804), in person, or by mail (OPPAGA Report Production, Claude Pepper Building, Room 312, 111 W. Madison St., Tallahassee, FL 32399-1475). Cover photo by Mark Foley.
OPPAGA website: www.oppaga.state.fl.us
Project supervised by David D. Summers (850/487-9257) Project conducted by LucyAnn Walker-Fraser, Steve Harkreader, Amelia Parnell, Glenda A. Rabby, and Laurie Scott
Jane Fletcher (850/487-9255), Staff Director, Education Policy Area Gary R. VanLandingham, Ph.D., OPPAGA Director