just “sittin” in the easy chair – “readin” the paper
DESCRIPTION
JUST “SITTIN” IN THE EASY CHAIR – “READIN” THE PAPER . BIGFOOT INVESTMENTS OPEN FORUM Apr 25th, 2013 WELCOME!. AGENDA WELCOME! ADMIN NOTES QUOTE OF THE DAY OPTIMISM GAUGE CHARTS OF INTEREST SO WHAT’S UP WITH: THE “MARKET” A CLOSER LOOK AT: PRGO DAVID’S CORNER - PowerPoint PPT PresentationTRANSCRIPT

Built By Advisors For Advisors
JUST “SITTIN” IN THE EASY CHAIR – “READIN” THE PAPER

Built By Advisors For Advisors
BIGFOOT INVESTMENTS OPEN FORUM
Apr 25th, 2013
WELCOME!

Built By Advisors For Advisors
AGENDA WELCOME! ADMIN NOTESQUOTE OF THE DAYOPTIMISM GAUGECHARTS OF INTERESTSO WHAT’S UP WITH: THE “MARKET” A CLOSER LOOK AT: PRGO DAVID’S CORNERSWAPS AND SPREADSLEE’S COMMENTS QUESTIONS/COMMENTS

Built By Advisors For Advisors
IF YOU USE ANY OF OUR SLIDES, PLEASE REMEMBER TOHAVE THEM APPROVED BY YOUR COMPLIANCE DEPARTMENT.
WE’LL UN-MUTE YOU ON OUR END SO YOU CAN ASK QUESTIONS.
PLEASE MUTE AUDIO FROM THE MENU ON YOUR SCREEN SO WE DO NOT GET FEEDBACK.
THANK YOU!
“NOTES”

Built By Advisors For Advisors
BigFoot Investments is now on Twitter, LinkedIn!

Built By Advisors For Advisors
BigFoot On LinkedIn!
Don’t Forget To Join Our “Group”

Built By Advisors For Advisors
Notifying You!
SMS Alert System

Built By Advisors For Advisors
Screening/Scoring for MayACTION POSTING DATES
Stock Screen By 5pm CDST – Friday 4/30/2013*
Dividend Screen
ETF Selections
Stock Screening Friday May 3rd , 2013

Built By Advisors For Advisors
QUOTE OF THE DAY:The only time my prayers are never answered…..
Billy Graham
….is on the golf course!

Built By Advisors For Advisors
Optimism Gauge
As of: 4/25/2013

Indicator Current Value Prior/Metric Value Current Value
St Louis Fed Financial Stress Index -0.693 -0.645(Revised) +1.0
Chicago Fed National Act Index (3 Mon Mov Av) -0.01 0.12(Revised) -.50
Unemployment 7.7 7.9 (Revised) +.50Weekly Jobless Claims (4Wk Mov Av) 339,000 355,000(Revised) +.50
ECRI Weekly Index 6.6 6.4 (Revised) +.50Conf Board Leading Indicators (NEW) 94.7 94.8 -1.0
University of Michigan Sentiment - Final 78.6(Final – Mar 2013) 77.6(Final-Feb 2012) -.25Monthly Retail Sales (Adjusted) 416,990 416,070 +.50NFIB Small Business Sentiment 89.5 90.8 -.50ISM Manufacturing 51.3
(Expansion Line = 50) 54.2 +.50
Economic Capacity Utilization 78.5 78.3(Revised) +.50Stock Market Moving Averages Weekly Data Points >50-day MA/>100-Day MA N/A
+.50
S&P Case-Shiller 20 City Comp Index 146.14 145.95 (Revised) +.50
Total +2.75Last Update: 4/25/2013
Measuring Our Economy

NOTES/COMMENTS CURRENT READING: 63.4%
PRIOR READING: 59.1%
BIAS: SLIGHTLY BULLISH
9 OF 13 INDICATORS POSITIVE
TREND - INCREASING
EconomicOptimism
Index
15
25
35
45 65
75
85
95
63.4%
READING AS OF: 4/25/2013
POSITIVE AS OF: 8/17/2012
Current Reading Prior Reading
Measuring Our Economy

Built By Advisors For Advisors
Charts of Interest!
Built By Advisors For Advisors
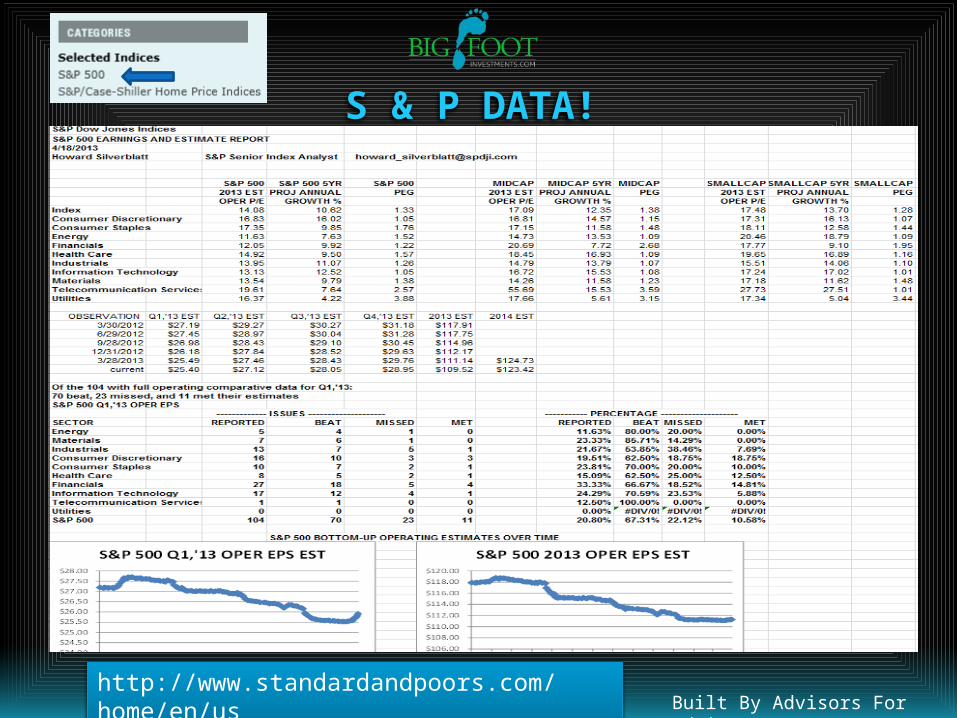
S & P DATA!
http://www.standardandpoors.com/home/en/us

Built By Advisors For Advisors
S & P DATA!

Built By Advisors For Advisors
“HEADLINE” DATA IS GOOD!
Mar 2013: SAAR of 417,000 – Up 1.5% from revised Feb @ 411,000 and 18.5% above the
March 2012 estimate of 352,000.
Source: Calculated Risk

Built By Advisors For Advisors
BUT THE “RATIO GAP” IS IMPORTANT
WE NEED A BETTER RATIO TO “BALANCE” THE MARKET
Source: Calculated Risk
Consistent for many years
Way out of balance
Built By Advisors For Advisors
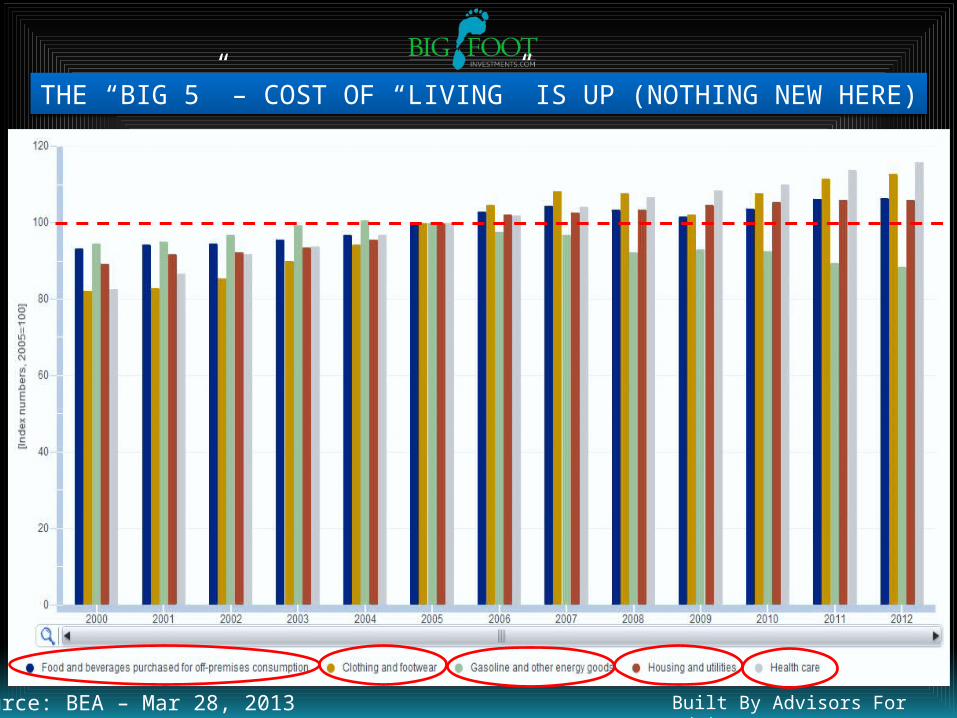
THE “BIG 5” – COST OF “LIVING” IS UP (NOTHING NEW HERE)
Source: BEA – Mar 28, 2013

Built By Advisors For AdvisorsSource: Bloomberg/Scott Grannis
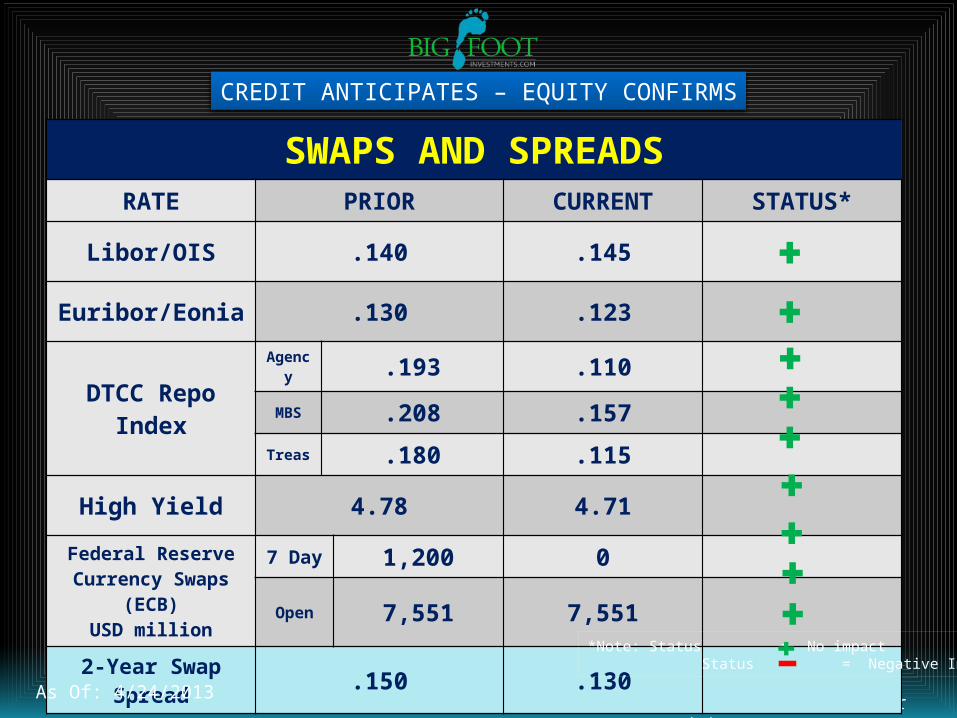
Swap and credit spreads have typically been good coincident and forward-looking indicators of systemic risk and the health of the economy. Currently they are
showing no signs of any deterioration
Built By Advisors For Advisors
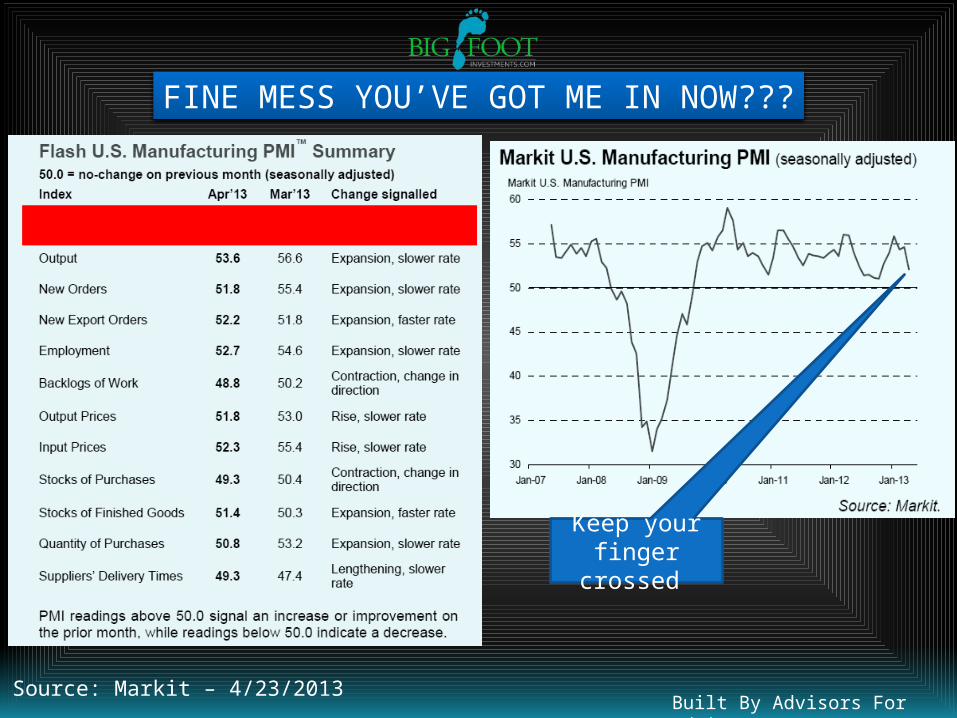
FINE MESS YOU’VE GOT ME IN NOW???
Keep your finger crossed
Source: Markit – 4/23/2013

Built By Advisors For Advisors
THE CARS OF THE FUTURE

Built By Advisors For AdvisorsSource: Census Bureau
A GLITCH – FOR NOW
Ex-Transportation: -1.4%Shipments up: 0.4%
NEW ORDERS
NEW ORDERSADVANCE RPT

Built By Advisors For Advisors
SO WHAT’S UP WITH:THE MARKET
Looking P/E Multiples and History

Having reached all-time highs – can we go higher? Are multiples out of line? Will earnings falter? What if the Fed “pulls the plug?” WHAT IF?!!!!!
WHERE TO FROM HERE?
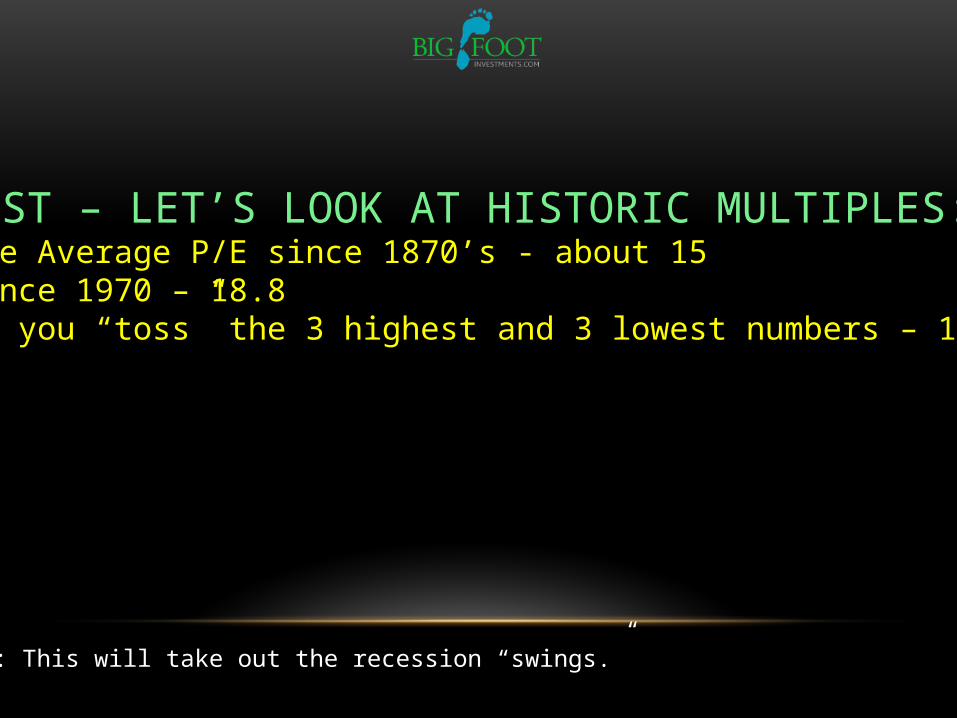
FIRST – LET’S LOOK AT HISTORIC MULTIPLES: The Average P/E since 1870’s - about 15 Since 1970 – 18.8 If you “toss” the 3 highest and 3 lowest numbers – 17.6*
*Note: This will take out the recession “swings.”
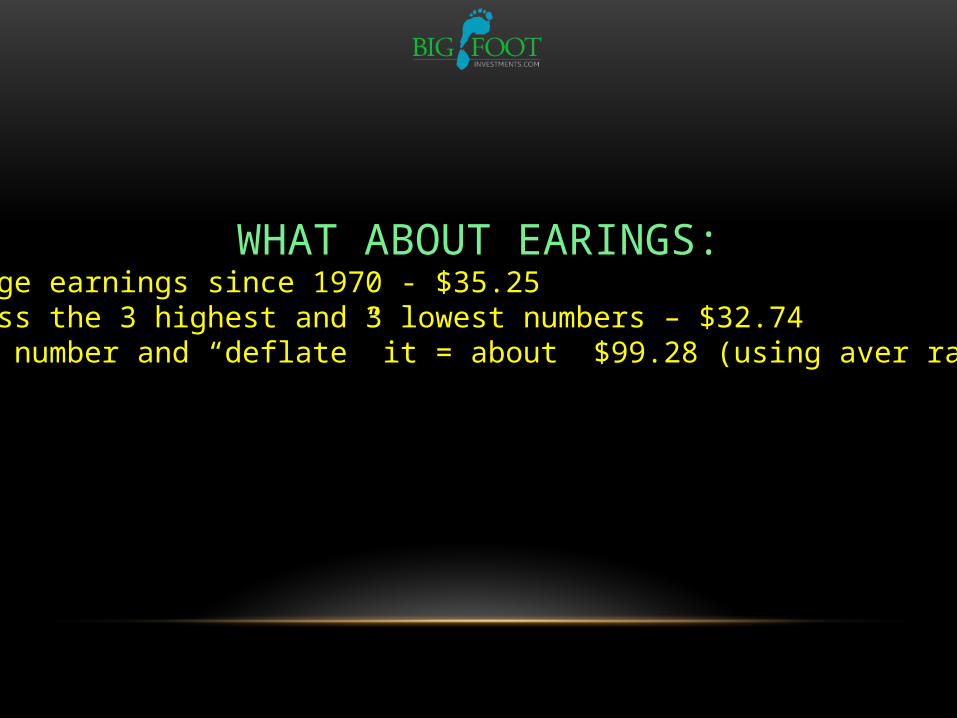
WHAT ABOUT EARINGS: The Average earnings since 1970 - $35.25 If you toss the 3 highest and 3 lowest numbers – $32.74 Take that number and “deflate” it = about $99.28 (using aver rate of 4.4%)

SO:
The current multiple (17.5) is about average (from last 43 years at 17.6)
Current projected earnings at $109.52 (according to S&P) are not that disjointed from the average real earnings of $99.28

NOW LET’S TOSS IN THE INFLATION FACTOR
According to Wells Fargo research, if inflation is below 4%...…historic P/E multiples are above the norm almost 70% of the time.
They use 15 as the long term P/E multiple
Since 1945, the odds are better (70% beat)
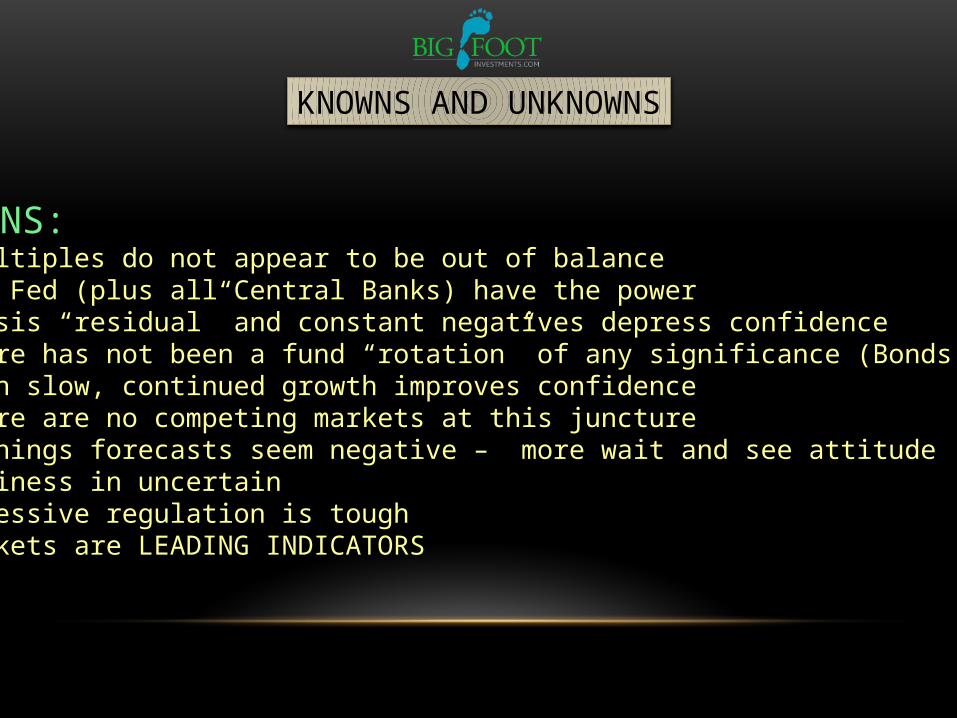
KNOWNS: Multiples do not appear to be out of balance The Fed (plus all Central Banks) have the power Crisis “residual” and constant negatives depress confidence There has not been a fund “rotation” of any significance (Bonds –M/M) Even slow, continued growth improves confidence There are no competing markets at this juncture Earnings forecasts seem negative – more wait and see attitude Business in uncertain Excessive regulation is tough Markets are LEADING INDICATORS
KNOWNS AND UNKNOWNS

KNOWNS AND UNKNOWNS
UNKNOWNS Europe Government The Fed’s “unwind” Global Central Banks Emerging Markets China Global Business Climate Consumer Employment Alternative Markets Inflation

MULTIPLES ABOVE 20 ARE NOT THAT UNCOMMON

CONCLUSIONS: 60/40 is not protection In the “hands” of the Fed (they made it – they can break it) Fed raising rates is actually a necessity…. ……But –the exit strategy is critical Slow growth is OK World economies are important To capture the market’s potential we will need a pullback Inflation is a critical factor The balance between multiples and earnings is not clear –
don’t make too many assumptions Biggest risk is uncertainty

CITY #1 Good Fed exit Inflation remains at target 2.5 to 3.0% 3.5% GDP growth next 3 years Market multiple of 17.5 Earnings increase at 3.5% (now about $98) Target S&P = 1900
A “TALE OF TWO CITIES”
CITY #2 Bad Fed exit Inflation soars above 4% Less than 3% GDP growth next 3 years Market multiple of 14 Earnings increase at 2.5% (now about $98) Target S&P = 1477 (Ouch!)

Built By Advisors For Advisors
A CLOSER LOOK AT: PRGO

Built By Advisors For Advisors
Enters Portfolio

Perrigo Co. (PRGO)Perrigo Company, through its subsidiaries, develops, manufactures, and distributes over-the-counter (OTC)
and generic prescription (Rx) pharmaceuticals, infant formulas, nutritional products, and active pharmaceutical ingredients (API) worldwide. The company operates in four segments: Consumer
Healthcare, Nutritionals, Rx Pharmaceuticals, and API. The Consumer Healthcare segment offers a line of OTC pharmaceutical products in the areas of analgesics, cough/cold/allergy/sinus, gastrointestinal, and
smoking cessation, as well as in the areas of feminine hygiene, diabetes care, and dermatological care. The Nutritionals segment develops, manufactures, markets, and distributes infant and toddler formula
products, infant and toddler foods, and oral electrolyte solution products, as well as vitamin, mineral, and dietary supplement products. The Rx Pharmaceuticals segment develops, manufactures and markets a
portfolio of generic prescription drug products in topical dosage forms, such as creams, ointments, lotions, gels, shampoos, foams, suppositories, sprays, liquids, suspensions, solutions, and powders, as well as
controlled substances, injectables, hormones, and oral liquids and oral solid dosage forms. The API segment develops, manufactures, and markets API used by the generic drug industry and branded pharmaceutical
companies. Perrigo Company also manufactures and markets branded prescription drugs; and imports pharmaceutical, diagnostics, and other medical products. The company sells its products through chain drug stores, wholesalers, distributors, hospital systems, and group purchasing organizations, as well as
retail drug, supermarket, and mass merchandise chains. It has joint development agreements with Medicis Pharmaceutical Corporation, and M. Arkin, Ltd. Perrigo Company was founded in 1887 and is
headquartered in Allegan, Michigan.
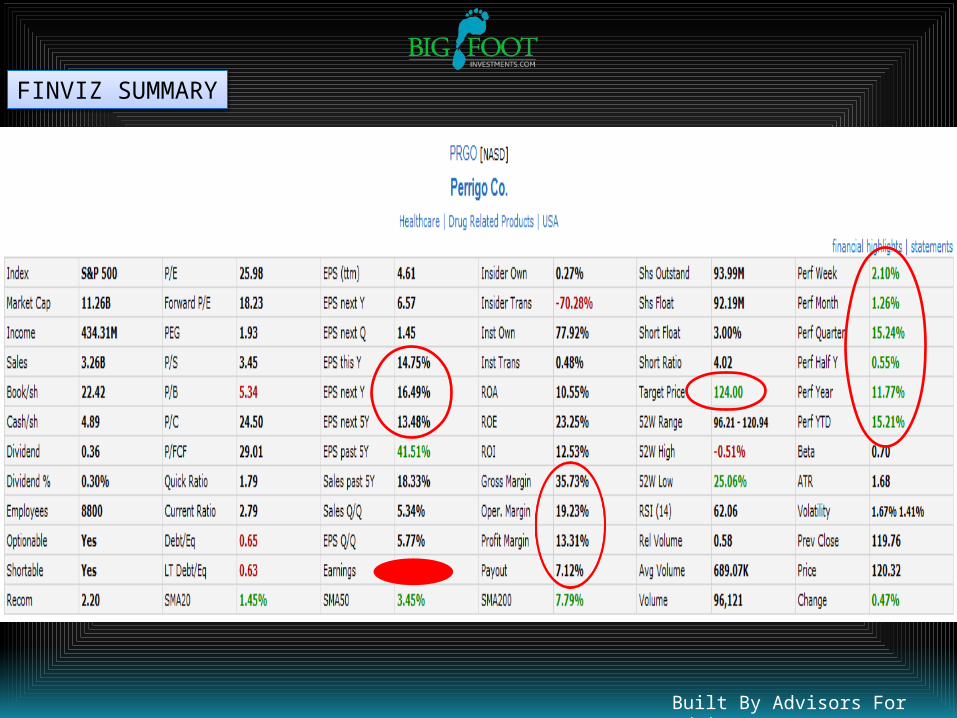
Source: FinViz.com, April 2013

PERRIGO ACQUISITION OF VELCERA, INC. -- KNOWN FOR ITS PETARMOR® FRANCHISE OF FLEA AND TICK
TREATMENTS -- CLOSES APRIL 1, 2013
Velcera, together with major retail partners, has been instrumental in developing an OTC market for pet health products traditionally
dispensed only by veterinarians. Retail sales of the PetArmor® franchise exceeded $100 million during calendar year 2012, the value-brand's first full year on the market, having launched in April 2011. Velcera sales for
calendar year 2012 were approximately $60 million. The PetArmor® franchise brand will be supported by a number of pipeline product
candidates in both flea and tick and health and wellness categories that will continue to bring additional vet technologies to the hands of
consumers in the mass market.
Slightly accretive to adjusted EPS/dilutive to GAAP EPS 2013 Expected $0.11 accretive adjusted EPS/neutral to marginally dilutive GAAP EPS 2014 Fully accretive 2015

Sources: Morningstar, March 2013
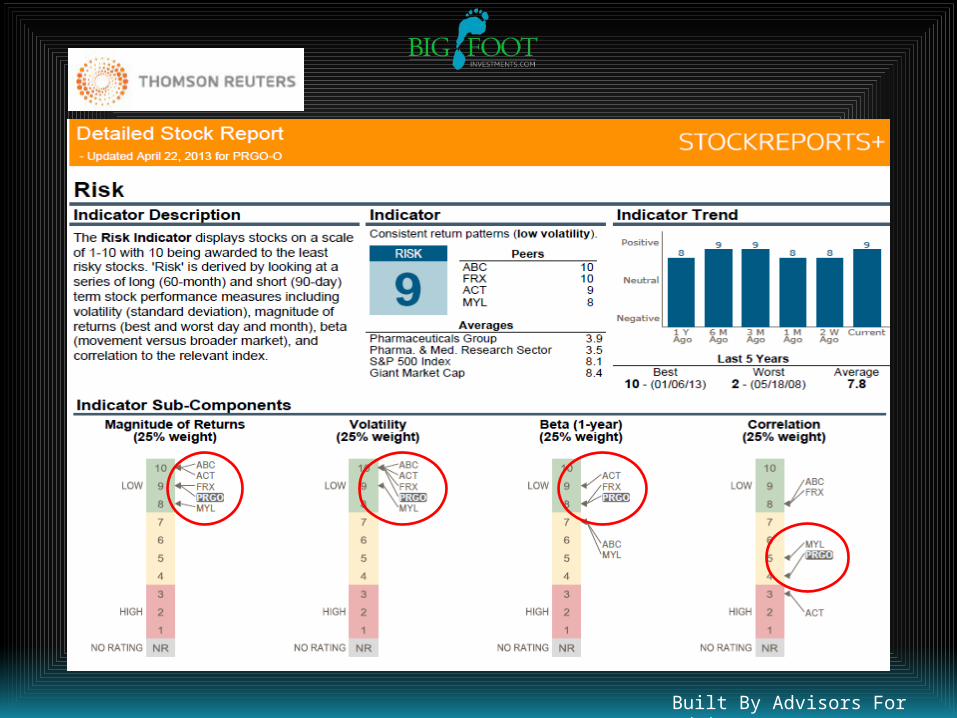
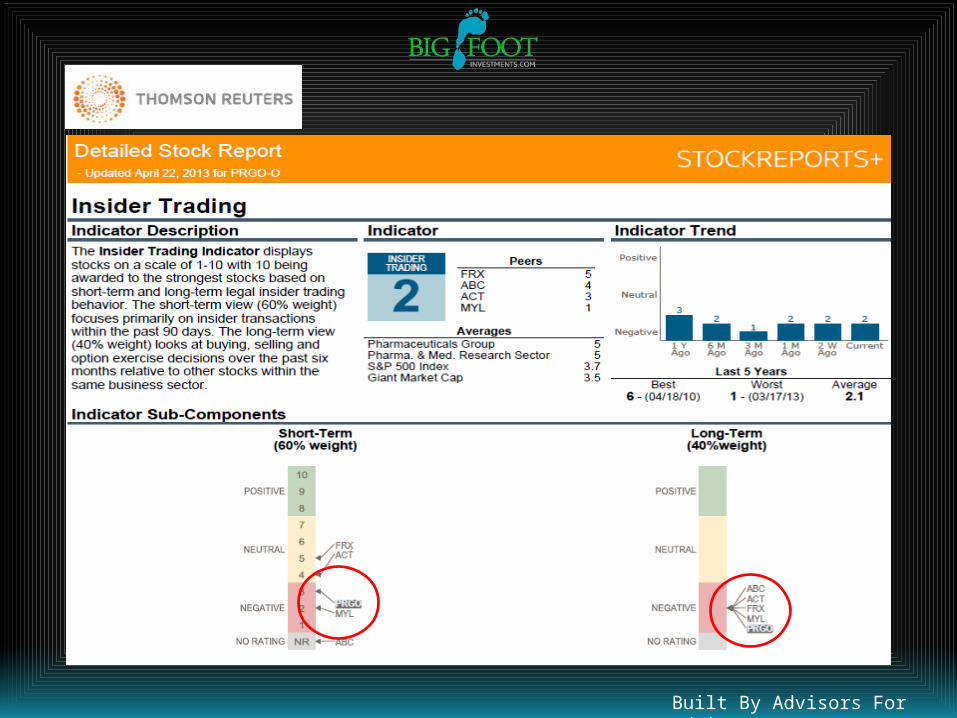
POSITIVES: Perrigo is the market leader in generic releases of prescription drugs that receive OTC approval, participating in roughly 80% of such domestic launches.
Possible concerns: Johnson & Johnson's eventual return to the OTC market and a gradually improving economy should slow Perrigo's market share gains in its store-brand consumer health segment.
Perrigo Co. (PRGO)

Built By Advisors For Advisors

Built By Advisors For Advisors

Built By Advisors For Advisors
Against this backdrop of escalating costs, the Generic Drug Savings analysis shows conclusively that the use of lower cost generic prescription drugs is a vital component to holding down the growth rate of health care spending. As the study shows, generic drug
use has saved the U.S. health care system approximately $1.07 trillion over the past decade (2002 through 2011) with $192.8 billion in savings achieved in 2011 alone.
Considering that the government’s share of health care spending will soon exceed 30 percent as the oldest baby boomers become eligible for Medicare, the money saved by
using generic medicines is critical to bending the cost curve and providing sustainability to our health care system. Indeed, the NHEA report concluded that, while overall health care
costs continue to grow at a rate higher than national economic growth, the growth in drug spending is slowing (only 1.2 percent in 2010), driven by “continued increase in the
use of generic medications.”
Source: “Generic Drug Savings In the U.S.” – Generic Pharmaceutical Assoc
THINK ACA!!
Built By Advisors For Advisors
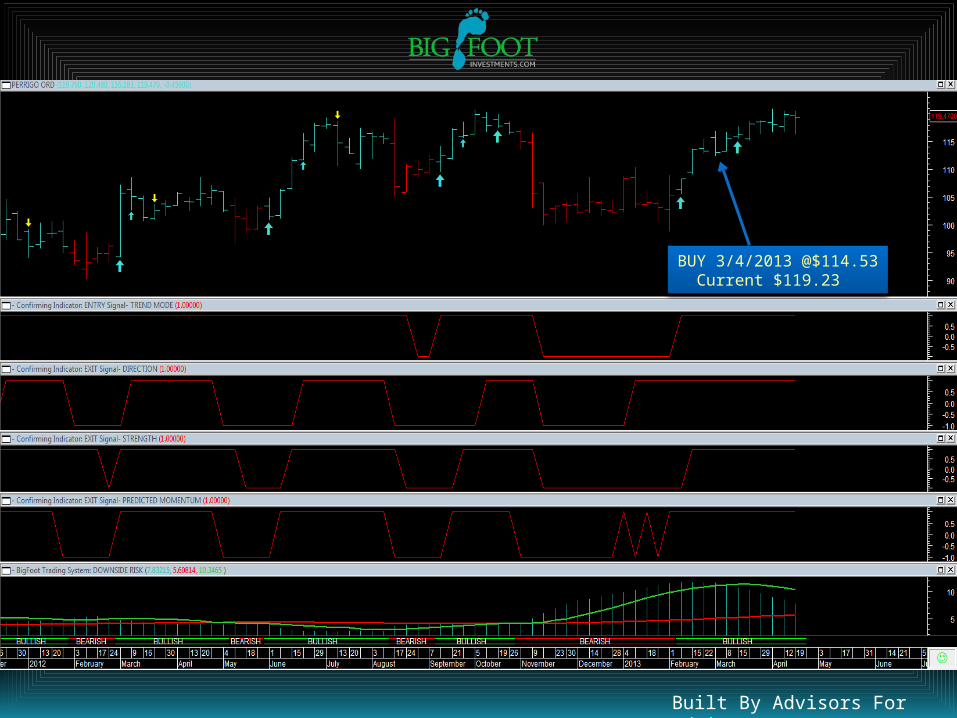
BUY 3/4/2013 @$114.53Current $119.23
Built By Advisors For Advisors
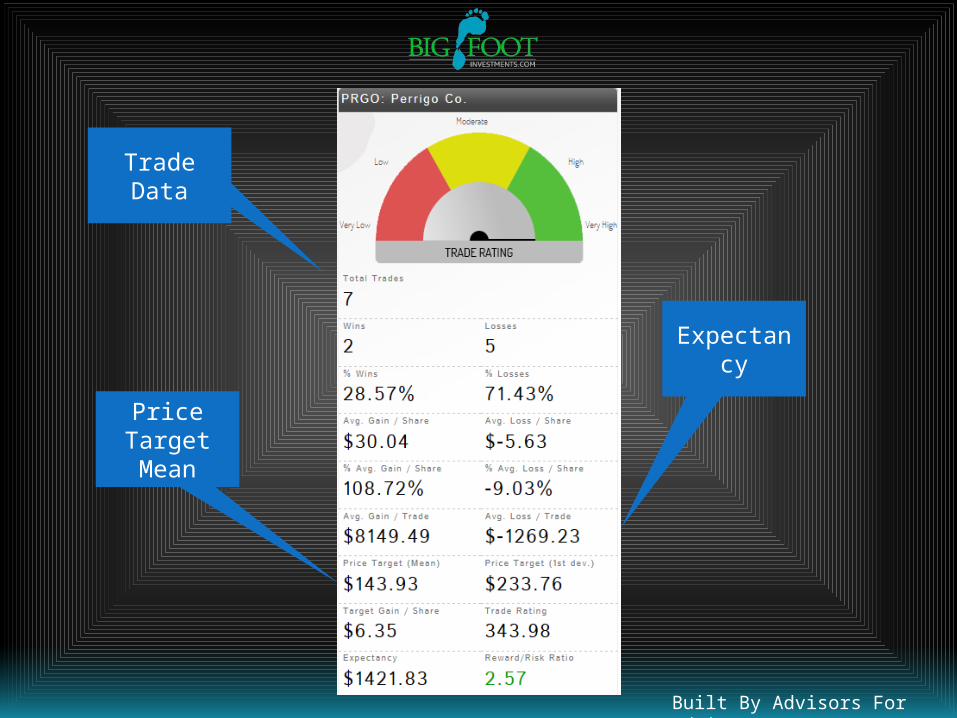
Trade Data
Price TargetMean
Expectancy
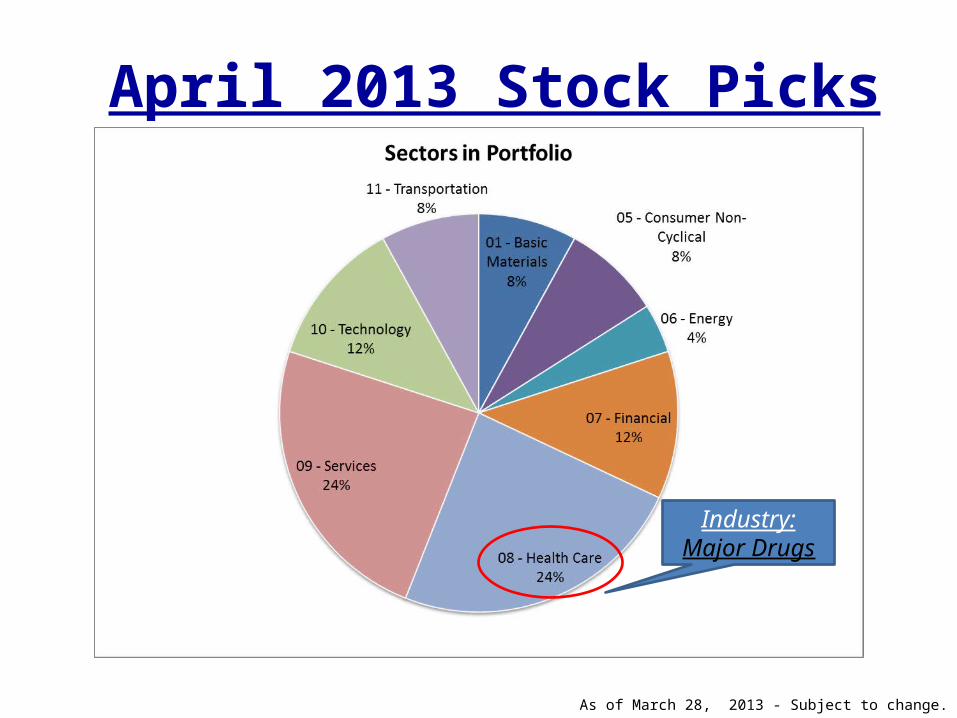
April 2013 Stock Picks
As of March 28, 2013 - Subject to change.
Industry:Major Drugs

Built By Advisors For Advisors
NYSE Healthcare Index

Built By Advisors For Advisors
PHLX Drug Index
Built By Advisors For Advisors
FINVIZ SUMMARY

Built By Advisors For Advisors
Value Line
$118.87

Built By Advisors For Advisors
Value Line

Built By Advisors For Advisors
Built By Advisors For Advisors

Built By Advisors For Advisors
Built By Advisors For Advisors

Built By Advisors For Advisors
Built By Advisors For Advisors

Built By Advisors For Advisors
Built By Advisors For Advisors

Built By Advisors For Advisors
THE CHARTS PLEASE!

Built By Advisors For Advisors
DAVID’S CORNER

Built By Advisors For Advisors
SWAPS & “SPREADS”
IGNORE AT YOUR PERIL
Built By Advisors For Advisors
SWAPS AND SPREADSRATE PRIOR CURRENT STATUS*
Libor/OIS .140 .145
Euribor/Eonia .130 .123
DTCC RepoIndex
Agency .193 .110
MBS .208 .157Treas .180 .115
High Yield 4.78 4.71Federal ReserveCurrency Swaps
(ECB)USD million
7 Day 1,200 0Open 7,551 7,551
2-Year Swap Spread .150 .130 *Note: Status = No impact
Status = Negative Impact
As Of: 4/24/2013
CREDIT ANTICIPATES – EQUITY CONFIRMS

Built By Advisors For Advisors
LEE’S COMMENTS

Built By Advisors For AdvisorsSource: Gartner Research
UNDERSTANDING EMOTION IN THE MARKET
PROCESS DESIGNED IN 1995 TO CYCLES IN THE TECH MARKET IDEA WAS TO EXPLAIN PRODUCT CYCLES AND DETERMINE IF A PARTICULAR TECHNOLOGY WAS “READY” SINCE THEN – APPLIED TO DIFFERENT INDUSTRIES COULD WELL BE APPLIED TO MARKETS GET’S TO THE HEART OF OVER-ENTHUSIASM POINTS TO PROCESS

Built By Advisors For AdvisorsSource: Gartner Research
UNDERSTANDING EMOTION IN THE MARKET

Built By Advisors For Advisors
QUESTIONS & COMMENTS
THANKS FOR JOINING US!
Built By Advisors For Advisors
IMPORTANT DISCLOSURE INFORMATION
Content is intended for investment professional use/review only. Please remember that past performance may not be indicative of future results. Different types of investments involve varying degrees of risk, and there can be no assurance that the future
performance of any specific investment, investment strategy, or product (including the investments and/or investment strategies recommended or undertaken by BigFoot Investments.com), or any non-investment related content, made reference to directly or indirectly in this presentation will be profitable, equal any corresponding indicated historical performance level(s), be suitable for any investment professional’s clients portfolio or individual situation, or prove successful. The investment professional retains
all decision making authority as to whether or not to follow and/or implement any of the presentation content. BigFoot has absolutely no responsibly for any suitability determination pertaining to any of the investment professional’s clients, such
obligation being exclusively the initial and ongoing responsibility of the investment professional. Due to various factors, including changing market conditions and/or applicable laws, the content may no longer be reflective of current opinions or positions.
Moreover, you should not assume that any discussion or information contained in this presentation serves as the receipt of, or as a substitute for, personalized investment advice from BigFoot Investments.com. BigFoot Investments.com. is neither a law
firm nor a certified public accounting firm and no portion of the content should be construed as legal or accounting advice. Investment Professional acknowledges that to the extent required to do so, it is his/her/its exclusively responsibility to advise
his/her/its employer/broker-dealer of its BigFoot subscription. BigFoot Investments.com is a service of Lee Johnson Capital Management, an SEC registered investment adviser located in Fort Worth, Texas. A copy of the Lee Johnson Capital Management
LLC’ current written disclosure statement discussing our advisory services and fees is available for review upon request.
No Sharing of Content: You acknowledge that the presentation content is for investment professional use only. You warrant and represent not to share any portion of the presentation content with any non-subscriber, including but not limited to your
clients or prospects