just enough sas® cloud analytic services: cas actions for ... · one of the many advantages...
TRANSCRIPT
1
Paper SAS2000-2018
Just Enough SAS® Cloud Analytic Services: CAS Actions for SAS® Visual Analytics Report Developers
Michael Drutar, SAS Institute Inc.
ABSTRACT
SAS Visual Analytics includes all of the point-and-click functionality required to load data, manage data, and perform other back-end work necessary to make Visual Analytics visualizations efficient and effective. But there are a handful of critical tasks that are sometimes just easier to do with a few lines of code, especially if your end goal is to automate that that process. While there is a substantial and growing codebase for CAS Actions and SAS Viya procedures, Visual Analytics report developers need to focus on the creation and implementation of reports. What we need is just enough CAS code to simplify the back-end work. This paper presents some of the most common, most useful CAS actions that can be run from any SAS Viya powered code window, including the SAS Studio interface. These bare bones code examples include: loading a data set to a CAS server, using CAS actions to transform data from a “wide” to a “tall” structure, and other formatting operations that make data reporting-ready. The paper demonstrates, using minimal code, how the scored output of a Viya-based model can be lifted into CAS and made ready for Visual Analytics reporting. Finally, the paper describes exactly how coded back-end actions affect the Visual Analytics platform, including how to verify that back-end processes are working and ensure Visual Analytics settings for refresh and automated data re -load are set to take advantage of the automated back-end processes implemented in code.
INTRODUCTION
The SAS Viya platform offers many ways for a user to programmatically interact with CAS. These include connections such python and API calls. This paper will focus on using SAS Studio’s web programming interface, which is installed alongside SAS Visual Analytics. The ability to interact with the SAS platform via a streamlined, completely web-based interface is something that SAS users has looked forward to for years. And now that SAS Viya has delivered it, all that’s needed is for the users to know “just enough CAS”.
CONENCTING AND LOADING DATA TO CAS
Before importing data of any type into CAS, the programmer must first connect to CAS and create a session. This is done with a simple CAS statement. This is similar to how a user would connect to the SAS metadata server within a SAS 9.x install. However, with CAS the connection can easily be enabled with only one simple line of code:
cas mysession;
After submitting the code above, the user can view the log to ensure that they are now successfully connected to CAS. Now that a CAS session has been established the user has opened the door to SAS Viya, from which they can access all of the powerful features CAS has to offer. The first step after establishing a connection to SAS Viya is loading a data set into CAS.
In most cases, any data that is loaded to CAS must be loaded into a CASLIB. CASLIBs are spaces within SAS Viya that operate like SAS metadata libraries. They can be assigned, authorized, and

2
designed. One of the many advantages caslibs offer SAS Viya programmers is the ability to assign all the caslibs available to them with one single line of code:
caslib _ALL_ assign;
Upon submitting the statement above, the programmer can see the caslibs that have been made available to them:
Figure 1. CASLIBS Available in the Current CAS Session
With the CAS session created and caslibs assigned, the programmer is now ready to load data to the CAS server. While a variety of methods exist that allow users to load data to CAS, this paper will focus on loading data via the SAS DATA step. By using this method, the programmer can take advantage of all the data set options that they are accustomed to when working with SAS data. One important element of SAS Viya is that when a CAS data set is loaded, it functions l ike data sets within the SAS work l ibrary. Meaning that i f a data set is loaded to CAS, it will only persist for the duration of the current CAS session. So if the user clears their CAS session, or logs off of SAS Studio, the data that was loaded to CAS will be deleted. Therefore, if the intent of loading the data to CAS is to make it available to SAS Visual Analytics for reporting, an extra DATA step option must be added: the PROMOTE option. Any data set that is loaded to CAS using this option will persist beyond the current CAS session, meaning that the data will be available for use in SAS Visual Analytics. In the following example, the programmer wishes to load the SASHELP data set “BASEBALL” to CAS for use in SAS Visual Analytics. To achieve this, the programmer submits a DATA step with the library “PUBLIC” in the data statement along with the (PROMOTE=yes) data option:
Data PUBLIC.BASEBALL(PROMOTE=yes);
set sashelp.BASEBALL;
run;

3
After submitting this code, the developer can see that the data set “BASEBALL” has been made available in the CASLIB PUBLIC:
Figure 2. CAS Data Set BASEBALL Is Now Available in the PUBLIC CASLIB
A print procedure can now be executed to display the CAS data set PUBLIC.BASEBALL:
Figure 3. PROC PRINT Output of CAS Data Set PUBLIC.BASEBALL
This simple SAS DATA step program, is al l that is needed to load data to CAS. The PROMOTE option ensures that it will not only be available in SAS Visual Analytics, but will also sti ll be in the PUBLIC CASLIB in other, future CAS sessions. One of the main benefits of loading data to CAS via the DATA step is that any data set that can be placed in the SET statement can be used as a CAS data source. Data imported into Base SAS via the PROC IMPORT procedure or a SAS/ACCESS engine are all valid candidates for being placed in the SET statement for a CAS data load via the DATA step.

4
REFRESHING DATA
If a CAS data set needs to be refreshed (or reloaded) the data must first be removed from CAS. This can also be done with a familiar piece of SAS code: the PROC DATASETS procedure. Therefore, if the CAS data set BASEBALL needed to be reloaded. An additional step is needed to first remove the data from the CASLIB “PUBLIC”. The full code to remove and reload the CAS BASEBALL data set is below:
Proc Datasets lib=PUBLIC;
delete BASEBALL;
run;
Data PUBLIC.BASEBALL(PROMOTE=yes);
set sashelp.BASEBALL;
run;
The log is shown below:
Figure 4. Log Output from Reloading the CAS Data Set BASEBALL
It is important to remember to remove any CAS data set before attempting to reload it. Otherwise, the program will return errors.
FORMATTING OPERATIONS TO CREATE REPORT-READY DATA
In most cases, source data and output from analytics procedures do not come in a ‘report ready’ format. Variables can have cryptic labels and numeric variables might be not formatted correctly. The image below shows a Visual Analytics crosstab built off the CAS data set “BASEBALL” that was loaded in the previous section:

5
Figure 5. Visual Analytics Crosstab Using CAS Data Set BASEBALL
This report should not be considered “report ready”. The column labels are redundant as they each contain a reference to the year the data was collected. Also, ‘1986’ is declared at in the tab itself. Hence, the only column which should reference the year in i ts name should be the “1987 Salary in $ Thousands” column. Also, the numeric formatting needs to be adjusted to have the “1987 Salary in $ Thousands” column in dollar format and the ‘Runs in 1986’ in the comma format. While it is possible to make these adjustments within the Visual Analytics report itself; another, simpler method would be to apply these changes to the CAS table itself. Thereby globally resolving the formatting issues and making the fix available to everyone who uses the data. This saves report developers time as they will not have change the labels and formats within Visual Analytics each time a new report is created. One of the best things about the SAS Viya platform is how well it works with the traditional SAS programming methods. SAS programmers can apply several of the same data operations to CAS data that they apply to SAS data. In the example below, the programmer applies label and format statements to the original DATA step from the previous section of this paper:
Proc Datasets l ib=PUBLIC; delete BASEBALL; run;
data PUBLIC.BASEBALL(promote=yes); set sashelp.baseball; label League= "League" Division = "Division" nRuns = "Total Runs" Salary= "1987 Salary"; format nRuns comma8. Salary dollar18.0; run;
First, the CAS data set BASEBALL must be removed from the PUBLIC library via the PROC DATASETS statement. After which the data set is added back into CAS, but with the “report ready” labels and numeric formats applied. Now all that is needed is a simple data refresh within SAS Visual Analytics. The changes to the data set are automatically reflected in the crosstab:

6
Figure 6. Visual Analytics Crosstab Using CAS Data Set BASEBALL with ‘Report Ready’ Formatting
This Visual Analytics crosstab looks much better and is now ‘report ready’. The changes have been applied at the CAS table rather than at the report level. Hence, making future report building quicker and easier.
SENDING VIYA-BASED MODEL SCORED OUTPUT DATA TO VISUAL ANALYTICS SAS Viya comes with a wide range of statistical models and advanced analytical capabilities. While these are powerful tools to use, their value can be made even greater i f their data sets can be sent to SAS Visual Analytics for reporting. As shown thus far in this paper, any data set can be loaded and promoted to CAS and therefore made available as a data source within SAS Visual Analytics reports. This principle also applies to results from viya-based modeling procedures. To demonstrate this an example from support.sas.com, which uses the BASEBALL will be shown. The example leverages the Viya-based REGSELECT procedure, using the variable logsalary as its target. The models’ inputs are the baseball players’ various performance metrics. For more information about the model, see (http://documentation.sas.com/?docsetId=webeditorref&docsetTarget=p0ty95p387a761n1pi5dnow9m7rm.htm&docsetVersion=3.71&locale=en). Upon completing the example, the REGSELECT procedure produces the table casuser.Regselect_stats:
Figure 7. View of the CAS Output Table casuser.Regselect_stats.

7
The output from the model is already a CAS data set in the CASLIB ‘casuser’. However, the data set has not been PROMOTED and therefore is not available in SAS Visual Analytics. As shown in the first section of this paper, a simple DATA step with a promote statement can create a CAS data set that is available for reporting in SAS Visual Analytics. In the example below, the table specified in the set statement of the DATA step is i tself, a CAS table. Consequently, the programmer submits the following code:
data PUBLIC.Regselect_stats(promote=yes); set casuser.regselect_stats; run;
After which the data set is available in SAS Visual Analytics for reporting. By loading the data to the PUBLIC library and promoting it, it is ready for use by the entire suite of SAS Visual Analytics objects (scatter plots, bar charts, and so on.) The same table from figure 7 is displayed below as a list object:
Figure 7. View of the CAS Output Table PUBLIC.Regselect_stats as a Visual Analytics List Table
This example above can be taken one step further. The Linear Regression task in SAS Studio offers the ability to view the code that SAS Studio creates as the task is generated. This gives the programmer the ability to automate the process of running the model and sending the results to SAS Visual Analytics. From the code window in the Linear Regression task, the programmer can see the generated PROC REGSELECT code. From this i t can be seen that (as expected) the input CAS data set is PUBLIC.BASEBALL and the output CAS data set is CASUSER.Regselect_Stats.

8
Figure 8. Code Generated from the Linear Regression Task in SAS Studio
Using what has been learned throughout this paper, the developer can now write a simple program that loads the source data to CAS, runs PROC REGSELECT procedure, and makes the output from the procedure to available in SAS Visual Analytics. The code below demonstrates the complete end to end process:
cas mysession; caslib _ALL_ assign;
proc datasets l ib=PUBLIC; delete BASEBALL; run;
data PUBLIC.BASEBALL; set sashelp.baseball; label League= "League" Division = "Division" nRuns = "Total Runs" Salary= "1987 Salary"; format nRuns comma8. Salary dollar18.0; run;
ods noproctitle;
proc regselect data=PUBLIC.BASEBALL; class League Division; model logSalary=League Division nAtBat nHits nHome nRuns nRBI nBB YrMajor CrAtBat CrHits CrHome CrRuns CrRbi CrBB nOuts nAssts nError / clb vif; output out=casuser.Regselect_stats p=predicted r=residual cookd=cookd h=leverage; run;
proc datasets l ib=PUBLIC; delete Regselect_stats; run;
data PUBLIC.Regselect_stats(Promote=yes);

9
set casuser.regselect_stats;
run;
The process above shows that with just a few l ines of SAS code, a robust process can easily be created to load data, run Viya-based models and deliver their output data sets to SAS Visual Analytics.
TRANPSOING DATA
As with most projects there are times when data must be modified to get i t into the format needed for analysis. One of the most common data manipulation tasks is transposing data from a WIDE to a TALL format. Consider the BASEBALL data set example from the previous example. Suppose the programmer needed to quickly create a ‘baseball card’ style report that displays the Career Statistics for the player Billy Beane. The data in its current, wide format is displayed below:
Figure 9. Billy Bean Data in Wide Format
In order to do this, the data needs to be transposed in a TALL data set format. Normally, might require the use of SAS arrays. Fortunately, the CAS Transpose Action allows the programmer to create the needed TALL data set in just a few l ines. Hence, the programmer can submit the code:
proc cas; transpose.transpose / table={name="baseball", caslib="PUBLIC",where="name='Beane, Billy'"} attributes={{name="name", label="name"}} transpose={"CrAtBat", "CrBB", "CrHits", "CrHome", "CrRbi", "CrRuns"} name="Statistic" id={"Name"} casOut={name="Billy_Beane_Career_Stats", caslib="PUBLIC", replace=true} ; run;
The following TALL data set is created in the PUBLIC CASLIB:
Figure 10. Billy Bean Data in TALL Format
Looking at this output more closely, in just one CAS action the following happened:

10
• The CAS table PUBLIC.BASEBALL was selected as the action’s input
• The table was filtered by the player name “Beane, Billy”
• The six variables "CrAtBat", "CrBB", "CrHits", "CrHome", "CrRbi", "CrRuns" where selected for
transposition
• The newly created ‘group’ variable was named “Statistic”
• The Transpose ID variable “Name” was selected
• A new CAS data set in the library PUBLIC was created containing the output.
Attempting to create the above output without SAS Viya action might have required multiple steps. In a world where promptly delivered results are highly valued, the ability to not have to manually transpose data, but also feed the output directly back into CAS is one of the handiest tools that a developer can have. Now all that is needed is a simple DATA step to make a new version of the Billy_Beane_Career_Stats data set and promote it in the CAS PUBLIC library:
proc datasets l ib=public; delete Billy_Bean_Baseball_Card; run;
DATA PUBLIC.Billy_Bean_Baseball_Card(promote=yes); set PUBLIC.Billy_Beane_Career_Stats; label _label_="Statistics"; run;
Thanks to the CAS Transpose Action and the DATA step PROMOTE option, the “Baseball Card” report can now be created:

11
Figure 11. Visual Analytics Report “Baseball Card Report” Built on CAS Data in TALL Format
VERIFY THAT BACK-END PROCESSES ARE WORKING Thus far, everything in this paper has focused on the ability to load CAS data, manipulate CAS data and capture output from CAS models for further analysis in Visual Analytics. However, ensuring that everything is running correctly in the SAS Viya environment is equally as important. The SAS Viya system comes with several features that can ensure that reporting data is always available and secure. This section covers useful CAS actions that can help to ensure that the SAS Viya environment is operating as expected. The examples below assume that a CAS session has been established.
CASLIB PERMISSIONS
One question that every SAS administrator has been asked is, “Who has access to that that data library?” In a SAS9 environment the answer to this question usually required bringing up the SAS Management Console and looking at permissions on a SAS Metadata library. This can be quite tedious, as there could be several metadata objects that the administrator would have to look through to find the exact library in question. SAS Viya completely simplifies the process of deciphering who has access to a particular CASLIB. The accessControl action set provides a simple, programmatic view into a CASLIB’s permissions. The example code below demonstrates how to display the various levels of access to the CASLIB ‘MODELS’:
proc cas; accessControl.listAcsData / caslib="MODELS" listType="direct"; run;
The returned output is displayed below:
Figure 12. Output from the accessControl.listAcsData CAS Action
From here it can be seen that only SAS Administrators have elevated privileges (CreateTable and DeleteSource) on the CASLIB ‘MODELS’. The SAS administrator is thereby able to quickly and accurately answer the question about CASLIB permissions by submitting only 4 lines of code in SAS Studio. This action can also be run by users who are not SAS Administrators.
USER GROUPS
When the output from the accessControl action is viewed, the next question is usually: “What groups is my user ID in?”. Fortunately, there is also a CAS action for quickly determining this. From the SAS Studio window, a user can enter the following:
proc cas;
12
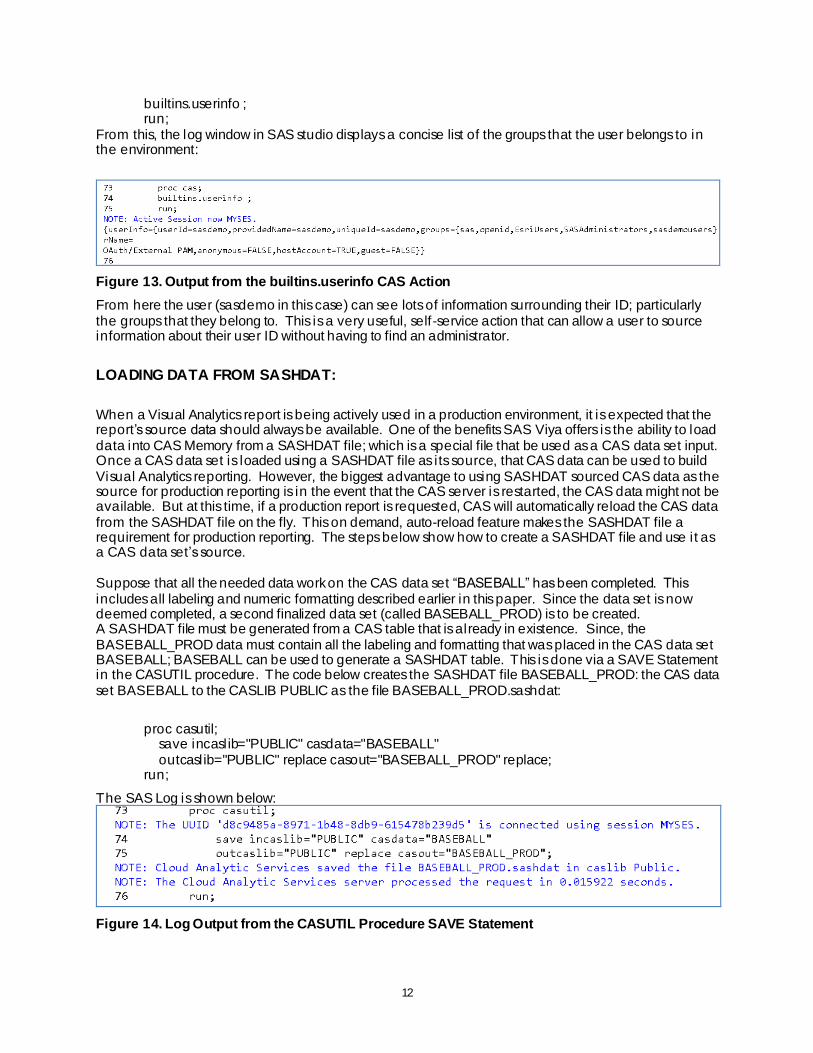
builtins.userinfo ; run;
From this, the log window in SAS studio displays a concise list of the groups that the user belongs to in the environment:
Figure 13. Output from the builtins.userinfo CAS Action
From here the user (sasdemo in this case) can see lots of information surrounding their ID; particularly the groups that they belong to. This is a very useful, self-service action that can allow a user to source information about their user ID without having to find an administrator.
LOADING DATA FROM SASHDAT:
When a Visual Analytics report is being actively used in a production environment, it is expected that the report’s source data should always be available. One of the benefits SAS Viya offers is the ability to load data into CAS Memory from a SASHDAT file; which is a special file that be used as a CAS data set input. Once a CAS data set is loaded using a SASHDAT file as its source, that CAS data can be used to build Visual Analytics reporting. However, the biggest advantage to using SASHDAT sourced CAS data as the source for production reporting is in the event that the CAS server is restarted, the CAS data might not be available. But at this time, if a production report is requested, CAS will automatically reload the CAS data from the SASHDAT file on the fly. This on demand, auto-reload feature makes the SASHDAT file a requirement for production reporting. The steps below show how to create a SASHDAT file and use it as a CAS data set’s source. Suppose that all the needed data work on the CAS data set “BASEBALL” has been completed. This includes all labeling and numeric formatting described earlier in this paper. Since the data set is now deemed completed, a second finalized data set (called BASEBALL_PROD) is to be created. A SASHDAT file must be generated from a CAS table that is already in existence. Since, the BASEBALL_PROD data must contain all the labeling and formatting that was placed in the CAS data set BASEBALL; BASEBALL can be used to generate a SASHDAT table. This is done via a SAVE Statement in the CASUTIL procedure. The code below creates the SASHDAT file BASEBALL_PROD: the CAS data set BASEBALL to the CASLIB PUBLIC as the file BASEBALL_PROD.sashdat:
proc casutil; save incaslib="PUBLIC" casdata="BASEBALL" outcaslib="PUBLIC" replace casout="BASEBALL_PROD" replace; run;
The SAS Log is shown below:
Figure 14. Log Output from the CASUTIL Procedure SAVE Statement
13
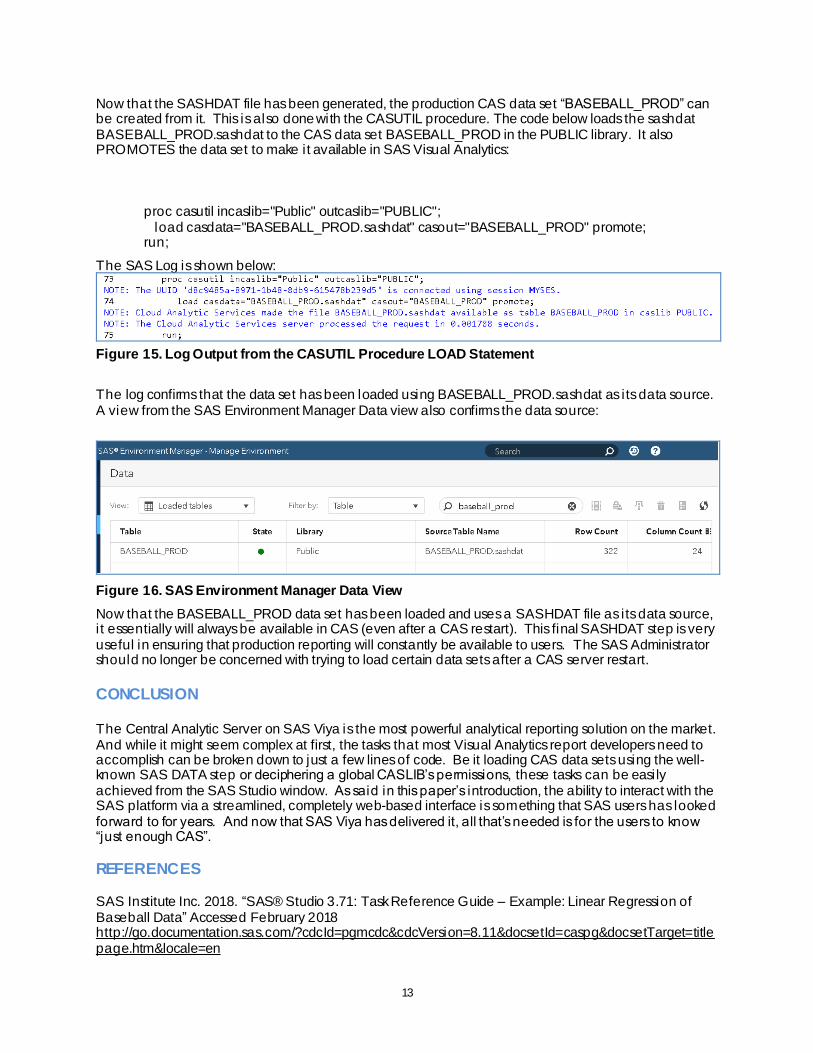
Now that the SASHDAT file has been generated, the production CAS data set “BASEBALL_PROD” can be created from it. This is also done with the CASUTIL procedure. The code below loads the sashdat BASEBALL_PROD.sashdat to the CAS data set BASEBALL_PROD in the PUBLIC library. It also PROMOTES the data set to make it available in SAS Visual Analytics:
proc casutil incaslib="Public" outcaslib="PUBLIC"; load casdata="BASEBALL_PROD.sashdat" casout="BASEBALL_PROD" promote; run;
The SAS Log is shown below:
Figure 15. Log Output from the CASUTIL Procedure LOAD Statement
The log confirms that the data set has been loaded using BASEBALL_PROD.sashdat as its data source. A view from the SAS Environment Manager Data view also confirms the data source:
Figure 16. SAS Environment Manager Data View
Now that the BASEBALL_PROD data set has been loaded and uses a SASHDAT file as its data source, i t essentially will always be available in CAS (even after a CAS restart). This final SASHDAT step is very useful in ensuring that production reporting will constantly be available to users. The SAS Administrator should no longer be concerned with trying to load certain data sets after a CAS server restart.
CONCLUSION The Central Analytic Server on SAS Viya is the most powerful analytical reporting solution on the market. And while it might seem complex at first, the tasks that most Visual Analytics report developers need to accomplish can be broken down to just a few lines of code. Be it loading CAS data sets using the well-known SAS DATA step or deciphering a global CASLIB’s permissions, these tasks can be easily achieved from the SAS Studio window. As said in this paper’s introduction, the ability to interact with the SAS platform via a streamlined, completely web-based interface is something that SAS users has looked forward to for years. And now that SAS Viya has delivered it, all that’s needed is for the users to know “just enough CAS”.
REFERENCES
SAS Institute Inc. 2018. “SAS® Studio 3.71: Task Reference Guide – Example: Linear Regression of Baseball Data” Accessed February 2018 http://go.documentation.sas.com/?cdcId=pgmcdc&cdcVersion=8.11&docsetId=caspg&docsetTarget=titlepage.htm&locale=en

14
SAS Institute Inc. 2018 “SAS® Viya® Action Programming / “SAS Viya System Programming Guide” Accessed February 2018 http://go.documentation.sas.com/?cdcId=pgmcdc&cdcVersion=8.11&docsetId=caspg&docsetTarget=titlepage.htm&locale=en
CONTACT INFORMATION
Your comments and questions are valued and encouraged. Contact the author at:
Michael Drutar SAS Institute Inc. [email protected]
SAS and all other SAS Institute Inc. product or service names are registered trademarks or trademarks of SAS Institute Inc. in the USA and other countries. ® indicates USA registration.
Other brand and product names are trademarks of their respective companies.