june 2018 - keralaenergy.gov.in · major is standards for the pumps bureau of energy efficiency...
TRANSCRIPT
ENERGY EFFICIENCY STUDY OF AGRICULTURE PUMP
SETS IN THE STATE OF KERALA
June 2018
Energy Management Centre – Kerala
Dept of Power, Govt of Kerala. State Designated Agency
Sreekrishna Nagar, Sreekariyam P.O., Thiruvananthapuram – 695 017
Ph: 0471 - 2594922, 2594924, Fax: 0471 – 2594923 Email: [email protected]
ENERGY EFFICIENCY STUDY OF AGRICULTURE PUMP SETS IN THE STATE OF
KERALA
DETAILED PROJECT REPORT
Year: 2018
Conducted by
Energy Management Centre – Kerala
Dept. of Power, Govt of Kerala State Designated Agency of Bureau of Energy Efficiency,
Govt of India
Energy Audit Team
Kerala State Productivity Council
Productivity House, P.B No: 08, H.M.T Road, Kalamassery, Cochin - 683 104, Kerala, India Ph.: + 91 484 2555526, 2555367,
2532107 Email: [email protected]

Energy Management Centre Study of Agriculture Pump Sets in the State Kerala of Kerala-Detailed Project Report CONTENTS Page No.
TABLE OF CONTENTS
LIST OF TABLES
LIST OF DIAGRAM/ FIGURES
LIST OF ANNEXURES
LIST OF DATA SOURCES
LIST OF ABBREVIATIONS
EXECUTIVE SUMMARY
01
09
12
14
16
17
19
42
84
1. INTRODUCTION
2. ABOUT AGRICULTURE SECTOR
3. OBJECTIVE AND SCOPE OF STUDY
4. APPROACH AND METHODOLOGY
5. CHALLENGES FACED
6. ABOUT AGRICULTURE PUMPING SCHEME
7. AGRICULTURE PUMP DATA BASE
8. SURVEY AND EFFICIENCY EVALUATION
9. CARBON FOOTPRINT ANALYSIS
10. PROJECT PHASE
11. POLICY REVIEW
86
91

LIST OF FIGURES
Figure 1 Electricity Consumption by Sectors in India during 2016-17 ......................... 3
Figure 2 Power Consumption Pattern of the Kerala state .............................................. 7
Figure 3 Power Consumption Pattern ............................................................................. 7
Figure 4 Projected Power Consumption ......................................................................... 8
Figure 5 Agricultural pump distribution district wise .................................................. 22
Figure 6 Pump Classification based on phase .............................................................. 23
Figure 7 Classification of Pump Population ................................................................. 23
Figure 8 Template of the survey format ....................................................................... 50
Figure 9 Relationship between Overall efficiency & Specific Power Consumption ... 69
Figure 10 Rated Overall Efficiency of existing pumps ................................................ 71
Figure 11 Sizing of the pipelines for Existing Pumps .................................................. 72
Figure 12 Rewinding Motors of existing Pump sets .................................................... 73
Figure 13 Pipe Type for Existing pump sets ................................................................ 74
Figure 14 Variation of efficiency with respect to water table ...................................... 76
Figure 15Ageing of existing pump sets ........................................................................ 77
Figure 16 Consumption pattern of the different rated pumps ...................................... 84
Figure 17 Savings in Energy Consumption .................................................................. 89
Energy Management Centre Kerala Study of Agriculture Pump Sets in the State of Kerala-Detailed Project Report

LIST OF TABLES
Table 1 KSEBL charge ................................................................................................. 20
Table 2 List of agricultural pump population ............................................................... 21
Table 3 Pump Classification ......................................................................................... 24
Table 4 List of Consumer for the Survey ..................................................................... 45
Table 5 Efficiency Evaluation of the Pumps ................................................................ 55
Table 6 Evaluation of Specific Power Consumption (kWh/m3) .................................. 66
Table 7 Pipeline Selection with Respect to Flow Requirement ................................... 75
Table 8 Estimated Annual Energy Savings .................................................................. 78
Table 9 Analysis of CO2 Emission ............................................................................... 86
Table 10 Reduction in CO2 Emission ........................................................................... 87
Energy Management Centre Kerala Study of Agriculture Pump Sets in the State of Kerala-Detailed Project Report

Energy Management Centre Study of Agriculture Pump Sets in the State Kerala of Kerala-Detailed Project Report LIST OF APPENDIX
Appendix no-1:
Appendix no-2:
Appendix no-3:
Appendix no-4:
Appendix no-5:
Appendix no-6:
Details of Pump Population
Overview of Study conducted- Photographs
Major IS standards for the pumps
Bureau of energy efficiency star labelled scheme
List of BEE Star Labelled major Manufactures-Mono set pumps
List of BEE Star Labelled major Manufactures-Open Well Submersible
Energy Management Centre Study of Agriculture Pump Sets in the State Kerala of Kerala-Detailed Project Report LIST OF DATA SOURCE
1. Bureau of Energy Efficiency (BEE), Ministry of Power, Govt. of India.
2. Energy Management Centre (EMC), Kerala.
3. Agriculture Department.
4. Irrigation Department.
5. State Corporations/ Municipalities.
6. Kerala State Electricity Board Limited (KSEBL).
7. Distribution Companies (DISCOMS).
8. Energy Service Companies (ESCOS).
9. All consumers where survey was conducted.

Energy Management Centre Study of Agriculture Pump Sets in the State Kerala of Kerala-Detailed Project Report ABBREVIATIONS USED
BEE : Bureau of Energy Efficiency
EMC : Energy Management Centre
KSEBL : Kerala State Electricity Board Limited
BCM : Billion Cubic Meter
GHGs : Green House Gases
UNIDO : United Nations Industrial Development Organization
DISCOMs : Distribution Companies
EESL : Energy Efficiency Services Limited
ESCOs : Energy Service Companies
HDPE : High Density Polyethylene
HVDS : High Voltage Distribution System
EEPS : Energy Efficiency Portfolio Standard
GI : Galvanized Iron
PVC : Polyvinyl Chloride
PPP : Public Private Partnership
MW : Mega Watt
KWH : Kilowatt Hour
MU : Million Units
BEP : Best Efficiency Point
Energy Management Centre Study of Agriculture Pump Sets in the State
Kerala of Kerala-Detailed Project Report
Page | i
EXECUTIVE SUMMARY
1. The study of agriculture pump sets in the state of Kerala to prepare a Detailed Project
Report (DPR) for replacement of in efficient pump sets to conserve energy was
undertaken by Kerala State Productivity Council (KSPC), during 2018 based on the
work order received from Energy Management Center-Kerala, under the Department
of Power.
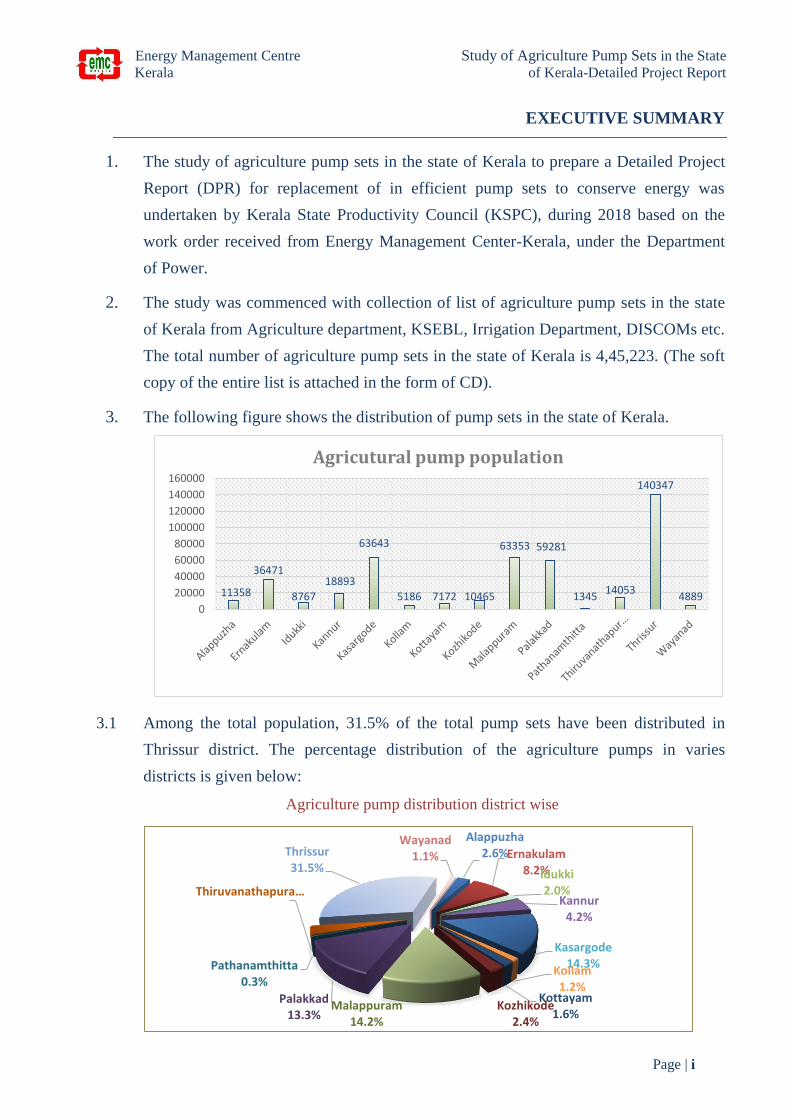
2. The study was commenced with collection of list of agriculture pump sets in the state
of Kerala from Agriculture department, KSEBL, Irrigation Department, DISCOMs etc.
The total number of agriculture pump sets in the state of Kerala is 4,45,223. (The soft
copy of the entire list is attached in the form of CD).
3. The following figure shows the distribution of pump sets in the state of Kerala.
3.1 Among the total population, 31.5% of the total pump sets have been distributed in
Thrissur district. The percentage distribution of the agriculture pumps in varies
districts is given below:
Agriculture pump distribution district wise
11358
36471
8767
18893
63643
5186 7172 10465
63353 59281
134514053
140347
48890
20000
40000
60000
80000
100000
120000
140000
160000
Agricutural pump population
Alappuzha2.6%Ernakulam
8.2%Idukki2.0%
Kannur4.2%
Kasargode14.3%
Kollam1.2%
Kottayam1.6%
Kozhikode2.4%
Malappuram14.2%
Palakkad13.3%
Pathanamthitta 0.3%
Thiruvanathapura…
Thrissur31.5%
Wayanad1.1%

Energy Management Centre Study of Agriculture Pump Sets in the State
Kerala of Kerala-Detailed Project Report
Page | ii
3.2 Of the total agriculture pump sets 66% were single phase and the 34 % were three
phase.
Classification of pumps based on Phase (Single/Three Phase)
3.3 The percentage distribution of various rated pumps in the state of Kerala is graphically
represented below: The 1.5 HP category pump dominates with a total number of
239303, which is 53.7% of the total agriculture pumps.
4. Representative samples of 150 pumps from all the districts of Kerala were identified
taking into consideration of type, make, size, age etc. (Please refer table 4 in the
chapter 8 of the detailed report for details). The geographical identification of pumps
covered under the sample study is given below:
66%
34%
Single Phase
Three Phase
below 1 hp, 1.2%
1 hp, 8.4%
1.5 hp, 53.7% 2 hp, 2.0%
3 hp to < 5 hp, 24.1%
5hp to < 10hp, 8.3%
10hp to < 20hp , 1.5%
20hp to < 30hp , 0.3%
30hp to < 50hp, 0.3%50hp to < 100hp,
0.2%
100hp to < 150hp,
0.0%
150hp to < 200hp,
0.0%
below 1 hp
1 hp
1.5 hp
2 hp
3 hp to < 5 hp
5hp to < 10hp
10hp to < 20hp
20hp to < 30hp
30hp to < 50hp
50hp to < 100hp
100hp to < 150hp
150hp to < 200hp

Energy Management Centre Study of Agriculture Pump Sets in the State
Kerala of Kerala-Detailed Project Report
Page | iii
5. Our team of engineers visited each of the pump installations identified for field survey
and measurements (refer Para no. 4). Power measurements, Water flow measurements,
piping layout, data collection etc. ( Please refer Appendix no. 3 for detailed data sheet
for each installation) were carried out to arrive at operating efficiency of each
installation(Please refer 8.3 in Chapter 8 for Overall approach & methodology used for
the study). Details of the pump efficiency evaluation of the 150 pumps were given in
para 8.12 of the detailed report.
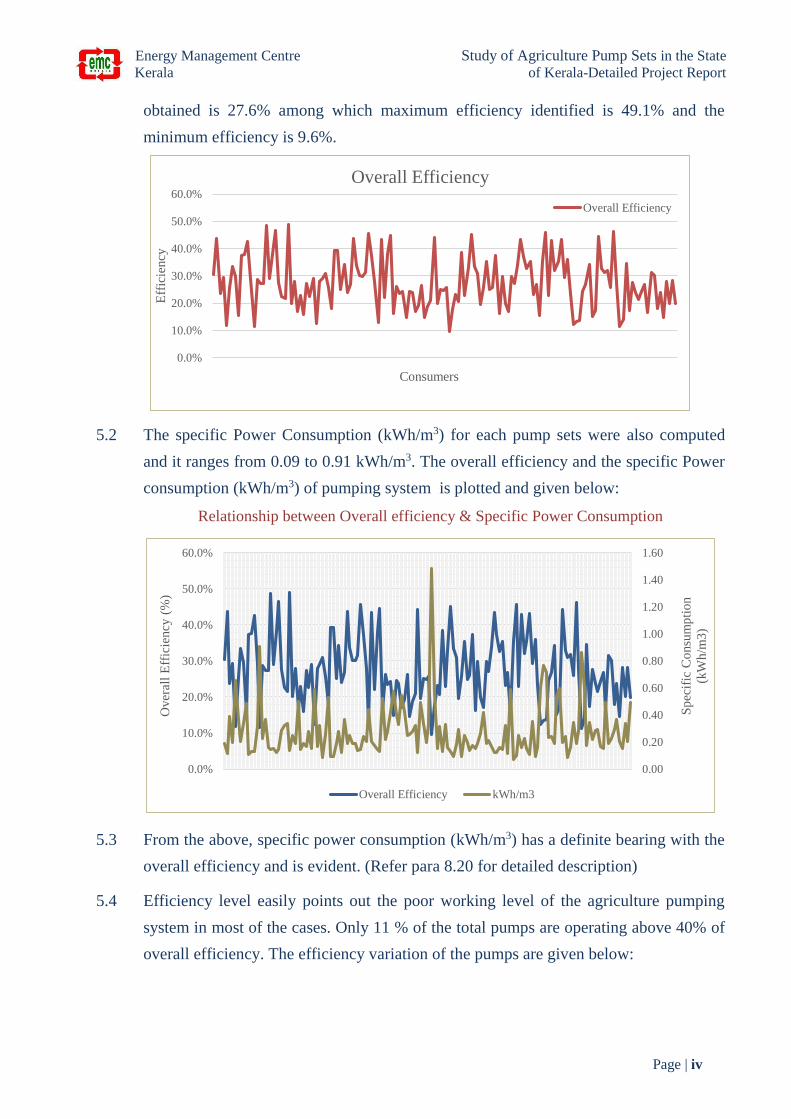
5.1 The efficiency variation of the 150 consumers are plotted graphically and given below:
From the efficiency evaluation of 150 sampled pumps, the average overall efficiency
Energy Management Centre Study of Agriculture Pump Sets in the State
Kerala of Kerala-Detailed Project Report
Page | iv
obtained is 27.6% among which maximum efficiency identified is 49.1% and the
minimum efficiency is 9.6%.
5.2 The specific Power Consumption (kWh/m3) for each pump sets were also computed
and it ranges from 0.09 to 0.91 kWh/m3. The overall efficiency and the specific Power
consumption (kWh/m3) of pumping system is plotted and given below:
Relationship between Overall efficiency & Specific Power Consumption
5.3 From the above, specific power consumption (kWh/m3) has a definite bearing with the
overall efficiency and is evident. (Refer para 8.20 for detailed description)
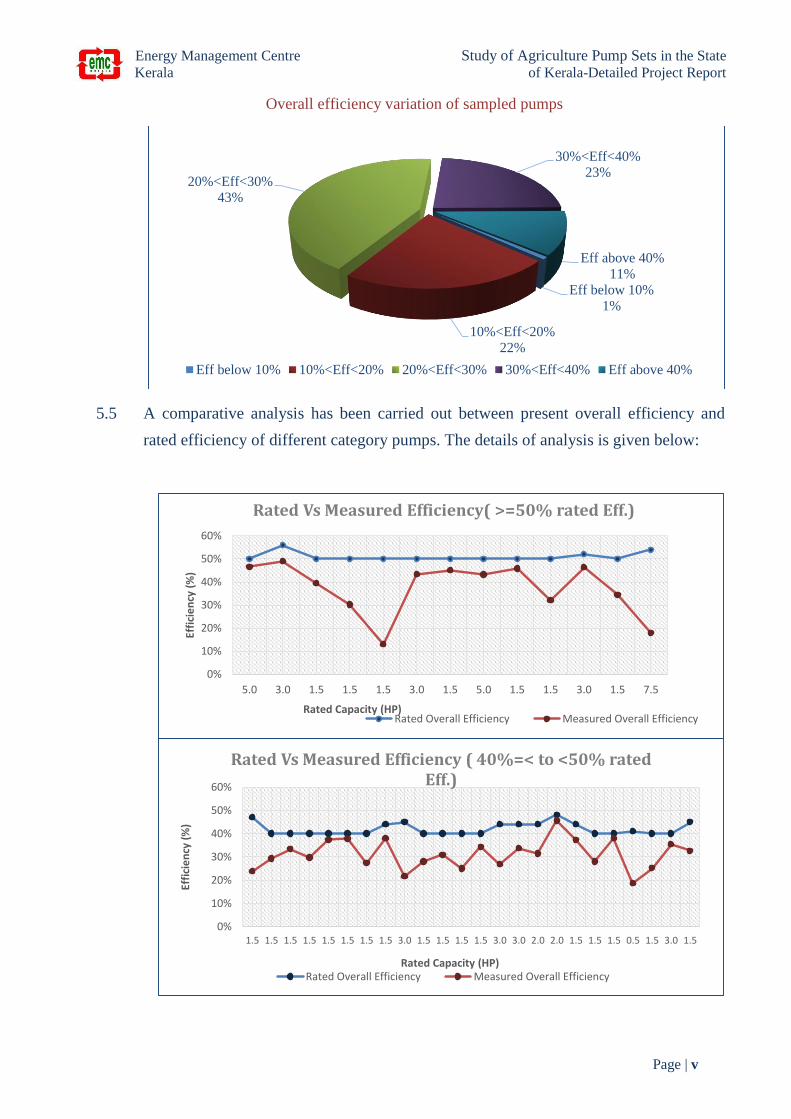
5.4 Efficiency level easily points out the poor working level of the agriculture pumping
system in most of the cases. Only 11 % of the total pumps are operating above 40% of
overall efficiency. The efficiency variation of the pumps are given below:
0.0%
10.0%
20.0%
30.0%
40.0%
50.0%
60.0%
Eff
icie
ncy
Consumers
Overall Efficiency
Overall Efficiency
0.00
0.20
0.40
0.60
0.80
1.00
1.20
1.40
1.60
0.0%
10.0%
20.0%
30.0%
40.0%
50.0%
60.0%
Sp
ecif
ic C
onsu
mp
tio
n
(kW
h/m
3)
Over
all
Eff
icie
ncy
(%
)
Overall Efficiency kWh/m3
Energy Management Centre Study of Agriculture Pump Sets in the State
Kerala of Kerala-Detailed Project Report
Page | v
Overall efficiency variation of sampled pumps
5.5 A comparative analysis has been carried out between present overall efficiency and
rated efficiency of different category pumps. The details of analysis is given below:
Eff below 10%
1%
10%<Eff<20%
22%
20%<Eff<30%
43%
30%<Eff<40%
23%
Eff above 40%
11%
Eff below 10% 10%<Eff<20% 20%<Eff<30% 30%<Eff<40% Eff above 40%
0%
10%
20%
30%
40%
50%
60%
5.0 3.0 1.5 1.5 1.5 3.0 1.5 5.0 1.5 1.5 3.0 1.5 7.5
Effi
cie
ncy
(%
)
Rated Capacity (HP)
Rated Vs Measured Efficiency( >=50% rated Eff.)
Rated Overall Efficiency Measured Overall Efficiency
0%
10%
20%
30%
40%
50%
60%
1.5 1.5 1.5 1.5 1.5 1.5 1.5 1.5 3.0 1.5 1.5 1.5 1.5 3.0 3.0 2.0 2.0 1.5 1.5 1.5 0.5 1.5 3.0 1.5
Effi
cie
ncy
(%
)
Rated Capacity (HP)
Rated Vs Measured Efficiency ( 40%=< to <50% rated Eff.)
Rated Overall Efficiency Measured Overall Efficiency

Energy Management Centre Study of Agriculture Pump Sets in the State
Kerala of Kerala-Detailed Project Report
Page | vi
5.6 The efficiency gap (difference between rated efficiency and actual efficiency) varies
from 0.6% to 37% as shown in the above graph. From the above analysis we can see
that, the higher overall efficiency achieved during the survey was only for pumps with
higher rated efficiency and it is also observed that some pumps with high overall
efficiency are operating with lesser operating efficiency.
5.7 The energy consumption pattern of the various capacity pumps are also analysed
during the study by taking the average energy consumption from the electricity bill on
random basis and the percentage energy consumption distribution of each category
pump is given below:
Percentage Share of consumption of varies category pumps
5.8 The category of pumps belongs to 5 hp to < 10 hp pumps have high energy
consumption which accounts 39.3% of the total energy consumption. The average
efficiency level of this category pumps identified is only 27.5%.
0%
5%
10%
15%
20%
25%
30%
35%
40%
1.0 1.5 0.5 1.0 1.0 1.0 1.5 1.0 1.0 0.5 1.0 1.0 1.0 5.0 0.5 1.5 1.0 1.5
Effi
cie
ncy
(%
)
Rated Capacity (HP)
Rated Vs Measured Efficiency (<40% rated Eff.)
Rated Overall Efficiency Measured Overall Efficiency
below 1 hp, 0.4%
1 hp, 1.2%1.5 hp, 20.5%
2 hp, 0.9%
3 hp to < 5 hp, 9.6%
5hp to < 10hp, 39.6%
10hp to < 20hp , 4.6%
20hp to < 30hp , 5.0%
30hp to < 50hp, 9.8%
50hp to < 100hp,
7.0%
100hp to < 150hp,
1.3% 150hp to < 200hp,
0.1%
below 1 hp
1 hp
1.5 hp
2 hp
3 hp to < 5 hp
5hp to < 10hp
10hp to < 20hp
20hp to < 30hp
30hp to < 50hp
50hp to < 100hp
100hp to < 150hp
150hp to < 200hp

Energy Management Centre Study of Agriculture Pump Sets in the State
Kerala of Kerala-Detailed Project Report
Page | vii
6. Key Factors effecting the overall energy efficiency of agriculture pumps
Actual Pump set rating higher than name plate rating and sanctioned load
Mismatching pump and system Head-Flow characteristic
6.1 There are various parameters that could affect the pump set efficiency performance.
Parameters identified that could affect the pump performance are listed below and
discussed in detail in subsequent sections. Refer Para 8.22 for detailed description
Energy inefficient pump sets
Improper pump selection and usage
Undersized pipes
Suction head variations and large discharge lengths
Motor rewinding and low voltage profile
Water table variations
Other common causes
6.2 It is also observed that irrigation pumps of capacity ranging from 40kW to 150 kW are
operating in LT supply resulting reduced line voltage which will affect other domestic
consumers in the feeder, increased line current resulting higher energy losses and
reduced motor life due to high current drawn by the motor. So it is recommended to
operate the irrigation pumps through HT supply with the help of separate transformer
to have better operating condition.
6.3 The overall weighted average operating efficiency for existing pump sets is arrived at
27.6% based on Energy Efficiency Calculations done for 150 pumps. However, to be
on conservative side minimum overall efficiency of BEE 5 star labelled pumps
(150nos) and achievable overall efficiency (in field conditions) for different category
pumps considered for the up gradation is tabulated below:
Pump Category
Average Minimum
efficiency of measured
pumps (IS Std)
5 Star
Labelled
Minimum
efficiency
Minimum
Expected
Efficiency (in
field condition)
below 1 hp 23.9% 28.6% 20%
1 HP 27.6% 33.1% 25%
1.5 HP 37.8% 45.3% 35%
2 HP 38.5% 46.2% 35%
3 HP to < 5HP 44.3% 53.2% 40%
5hp to < 10 HP 50.9% 61.1% 40%
Energy Management Centre Study of Agriculture Pump Sets in the State
Kerala of Kerala-Detailed Project Report
Page | viii
6.4 The anticipated economic benefit achieved by improving the overall average operating
efficiency (field condition) of the present pumping system as per above table for the
150 pump sets is tabulated and given below:
Power Consumption of the 150 no. of pumps = 254.4 kW
Total Consumption of 150 no of pumps = 52776 kWh
Power Estimated at 35% overall efficiency = 199.8 kW
Savings in the power = 54.6 kW
Percentage Savings in Power = 21.5%
Estimated Consumption after improving the overall
efficiency = 36615 kWh
Total Estimated savings on consumption of 150 no of
pumps = 16161 kWh
Estimated percentage Savings = 30.6%
6.5 The energy saving potential is estimated only for improvement in the system efficiency
due to replacement of existing pump sets with energy efficient pump sets.
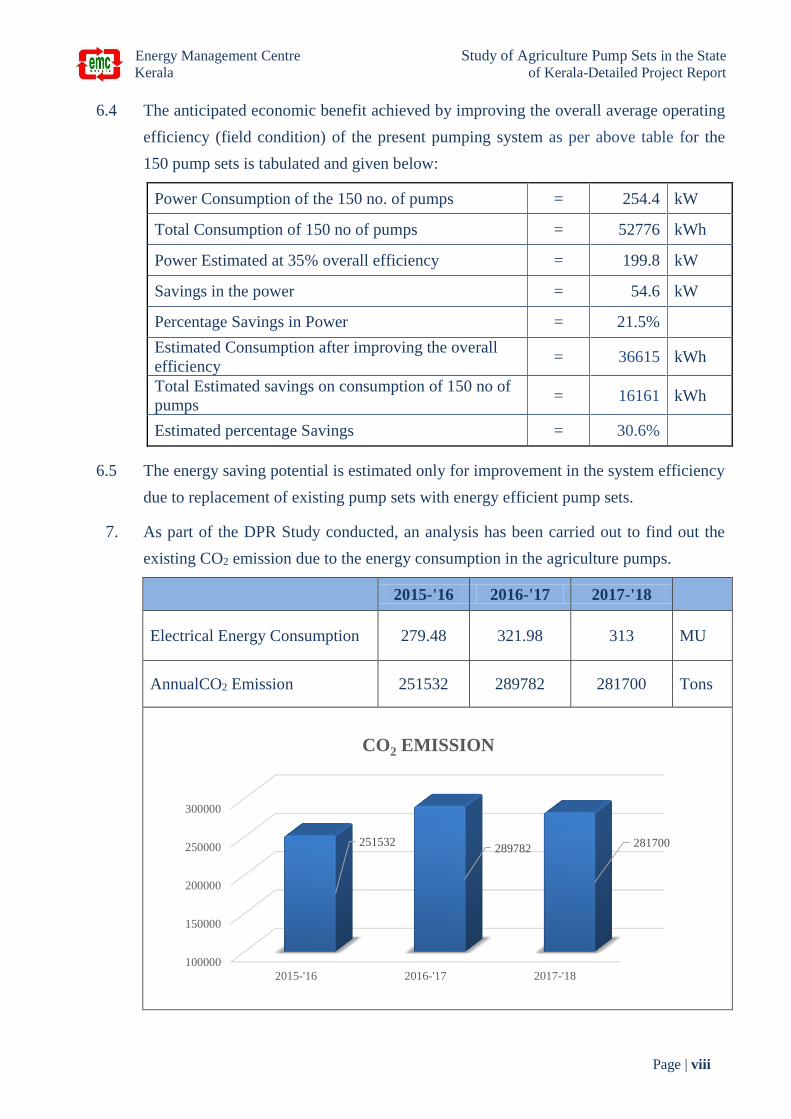
7. As part of the DPR Study conducted, an analysis has been carried out to find out the
existing CO2 emission due to the energy consumption in the agriculture pumps.
2015-'16 2016-'17 2017-'18
Electrical Energy Consumption 279.48 321.98 313 MU
AnnualCO2 Emission 251532 289782 281700 Tons
100000
150000
200000
250000
300000
2015-'16 2016-'17 2017-'18
251532289782
281700
CO2 EMISSION
Energy Management Centre Study of Agriculture Pump Sets in the State
Kerala of Kerala-Detailed Project Report
Page | ix
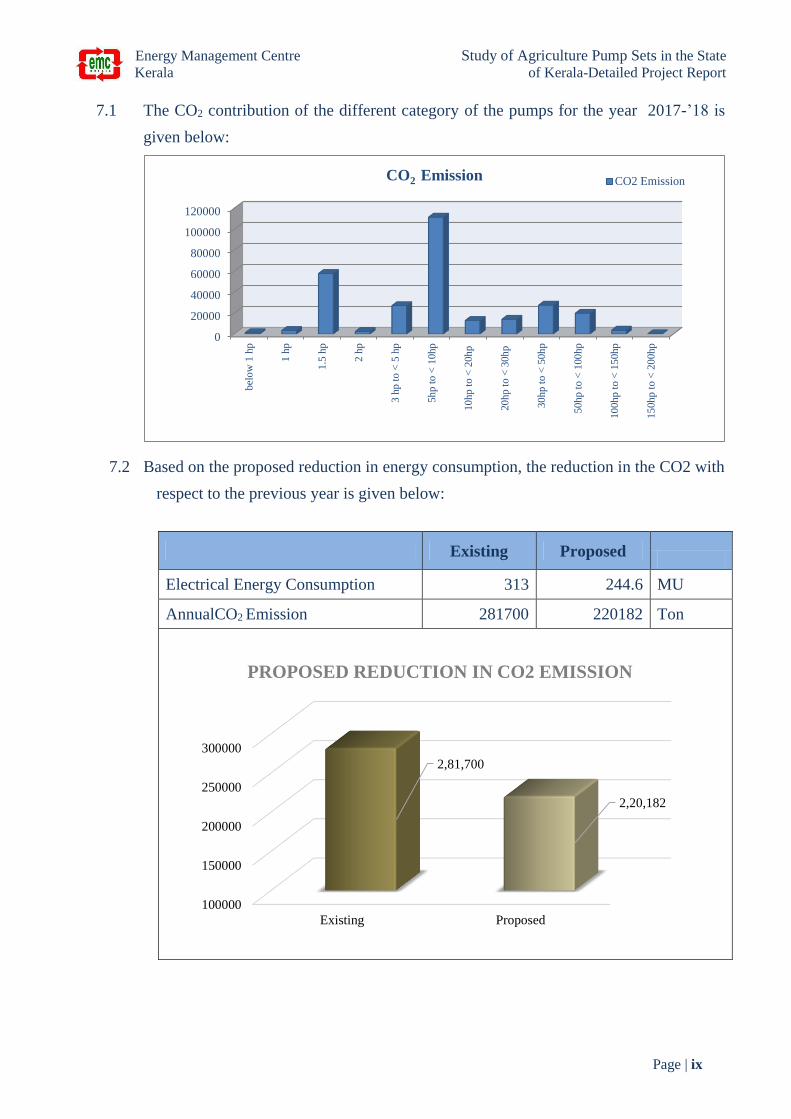
7.1 The CO2 contribution of the different category of the pumps for the year 2017-’18 is
given below:
7.2 Based on the proposed reduction in energy consumption, the reduction in the CO2 with
respect to the previous year is given below:
Existing Proposed
Electrical Energy Consumption 313 244.6 MU
AnnualCO2 Emission 281700 220182 Ton
0
20000
40000
60000
80000
100000
120000
bel
ow
1 h
p
1 h
p
1.5
hp
2 h
p
3 h
p t
o <
5 h
p
5h
p t
o <
10hp
10
hp t
o <
20h
p
20
hp t
o <
30h
p
30
hp t
o <
50h
p
50
hp t
o <
100
hp
10
0hp
to <
15
0hp
15
0hp
to <
20
0hp
CO2 Emission CO2 Emission
100000
150000
200000
250000
300000
Existing Proposed
2,81,700
2,20,182
PROPOSED REDUCTION IN CO2 EMISSION

Energy Management Centre Study of Agriculture Pump Sets in the State
Kerala of Kerala-Detailed Project Report
Page | x
8. The overall operating efficiency ranges from 9.1% to 49.1%and is because of the
mainly two reasons
Low rated efficiency of the pump sets
Inefficient Operating Conditions
8.1 Among the 4,45,223 agriculture pump sets in Kerala, 97.8% of total pumps is falling
under the category of below 10 hp capacity and its consumption is around 72.2% of the
total consumption.
8.2 The overall rated efficiency of 54.8% of sampled pumps of 150 Nos is only less than
40%. From the analysis it is estimated that the present average overall efficiency of
these pumps is only 23.3%.
8.3 The inferior quality pumps used in the sector is identified as one of the primary reasons
for the poor operating efficiency in agriculture pumping sector. The energy efficiency
improvement project in agriculture pumping system shall be implemented phase by
phase.
8.4 Phase -1 : Replacement of pump sets with overall rated efficiency less than 40%
with energy efficient pump sets
8.4.1 Based on the analysis carried out, a savings potential of about 68.4 MU per year has
been identified by the replacement existing local made & low rated overall efficiency
(below 40% efficiency) pumps falling under below 10 hp category. The detailed
analysis is given below:
Pump
Category
Total
No. of
pumps
Total No.
of pumps
below 40
% rated
overall
efficiency
Approx.
Cost per
Pump
Total Cost
of the
pumps
(lakhs)
Percentage
share of
Total Energy
Consumption
of the pumps
Total
Consumption
(MU)
Savings in
Energy
Consumption
by Pump
Replacement
@ 30.6%
Cost savings
(lakhs)
below 1 hp 5445 2984 4500 134.3 0.4% 1.3 0.40 8.0
1 hp 37546 20575 7500 1543.1 1.2% 3.8 1.18 23.6
1.5 hp 239303 131138 8500 11146.7 20.5% 64.1 19.64 392.8
3hp to < 5hp 107293 58797 13000 7643.6 9.6% 30.0 9.19 183.8
5hp to < 10hp 36781 20156 23000 4635.9 39.6% 123.9 37.94 758.8
Total 426368 233650
25103.6
68.35 1367.1
Energy Management Centre Study of Agriculture Pump Sets in the State
Kerala of Kerala-Detailed Project Report
Page | xi
8.5 Phase -2 : Efficiency improvement by matching the operating conditions with
pump characteristics
8.5.1 Based on the survey conducted it was found that the rated overall efficiency of around
45.2% of the total agricultural pump sets in Kerala is above 40% efficiency of which
most of the pumps are higher rated pumps but its present operating efficiency is only
27.6%. This lower operating efficiency of this pump is mainly due to the following
reasons. (Detailed explanation is given in the para.8.22 of detailed report)
Undersized pipes
Suction head variations and large discharge lengths
Motor rewinding and low voltage profile
Water table variations
8.5.2 Considering the above facts and higher rating of the pumps it would be feasible to
improve the operating efficiency of these pumps by improving the operational
condition rather going for pump replacement. This can be implemented by adopting
the following :
A proper study should be carried out focusing on matching the existing operating
point of pumps to the BEP by analyzing the flow, head, average water table on
different locations, layouts, capacity analysis etc.
The modification of the pipe layout maybe done to match the designed head-flow
of the existing pumps.
After the doing the above exercises and next phase study pumps operating with
lesser efficiency may be replaced with star labeled/energy efficient pumps as next
stage.
9. Business model for replacement of inefficient pump sets to conserve energy
9.1 The purpose of the exhaustive study on agricultural pumps across Kerala is to develop
an implementable Detailed Project Report for replacement of inefficient pump sets to
conserve energy.
9.2 To account the possible financing options, two different business models can be been
developed and categorized as ESCO Mode and DISCOM Mode as described chapter
10.

Energy Management Centre Study of Agriculture Pump Sets in the State
Kerala of Kerala-Detailed Project Report
Page | xii
9.3 Overall Project Cost: The total project cost estimated for the proposed project is about
Rs. 31505 Lakh
Particulars Value in (lakhs)
Cost of Energy Efficient Pump Sets (EEPS) (Rs.) 25103.6
Cost of dismantling existing pump sets and installing EEPS
(approx.10%)(Rs.) 2510.4
Contingencies (approx.3.5%) (Rs.) 878.6
Project Management Consultancy (approx.12%) (Rs.) 3012.4
Total project cost (Rs.) 31505.0
Estimated Annual Savings (Rs.) @ Rs. 2/kWh –LT-V Tariff 1367.1
Simple payback period (years) @ Rs. 2/kWh –LT-V Tariff 23.0
Estimated Annual Savings (Rs.) @ Rs. 6.2/kWh –Purchase Tariff 4237.9
Simple payback period (years) @ Rs. 6.2/kWh –Purchase Tariff 7.4
Demand Savings
Estimated annual Savings (MU) 68.35
Average annual pump operating days 250
Average daily pump operating hours (hrs) 2.75
Daily savings in energy consumption (kWh) 273413
Anticipated Demand Savings (MW) 100
Energy Management Centre Study of Agriculture Pump Sets in the State Kerala of Kerala-Detailed Project Report
Page | 1
1. INTRODUCTION
1.1 India’s primary energy consumption was 753.7 million tonnes oil equivalent in 2017,
which is about 5.6% of the world’s consumption and third highest after China and the
United States. Its energy consumption is projected to grow by 4.2% annually, faster
than all major economies in the world. Indian economy faces significant challenges
in meeting energy needs in the coming decades.
1.2 The Agriculture is the one of the most important sector of Indian Economy. There are
more than 20 million irrigation structures used in the India. That is four times the
number of irrigation structures in China, Iran, Mexico, Pakistan, and the United States
Combined.
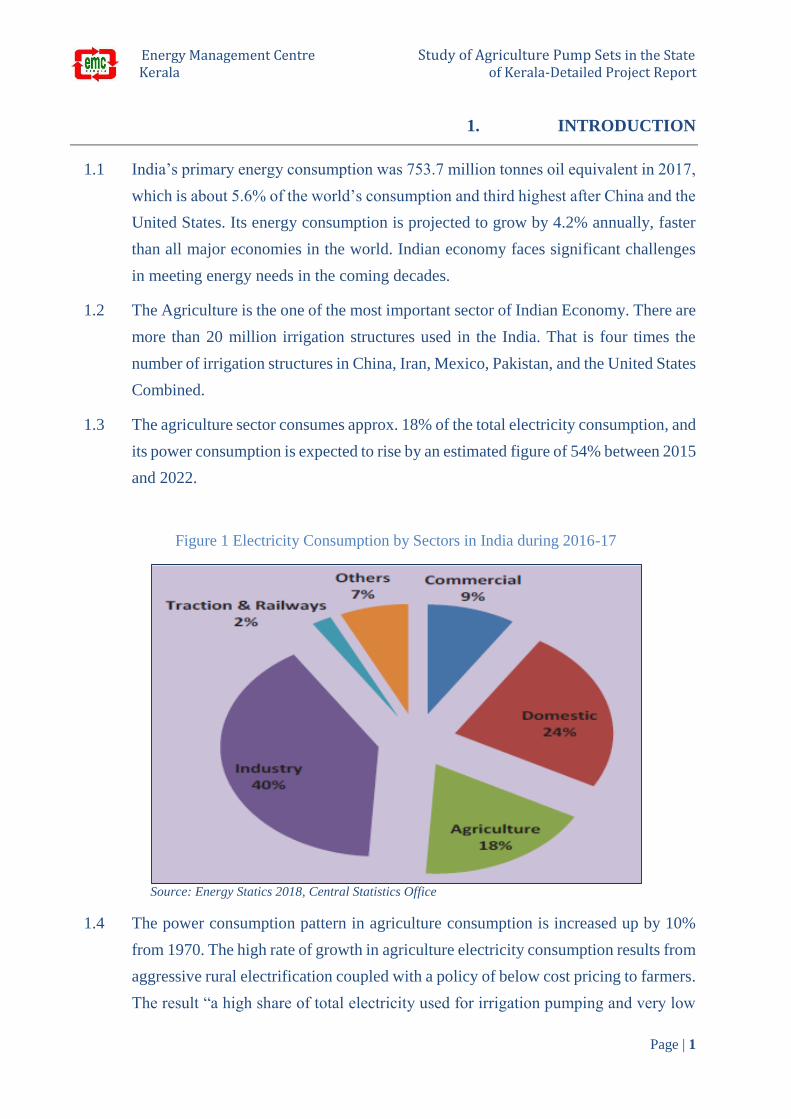
1.3 The agriculture sector consumes approx. 18% of the total electricity consumption, and
its power consumption is expected to rise by an estimated figure of 54% between 2015
and 2022.
Figure 1 Electricity Consumption by Sectors in India during 2016-17
Source: Energy Statics 2018, Central Statistics Office
1.4 The power consumption pattern in agriculture consumption is increased up by 10%
from 1970. The high rate of growth in agriculture electricity consumption results from
aggressive rural electrification coupled with a policy of below cost pricing to farmers.
The result “a high share of total electricity used for irrigation pumping and very low

Energy Management Centre Study of Agriculture Pump Sets in the State Kerala of Kerala-Detailed Project Report
Page | 2
revenue generation on agricultural sales” has created an increasingly unsustainable
situation. The inefficient power user in India provides immense opportunity to save
energy through better Demand Side Management techniques.
1.5 The problem is further compounded by the fact that out of the total water used in
India, 25 billion cubic meter (bcm) i.e. 83% goes for irrigation and of this amount half
comes from the exploitation of the ground water resources. This not only creates stress
on the water table but also is highly energy intensive. Energy intensity of pumping is
increasing further because of falling water table.
1.6 This has implication for the sustainable development and its impact on the persons
below the poverty line. This is because even today more than 60% of the work force
in India is employed in farming activity and almost 70-80% of the poor in the country
are either marginal farmers or the land-less laborers.
1.7 Besides the above, the inefficient water pumping in the agriculture sector also has its
impact on global warming and climate change. The inefficient pumps operation
results in higher power consumption resulting into higher GHG emission at the power
plants. In India, burning of coal in power plants emits nearly 50%of the total carbon
emissions. This has both global as well as local implications.
1.8 The irrigation pump sets used are generally very inefficient with operating efficiency
level of 30% or less is common. The pump sets are more often oversized so as to
pump more water from increasingly declining depths and also to withstand large
voltage fluctuations. The energy consumption is high mainly due to
a. Improper selection and installation,
b. Use of high-friction piping, and
c. Lack of proper maintenance.
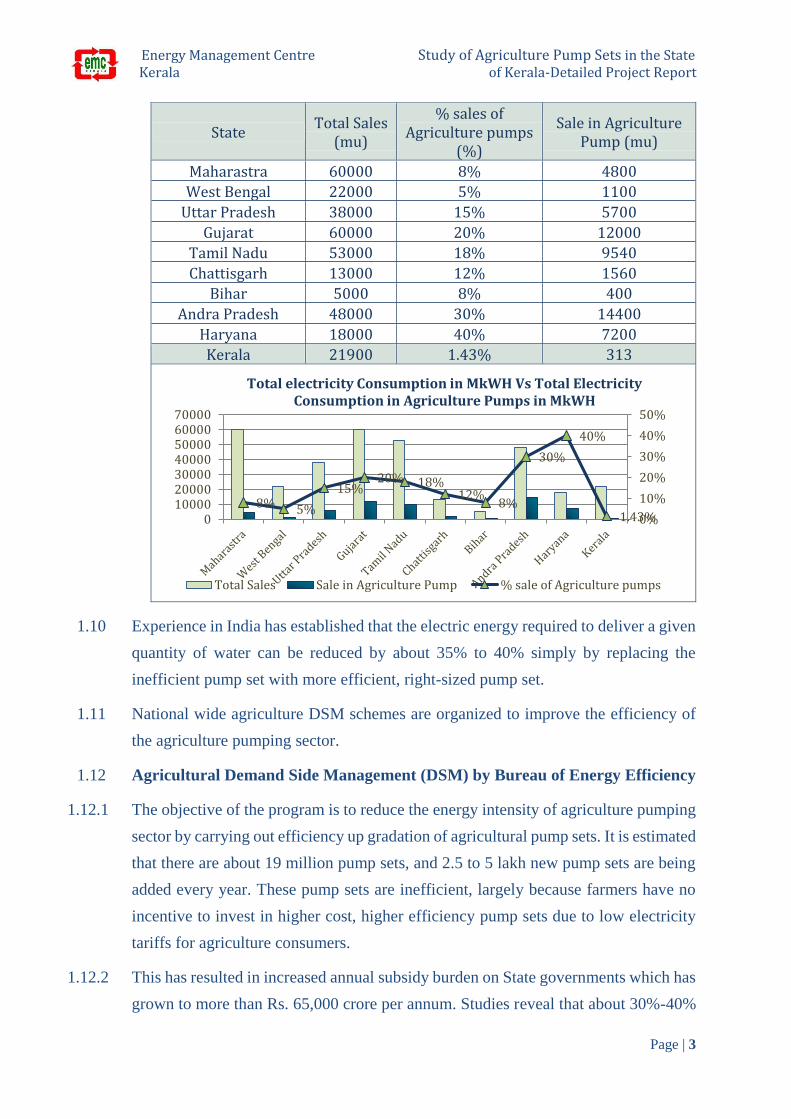
1.9 The electrical energy consumption of agriculture pump for various states in India were
analysed and is given below:
Energy Management Centre Study of Agriculture Pump Sets in the State Kerala of Kerala-Detailed Project Report
Page | 3
State Total Sales
(mu)
% sales of Agriculture pumps
(%)
Sale in Agriculture Pump (mu)
Maharastra 60000 8% 4800
West Bengal 22000 5% 1100
Uttar Pradesh 38000 15% 5700
Gujarat 60000 20% 12000
Tamil Nadu 53000 18% 9540
Chattisgarh 13000 12% 1560
Bihar 5000 8% 400
Andra Pradesh 48000 30% 14400
Haryana 18000 40% 7200
Kerala 21900 1.43% 313
1.10 Experience in India has established that the electric energy required to deliver a given
quantity of water can be reduced by about 35% to 40% simply by replacing the
inefficient pump set with more efficient, right-sized pump set.
1.11 National wide agriculture DSM schemes are organized to improve the efficiency of
the agriculture pumping sector.
1.12 Agricultural Demand Side Management (DSM) by Bureau of Energy Efficiency
1.12.1 The objective of the program is to reduce the energy intensity of agriculture pumping
sector by carrying out efficiency up gradation of agricultural pump sets. It is estimated
that there are about 19 million pump sets, and 2.5 to 5 lakh new pump sets are being
added every year. These pump sets are inefficient, largely because farmers have no
incentive to invest in higher cost, higher efficiency pump sets due to low electricity
tariffs for agriculture consumers.
1.12.2 This has resulted in increased annual subsidy burden on State governments which has
grown to more than Rs. 65,000 crore per annum. Studies reveal that about 30%-40%
8% 5%
15%20% 18%
12%8%
30%
40%
1.43%0%
10%
20%
30%
40%
50%
010000200003000040000500006000070000
Total electricity Consumption in MkWH Vs Total Electricity Consumption in Agriculture Pumps in MkWH
Total Sales Sale in Agriculture Pump % sale of Agriculture pumps

Energy Management Centre Study of Agriculture Pump Sets in the State Kerala of Kerala-Detailed Project Report
Page | 4
energy savings is possible in agriculture sector by adoption of Energy Efficient Star
Labelled Pump Sets
1.13 AgDSM programs by BEE
1.13.1 First AgDSM pilot project in Solapur, Maharstra:-The first pilot Ag-DSM project
is being implemented in Mangalwedha Sub-division of Solapur District in
Maharashtra. Under this project, total 2209 pumpsets is replaced with energy efficient
star rated pumpsets reflecting annual energy savings of 6.1 million units.
1.13.2 Pilot AgDSM project in HESCOM, Karnataka :-Replacement of old in-efficient
590 nos. of agriculture pumps with new star rated energy efficient pumps in phase
one in Nippani and Byadgi circles of HSECOM, has been completed successfully.
Energy savings of 37% has been achieved.
1.14 AgDSM programs by EESL
1.14.1 Replaced 1,337 pump sets in Mandya district under the Chamundeshwari Electricity
Supply Corporation Limited (CESC), Karnataka.
1.14.2 Currently, EESL is undertaken replacement of 2,496 pump sets at Rajanagaram
Mandal in the East Godavari district under the Eastern Power Distribution Company
of AP Limited, Andhra Pradesh.
1.15 Agriculture Pumping Scenario in Kerala
1.15.1 Kerala has electricity consumer strength of more than 1.19 Cr dominated by the
domestic sector, which accounts approximately 50.79% of the total energy
consumption. The Energy consumption pattern of Kerala state for the year 2017- 18
is given below:
Energy Management Centre Study of Agriculture Pump Sets in the State Kerala of Kerala-Detailed Project Report
Page | 5
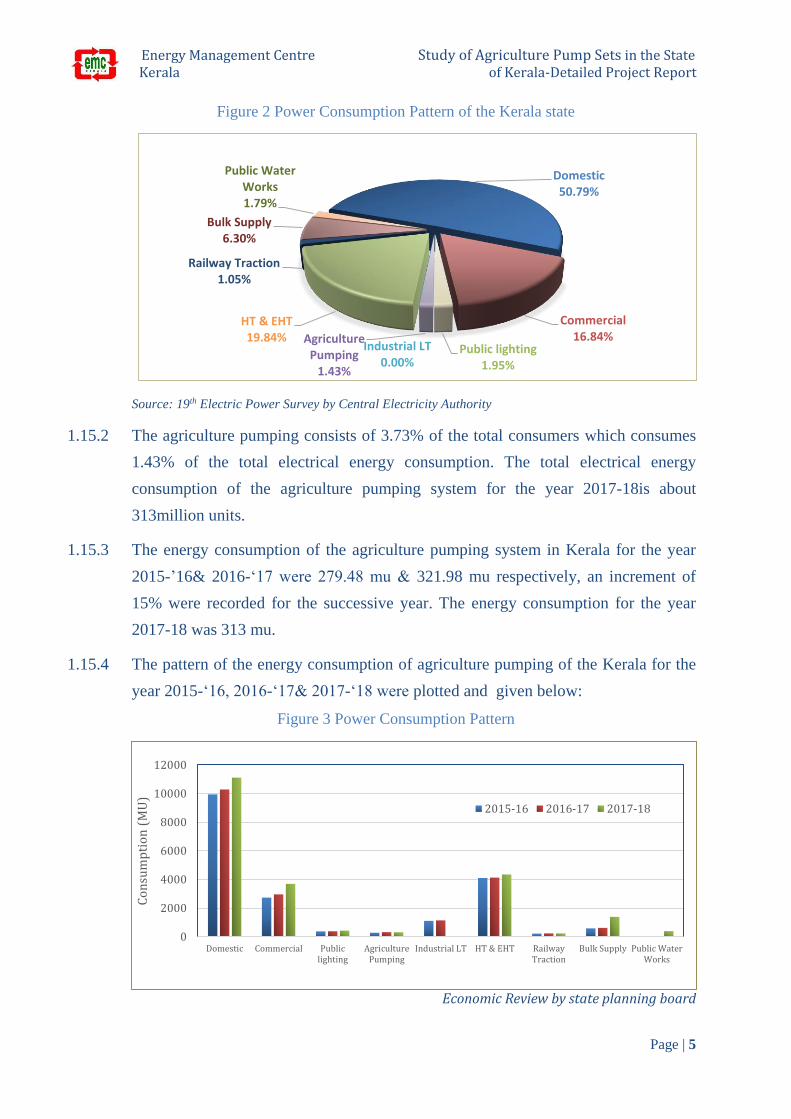
Figure 2 Power Consumption Pattern of the Kerala state
Source: 19th Electric Power Survey by Central Electricity Authority
1.15.2 The agriculture pumping consists of 3.73% of the total consumers which consumes
1.43% of the total electrical energy consumption. The total electrical energy
consumption of the agriculture pumping system for the year 2017-18is about
313million units.
1.15.3 The energy consumption of the agriculture pumping system in Kerala for the year
2015-’16& 2016-‘17 were 279.48 mu & 321.98 mu respectively, an increment of
15% were recorded for the successive year. The energy consumption for the year
2017-18 was 313 mu.
1.15.4 The pattern of the energy consumption of agriculture pumping of the Kerala for the
year 2015-‘16, 2016-‘17& 2017-‘18 were plotted and given below:
Figure 3 Power Consumption Pattern
Economic Review by state planning board
Domestic50.79%
Commercial16.84%
Public lighting1.95%
Agriculture Pumping
1.43%
Industrial LT0.00%
HT & EHT19.84%
Railway Traction1.05%
Bulk Supply6.30%
Public Water Works1.79%
0
2000
4000
6000
8000
10000
12000
Domestic Commercial Publiclighting
AgriculturePumping
Industrial LT HT & EHT RailwayTraction
Bulk Supply Public WaterWorks
Co
nsu
mp
tio
n (
MU
)
2015-16 2016-17 2017-18

Energy Management Centre Study of Agriculture Pump Sets in the State Kerala of Kerala-Detailed Project Report
Page | 6
1.15.5 Based on the 19th Electric Power Survey by Central Electricity Authority, the energy
consumption of the state for the next 10 years were projected for each particulars and
details were tabulated below:
Figure 4 Projected Power Consumption
Particulars 2017-18
(MU) 2020-21
(MU) 2023-24
(MU) 2026-27
(MU)
Increase over 2017-
18 (%)
Domestic 11,123 13,098 15,293 17,805 60
Commercial 3,689 4,497 5,399 6,414 74
Industrial 4,344 4,715 5,086 5,450 25
Agricultural Pumping 313 339 365 391 25
Bulk Supply 1,380 1,601 1,839 2,086 51
Public lighting 428 513 605 703 64
Public Water Works 392 437 484 534 36
Railway Traction 231 260 292 335 45
Total 21,900 25,460 29,363 33,718 54
Source: 19th Electric Power Survey by Central Electricity Authority
1.15.6 To enhance the productivity and productive capacity of the sector, the departments
have deployed various action plans, in which the farmers are directly beneficiary. The
schemes developed are to augment even the bottom most point of the sector.
1.15.7 The free electricity connection to the agriculture pumps is one of the revolutionary
plot among them. This scheme provides the farmers to have free electricity to the
agriculture pumps, which are owned to meet the water requirement for the irrigation
purpose.
1.16 Project Overview
1.16.1 The Energy Management Center-Kerala invited proposal for conducting a study of
agriculture pump sets in the state of Kerala so as to prepare an implementable Detailed
Project Report (DPR) for replacement of inefficient pump sets to conserve energy via
letter No, EMC/EED/17/04/SAgp dated 07/04/2018 & 18/04/2018.
Energy Management Centre Study of Agriculture Pump Sets in the State Kerala of Kerala-Detailed Project Report
Page | 7
1.16.2 Kerala State Productivity Council (KSPC), Kalamassery submitted their offer vide
letter No. KSPC/E-1/7000 dated 19th April 2018. EMC has awarded the work of
conducting the study of agriculture pump sets in the state of Kerala vide WO no.
EMC/EED/17/04/SAgp/WO dated 30th April 2018.
1.16.3 KSPC has commenced the above study in the month of June 2018 by collecting the
list of Agriculture Pump Sets falling under the above criteria from varies sources like
Agriculture department, KSEBL, Irrigation Department, DISCOMs etc.
1.17 Various types of measuring instruments were also used for carrying out necessary
onsite tests for evaluation of overall energy efficiency of agriculture pumps
Portable Load Manager (ALM 30, Krykard)
Portable Load Manager (ALM 31, Krykard)
Clamp on meter (MECO 4500)
Pressure Gauge
Ultrasonic Flow meter (UFM 6720)
1.18 About Energy Management Centre
1.18.1 Energy Management Centre (EMC) – Kerala under Department of Power,
Government of Kerala, is working towards attaining energy efficiency in all sectors
of economy. EMC is formulating and implementing energy conservation projects and
programmes. In compliance with the Energy Conservation Act - 2001, Government
of Kerala has designated EMC as the State Designated Agency (SDA) to enforce,
regulate and co-ordinate the activities of Energy Conservation Act in the State. Bureau
of Energy Efficiency (BEE), Ministry of Power, Government of India the
coordinating agency to implement the Act in the country has identified thrust areas
for reducing the energy consumption.
1.18.2 EMC is working very closely with Bureau of Energy Efficiency, Government of India
and all the stake holders in initiating and implementing energy efficiency measures in
the State. EMC has been bestowed with the best SDA Award in 2008, 2010, 2012,
2013 and 2014 by Government of India.
1.18.3 The Energy Management Centre, Kerala is also promoting Small Hydro Power
developments in the State. The United Nations Industrial Development Organization
(UNIDO) opened its first Regional Centre for Small Hydro Power is in Energy
Energy Management Centre Study of Agriculture Pump Sets in the State Kerala of Kerala-Detailed Project Report
Page | 8
Management Centre in April 2003. The SHP Cell of Department of Power,
Government of Kerala is also functioning in EMC.
1.19 About Kerala State Productivity Council
1.19.1 The Kerala State Productivity Council (KSPC) was established in 1959 as an
autonomous tripartite organization with representation from Government,
Management and Labor. The Council is affiliated to the National Productivity
Council, New Delhi and Asian Productivity Organization, Tokyo, Japan. The basic
mission of KSPC is to enhance productivity, through its promotion activities, in all
walks of human endeavor. It considers productivity as a grass-root, level movement
essential to nation building. The Council is now one of the premier productivity
organizations in the country for imparting Training in Productivity Techniques and
providing Consultancy Services.
1.19.2 KSPC is accredited energy audit firm with Bureau of Energy Efficiency (BEE),
Ministry of Power, Govt. of India and empanelled energy audit firm with Energy
Management Centre, Department of Power, Govt. of Kerala.

Energy Management Centre Study of Agriculture Pump Sets in the State Kerala of Kerala-Detailed Project Report
Page | 9
2. ABOUT AGRICULTURE SECTOR
2.1 The agricultural department Kerala was formed in 1908 May 27 as a visionary to
improve the production and productivity of the agricultural sector in Kerala. The state
structure was limited to the growth of agricultural land area, due to the rapid increase
in population density and tertiary sector. Department plays a vital role in the
improvement of the sector through various schemes and action plans.
2.2 This department deals with the formulation and implementation of various programs
to augment production of both food crops and cash crops in the State. It undertakes
activities among farmers to promote scientific methods of cultivation plant protection
etc. and also arranges the supply of high yielding varieties of seeds, seedlings,
planting materials and plant protection chemicals to farmers. The department also
formulates policies and programs relating to provision of credit to farmers.
Agricultural Research, Education and Extension are three important functions of the
department. It runs agricultural farms and also has an engineering wing.
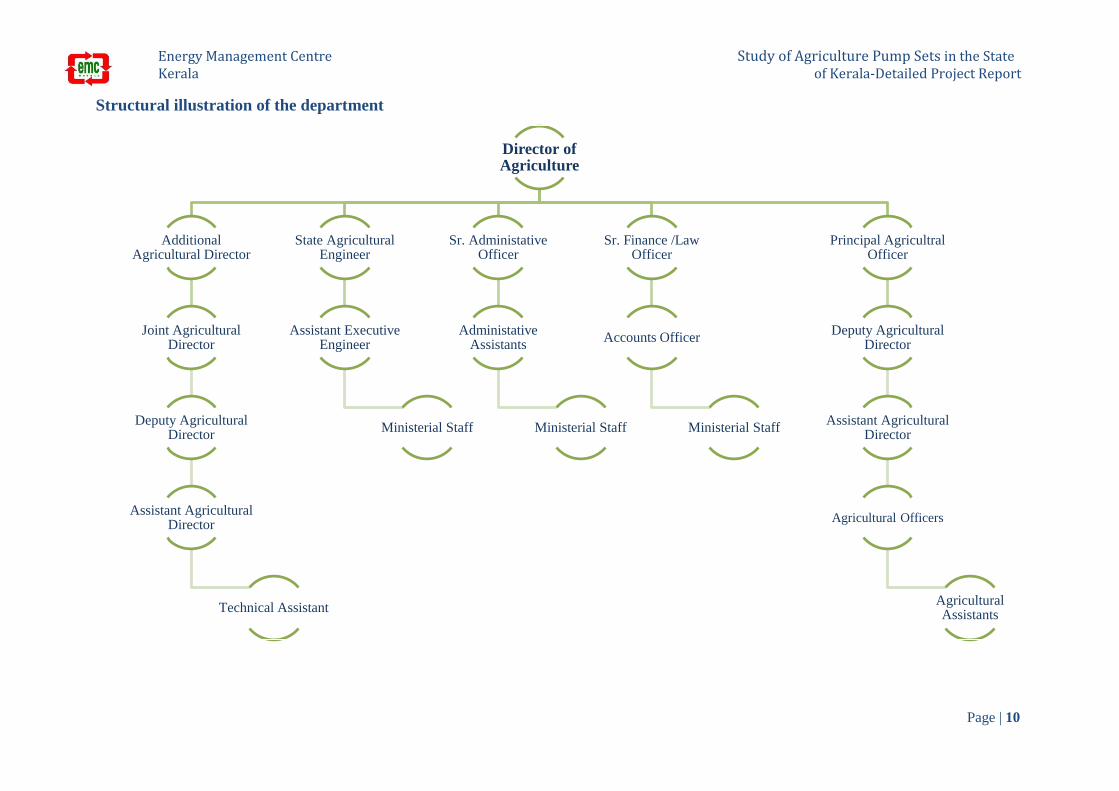
2.3 ORGANIZATION STRUCTURE
2.3.1 The Director of Agriculture is the head of the Department. The department has offices
at the regional, district and Panchayat levels. It has presence in all the village
panchayat through Krishi Bhavans. There is a directorate of soil conservation, which
has a soil conservation wing and soil survey wing. They undertake investigation
preparation, and execution of all the soil conservation work. Agriculture Production
Commissioner heads the Agriculture department and under him there is Secretary
Agriculture and Secretary Animal Husbandry and Dairy Development. There are
separate field departments for Animal Husbandry and Dairy Development
Energy Management Centre Study of Agriculture Pump Sets in the State Kerala of Kerala-Detailed Project Report
Page | 10
Structural illustration of the department
Director of Agriculture
Additional Agricultural Director
Joint Agricultural Director
Deputy Agricultural Director
Assistant Agricultural Director
Technical Assistant
State Agricultural Engineer
Assistant Executive Engineer
Ministerial Staff
Sr. Administative Officer
Administative Assistants
Ministerial Staff
Sr. Finance /Law Officer
Accounts Officer
Ministerial Staff
Principal Agricultral Officer
Deputy Agricultural Director
Assistant Agricultural Director
Agricultural Officers
Agricultural Assistants
Energy Management Centre Study of Agriculture Pump Sets in the State
Kerala of Kerala-Detailed Project Report
Page | 11
2.3.2 The Mechanizing activities of the agricultural sector are coordinating by the
agricultural engineers. There are two offices functioning throughout the state based on
the zone under the State Agricultural Engineer. The northern zone office is functioning
in Kozhikode and the Southern zone office is functioning in the Alappuzha.
2.3.3 The state level department activities are governed by the Principal Agricultural Officer
(Joint Director Rank). Central Government Schemes are coordinated by the Project
Directors.
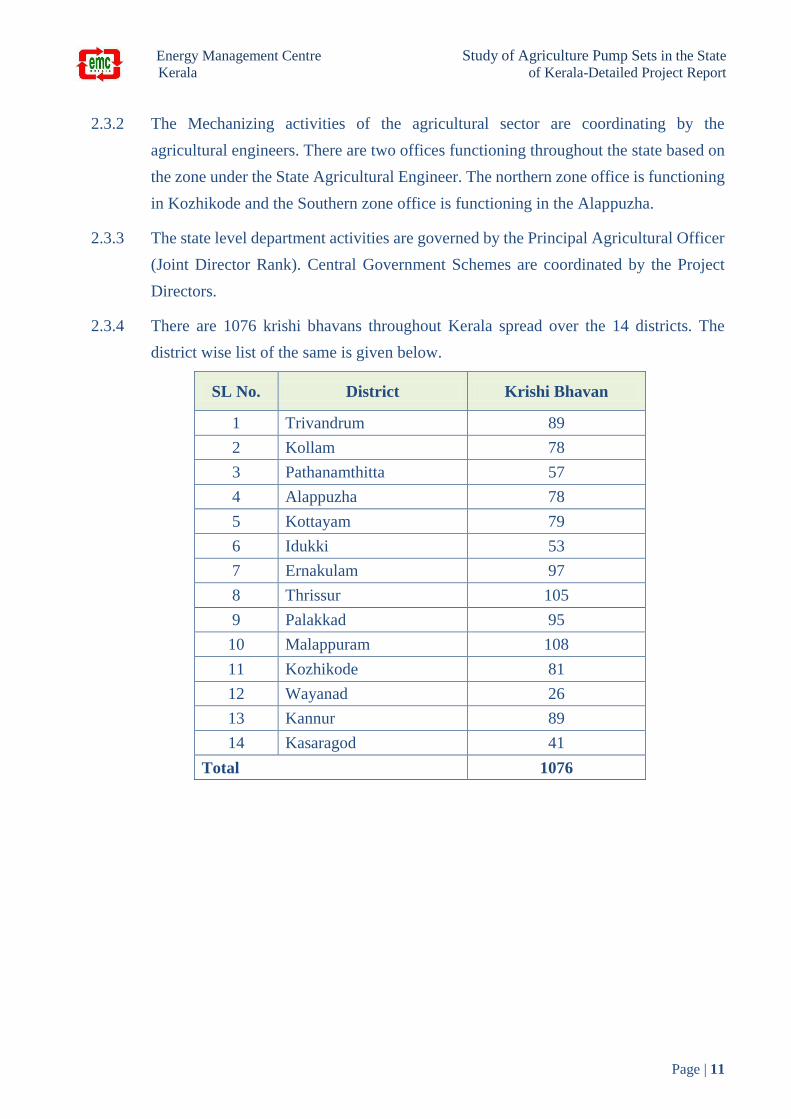
2.3.4 There are 1076 krishi bhavans throughout Kerala spread over the 14 districts. The
district wise list of the same is given below.
SL No. District Krishi Bhavan
1 Trivandrum 89
2 Kollam 78
3 Pathanamthitta 57
4 Alappuzha 78
5 Kottayam 79
6 Idukki 53
7 Ernakulam 97
8 Thrissur 105
9 Palakkad 95
10 Malappuram 108
11 Kozhikode 81
12 Wayanad 26
13 Kannur 89
14 Kasaragod 41
Total 1076
Energy Management Centre Study of Agriculture Pump Sets in the State
Kerala of Kerala-Detailed Project Report
Page | 12
3. OBJECTIVE & SCOPE OF THE STUDY
3.1 In agriculture sector, most of the irrigation pump-sets operate at poor efficiency. There
are many other parameters such as water table variation, irregular maintenance, poor
supply voltage, use of non-standard pumps, improper pump sizing etc., which could
affect the efficiency of the pump-sets.
3.2 The broad objective of this study is to study the impact of those external parameters on
overall average operating efficiency and to estimate the energy saving potential. The
study involves survey and measuring the present operating efficiency of sampled lot of
150 Nos of total agriculture pumps in Kerala.
3.3 The detailed objectives of this study are provided below,
Identifying operating efficiency of all the pumps considered in sample study.
Identify the major causes of low operating efficiency and recommend improvements /
better operating practices,
Study external parameters that could affect the efficiency and their impact on operating
efficiency,
Cost benefit analysis for various options for saved energy due to pump set replacement
3.4 Scope of Work
The detailed scope of work for the above study will be as follows
Listing out the population of agricultural pumping system in the State and preparation
of the data base with respect to age, type, size, make, rating, purpose, usage, water use,
energy consumption, geographic/spatial deployment etc.
Identify a representative sample of about 150 pumping system from the above data base
for detailed energy efficiency evaluation study.
Conduct the energy efficiency evaluation of the sampled lot of about 150 nos. of
pumping system. This included piping lay out, pipes and fillings, control, water
utilization and technical efficiency of motor-pump system.
List out projects for energy efficiency enhancement with techno economics analyses;
this shall include operation and maintenance activities, retrofit options, modifications,
and replacement options.

Energy Management Centre Study of Agriculture Pump Sets in the State
Kerala of Kerala-Detailed Project Report
Page | 13
Preparation of implementable Detailed Project Reports (DPRs) for replacement of
inefficient pump sets to conserve energy.
Project the State wise energy saving plan with saving potential and investment in the
State’s agricultural pumping system.
Review the existing policies, rules and regulations and suggest effective interventions
for energy efficiency enhancement of the State’s agricultural pumping system.
Energy Management Centre Study of Agriculture Pump Sets in the State
Kerala of Kerala-Detailed Project Report
Page | 14
4. APPROACH AND METHODOLOGY
4.1 The projects follow a basic methodology, which is structured for maximum efficiency
and flexibility. The study process follows a three pronged strategy of extracting data
from
Preliminary Stage.
Secondary Stage.
Tertiary Stage
4.2 Data collection methods involved multidisciplinary approach and integrated qualitative
and quantitative data collection and analysis such as surveys, focus group discussion,
key informant interviews, and secondary data collection.
4.3 Preliminary Stage
Various rounds of discussions (both personal and telephonic) were conducted with the
concerned officials at EMC, EESL, KSEBL, Agricultural Department(s), DISCOMs,
Irrigation Department and Pump Manufactures. Based on the inputs received from
these organizations, a questionnaire was prepared to collect the data regarding Pump
size, Capacity, Location, Age, Type etc. and a database to suit the defined functions of
the project has been created.
4.4 Secondary Stage
The secondary stage consists of identifying sample of about 150 pumping system from
the data base for detailed energy efficiency evaluation study.
A template was created to collect the data during field study of the selected agricultural
pumps for efficiency evaluation.
Carried out Field tests, trials and measurements of the 150 selected pumps to evaluate
the overall efficiency.
Interacted with pump OEMs/stakeholders and necessary information’s were collected
regarding energy efficiency in agricultural pumps.
Reviewed the rules and regulations related to the agriculture pumping system in Kerala
to enhance the energy efficiency in the sector.
Identified Energy efficiency and conservation measures with techno-economics
analysis.
Energy Management Centre Study of Agriculture Pump Sets in the State
Kerala of Kerala-Detailed Project Report
Page | 15
4.5 Tertiary Stage
Detailed discussions were held with the pump manufacturers/ESCOS/other agencies
and draft report has been prepared based on the comments/suggestions.
Presentation of the draft report with EMC/Power Department/ Other Concerned
Departments.
Preparation of the Final Report based on the feedback from the presentation of the draft
report and submission.
Energy Management Centre Study of Agriculture Pump Sets in the State
Kerala of Kerala-Detailed Project Report
Page | 16
5. CHALLENGES FACED
5.1 The data collection for this project activity was rather straightforward, requiring
interaction at state level with key governmental agencies (mainly State Electricity
board, Agricultural Department, Irrigation Department, DISCOMs &self-government).
The challenges faced in this data collection was the varying level of organization of the
data, lack of formal procedure for reporting, assimilating, archiving and sharing this
data, lack of ownership and responsibility for documentation of this data and generally
the limited understanding of the importance of this task in the context of larger national
opportunity for improving energy availability through more efficient utilization of the
same.
5.2 While the project team was able to overcome these challenges through sustained
interactions and support from Energy Management Centre, KSEBL, agricultural
Department, Irrigation Department, ESCOS, DISCOMs, local self-government etc.
5.3 As the agricultural consumers were less concerned about the importance of the context
of the study their approach towards the field study was not convivial.
5.4 The challenges faced in collection of the data present an opportunity in developing
normative procedures for comprehensive documentation, information management,
and analysis of data in a routine manner.
Energy Management Centre Study of Agriculture Pump Sets in the State
Kerala of Kerala-Detailed Project Report
Page | 17
6. ABOUT AGRICULTURE PUMPING SCHEME
6.1 The scheme is applicable for the farmers under the krishi bhavan limits who have
availed the agricultural electricity connection.
6.2 The agriculture electricity connection is applicable for the farmers under the krishi
bavan limit who have equipped with 25 Cents of agricultural land area, either a well or
pond, pump set and a pump house.
6.3 The famer should submit the application through a corresponded form along with the
land tax receipt to the krishi bhavan for both the agricultural electricity connection and
for the free electricity connection. There is no separate fee for the application.
6.4 The pump set can be selected by the applicant either with the aid of the krishi bhavans
or by themselves. krishi bhavans are providing directions to the farmers regarding the
choice. Pump set can be purchased directly through the manufactures or through some
subsidy schemes available by the department.
6.5 Meanwhile applicant will be constructing a pump house and acquire the building
number through corresponding principal bodies. The application consists of the pump
rating, land area, crop details and the pump house building no. and is submitted before
the agricultural officer along with the land tax receipt, in some cases the land area and
the pump house photos will also be enclosed along with the application.
6.6 Based on the site verification report agricultural officer will be issuing the certificate
to the applicant. Applicant should take necessary arrangement to have separate
agricultural electrical connection to the pump set through KSEB.
6.7 The certificate for the agricultural electricity connection should be issued by the
agricultural officer within 5 days.
6.8 The free connection is authorized by the assistant agricultural director and is forwarded
to the corresponding electrical section through the agricultural officer. Based on this
department will be paying the consumption amount to the KSEB
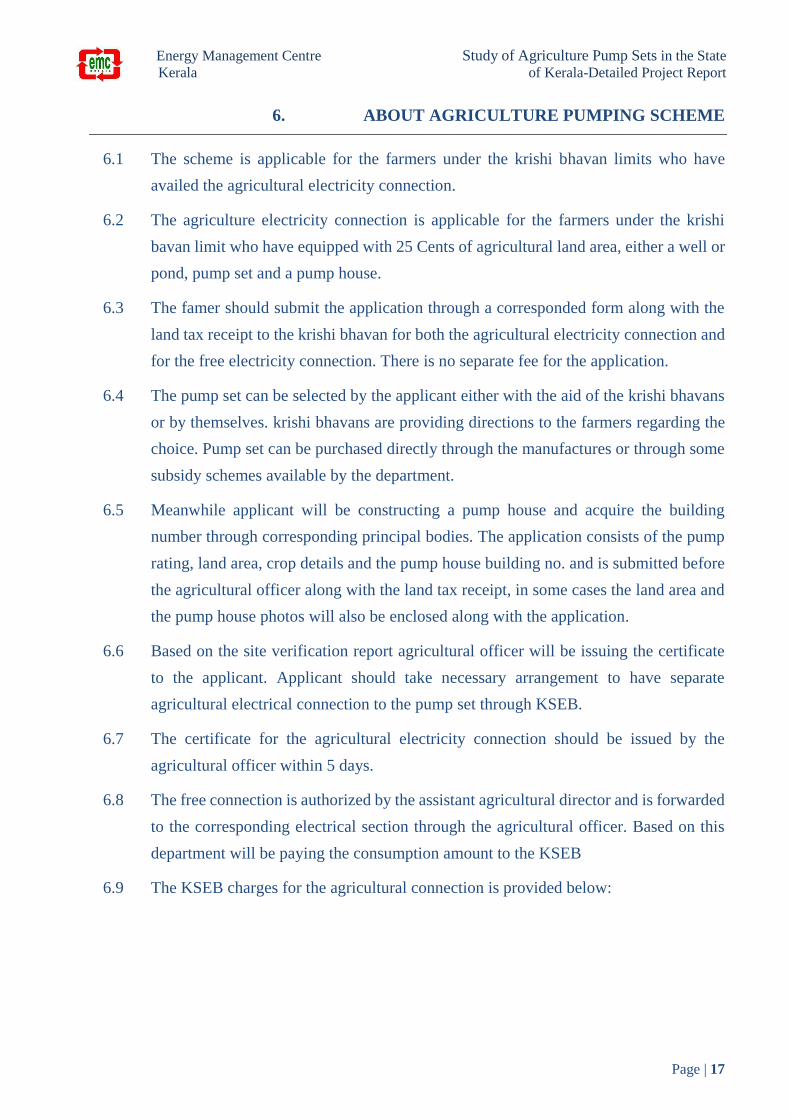
6.9 The KSEB charges for the agricultural connection is provided below:
Energy Management Centre Study of Agriculture Pump Sets in the State
Kerala of Kerala-Detailed Project Report
Page | 18
Table 1 KSEBL charge
SL
No. Tariff Structure Description
Rate
/Charge
1
LT- V -
AGRICULTURE
LT - V (A) Fixed charges (Rs / kW/ month) 8
2 Energy Charge (Rs/ kWh) 2
3 LT - V (B)
Fixed charges (Rs / kW/ month) 8
4 Energy Charge (Rs/ kWh) 2.5
6.10 The details recorded by the krishi bhavan about the applicant are summarized below.
Primary Information
Applicant Name
Address
Agricultural Details
Land details (area, Survey no. etc.)
Crop details (type area etc.)
The details recorded about the pump set
Motor Rating, Consumer no. Initial
consumption amount, KSEB Section
Energy Management Centre Study of Agriculture Pump Sets in the State
Kerala of Kerala-Detailed Project Report
Page | 19
7. AGRICULTURAL PUMP DATA BASE
7.1 As the population of the agriculture pump sets in the state was not readily available
from a single source, we contacted various agencies like Agricultural department,
KSEBL, Irrigation Department, DISCOMS etc. for the preparation of data base.
7.2 The total number of pumps with necessary details in each district/section offices
KSEBL was collected from KSEBL/Agricultural departments/Irrigation
Departments/DISCOMs with the help of questionnaire prepared with specific pump
information.
7.3 Intent meetings with department heads were also conducted to analyze the present
agriculture pumping scenario in the state. Also as part of study, the prominence of the
energy conservation was nourished to the people during the
discussions/meetings/survey.
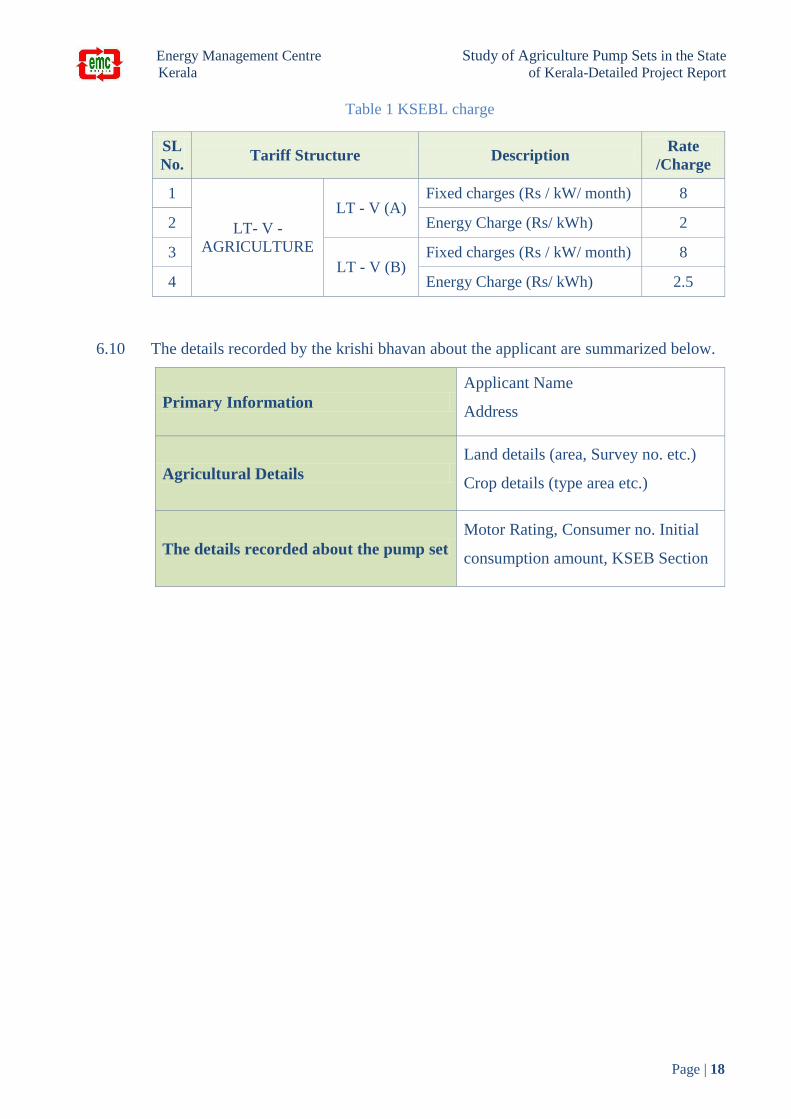
7.4 The list of agricultural pumping population in the state was summarized and the district
wise details of agriculture pumps is given below:
Table 2 List of agricultural pump population
SL
No. District
Single
Phase
Three
Phase
Total no. of
agriculture
Consumers
1 Alappuzha 9906 1452 11358
2 Ernakulam 16505 19966 36471
3 Idukki 5169 3598 8767
4 Kannur 15652 3241 18893
5 Kasargode 47510 16133 63643
6 Kollam 4590 596 5186
7 Kottayam 4183 2989 7172
8 Kozhikode 8751 1714 10465
9 Malappuram 53684 9669 63353
10 Palakkad 28677 30604 59281
11 Pathanamthitta 957 388 1345
12 Thiruvanathapuram 10590 3463 14053
13 Thrissur 85613 54734 140347
14 Wayanad 1433 3456 4889
TOTAL 293220 152003 445223
Energy Management Centre Study of Agriculture Pump Sets in the State
Kerala of Kerala-Detailed Project Report
Page | 20
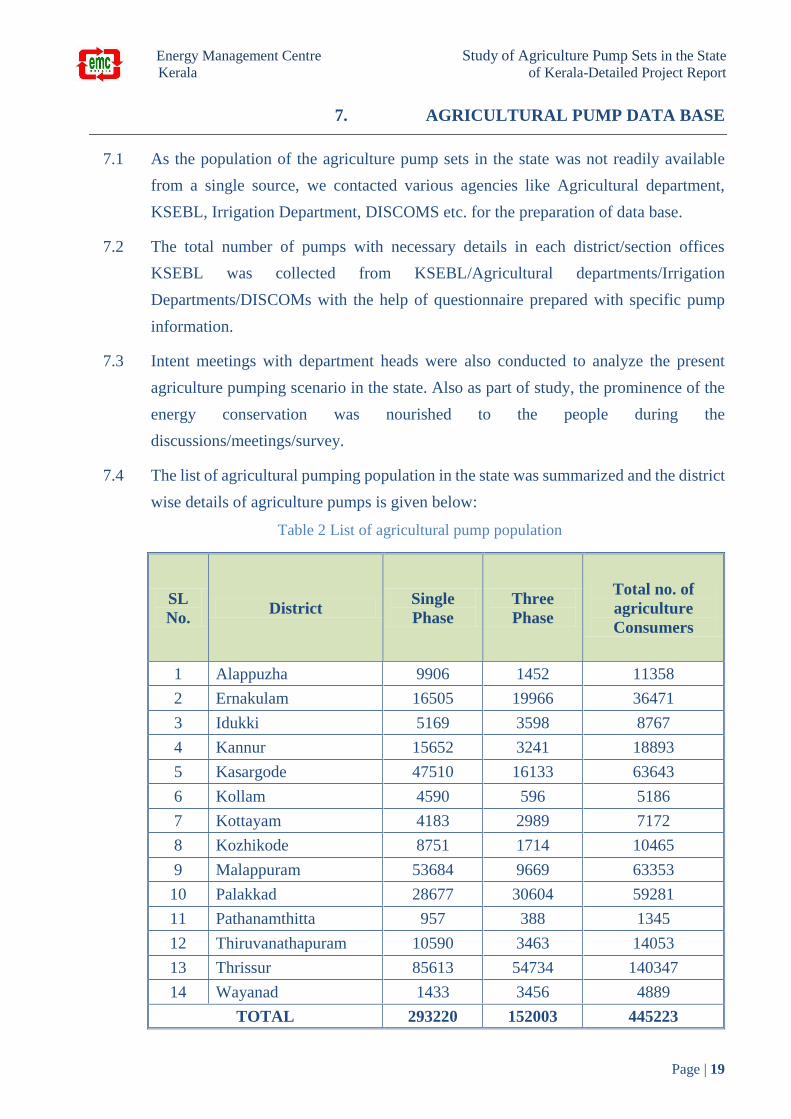
7.5 The details of the pump population is provided in the appendix no.1
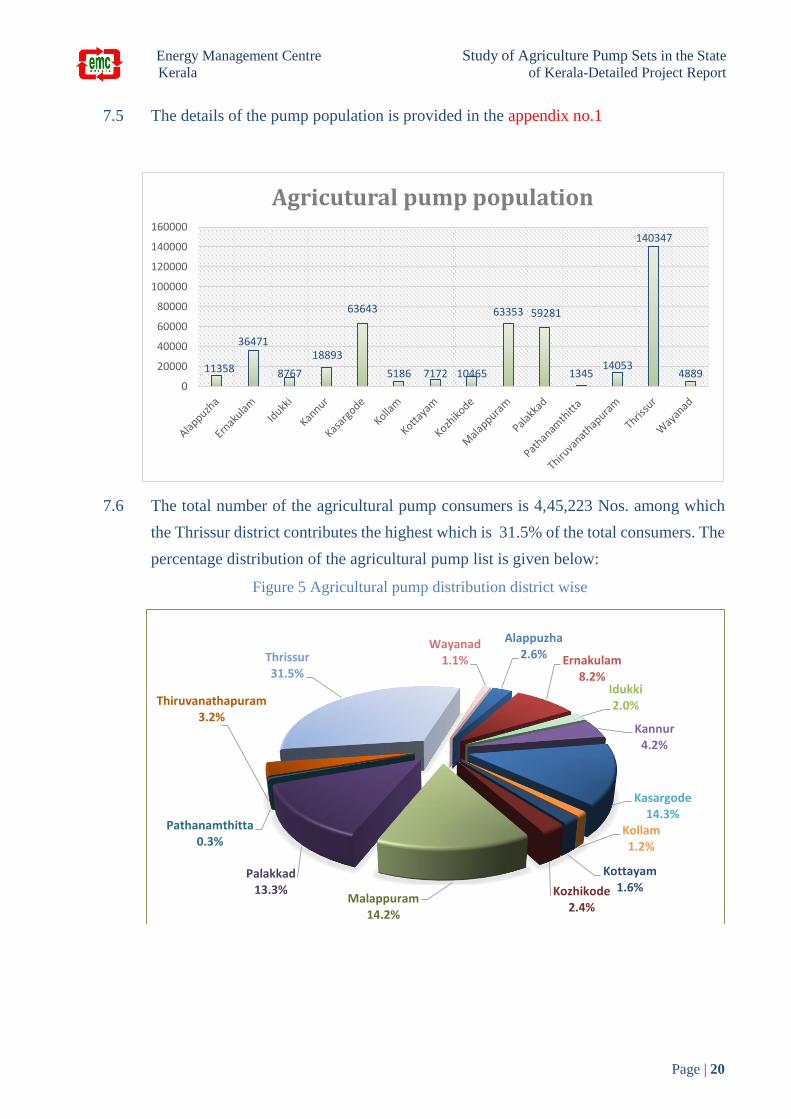
7.6 The total number of the agricultural pump consumers is 4,45,223 Nos. among which
the Thrissur district contributes the highest which is 31.5% of the total consumers. The
percentage distribution of the agricultural pump list is given below:
Figure 5 Agricultural pump distribution district wise
11358
36471
8767
18893
63643
5186 7172 10465
63353 59281
134514053
140347
48890
20000
40000
60000
80000
100000
120000
140000
160000
Agricutural pump population
Alappuzha2.6% Ernakulam
8.2%Idukki2.0%
Kannur4.2%
Kasargode14.3%
Kollam1.2%
Kottayam1.6%Kozhikode
2.4%Malappuram
14.2%
Palakkad13.3%
Pathanamthitta 0.3%
Thiruvanathapuram3.2%
Thrissur31.5%
Wayanad1.1%

Energy Management Centre Study of Agriculture Pump Sets in the State
Kerala of Kerala-Detailed Project Report
Page | 21
7.7 The above list can be classified by the single and three phase consumers. The 66% of
the total consumers were of single phase and the rest 34 % is three phase. The
contribution is given below:
Figure 6 Pump Classification based on phase
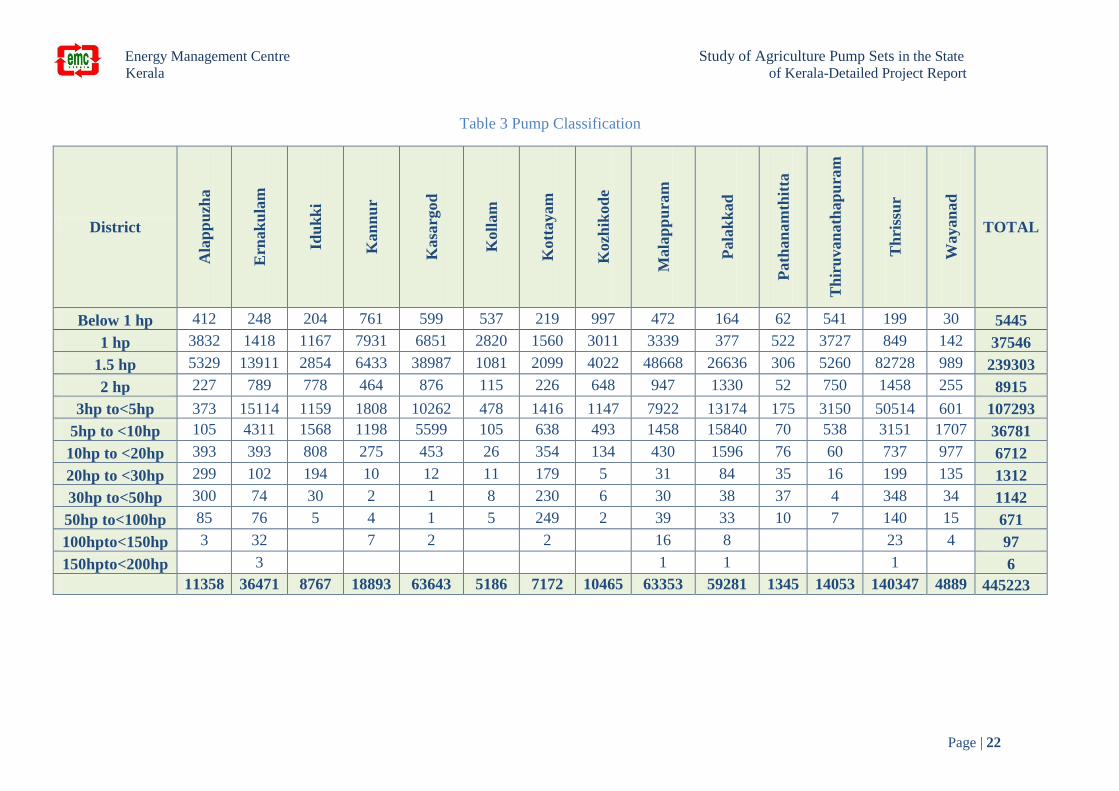
7.8 The agricultural pump population was categorized based on the pump capacity at
different districts and the details of which is given below:
Figure 7 Classification of Pump Population
66%
34%
Single Phase
Three Phase
below 1 hp, 1.2%
1 hp, 8.4%
1.5 hp, 53.7%2 hp, 2.0%
3 hp to < 5 hp, 24.1%
5hp to < 10hp, 8.3%
10hp to < 20hp , 1.5%
20hp to < 30hp , 0.3%
30hp to < 50hp, 0.3%50hp to < 100hp,
0.2%100hp to < 150hp,
0.0%
150hp to < 200hp,
0.0%
below 1 hp
1 hp
1.5 hp
2 hp
3 hp to < 5 hp
5hp to < 10hp
10hp to < 20hp
20hp to < 30hp
30hp to < 50hp
50hp to < 100hp
100hp to < 150hp
150hp to < 200hp
Energy Management Centre Study of Agriculture Pump Sets in the State
Kerala of Kerala-Detailed Project Report
Page | 22
Table 3 Pump Classification
District
Ala
pp
uzh
a
Ern
ak
ula
m
Idu
kk
i
Kan
nu
r
Kasa
rgod
Koll
am
Kott
ayam
Kozh
ikod
e
Mala
pp
ura
m
Pala
kk
ad
Path
an
am
thit
ta
Th
iru
van
ath
ap
ura
m
Th
riss
ur
Wayan
ad
TOTAL
Below 1 hp 412 248 204 761 599 537 219 997 472 164 62 541 199 30 5445
1 hp 3832 1418 1167 7931 6851 2820 1560 3011 3339 377 522 3727 849 142 37546
1.5 hp 5329 13911 2854 6433 38987 1081 2099 4022 48668 26636 306 5260 82728 989 239303
2 hp 227 789 778 464 876 115 226 648 947 1330 52 750 1458 255 8915
3hp to<5hp 373 15114 1159 1808 10262 478 1416 1147 7922 13174 175 3150 50514 601 107293
5hp to <10hp 105 4311 1568 1198 5599 105 638 493 1458 15840 70 538 3151 1707 36781
10hp to <20hp 393 393 808 275 453 26 354 134 430 1596 76 60 737 977 6712
20hp to <30hp 299 102 194 10 12 11 179 5 31 84 35 16 199 135 1312
30hp to<50hp 300 74 30 2 1 8 230 6 30 38 37 4 348 34 1142
50hp to<100hp 85 76 5 4 1 5 249 2 39 33 10 7 140 15 671
100hpto<150hp 3 32 7 2 2 16 8 23 4 97
150hpto<200hp 3 1 1 1 6
11358 36471 8767 18893 63643 5186 7172 10465 63353 59281 1345 14053 140347 4889 445223
Energy Management Centre Study of Agriculture Pump Sets in the State
Kerala of Kerala-Detailed Project Report
Page | 23
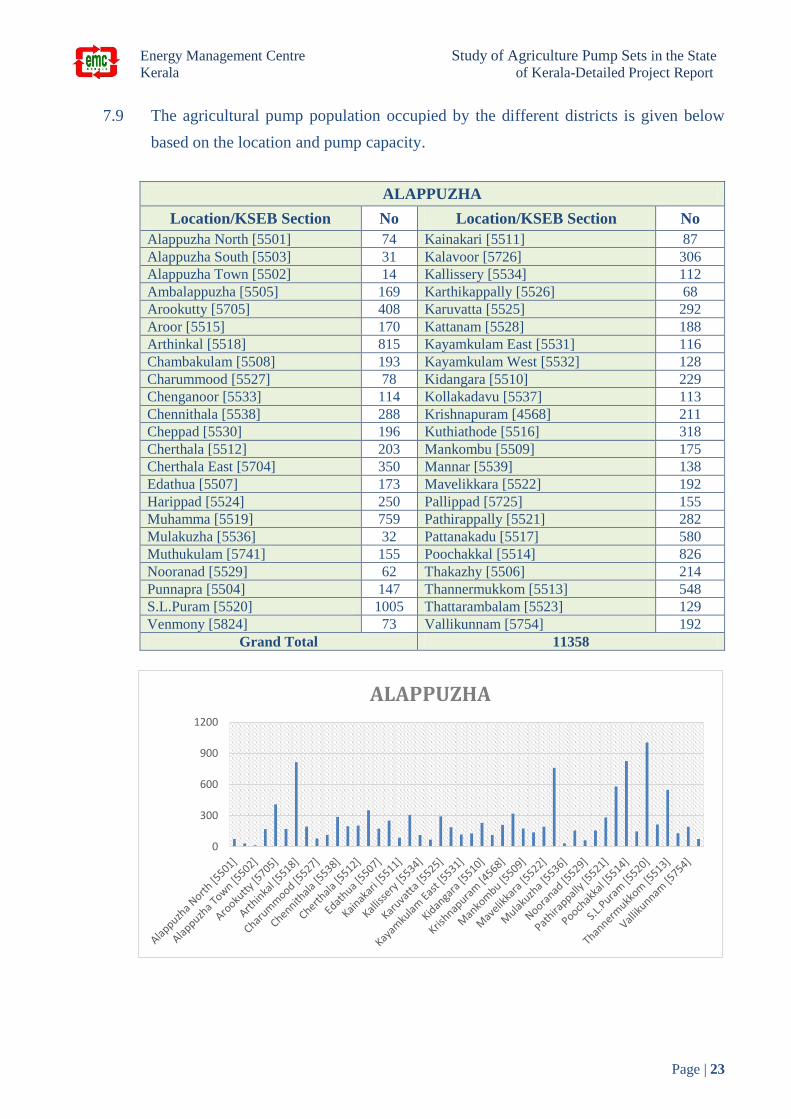
7.9 The agricultural pump population occupied by the different districts is given below
based on the location and pump capacity.
ALAPPUZHA
Location/KSEB Section No Location/KSEB Section No
Alappuzha North [5501] 74 Kainakari [5511] 87
Alappuzha South [5503] 31 Kalavoor [5726] 306
Alappuzha Town [5502] 14 Kallissery [5534] 112
Ambalappuzha [5505] 169 Karthikappally [5526] 68
Arookutty [5705] 408 Karuvatta [5525] 292
Aroor [5515] 170 Kattanam [5528] 188
Arthinkal [5518] 815 Kayamkulam East [5531] 116
Chambakulam [5508] 193 Kayamkulam West [5532] 128
Charummood [5527] 78 Kidangara [5510] 229
Chenganoor [5533] 114 Kollakadavu [5537] 113
Chennithala [5538] 288 Krishnapuram [4568] 211
Cheppad [5530] 196 Kuthiathode [5516] 318
Cherthala [5512] 203 Mankombu [5509] 175
Cherthala East [5704] 350 Mannar [5539] 138
Edathua [5507] 173 Mavelikkara [5522] 192
Harippad [5524] 250 Pallippad [5725] 155
Muhamma [5519] 759 Pathirappally [5521] 282
Mulakuzha [5536] 32 Pattanakadu [5517] 580
Muthukulam [5741] 155 Poochakkal [5514] 826
Nooranad [5529] 62 Thakazhy [5506] 214
Punnapra [5504] 147 Thannermukkom [5513] 548
S.L.Puram [5520] 1005 Thattarambalam [5523] 129
Venmony [5824] 73 Vallikunnam [5754] 192
Grand Total 11358
0
300
600
900
1200
ALAPPUZHA

Energy Management Centre Study of Agriculture Pump Sets in the State
Kerala of Kerala-Detailed Project Report
Page | 24
ERNAKULAM
Location/KSEB Section No Location/KSEB Section No
Alangad [5737] 493 Fort Cochin [5564] 8
Aluva North [5568] 172 Girinagar [5542] 3
Aluva Town [5567] 511 Kalady [5576] 1005
Aluva West [5569] 763 Kalamassery [5573] 105
Amballoor [5552] 353 Kalloorkad [5593] 408
Angamaly [5579] 1093 Kaloor [5545] 4
Arakkunnam [5553] 586 Kanjoor [5747] 653
Athani [5572] 806 Kannamali [5560] 23
Chendamangalam [5606] 729 Karakutty [5581] 1046
Chengamanad,PBVR [5571] 693 Keerampara [5713] 367
Cherai [5605] 247 Kizhakkambalam [5586] 845
Cheranellore [5739] 55 Kolencherry [5554] 1072
Chottanikkara [5551] 283 Koothattukulam [5598] 773
Chowara [5570] 715 Koovappady [5590] 863
Edappally [5544] 36 Kothamangalam-I [5600] 596
Edathala [5750] 325 Kothamangalam-II [5601] 331
Edayar(Muppathadom) [5712] 337 Kumbalangi [5561] 93
Eloor [5574] 95 Kunnukara [5575] 1055
Eroor [5733] 43 Kurupampady [5588] 875
Ezhikkara [5603] 246 Malayattoor [5715] 460
Vennala [5732] 39 Vypin [5565] 45
Manjalloor [5752] 445 Moovattupuzha-II [5594] 422
Manjapra [5578] 513 Mulanthuruthy [5748] 184
Mannam [5736] 605 Nellikuzhy [5751] 298
Maradu [5550] 37 Njarackkal [5566] 234
Mookannur [5582] 480 North Parur [5604] 447
Moothakunnam [5608] 166 Okkal [5738] 546
Moovattupuzha-I [5591] 777 Palarivattom [5543] 14
3.6%
33.7%
46.9%
2.0%
3.3%
0.9%
3.5%2.6%2.6%
0.7%0.0%
ALAPPUZHA
below 1 hp
1 hp
1.5 hp
2 hp
3 hp to < 5 hp
5hp to < 10hp
10hp to < 20hp
20hp to < 30hp
30hp to < 50hp
50hp to < 100hp
100hp to < 150hp

Energy Management Centre Study of Agriculture Pump Sets in the State
Kerala of Kerala-Detailed Project Report
Page | 25
Piravom [5597] 911 Thripunithura [5548] 29
Pothanikad [5592] 357 Thuravoor [5577] 553
Puthencruz [5555] 888 Udayamperoor [5549] 247
Thevakkal [5558] 205 Vadakkekkara [5607] 244
Thevara [5541] 4 Vaduthala [5547] 4
Thiruvaniyoor [5734] 402 Valayanchirangara [5596] 1510
Thoppumpady [5562] 5 Varapuzha [5602] 329
Thrikkakkara [5557] 266 Vazhakulam [5584] 781
Thrikkakkara West [5731] 102 Velloorkunnam [5595] 834
Velloorkunnam [5595] 834 Pampakuda [5599] 1037
Vengola [5585] 386 Panangad [5735] 97
Vengoor [5589] 632 Parakadavu,PBVR [5580] 988
Palluruthy [5559] 38 Pattimattam [5587] 732
Vyttila [5556] 8 Perumbavoor [5583] 464
Grand Total 36471
0
400
800
1200
1600
Ala
nga
d [
57
37
]
Alu
va W
est
[55
69
]
Ara
kku
nn
am [
55
53
]
Ch
en
gam
anad
,PB
VR
…
Ch
ott
anik
kara
[5
55
1]
Edat
hal
a [5
75
0]
Ero
or
[57
33
]
Gir
inag
ar [
55
42
]
Kal
loo
rkad
[5
59
3]
Kan
nam
ali [
55
60
]
Kiz
hak
kam
bal
am…
Ko
ova
pp
ady
[55
90
]
Ku
mb
alan
gi [
55
61
]
Mal
ayat
too
r [5
71
5]
Man
nam
[5
73
6]
Mo
oth
aku
nn
am…
Mu
lan
thu
ruth
y…
No
rth
Par
ur
[56
04
]
Pal
luru
thy
[55
59
]
Par
akad
avu
,PB
VR
…
Pir
avo
m [
55
97
]
Thev
akka
l [5
55
8]
Tho
pp
um
pad
y [5
56
2]
Thri
pu
nit
hu
ra [
55
48
]
Vad
akke
kkar
a [5
60
7]
Var
apu
zha
[56
02
]
Ven
gola
[5
58
5]
Vyp
in [
55
65
]
ERNAKULAM
0.7%
3.9%
38.1%
2.2%
41.4%
11.8%1.1%
0.3%
0.2%
0.2%
0.1%
0.0%
ERNAKULAM
below 1 hp
1 hp
1.5 hp
2 hp
3 hp to < 5 hp
5hp to < 10hp
10hp to < 20hp
20hp to < 30hp
30hp to < 50hp
50hp to < 100hp
100hp to < 150hp
150hp to < 200hp
Energy Management Centre Study of Agriculture Pump Sets in the State
Kerala of Kerala-Detailed Project Report
Page | 26
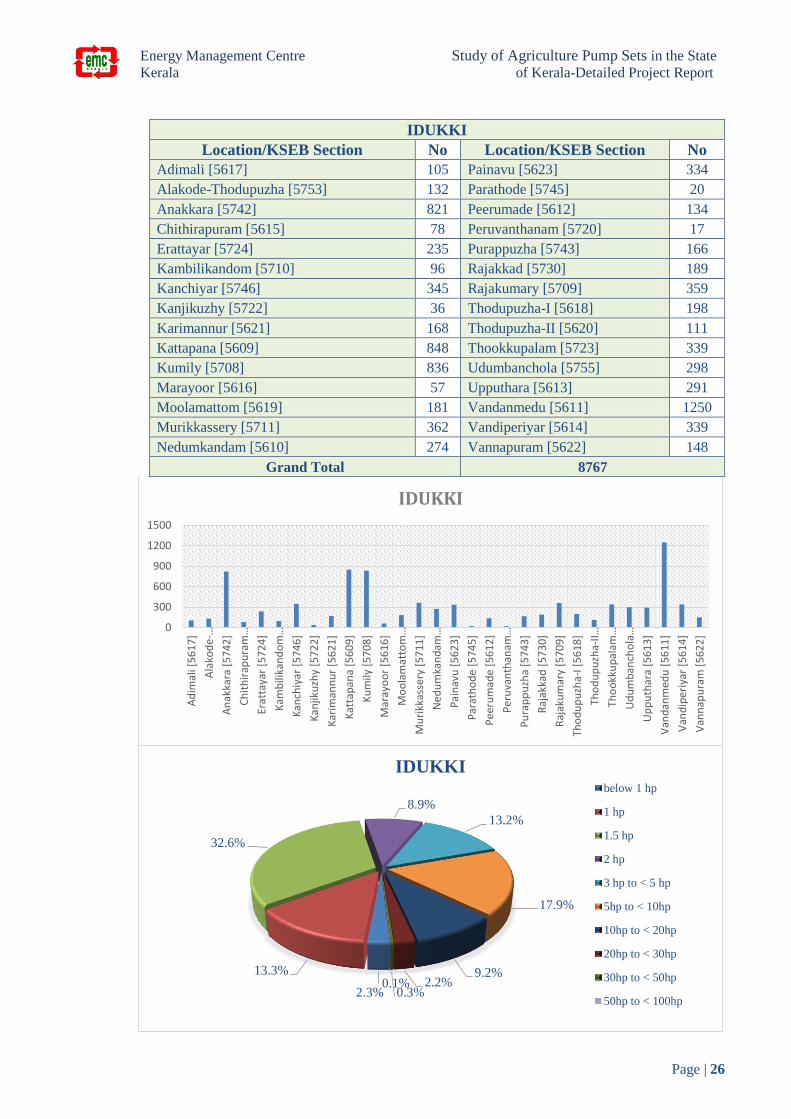
IDUKKI
Location/KSEB Section No Location/KSEB Section No
Adimali [5617] 105 Painavu [5623] 334
Alakode-Thodupuzha [5753] 132 Parathode [5745] 20
Anakkara [5742] 821 Peerumade [5612] 134
Chithirapuram [5615] 78 Peruvanthanam [5720] 17
Erattayar [5724] 235 Purappuzha [5743] 166
Kambilikandom [5710] 96 Rajakkad [5730] 189
Kanchiyar [5746] 345 Rajakumary [5709] 359
Kanjikuzhy [5722] 36 Thodupuzha-I [5618] 198
Karimannur [5621] 168 Thodupuzha-II [5620] 111
Kattapana [5609] 848 Thookkupalam [5723] 339
Kumily [5708] 836 Udumbanchola [5755] 298
Marayoor [5616] 57 Upputhara [5613] 291
Moolamattom [5619] 181 Vandanmedu [5611] 1250
Murikkassery [5711] 362 Vandiperiyar [5614] 339
Nedumkandam [5610] 274 Vannapuram [5622] 148
Grand Total 8767
0
300
600
900
1200
1500
Ad
imal
i [5
61
7]
Ala
kod
e-…
An
akka
ra [
57
42
]
Ch
ith
irap
ura
m…
Erat
taya
r [5
72
4]
Kam
bili
kan
do
m…
Kan
chiy
ar [
57
46
]
Kan
jiku
zhy
[57
22
]
Kar
iman
nu
r [5
62
1]
Kat
tap
ana
[56
09
]
Ku
mily
[5
70
8]
Mar
ayo
or
[56
16
]
Mo
ola
mat
tom
…
Mu
rikk
asse
ry [
57
11
]
Ne
du
mka
nd
am…
Pai
nav
u [
56
23
]
Par
ath
od
e [
57
45
]
Pee
rum
ade
[5
61
2]
Per
uva
nth
anam
…
Pu
rap
pu
zha
[57
43
]
Raj
akka
d [
57
30
]
Raj
aku
mar
y [5
70
9]
Tho
du
pu
zha-
I [5
61
8]
Tho
du
pu
zha-
II…
Tho
okk
up
alam
…
Ud
um
ban
cho
la…
Up
pu
thar
a [5
61
3]
Van
dan
med
u [
56
11
]
Van
dip
eriy
ar [
56
14
]
Van
nap
ura
m [
56
22
]
IDUKKI
2.3%
13.3%
32.6%
8.9%
13.2%
17.9%
9.2%2.2%
0.3%0.1%
IDUKKIbelow 1 hp
1 hp
1.5 hp
2 hp
3 hp to < 5 hp
5hp to < 10hp
10hp to < 20hp
20hp to < 30hp
30hp to < 50hp
50hp to < 100hp
Energy Management Centre Study of Agriculture Pump Sets in the State
Kerala of Kerala-Detailed Project Report
Page | 27
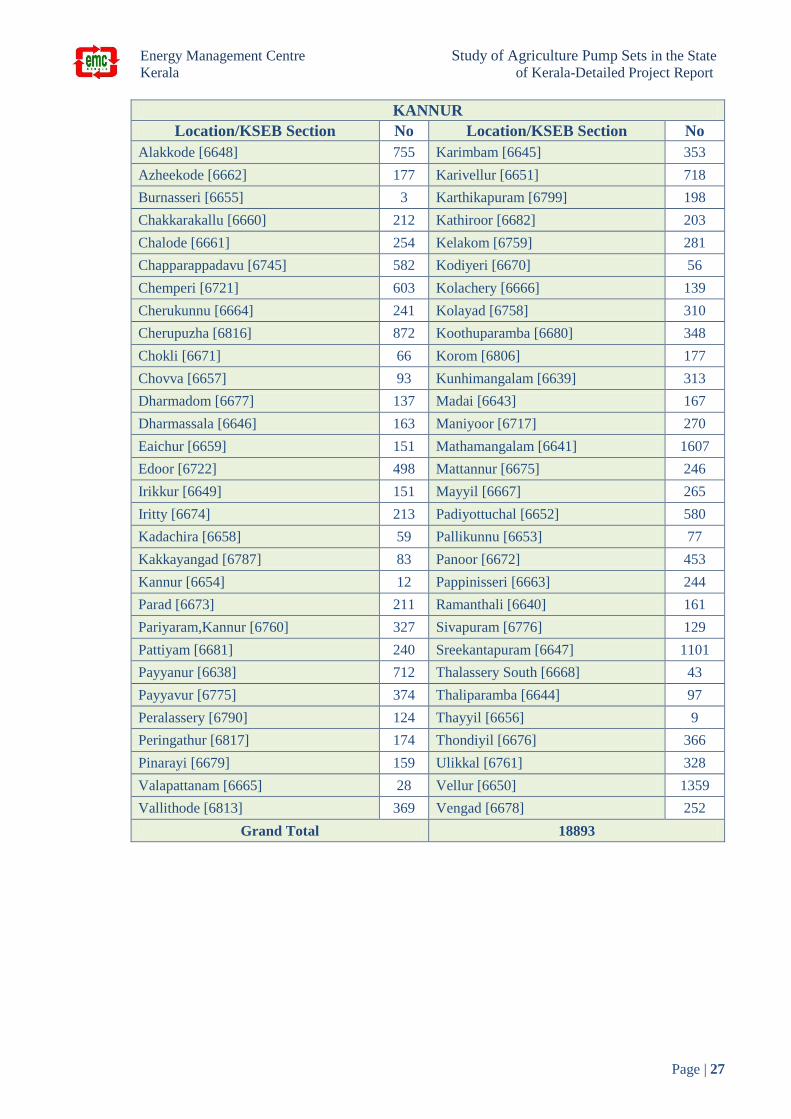
KANNUR
Location/KSEB Section No Location/KSEB Section No
Alakkode [6648] 755 Karimbam [6645] 353
Azheekode [6662] 177 Karivellur [6651] 718
Burnasseri [6655] 3 Karthikapuram [6799] 198
Chakkarakallu [6660] 212 Kathiroor [6682] 203
Chalode [6661] 254 Kelakom [6759] 281
Chapparappadavu [6745] 582 Kodiyeri [6670] 56
Chemperi [6721] 603 Kolachery [6666] 139
Cherukunnu [6664] 241 Kolayad [6758] 310
Cherupuzha [6816] 872 Koothuparamba [6680] 348
Chokli [6671] 66 Korom [6806] 177
Chovva [6657] 93 Kunhimangalam [6639] 313
Dharmadom [6677] 137 Madai [6643] 167
Dharmassala [6646] 163 Maniyoor [6717] 270
Eaichur [6659] 151 Mathamangalam [6641] 1607
Edoor [6722] 498 Mattannur [6675] 246
Irikkur [6649] 151 Mayyil [6667] 265
Iritty [6674] 213 Padiyottuchal [6652] 580
Kadachira [6658] 59 Pallikunnu [6653] 77
Kakkayangad [6787] 83 Panoor [6672] 453
Kannur [6654] 12 Pappinisseri [6663] 244
Parad [6673] 211 Ramanthali [6640] 161
Pariyaram,Kannur [6760] 327 Sivapuram [6776] 129
Pattiyam [6681] 240 Sreekantapuram [6647] 1101
Payyanur [6638] 712 Thalassery South [6668] 43
Payyavur [6775] 374 Thaliparamba [6644] 97
Peralassery [6790] 124 Thayyil [6656] 9
Peringathur [6817] 174 Thondiyil [6676] 366
Pinarayi [6679] 159 Ulikkal [6761] 328
Valapattanam [6665] 28 Vellur [6650] 1359
Vallithode [6813] 369 Vengad [6678] 252
Grand Total 18893

Energy Management Centre Study of Agriculture Pump Sets in the State
Kerala of Kerala-Detailed Project Report
Page | 28
KASARGODE
Location/KSEB Section No Location/KSEB Section No Badiadka [6690] 4259 Nallompuzha [6749] 1159
Balamthode [6773] 1166 Neeleswar [6696] 2497
Bhimanadi [6697] 1303 Nellikunnu [6686] 1553
Chattanchal [6772] 2830 Padanna [6723] 766
Cherkala [6689] 3399 Padannakkad [6804] 1404
Chittari [6695] 1591 Paivalika [6757] 2576
Choyamkode [6750] 1441 Periya Bazar [6774] 3197
Kanhangad [6694] 1022 Perla [6800] 2537
Kasargode [6688] 828 Pilicode [6698] 1192
Kayyur [6699] 1087 Rajapuram [6702] 2609
Kumbala [6687] 1514 Seethangoli [6818] 2351
Kuttikole [6693] 3638 Thrikaripur [6700] 923
Manjeswar [6684] 1986 Udma [6692] 2515
Mavungal [6701] 2868 Uppala [6683] 2242
Mulleria [6691] 3880 Vorkady [6685] 3310
Grand Total 63643
0
400
800
1200
1600
2000
Ala
kko
de
[66
48
]
Bu
rnas
seri
[6
65
5]
Ch
alo
de
[66
61
]
Ch
em
per
i [6
72
1]
Ch
eru
pu
zha
[68
16
]
Ch
ovv
a [6
65
7]
Dh
arm
assa
la [
66
46
]
Edo
or
[67
22
]
Irit
ty [
66
74
]
Kak
kaya
nga
d [
67
87
]
Kar
imb
am [
66
45
]
Kar
thik
apu
ram
[6
79
9]
Kel
ako
m [
67
59
]
Ko
lach
ery
[66
66
]
Ko
oth
up
aram
ba…
Ku
nh
iman
gala
m…
Man
iyo
or
[67
17
]
Mat
tan
nu
r [6
67
5]
Pad
iyo
ttu
chal
[6
65
2]
Pan
oo
r [6
67
2]
Par
ad [
66
73
]
Pat
tiya
m [
66
81
]
Pay
yavu
r [6
77
5]
Per
inga
thu
r [6
81
7]
Ram
anth
ali [
66
40
]
Sree
kan
tap
ura
m…
Thal
ipar
amb
a [6
64
4]
Tho
nd
iyil
[66
76
]
Val
apat
tan
am [
66
65
]
Vel
lur
[66
50
]
KANNUR
4.0%
42.0%
34.0%
2.5%
9.6%
6.3%1.5%
0.1%0.0%
0.0%
0.0%
Kannurbelow 1 hp
1 hp
1.5 hp
2 hp
3 hp to < 5 hp
5hp to < 10hp
10hp to < 20hp
20hp to < 30hp
30hp to < 50hp
50hp to < 100hp
100hp to < 150hp

Energy Management Centre Study of Agriculture Pump Sets in the State
Kerala of Kerala-Detailed Project Report
Page | 29
KOLLAM
Location/KSEB
Section No
Location/KSEB
Section No
Location/KSEB
Section No
Anchal [4597] 73 Karunagappally [4570] 160 Parippally [4577] 274
Anchal West [4669] 37 Kilikolloor [4564] 96 Pathanapuram [4595] 24
Ayathil [4565] 67 Kottarakkara [4587] 69 Pattazhy [4685] 30
Ayoor [4591] 48 Kottarakkara East [4683] 45 Perinad [4563] 69
Cantonment,Kollam
[4558] 15 Kottiyam [4578] 124 Perumpuzha [4585] 135
Chadayamangalam
[4672] 38 Kulakkada [4588] 34 Piravanthoor [4668] 12
Chathannoor [4575] 354 Kulathupuzha [4598] 34 Poothakulam [4671] 260
Chavara [4571] 77 Kundara [4581] 130 Punalur [4593] 35
Chengamanad, [4590] 27 Manappally [4658] 322 Puthur,Kottarakkara
[4589] 90
Chithara [4662] 60 Mayyanad [4580] 136 Sakthikulangara [4561] 28
East kallada [4583] 106 Mynagappally [4659] 70 Sasthamcotta [4573] 116
0
1000
2000
3000
4000
5000
Bad
iad
ka [
66
90
]
Bal
amth
od
e [
67
73
]
Bh
iman
adi [
66
97
]
Ch
atta
nch
al [
67
72
]
Ch
erk
ala
[66
89
]
Ch
itta
ri [
66
95
]
Ch
oya
mko
de
[67
50
]
Kan
han
gad
[6
69
4]
Kas
argo
de
[66
88
]
Kay
yur
[66
99
]
Ku
mb
ala
[66
87
]
Ku
ttik
ole
[6
69
3]
Man
jesw
ar [
66
84
]
Mav
un
gal [
67
01
]
Mu
lleri
a [6
69
1]
Nal
lom
pu
zha
[67
49
]
Ne
ele
swar
[6
69
6]
Ne
lliku
nn
u [
66
86
]
Pad
ann
a [6
72
3]
Pad
ann
akka
d [
68
04
]
Pai
valik
a [6
75
7]
Per
iya
Baz
ar [
67
74
]
Per
la [
68
00
]
Pili
cod
e [6
69
8]
Raj
apu
ram
[6
70
2]
Seet
han
goli
[68
18
]
Thri
kari
pu
r [6
70
0]
Ud
ma
[66
92
]
Up
pal
a [6
68
3]
Vo
rkad
y [6
68
5]
KASARGODE
0.9%10.8%
61.3%
1.4%
16.1%
8.8%0.7%0.0%
0.0%
0.0%
0.0%
KASARGODbelow 1 hp
1 hp
1.5 hp
2 hp
3 hp to < 5 hp
5hp to < 10hp
10hp to < 20hp
20hp to < 30hp
30hp to < 50hp
50hp to < 100hp
100hp to < 150hp
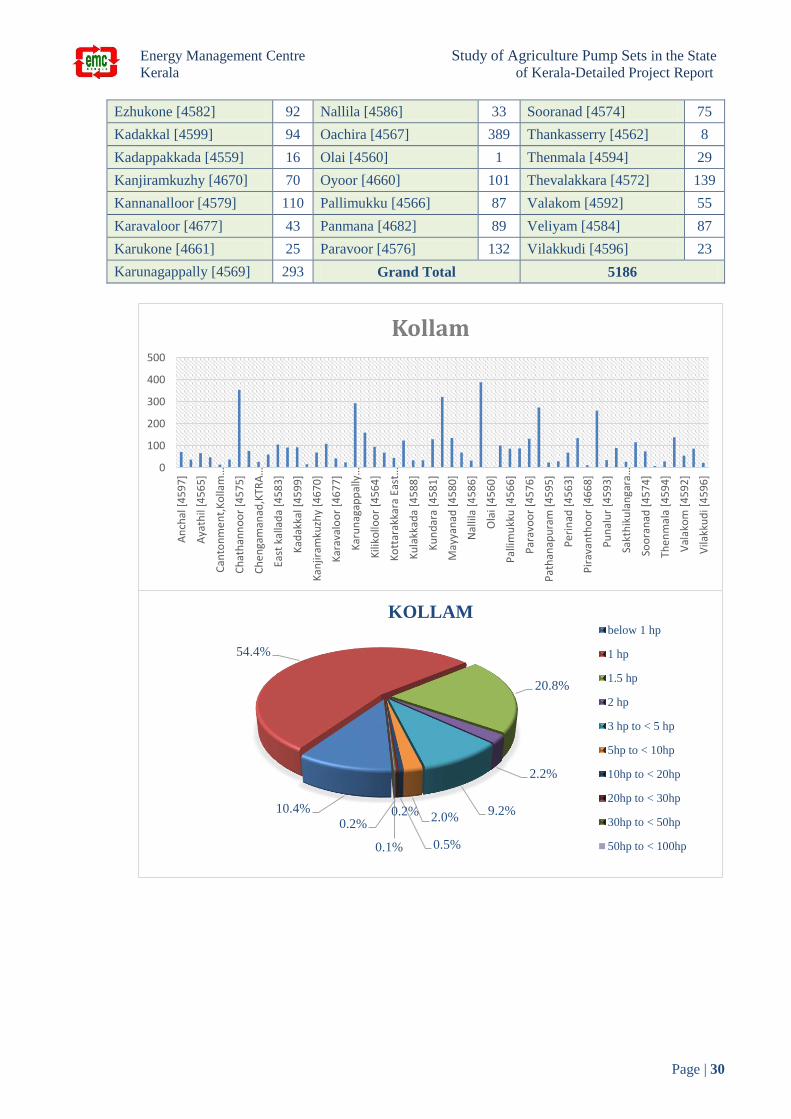
Energy Management Centre Study of Agriculture Pump Sets in the State
Kerala of Kerala-Detailed Project Report
Page | 30
Ezhukone [4582] 92 Nallila [4586] 33 Sooranad [4574] 75
Kadakkal [4599] 94 Oachira [4567] 389 Thankasserry [4562] 8
Kadappakkada [4559] 16 Olai [4560] 1 Thenmala [4594] 29
Kanjiramkuzhy [4670] 70 Oyoor [4660] 101 Thevalakkara [4572] 139
Kannanalloor [4579] 110 Pallimukku [4566] 87 Valakom [4592] 55
Karavaloor [4677] 43 Panmana [4682] 89 Veliyam [4584] 87
Karukone [4661] 25 Paravoor [4576] 132 Vilakkudi [4596] 23
Karunagappally [4569] 293 Grand Total 5186
0
100
200
300
400
500
An
chal
[4
59
7]
Aya
thil
[45
65
]
Can
ton
me
nt,
Ko
llam
…
Ch
ath
ann
oo
r [4
57
5]
Ch
en
gam
anad
,KTR
A…
East
kal
lad
a [4
58
3]
Kad
akka
l [4
59
9]
Kan
jiram
kuzh
y [4
67
0]
Kar
aval
oo
r [4
67
7]
Kar
un
agap
pal
ly…
Kili
kollo
or
[45
64
]
Ko
ttar
akka
ra E
ast…
Ku
lakk
ada
[45
88
]
Ku
nd
ara
[45
81
]
May
yan
ad [
45
80
]
Nal
lila
[45
86
]
Ola
i [4
56
0]
Pal
limu
kku
[4
56
6]
Par
avo
or
[45
76
]
Pat
han
apu
ram
[4
59
5]
Per
inad
[4
56
3]
Pir
avan
tho
or
[46
68
]
Pu
nal
ur
[45
93
]
Sakt
hik
ula
nga
ra…
Soo
ran
ad [
45
74
]
Then
mal
a [4
59
4]
Val
ako
m [
45
92
]
Vila
kku
di [
45
96
]
Kollam
10.4%
54.4%
20.8%
2.2%
9.2%2.0%
0.5%
0.2%0.2%
0.1%
KOLLAMbelow 1 hp
1 hp
1.5 hp
2 hp
3 hp to < 5 hp
5hp to < 10hp
10hp to < 20hp
20hp to < 30hp
30hp to < 50hp
50hp to < 100hp

Energy Management Centre Study of Agriculture Pump Sets in the State
Kerala of Kerala-Detailed Project Report
Page | 31
KOTTAYAM
Location/KSEB
Section No
Location/KSEB
Section No
Location/KSEB
Section No
Athirampuzha [4664] 87 Kottayam Cntrl [4634] 41 Pampady [5635] 45
Ayarkunnam [4632] 200 Kottayam East [4635] 95 Pathanad [4684] 30
Aymanam [4629] 213 Kumarakam [4630] 255 Peruva [4686] 340
Bharananganam [5627] 135 Kuravilangad [4649] 528 Pinnakkanad [5632] 66
Changanachery [4636] 73 Kurichy [4637] 116 Ponkunnam [5633] 35
Chempu [4644] 235 Kuruppanthara [4647] 215 Poonjar [5631] 35
Erattupetta [5630] 87 Manarcad [4631] 66 Punja Pallom [4626] 261
Erumely [5637] 20 Manimala [4642] 5 Puthuppally [4633] 121
Ettumanur [4646] 74 Marangattupally [5628] 218 Ramapuram [5629] 249
Gandhinagar [4628] 115 Meenadom [4689] 76 Teekoy [5744] 37
Kaduthuruthy [4651] 540 Mundakkayam [5638] 9 Thalayazham [4645] 308
Kanjirappally [5636] 36 Nattakam [4627] 25 Thalayolaparambu [4650] 314
Karukachal [4641] 45 Neendoor [4648] 276 Thengana [4638] 62
Kidangoor [5625] 237 Paika [5626] 138 Thrikkodithanam [4640] 60
Kollappally [5740] 136 Pala [5624] 114 Vaikom [4643] 479
Kooroppada [5749] 51 Pallickathode [5707] 68 Vakathanam [4639] 97
Koottikkal [5721] 28 Pallom [4625] 37 Vazhoor [5634] 39
Grand Total 7172
0
150
300
450
600
Ath
iram
pu
zha
[46
64
]
Aym
anam
[4
62
9]
Ch
anga
nac
he
ry [
46
36
]
Erat
tup
etta
[5
63
0]
Ettu
man
ur
[46
46
]
Kad
uth
uru
thy
[46
51
]
Kar
uka
chal
[4
64
1]
Ko
llap
pal
ly [
57
40
]
Ko
ott
ikka
l [5
72
1]
Ko
ttay
am E
ast
[46
35
]
Ku
ravi
lan
gad
[4
64
9]
Ku
rup
pan
thar
a [4
64
7]
Man
imal
a [4
64
2]
Mee
nad
om
[4
68
9]
Nat
taka
m [
46
27
]
Pai
ka [
56
26
]
Pal
licka
tho
de
[57
07
]
Pam
pad
y [5
63
5]
Per
uva
[4
68
6]
Po
nku
nn
am [
56
33
]
Pu
nja
Pal
lom
[4
62
6]
Ram
apu
ram
[5
62
9]
Thal
ayaz
ham
[4
64
5]
Then
gan
a [4
63
8]
Vai
kom
[4
64
3]
Vaz
ho
or
[56
34
]
KOTTAYAM
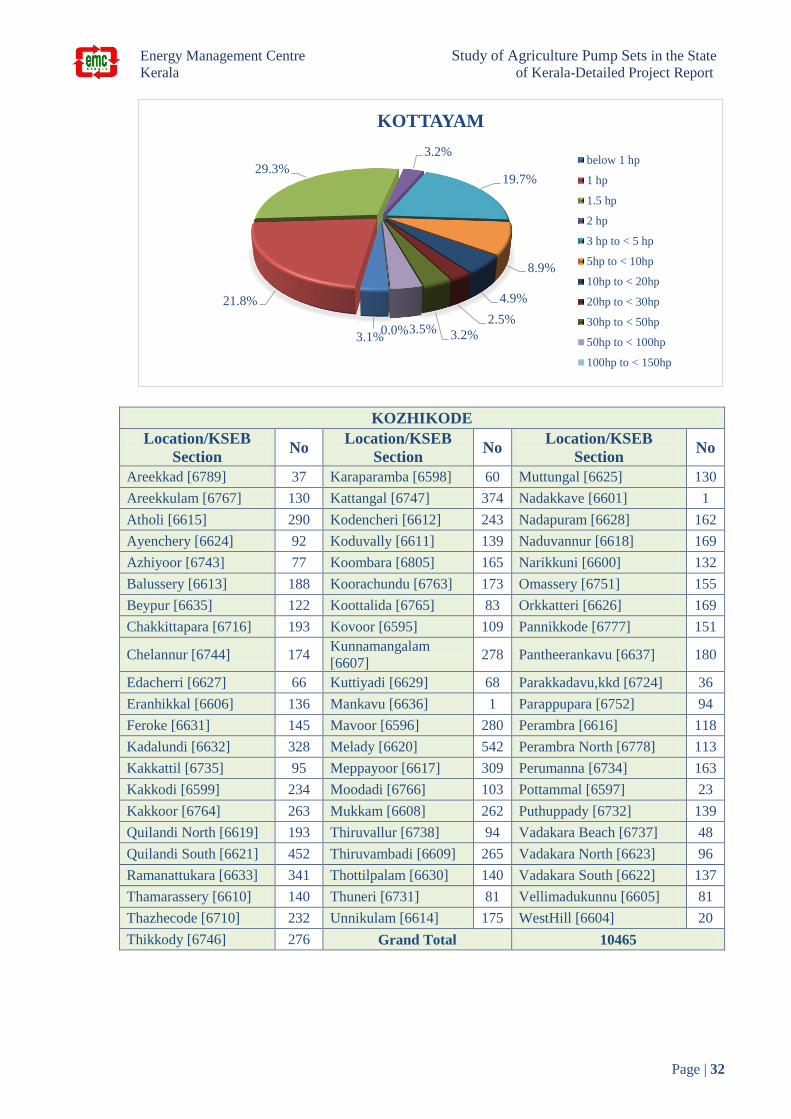
Energy Management Centre Study of Agriculture Pump Sets in the State
Kerala of Kerala-Detailed Project Report
Page | 32
KOZHIKODE
Location/KSEB
Section No
Location/KSEB
Section No
Location/KSEB
Section No
Areekkad [6789] 37 Karaparamba [6598] 60 Muttungal [6625] 130
Areekkulam [6767] 130 Kattangal [6747] 374 Nadakkave [6601] 1
Atholi [6615] 290 Kodencheri [6612] 243 Nadapuram [6628] 162
Ayenchery [6624] 92 Koduvally [6611] 139 Naduvannur [6618] 169
Azhiyoor [6743] 77 Koombara [6805] 165 Narikkuni [6600] 132
Balussery [6613] 188 Koorachundu [6763] 173 Omassery [6751] 155
Beypur [6635] 122 Koottalida [6765] 83 Orkkatteri [6626] 169
Chakkittapara [6716] 193 Kovoor [6595] 109 Pannikkode [6777] 151
Chelannur [6744] 174 Kunnamangalam
[6607] 278 Pantheerankavu [6637] 180
Edacherri [6627] 66 Kuttiyadi [6629] 68 Parakkadavu,kkd [6724] 36
Eranhikkal [6606] 136 Mankavu [6636] 1 Parappupara [6752] 94
Feroke [6631] 145 Mavoor [6596] 280 Perambra [6616] 118
Kadalundi [6632] 328 Melady [6620] 542 Perambra North [6778] 113
Kakkattil [6735] 95 Meppayoor [6617] 309 Perumanna [6734] 163
Kakkodi [6599] 234 Moodadi [6766] 103 Pottammal [6597] 23
Kakkoor [6764] 263 Mukkam [6608] 262 Puthuppady [6732] 139
Quilandi North [6619] 193 Thiruvallur [6738] 94 Vadakara Beach [6737] 48
Quilandi South [6621] 452 Thiruvambadi [6609] 265 Vadakara North [6623] 96
Ramanattukara [6633] 341 Thottilpalam [6630] 140 Vadakara South [6622] 137
Thamarassery [6610] 140 Thuneri [6731] 81 Vellimadukunnu [6605] 81
Thazhecode [6710] 232 Unnikulam [6614] 175 WestHill [6604] 20
Thikkody [6746] 276 Grand Total 10465
3.1%
21.8%
29.3%
3.2%
19.7%
8.9%
4.9%
2.5%
3.2%3.5%0.0%
KOTTAYAM
below 1 hp
1 hp
1.5 hp
2 hp
3 hp to < 5 hp
5hp to < 10hp
10hp to < 20hp
20hp to < 30hp
30hp to < 50hp
50hp to < 100hp
100hp to < 150hp
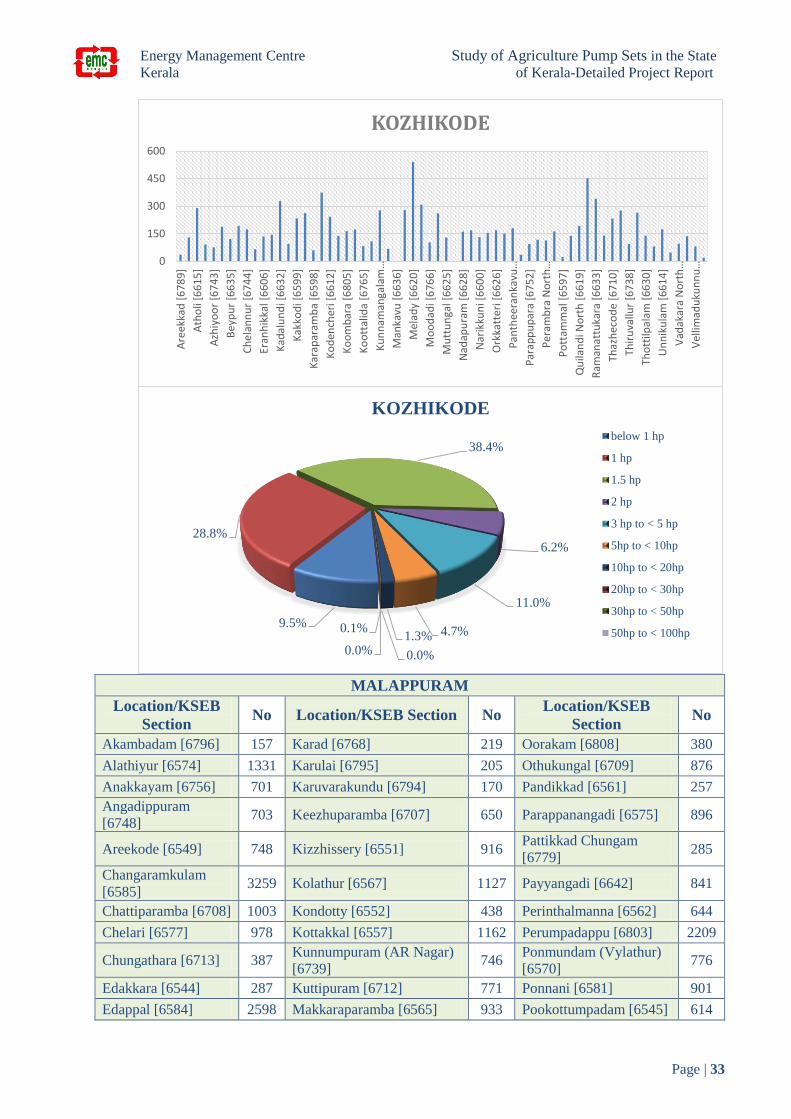
Energy Management Centre Study of Agriculture Pump Sets in the State
Kerala of Kerala-Detailed Project Report
Page | 33
MALAPPURAM
Location/KSEB
Section No Location/KSEB Section No
Location/KSEB
Section No
Akambadam [6796] 157 Karad [6768] 219 Oorakam [6808] 380
Alathiyur [6574] 1331 Karulai [6795] 205 Othukungal [6709] 876
Anakkayam [6756] 701 Karuvarakundu [6794] 170 Pandikkad [6561] 257
Angadippuram
[6748] 703 Keezhuparamba [6707] 650 Parappanangadi [6575] 896
Areekode [6549] 748 Kizzhissery [6551] 916 Pattikkad Chungam
[6779] 285
Changaramkulam
[6585] 3259 Kolathur [6567] 1127 Payyangadi [6642] 841
Chattiparamba [6708] 1003 Kondotty [6552] 438 Perinthalmanna [6562] 644
Chelari [6577] 978 Kottakkal [6557] 1162 Perumpadappu [6803] 2209
Chungathara [6713] 387 Kunnumpuram (AR Nagar)
[6739] 746
Ponmundam (Vylathur)
[6570] 776
Edakkara [6544] 287 Kuttipuram [6712] 771 Ponnani [6581] 901
Edappal [6584] 2598 Makkaraparamba [6565] 933 Pookottumpadam [6545] 614
0
150
300
450
600
Are
ekka
d [
67
89
]
Ath
oli
[66
15
]
Azh
iyo
or
[67
43
]
Bey
pu
r [6
63
5]
Ch
ela
nn
ur
[67
44
]
Eran
hik
kal [
66
06
]
Kad
alu
nd
i [6
63
2]
Kak
kod
i [6
59
9]
Kar
apar
amb
a [6
59
8]
Ko
den
cher
i [6
61
2]
Ko
om
bar
a [6
80
5]
Ko
ott
alid
a [6
76
5]
Ku
nn
aman
gala
m…
Man
kavu
[6
63
6]
Mel
ady
[66
20
]
Mo
od
adi [
67
66
]
Mu
ttu
nga
l [6
62
5]
Nad
apu
ram
[6
62
8]
Nar
ikku
ni [
66
00
]
Ork
katt
eri
[6
62
6]
Pan
thee
ran
kavu
…
Par
app
up
ara
[67
52
]
Per
amb
ra N
ort
h…
Po
ttam
mal
[6
59
7]
Qu
ilan
di N
ort
h [
66
19
]
Ram
anat
tuka
ra [
66
33
]
Thaz
hec
od
e [6
71
0]
Thir
uva
llur
[67
38
]
Tho
ttilp
alam
[6
63
0]
Un
nik
ula
m [
66
14
]
Vad
akar
a N
ort
h…
Vel
limad
uku
nn
u…
KOZHIKODE
9.5%
28.8%
38.4%
6.2%
11.0%
4.7%1.3%
0.0%
0.1%
0.0%
KOZHIKODE
below 1 hp
1 hp
1.5 hp
2 hp
3 hp to < 5 hp
5hp to < 10hp
10hp to < 20hp
20hp to < 30hp
30hp to < 50hp
50hp to < 100hp
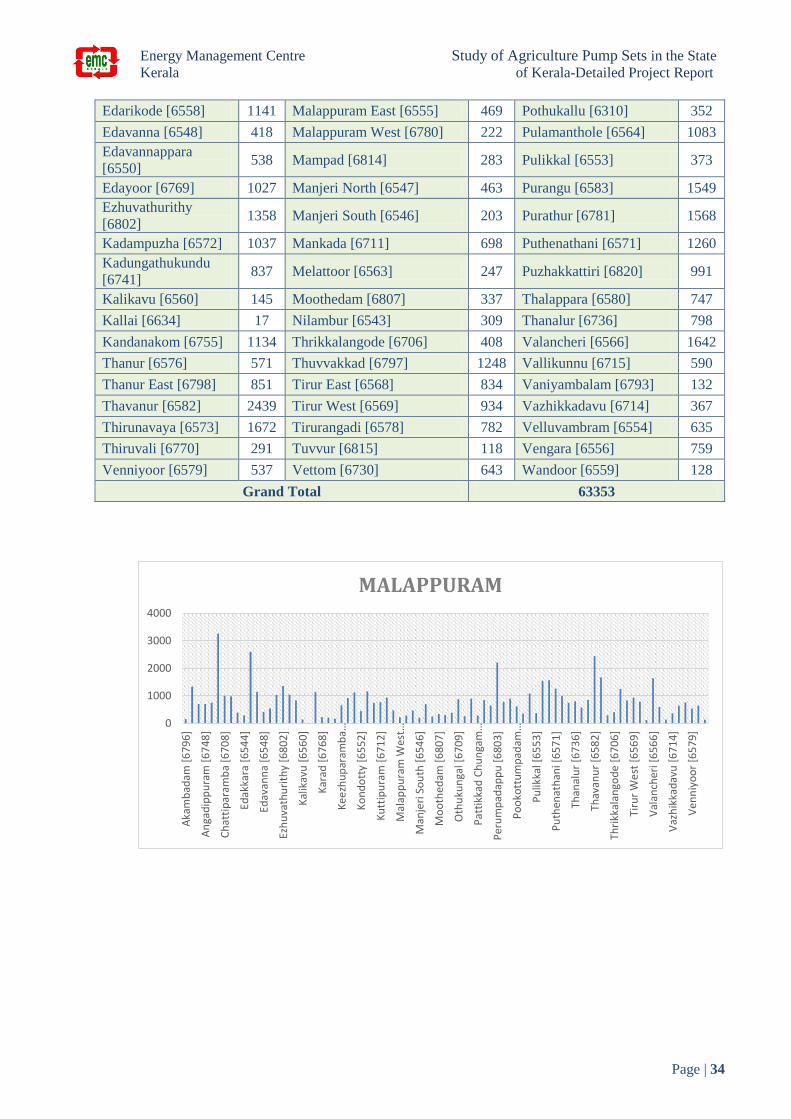
Energy Management Centre Study of Agriculture Pump Sets in the State
Kerala of Kerala-Detailed Project Report
Page | 34
Edarikode [6558] 1141 Malappuram East [6555] 469 Pothukallu [6310] 352
Edavanna [6548] 418 Malappuram West [6780] 222 Pulamanthole [6564] 1083
Edavannappara
[6550] 538 Mampad [6814] 283 Pulikkal [6553] 373
Edayoor [6769] 1027 Manjeri North [6547] 463 Purangu [6583] 1549
Ezhuvathurithy
[6802] 1358 Manjeri South [6546] 203 Purathur [6781] 1568
Kadampuzha [6572] 1037 Mankada [6711] 698 Puthenathani [6571] 1260
Kadungathukundu
[6741] 837 Melattoor [6563] 247 Puzhakkattiri [6820] 991
Kalikavu [6560] 145 Moothedam [6807] 337 Thalappara [6580] 747
Kallai [6634] 17 Nilambur [6543] 309 Thanalur [6736] 798
Kandanakom [6755] 1134 Thrikkalangode [6706] 408 Valancheri [6566] 1642
Thanur [6576] 571 Thuvvakkad [6797] 1248 Vallikunnu [6715] 590
Thanur East [6798] 851 Tirur East [6568] 834 Vaniyambalam [6793] 132
Thavanur [6582] 2439 Tirur West [6569] 934 Vazhikkadavu [6714] 367
Thirunavaya [6573] 1672 Tirurangadi [6578] 782 Velluvambram [6554] 635
Thiruvali [6770] 291 Tuvvur [6815] 118 Vengara [6556] 759
Venniyoor [6579] 537 Vettom [6730] 643 Wandoor [6559] 128
Grand Total 63353
0
1000
2000
3000
4000
Aka
mb
adam
[6
79
6]
An
gad
ipp
ura
m [
67
48
]
Ch
atti
par
amb
a [6
70
8]
Edak
kara
[6
54
4]
Edav
ann
a [6
54
8]
Ezh
uva
thu
rith
y [6
80
2]
Kal
ikav
u [
65
60
]
Kar
ad [
67
68
]
Kee
zhu
par
amb
a…
Ko
nd
ott
y [6
55
2]
Ku
ttip
ura
m [
67
12
]
Mal
app
ura
m W
est…
Man
jeri
So
uth
[6
54
6]
Mo
oth
edam
[6
80
7]
Oth
uku
nga
l [6
70
9]
Pat
tikk
ad C
hu
nga
m…
Per
um
pad
app
u [
68
03
]
Po
oko
ttu
mp
adam
…
Pu
likka
l [6
55
3]
Pu
then
ath
ani [
65
71
]
Than
alu
r [6
73
6]
Thav
anu
r [6
58
2]
Thri
kkal
ango
de
[6
70
6]
Tiru
r W
est
[6
56
9]
Val
anch
eri [
65
66
]
Vaz
hik
kad
avu
[6
71
4]
Ven
niy
oo
r [6
57
9]
MALAPPURAM
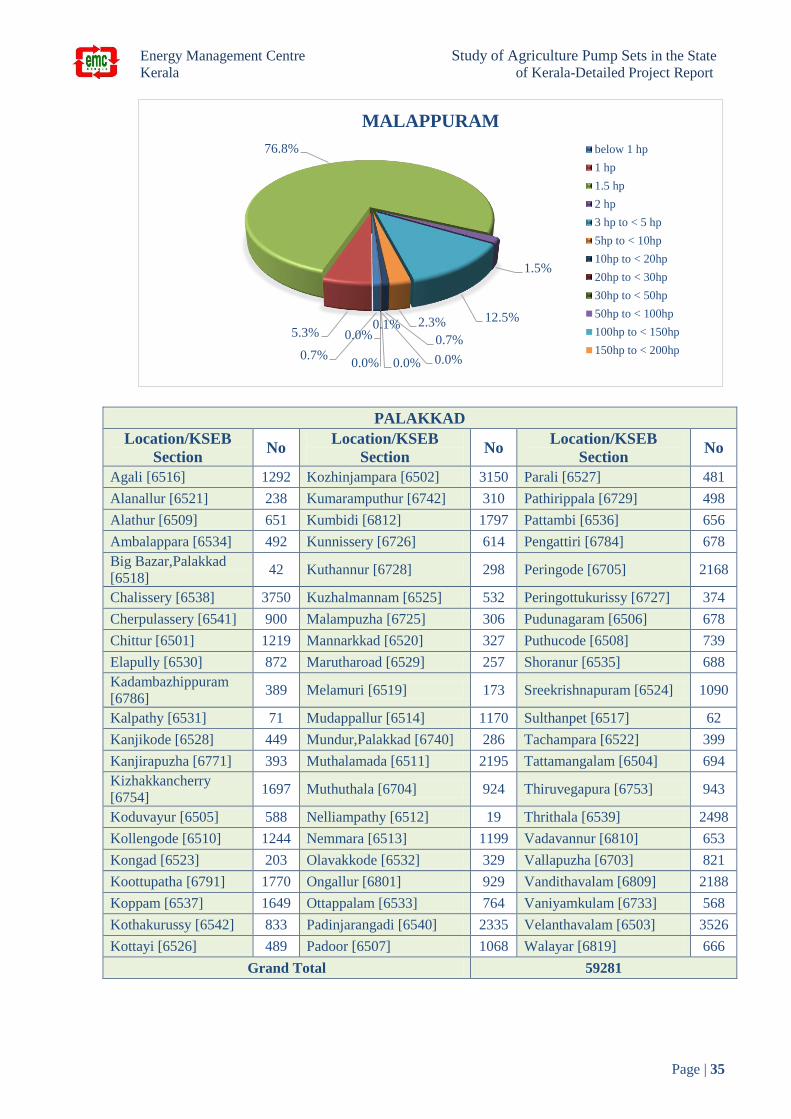
Energy Management Centre Study of Agriculture Pump Sets in the State
Kerala of Kerala-Detailed Project Report
Page | 35
PALAKKAD
Location/KSEB
Section No
Location/KSEB
Section No
Location/KSEB
Section No
Agali [6516] 1292 Kozhinjampara [6502] 3150 Parali [6527] 481
Alanallur [6521] 238 Kumaramputhur [6742] 310 Pathirippala [6729] 498
Alathur [6509] 651 Kumbidi [6812] 1797 Pattambi [6536] 656
Ambalappara [6534] 492 Kunnissery [6726] 614 Pengattiri [6784] 678
Big Bazar,Palakkad
[6518] 42 Kuthannur [6728] 298 Peringode [6705] 2168
Chalissery [6538] 3750 Kuzhalmannam [6525] 532 Peringottukurissy [6727] 374
Cherpulassery [6541] 900 Malampuzha [6725] 306 Pudunagaram [6506] 678
Chittur [6501] 1219 Mannarkkad [6520] 327 Puthucode [6508] 739
Elapully [6530] 872 Marutharoad [6529] 257 Shoranur [6535] 688
Kadambazhippuram
[6786] 389 Melamuri [6519] 173 Sreekrishnapuram [6524] 1090
Kalpathy [6531] 71 Mudappallur [6514] 1170 Sulthanpet [6517] 62
Kanjikode [6528] 449 Mundur,Palakkad [6740] 286 Tachampara [6522] 399
Kanjirapuzha [6771] 393 Muthalamada [6511] 2195 Tattamangalam [6504] 694
Kizhakkancherry
[6754] 1697 Muthuthala [6704] 924 Thiruvegapura [6753] 943
Koduvayur [6505] 588 Nelliampathy [6512] 19 Thrithala [6539] 2498
Kollengode [6510] 1244 Nemmara [6513] 1199 Vadavannur [6810] 653
Kongad [6523] 203 Olavakkode [6532] 329 Vallapuzha [6703] 821
Koottupatha [6791] 1770 Ongallur [6801] 929 Vandithavalam [6809] 2188
Koppam [6537] 1649 Ottappalam [6533] 764 Vaniyamkulam [6733] 568
Kothakurussy [6542] 833 Padinjarangadi [6540] 2335 Velanthavalam [6503] 3526
Kottayi [6526] 489 Padoor [6507] 1068 Walayar [6819] 666
Grand Total 59281
0.7%
5.3%
76.8%
1.5%
12.5%2.3%
0.7%
0.0%0.0%
0.1%0.0%
0.0%
MALAPPURAM
below 1 hp
1 hp
1.5 hp
2 hp
3 hp to < 5 hp
5hp to < 10hp
10hp to < 20hp
20hp to < 30hp
30hp to < 50hp
50hp to < 100hp
100hp to < 150hp
150hp to < 200hp

Energy Management Centre Study of Agriculture Pump Sets in the State
Kerala of Kerala-Detailed Project Report
Page | 36
PATHANAMTHITTA
Location/KSEB
Section No
Location/KSEB
Section No
Location/KSEB
Section No
Adoor [4609] 37 Mallappally [4623] 67 Vaipur [4624] 37
Aranmula [5535] 35 Manipuzha [4620] 255 Vakayar [4687] 16
Ayiroor [4608] 40 Mulakuzha [5536] 1 Vechoochira [4665] 9
Elavumthitta [4616] 19 Pandalam [4614] 52 Vennikulam [4622] 61
Enathu [4806] 27 Pathanamthitta [4600] 19 Kozhenchery [4605] 34
Ezhamkulam [4611] 17 Ranni Perunad [4690] 5 Kulanada [4615] 36
Kadambanad [4613] 49 Ranny North [4607] 16 Kumbanad [4619] 61
Kadapra [4621] 206 Ranny South [4606] 18 Kumbazha [4601] 29
Kaippattoor [4610] 39 Thengamom-Pallickal
[4663] 23 Thottabhagom [4618] 55
Kakkad [4604] 3 Thiruvalla [4617] 30 Vadasserikkara [4603] 10
Kalanjoor [4612] 17 Konni [4602] 22
Grand Total 1345
0
1000
2000
3000
4000
Aga
li [6
51
6]
Ala
thu
r [6
50
9]
Big
Baz
ar,P
alak
kad
…
Ch
erp
ula
sser
y [6
54
1]
Elap
ully
[6
53
0]
Kal
pat
hy
[65
31
]
Kan
jirap
uzh
a [6
77
1]
Ko
du
vayu
r [6
50
5]
Ko
nga
d [
65
23
]
Ko
pp
am [
65
37
]
Ko
ttay
i [6
52
6]
Ku
mar
amp
uth
ur…
Ku
nn
isse
ry [
67
26
]
Ku
zhal
man
nam
…
Man
nar
kkad
[6
52
0]
Mel
amu
ri [
65
19
]
Mu
nd
ur,
Pal
akka
d…
Mu
thu
thal
a [6
70
4]
Ne
mm
ara
[65
13
]
On
gallu
r [6
80
1]
Pad
inja
ran
gad
i…
Par
ali [
65
27
]
Pat
tam
bi [
65
36
]
Per
ingo
de
[67
05
]
Pu
du
nag
aram
[6
50
6]
Sho
ran
ur
[65
35
]
Sult
han
pe
t [6
51
7]
Tatt
aman
gala
m…
Thri
thal
a [6
53
9]
Val
lap
uzh
a [6
70
3]
Van
iyam
kula
m…
Wal
ayar
[6
81
9]
PALAKKAD
0.3%
0.6%
44.9%
2.2%22.2%
26.7%
2.7%0.1%
0.1%
0.1%
0.0%0.0%
PALAKKAD
below 1 hp
1 hp
1.5 hp
2 hp
3 hp to < 5 hp
5hp to < 10hp
10hp to < 20hp
20hp to < 30hp
30hp to < 50hp
50hp to < 100hp
100hp to < 150hp
150hp to < 200hp

Energy Management Centre Study of Agriculture Pump Sets in the State
Kerala of Kerala-Detailed Project Report
Page | 37
THIRUVANATHAPURAM
Location/KSEB
Section No
Location/KSEB
Section No
Location/KSEB
Section No
Amboori [4656] 46 Karamana [4510] 21 Nemom [4543] 173
Aryanad [4652] 65 Kattakada [4552] 165 Neyyattinkara [4537] 260
Attingal [4531] 118 Kazhakuttam [4521] 785 Ottasekharamangalam
[4554] 133
Avanavancherry
[4532] 140 Kedakulam [4527] 299 Palachira [4534] 302
Balaramapuram [4542] 202 Kesavadasapuram
[4516] 12
Pallickal [Attingal
Dvn.] [4680] 103
Beach,Trivandrum
[4513] 117 Kilimannoor [4535] 136 Palode [4548] 56
Cantonment,TVM
[4506] 4 Kottukal [4657] 326 Parassala [4540] 383
Chirayinkeezhu [4529] 111 Kudappanakkunnu
[4676] 95 Peringamala [4674] 42
Chullimanoor [4653] 96 Kulathoor [4520] 182 Peroorkada [4508] 68
Edava [4526] 83 Kunnathukal [4667] 129 Pettah [4514] 60
0
50
100
150
200
250
300
Ad
oo
r [4
60
9]
Ara
nm
ula
[5
53
5]
Ayi
roo
r [4
60
8]
Elav
um
thit
ta [
46
16
]
Enat
hu
[4
80
6]
Ezh
amku
lam
[4
61
1]
Kad
amb
anad
[4
61
3]
Kad
apra
[4
62
1]
Kai
pp
atto
or
[46
10
]
Kak
kad
[4
60
4]
Kal
anjo
or
[46
12
]
Ko
nn
i [4
60
2]
Ko
zhen
che
ry [
46
05
]
Ku
lan
ada
[46
15
]
Ku
mb
anad
[4
61
9]
Ku
mb
azh
a [4
60
1]
Mal
lap
pal
ly [
46
23
]
Man
ipu
zha
[46
20
]
Mu
laku
zha
[55
36
]
Pan
dal
am [
46
14
]
Pat
han
amth
itta
[4
60
0]
Ran
ni P
eru
nad
[4
69
0]
Ran
ny
No
rth
[4
60
7]
Ran
ny
Sou
th [
46
06
]
Then
gam
om
-Pal
licka
l…
Thir
uva
lla [
46
17
]
Tho
ttab
hag
om
[4
61
8]
Vad
asse
rikk
ara
[46
03
]
Vai
pu
r [4
62
4]
Vak
ayar
[4
68
7]
Vec
ho
och
ira
[46
65
]
Ven
nik
ula
m [
46
22
]
PATHANAMTHITTA
4.6%
38.8%
22.8%
3.9%
13.0%
5.2%
5.7%
2.6%
2.8%
0.7%
PATHANAMTHITTAbelow 1 hp
1 hp
1.5 hp
2 hp
3 hp to < 5 hp
5hp to < 10hp
10hp to < 20hp
20hp to < 30hp
30hp to < 50hp
50hp to < 100hp

Energy Management Centre Study of Agriculture Pump Sets in the State
Kerala of Kerala-Detailed Project Report
Page | 38
Kachani [4691] 121 Madavoor [4536] 119 Peyad [4550] 232
Kadakkavoor [4528] 68 Malayinkeezh [4666] 168 Poojappura [4512] 123
Kallambalam [4533] 142 Manacaud [4501] 19 Poonthura [4679] 16
Kallara [4557] 146 Mangalapuram [4523] 266 Poovachal [4864] 104
Kalliyoor [4675] 368 Maranalloor [4553] 200 Poovar [4545] 486
Kamukinkode [4868] 421 Marayamuttom [4539] 230 Poozhikunnu [4688] 558
Kaniyapuram [4522] 1346 Nagaroor [4654] 107 Pothencode [4524] 252
Kanjiramkulam [4544] 412 Nalanchira [4518] 118 Sreekariyam [4519] 313
Kanyakulangara
[4556] 107 Nedumangad [4547] 108 Sreevaraham [4515] 20
Thirumala [4511] 77 Uzhamalakkal [4673] 57 Vellanad [4551] 211
Thiruvallam [4502] 192 Vakkom [4530] 90 Vellarada [4541] 130
Tholicode [4681] 36 Vamanapuram [4821] 128 Vellayambalam [4507] 13
Thycaud [4505] 1 Varkala [4525] 79 Venjaramood [4555] 212
Uchakkada [4655] 423 Vattappara [4678] 150 Vithura [4549] 71
Udiyankulangara
[4538] 350 Vattiyoorkavu [4509] 85 Vizhinjam [4546] 445
Ulloor [4517] 21 Grand Total 14053
0200400600800
1000120014001600
Am
bo
ori
[4
65
6]
Ava
nav
anch
erry
…
Can
ton
me
nt,
TVM
…
Edav
a [4
52
6]
Kal
lam
bal
am [
45
33
]
Kam
uki
nko
de
[48
68
]
Kan
yaku
lan
gara
…
Kaz
hak
utt
am [
45
21
]
Kili
man
no
or
[45
35
]
Ku
lath
oo
r [4
52
0]
Mal
ayin
kee
zh [
46
66
]
Mar
anal
loo
r [4
55
3]
Nal
anch
ira
[45
18
]
Ne
yyat
tin
kara
[4
53
7]
Pal
licka
l [A
ttin
gal…
Per
inga
mal
a [4
67
4]
Pey
ad [
45
50
]
Po
ova
chal
[4
86
4]
Po
then
cod
e [
45
24
]
Thir
um
ala
[45
11
]
Thyc
aud
[4
50
5]
Ullo
or
[45
17
]
Vam
anap
ura
m [
48
21
]
Vat
tiyo
ork
avu
[4
50
9]
Vel
laya
mb
alam
[4
50
7]
Viz
hin
jam
[4
54
6]
THIRUVANATHAPURAM

Energy Management Centre Study of Agriculture Pump Sets in the State
Kerala of Kerala-Detailed Project Report
Page | 39
THRISSUR
Location/KSEB
Section No
Location/KSEB
Section No Location/KSEB Section No
Ammadom [5670] 1037 Kandassankadavu
[5689] 1358 Mathilakom [5661] 4412
Annamanada [5648] 2757 Karuvannur [5640] 2648 Medical College [5714] 1889
Arattupuzha [5833] 6 Kattoor [5643] 2741 Meloor [5650] 1147
Arimboor [5679] 1104 Kecheri [5694] 3103 Mulamkunnathukavu [5682] 1069
Ayyanthole [5678] 524 Kodakara [5654] 2729 Mundur,Thrissur [5695] 2298
Big Bazar,Thrissur
[5702] 1851 Kodungalloor- II [5664] 2014 Muthuvara [5685] 1929
Chalakkudy [5651] 2576 Kodungalloor-I [5663] 1312 Nadathara [5677] 1074
Chavakkad [5698] 1681 Kombodinjamakkal
[5645] 3023 Ollur [5672] 1038
Chavakkad Beach
[5699] 2301 Koonamoochy [5696] 2454 Parappookara [5641] 1982
Chelakara [5691] 1999 Koorkancherry [5669] 659 Parappur [5686] 2497
Cherpu [5639] 1723 Koratty [5649] 2591 Pariyaram,IRJKDA [5652] 1060
Cheruthuruthy [5692] 1068 Kundannur [5684] 3463 Pattikad [5676] 1934
Chirakkal [5642] 1258 Kunnamkulam [5700] 2316 Pavaratty [5687] 1519
Desamangalam [5717] 1602 Kuriachira [5671] 240 Pazhanji [5701] 2355
Eriyad [5665] 1886 Kuttichira [5729] 815 Pazhayannur [5719] 971
Guruvayoor [5697] 680 Kuzhoor [5657] 1433 Peringottukara [5666] 2040
Irinjalakuda- I [5644] 2108 Mala [5658] 2291 Perinjanam [5662] 2525
Irinjalakuda-II [5647] 2234 Mannuthy [5675] 1101 Perumbilavu [5727] 2227
Kaipamangalam [5660] 4124 Marathakara [5673] 653 Punnamparambu [5718] 1214
Punnayoorkulam
[5703] 2592 Thiruvillwamala [5693] 534 Varandarappally [5656] 2717
Puthenchira [5728] 2622 Thriprayar [5667] 1945 Vellangallur [5646] 3280
Puthenvelikkara [5659] 1846 Thrissur coorperation 197 Vellikulangara [5653] 2114
Puthukkad [5655] 2920 Vadakkumchery [6515] 935 Vengidange [5690] 1181
Puthur,Thrissur [5674] 1497 Vadanappally [5688] 3365 Viyur [5680] 981
3.8%
26.5%
37.4%
5.3%
22.4%
3.8%
0.4%0.1%
0.0%0.0%
THIRUVANATHAPURAMbelow 1 hp
1 hp
1.5 hp
2 hp
3 hp to < 5 hp
5hp to < 10hp
10hp to < 20hp
20hp to < 30hp
30hp to < 50hp
50hp to < 100hp

Energy Management Centre Study of Agriculture Pump Sets in the State
Kerala of Kerala-Detailed Project Report
Page | 40
Ramavarmapuram
[5681] 722 Valappad [5668] 2584 Wadakkanchery [5683] 1713
Thalikulam [5716] 1959 Grand Total 140347
WAYANAD
Location/KSEB Section No Location/KSEB Section No
Ambalavayal [6762] 167 Padichira [6811] 447
Kalpetta [6586] 98 Padinjarethara [6782] 111
Kambalakkad [6718] 170 Panamaram [6590] 334
Kattikulam [6783] 305 Pulpally [6594] 377
Kottathara [6785] 1335 Sultan Bathery [6592] 92
Mananthavady [6589] 396 Sultan Bathery West [6720] 141
Meenangadi [6593] 319 Thavinhal [6719] 192
Meppadi [6588] 120 Vellamunda [6591] 135
Muttil [6792] 123 Vythiri [6587] 27
Grand Total 4889
0500
100015002000250030003500400045005000
Am
mad
om
[5
67
0]
Ari
mb
oo
r [5
67
9]
Ch
alak
kud
y [5
65
1]
Ch
ela
kara
[5
69
1]
Ch
irak
kal [
56
42
]
Gu
ruva
yoo
r [5
69
7]
Kai
pam
anga
lam
…
Kat
too
r [5
64
3]
Ko
du
nga
lloo
r- II
…
Ko
on
amo
och
y [5
69
6]
Ku
nd
ann
ur
[56
84
]
Ku
ttic
hir
a [5
72
9]
Man
nu
thy
[56
75
]
Med
ical
…
Mu
nd
ur,
Thri
ssu
r…
Ollu
r [5
67
2]
Par
iyar
am,I
RJK
DA
…
Paz
han
ji [5
70
1]
Per
inja
nam
[5
66
2]
Pu
nn
ayo
ork
ula
m…
Pu
thu
kkad
[5
65
5]
Thal
iku
lam
[5
71
6]
Thri
ssu
r co
orp
erat
ion
Val
app
ad [
56
68
]
Vel
liku
lan
gara
[5
65
3]
Wad
akka
nch
ery…
THRISSUR
0.1%
0.6%
58.9%
1.0%
36.0%
2.2%0.5%
0.1%0.2%
0.1%
0.0%
0.0%
THRISSUR
below 1 hp
1 hp
1.5 hp
2 hp
3 hp to < 5 hp
5hp to < 10hp
10hp to < 20hp
20hp to < 30hp
30hp to < 50hp
50hp to < 100hp
100hp to < 150hp
150hp to < 200hp
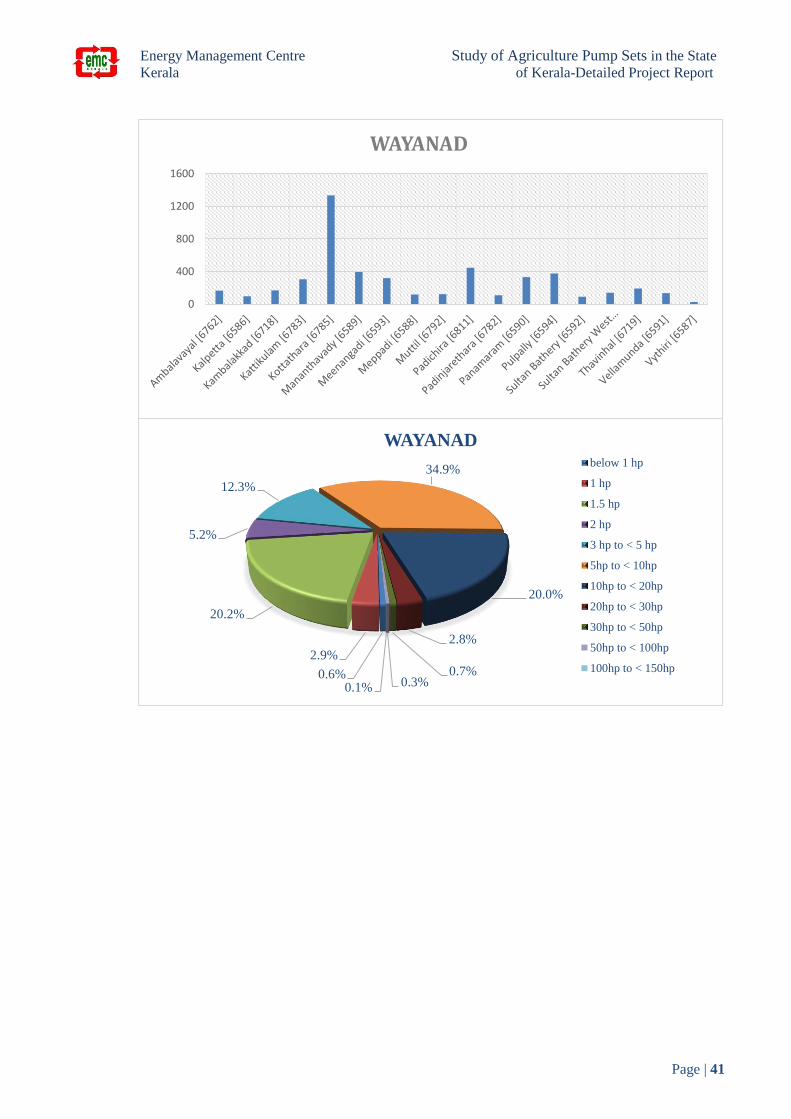
Energy Management Centre Study of Agriculture Pump Sets in the State
Kerala of Kerala-Detailed Project Report
Page | 41
0
400
800
1200
1600
WAYANAD
0.6%
2.9%
20.2%
5.2%
12.3%
34.9%
20.0%
2.8%
0.7%0.3%0.1%
WAYANADbelow 1 hp
1 hp
1.5 hp
2 hp
3 hp to < 5 hp
5hp to < 10hp
10hp to < 20hp
20hp to < 30hp
30hp to < 50hp
50hp to < 100hp
100hp to < 150hp
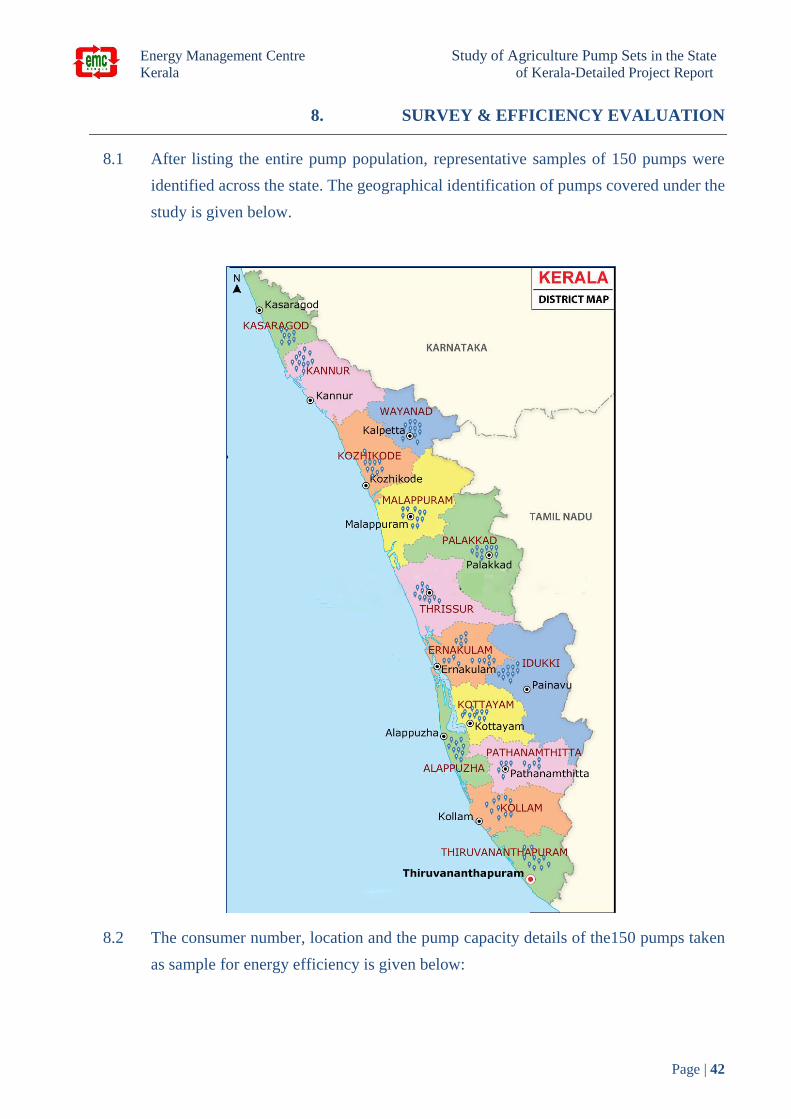
Energy Management Centre Study of Agriculture Pump Sets in the State
Kerala of Kerala-Detailed Project Report
Page | 42
8. SURVEY & EFFICIENCY EVALUATION
8.1 After listing the entire pump population, representative samples of 150 pumps were
identified across the state. The geographical identification of pumps covered under the
study is given below.
8.2 The consumer number, location and the pump capacity details of the150 pumps taken
as sample for energy efficiency is given below:

Energy Management Centre Study of Agriculture Pump Sets in the State
Kerala of Kerala-Detailed Project Report
Page | 43
Table 4 List of Consumer for the Survey
Sl
No
CONSUMER
NO. District Type Make Location
Rated
Pump
Capacity
HP
1 1155011019516
Ala
pp
uzh
a
Mono block Kirloskar Kottankulangara 1.5
2 1155011012624 Mono block Crompton
Greaves Pallimukku 1.5
3 1155013016274 Mono block V-Guard Palm grove lake 1.5
4 1155010026471 Mono block Raidco Theerthasseri 1.5
5 1155011027488 Mono block V-Guard Thathampally 1.0
6 1155011027780 Mono block Kirloskar Thondankulangara 1.5
7 1155012029933 Mono block ELLAI
Lakshmi
Starting Point
pattiam 1.5
8 1155012013466 Mono block Kirloskar Triveni-Indira Jn 1.5
9 1155011011569 Mono block Kirloskar Kommady 1.0
10 1155011029676 Mono block ELLAI
Lakshmi Punnamada 1.5
11 1155010017229 Mono block ELLAI
Lakshmi Thalodi 1.5
12 1155011027488 Mono block Kirloskar Thathampally 2.0
13 1155737004411
Ern
akula
m
Open well
Submersible Kirloskar Kombankulam 3.0
14 1155733013087 Mono block CRI Kuttikattukara 1.0
15 1155731018133 Mono block V-Guard Palliamkara 1.5
16 1155732011743 Open well
Submersible Raidco Cochin University 1.5
17 1155733006841 Mono block V-Guard Vidakuzha 1.0
18 1155733007122 Mono block Kirloskar Muttom 3.0
19 1155732012415 Mono block ELLAI
Lakshmi NAD road 1.5
20 1155732022011 Mono block Crompton
Greaves
Rajagiri-Mythri
Nagar 1.5
21 1155672000029 Mono block Ellen Keezhmadu 5.0
22 1155670006005 Mono block Batuboi Thottumugham 3.0
23 1155670013900 Mono block Kirloskar Ashokapuram 3.0
24 1155670010745 Mono block Ellen Chunagamvely 3.0
25 1155671001665 Split case Kirloskar Edepuram 3.0
26 1155671005035 Open well
Submersible Kirloskar
Valmiki Hill
Keeramkunnu 5.0
27 1155670013412 Mono block Crompton
Greaves Aluva Town 1.5
28 1155480019031 Mono block Crompton
Greaves Choorakadu 1.0
29 1155482033984 Mono block V-Guard Puthiyakavu 0.5
30 1155483013862 Mono block Vaisac-
Renuka Mekkara 0.5
31 1156183033719 I d u k k i Mono block Megha Kumaramangalam 1.0

Energy Management Centre Study of Agriculture Pump Sets in the State
Kerala of Kerala-Detailed Project Report
Page | 44
32 1156189035187 Mono block Kirloskar Chungam 1.0
33 1156182004206 Mono block Texmo Arikuzha 1.5
34 1156180031811 Split case Crompton
Greaves Puthupariyaram 1.0
35 1156181007645 Mono block Aquatex Manakkad 1.5
36 1156183011927 Mono block CRI NRA-Manakkad 1.5
37 1156181002910 Mono block Aquatex Chittoor-Arikuzha 1.5
38 1156181008670 Mono block Crompton
Greaves
Arikuzha-
Puthupariyaram 1.0
39 1156180003124 Mono block Aquatex Arikuzha-
Parekkadavu 1.5
40 1156182023010 Mono block Kirloskar Nagapuzha 1.5
41 1156183002300 Mono block Texmo Puthupariyaram 1.5
42 1166380002728
Kan
nu
r
Mono block Texmo Kandangali 1.5
43 1166380006253 Mono block Aquatex Kanaayikanam 1.5
44 1166380006733 Mono block Texmo Kizhake Kandangali 0.5
45 1166380007296 Mono block Texmo Kanayi 3.0
46 1166380007319 Mono block GEC North Kanayi 3.0
47 1166380006265 Mono block Texmo Chittoor-Kanayi 3.0
48 1166380006344 Split case GEC Kanayi Main 1.5
49 1166380006297 Open well
Submersible Deccan Kanayikanam 1.5
50 1166380006642 Mono block GEC Moorikoval 2.0
51 1166960007484
Kas
argode
Mono block Kirloskar Pattenu 2.0
52 1166960037225 Mono block Crompton
Greaves Pattinu 1.5
53 1166961003197 Mono block Texmo Chirapuram 1.5
54 1166960037336 Mono block Kirloskar Vaniyamvayal 1.5
55 1166960003225 Mono block Kirloskar Vadakkekkara 3.0
56 1166960039865 Mono block Kirloskar Kunniyoor 1.0
57 1166960028517 Mono block ELLAI
Lakshmi Pallikara 1.5
58 1166960035957 Open well
Submersible Kirloskar Neeleshwaram 1.5
59 1166961003148 Mono block Kirloskar Nileshwaram 1.0
60 1166961009936 Open well
Submersible Kirloskar Palayi 1.0
61 1145690017004
Ko
llam
Mono block Raidco Puthiyakavu 1.0
62 1145690019901 Mono block V-Guard AVHS Junction 1.5
63 1145691021382 Mono block Kirloskar Sangapuram
Junction 1.0
64 1145691021411 Mono block Kirloskar Kochalamoodu 1.5
65 1145691022987 Mono block ELLAI
Lakshmi
TB Hospital
Junction 1.0
66 1145691023310 Mono block Oriental Velluthamanal 1.0
67 1145691025542 Mono block Kirloskar Pattassery mukku 1.0
68 1145691028850 Mono block Kirloskar Puthentheravu 1.0
69 1145690029993 Mono block V-Guard Kochalamoodu 0.5

Energy Management Centre Study of Agriculture Pump Sets in the State
Kerala of Kerala-Detailed Project Report
Page | 45
70 1145690031442 Mono block V-Guard Puthenchantha
mukku 0.5
71 1146363024285
Ko
ttay
am
Mono block Crompton
Greaves Changanassery 1.5
72 1146361026202 Mono block Kirloskar Vazhappilly 2.0
73 1146349016780 Mono block ELLAI
Lakshmi Kallupurackal 1.5
74 1146341014606 Mono block ELLAI
Lakshmi Kallupurackal 1.5
75 1146347013732 Mono block Kirloskar Maliyepadi Junction 1.0
76 1146341018181 Mono block Kirloskar Puthangadi 1.0
77 1146348022270 Open Well
Submersible Crompton
Greaves Baker Hill 1.5
78 1146349006459 Open Well
Submersible Crompton
Greaves Baker Hill 1.5
79 1146349013674 Mono block Kirloskar Pullinackal 5.0
80 1146346019829 Mono block ELLAI
Lakshmi
15 kadavu
puthenthodu 1.0
81 1146341014937 Mono block Crompton
Greaves
Thiruvathikal
junction 2.0
82 1146340022199 Mono block ELLAI
Lakshmi Velloor 0.5
83 1165983019849
Kozh
ikode
Open Well
Submersible Kirloskar Kakkodi Bridge 1.5
84 1165980016716 Mono block Kirloskar Kannadikal 1.5
85 1165981013207 Vertical-
Centrifugal SSF
Kannadikal-
Kulangara 1.0
86 1165988015579 Jet
Centrifugal Keragro Vengeri 1.0
87 1165985015242 Mono block Kirloskar Kadampattuthazham 1.0
88 1165981016171 Mono block Crompton
Greaves
KrishnanNair Road-
Kallissery 1.0
89 1165988011465 Mono block Kirloskar Karikamkulam 3.0
90 1165985022921 Mono block Raidco Karaparambu 1.0
91 1165987018871 Mono block Kirloskar Nadakkavu 1.0
92 1165985026138 Mono block Kirloskar Iranjipalam 2.0
93 1165553044980
Mal
app
ura
m
Mono block V-Guard West Kodur 0.5
94 1165551046007 Open Well
Submersible Akash Urdunagar 1.5
95 1165553017646 Mono block Akash Malayala Manorama
Jn 1.5
96 1165551034763 Bore Well
Submersible Kirloskar Varrikode 1.5
97 1165551012671 Mono block Kirloskar Peringhottupulam 1.5
98 1165551018027 Mono block Kirloskar Peringhottupulam
madrassa 1.5
99 1165551010952 Open Well
Submersible Kirloskar Thamarakuzhi 1.5
100 1165550014689 Mono block Kirloskar Kavungal 5.0
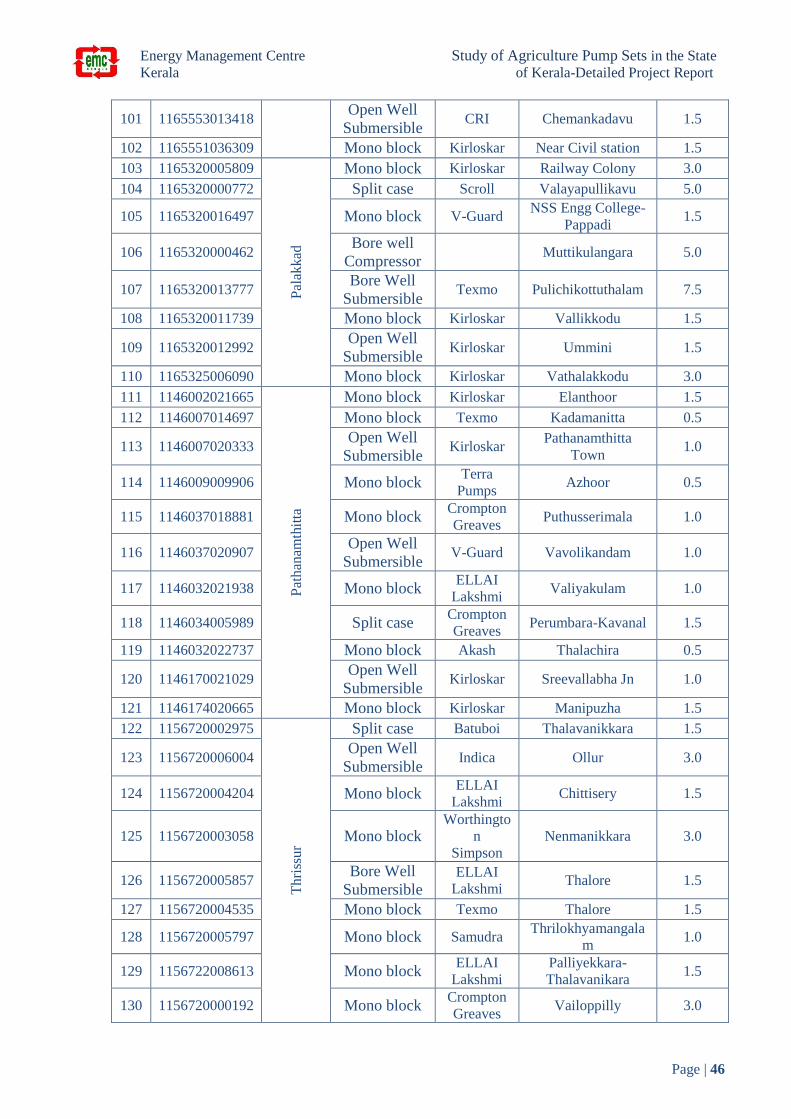
Energy Management Centre Study of Agriculture Pump Sets in the State
Kerala of Kerala-Detailed Project Report
Page | 46
101 1165553013418 Open Well
Submersible CRI Chemankadavu 1.5
102 1165551036309 Mono block Kirloskar Near Civil station 1.5
103 1165320005809
Pal
akkad
Mono block Kirloskar Railway Colony 3.0
104 1165320000772 Split case Scroll Valayapullikavu 5.0
105 1165320016497 Mono block V-Guard NSS Engg College-
Pappadi 1.5
106 1165320000462 Bore well
Compressor Muttikulangara 5.0
107 1165320013777 Bore Well
Submersible Texmo Pulichikottuthalam 7.5
108 1165320011739 Mono block Kirloskar Vallikkodu 1.5
109 1165320012992 Open Well
Submersible Kirloskar Ummini 1.5
110 1165325006090 Mono block Kirloskar Vathalakkodu 3.0
111 1146002021665
Pat
han
amth
itta
Mono block Kirloskar Elanthoor 1.5
112 1146007014697 Mono block Texmo Kadamanitta 0.5
113 1146007020333 Open Well
Submersible Kirloskar
Pathanamthitta
Town 1.0
114 1146009009906 Mono block Terra
Pumps Azhoor 0.5
115 1146037018881 Mono block Crompton
Greaves Puthusserimala 1.0
116 1146037020907 Open Well
Submersible V-Guard Vavolikandam 1.0
117 1146032021938 Mono block ELLAI
Lakshmi Valiyakulam 1.0
118 1146034005989 Split case Crompton
Greaves Perumbara-Kavanal 1.5
119 1146032022737 Mono block Akash Thalachira 0.5
120 1146170021029 Open Well
Submersible Kirloskar Sreevallabha Jn 1.0
121 1146174020665 Mono block Kirloskar Manipuzha 1.5
122 1156720002975
Th
riss
ur
Split case Batuboi Thalavanikkara 1.5
123 1156720006004 Open Well
Submersible Indica Ollur 3.0
124 1156720004204 Mono block ELLAI
Lakshmi Chittisery 1.5
125 1156720003058 Mono block Worthingto
n
Simpson
Nenmanikkara 3.0
126 1156720005857 Bore Well
Submersible ELLAI
Lakshmi Thalore 1.5
127 1156720004535 Mono block Texmo Thalore 1.5
128 1156720005797 Mono block Samudra Thrilokhyamangala
m 1.0
129 1156722008613 Mono block ELLAI
Lakshmi
Palliyekkara-
Thalavanikara 1.5
130 1156720000192 Mono block Crompton
Greaves Vailoppilly 3.0
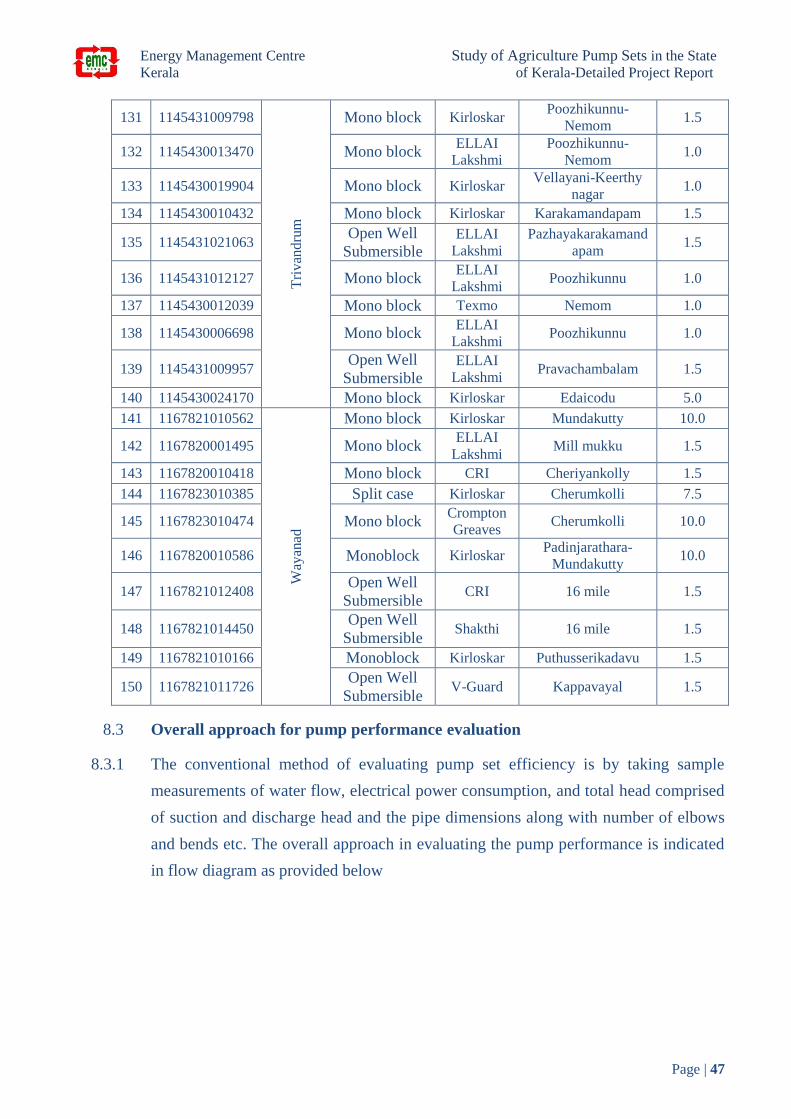
Energy Management Centre Study of Agriculture Pump Sets in the State
Kerala of Kerala-Detailed Project Report
Page | 47
131 1145431009798
Tri
van
dru
m
Mono block Kirloskar Poozhikunnu-
Nemom 1.5
132 1145430013470 Mono block ELLAI
Lakshmi
Poozhikunnu-
Nemom 1.0
133 1145430019904 Mono block Kirloskar Vellayani-Keerthy
nagar 1.0
134 1145430010432 Mono block Kirloskar Karakamandapam 1.5
135 1145431021063 Open Well
Submersible ELLAI
Lakshmi
Pazhayakarakamand
apam 1.5
136 1145431012127 Mono block ELLAI
Lakshmi Poozhikunnu 1.0
137 1145430012039 Mono block Texmo Nemom 1.0
138 1145430006698 Mono block ELLAI
Lakshmi Poozhikunnu 1.0
139 1145431009957 Open Well
Submersible ELLAI
Lakshmi Pravachambalam 1.5
140 1145430024170 Mono block Kirloskar Edaicodu 5.0
141 1167821010562
Way
anad
Mono block Kirloskar Mundakutty 10.0
142 1167820001495 Mono block ELLAI
Lakshmi Mill mukku 1.5
143 1167820010418 Mono block CRI Cheriyankolly 1.5
144 1167823010385 Split case Kirloskar Cherumkolli 7.5
145 1167823010474 Mono block Crompton
Greaves Cherumkolli 10.0
146 1167820010586 Monoblock Kirloskar Padinjarathara-
Mundakutty 10.0
147 1167821012408 Open Well
Submersible CRI 16 mile 1.5
148 1167821014450 Open Well
Submersible Shakthi 16 mile 1.5
149 1167821010166 Monoblock Kirloskar Puthusserikadavu 1.5
150 1167821011726 Open Well
Submersible V-Guard Kappavayal 1.5
8.3 Overall approach for pump performance evaluation
8.3.1 The conventional method of evaluating pump set efficiency is by taking sample
measurements of water flow, electrical power consumption, and total head comprised
of suction and discharge head and the pipe dimensions along with number of elbows
and bends etc. The overall approach in evaluating the pump performance is indicated
in flow diagram as provided below
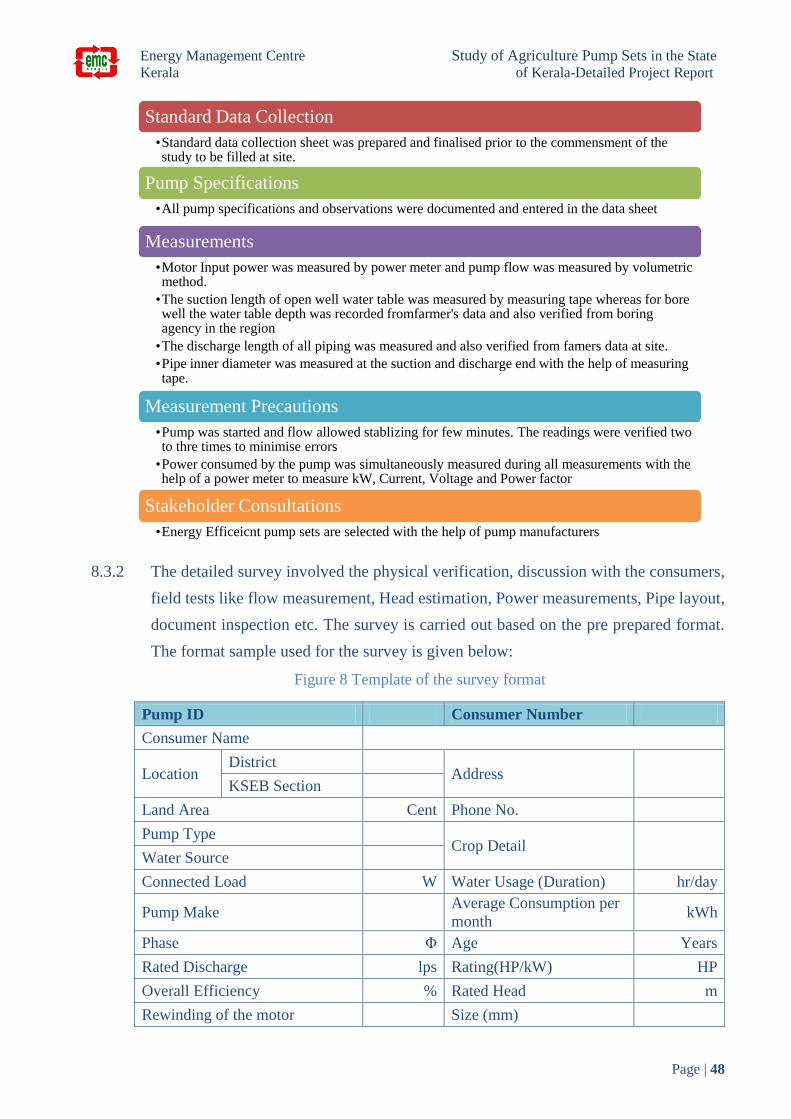
Energy Management Centre Study of Agriculture Pump Sets in the State
Kerala of Kerala-Detailed Project Report
Page | 48
8.3.2 The detailed survey involved the physical verification, discussion with the consumers,
field tests like flow measurement, Head estimation, Power measurements, Pipe layout,
document inspection etc. The survey is carried out based on the pre prepared format.
The format sample used for the survey is given below:
Figure 8 Template of the survey format
Pump ID Consumer Number
Consumer Name
Location District
Address KSEB Section
Land Area Cent Phone No.
Pump Type Crop Detail
Water Source
Connected Load W Water Usage (Duration) hr/day
Pump Make Average Consumption per
month kWh
Phase Φ Age Years
Rated Discharge lps Rating(HP/kW) HP
Overall Efficiency % Rated Head m
Rewinding of the motor Size (mm)
Standard Data Collection
•Standard data collection sheet was prepared and finalised prior to the commensment of the study to be filled at site.
Pump Specifications
•All pump specifications and observations were documented and entered in the data sheet
Measurements
•Motor Input power was measured by power meter and pump flow was measured by volumetric method.
•The suction length of open well water table was measured by measuring tape whereas for bore well the water table depth was recorded fromfarmer's data and also verified from boring agency in the region
•The discharge length of all piping was measured and also verified from famers data at site.
•Pipe inner diameter was measured at the suction and discharge end with the help of measuring tape.
Measurement Precautions
•Pump was started and flow allowed stablizing for few minutes. The readings were verified two to thre times to minimise errors
•Power consumed by the pump was simultaneously measured during all measurements with the help of a power meter to measure kW, Current, Voltage and Power factor
Stakeholder Consultations
•Energy Efficeicnt pump sets are selected with the help of pump manufacturers
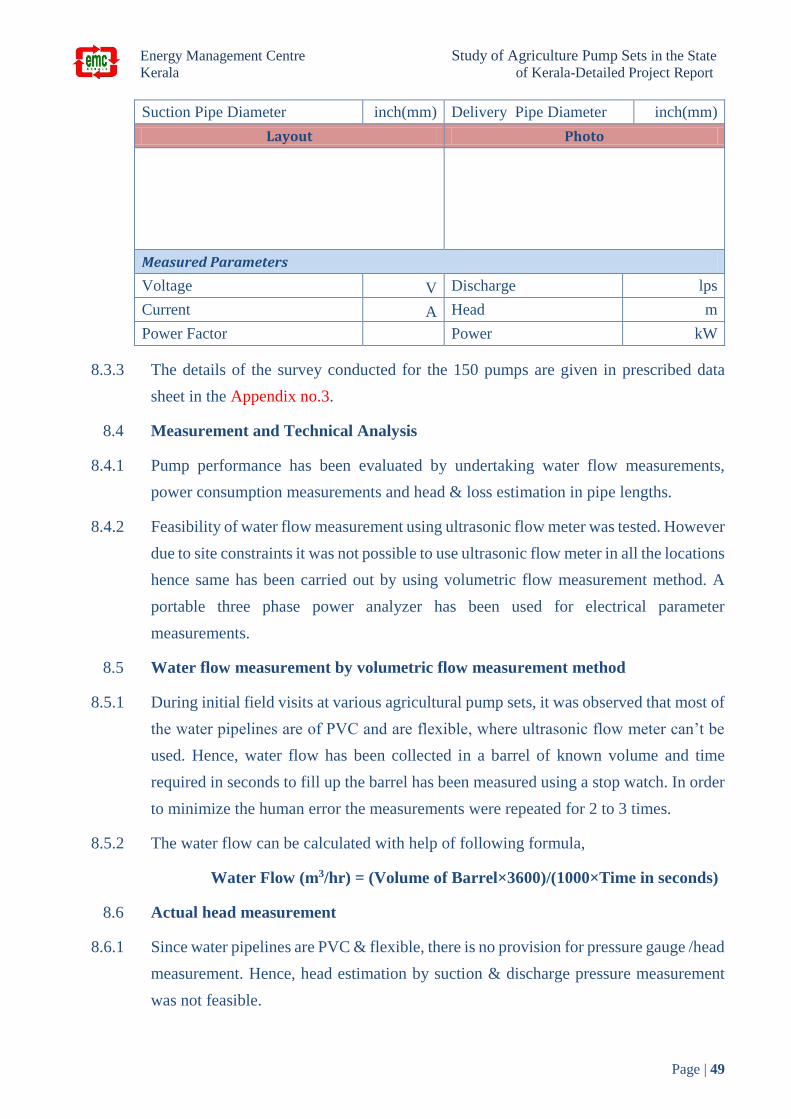
Energy Management Centre Study of Agriculture Pump Sets in the State
Kerala of Kerala-Detailed Project Report
Page | 49
Suction Pipe Diameter inch(mm) Delivery Pipe Diameter inch(mm)
Layout Photo
Measured Parameters
Voltage V Discharge lps
Current A Head m
Power Factor Power kW
8.3.3 The details of the survey conducted for the 150 pumps are given in prescribed data
sheet in the Appendix no.3.
8.4 Measurement and Technical Analysis
8.4.1 Pump performance has been evaluated by undertaking water flow measurements,
power consumption measurements and head & loss estimation in pipe lengths.
8.4.2 Feasibility of water flow measurement using ultrasonic flow meter was tested. However
due to site constraints it was not possible to use ultrasonic flow meter in all the locations
hence same has been carried out by using volumetric flow measurement method. A
portable three phase power analyzer has been used for electrical parameter
measurements.
8.5 Water flow measurement by volumetric flow measurement method
8.5.1 During initial field visits at various agricultural pump sets, it was observed that most of
the water pipelines are of PVC and are flexible, where ultrasonic flow meter can’t be
used. Hence, water flow has been collected in a barrel of known volume and time
required in seconds to fill up the barrel has been measured using a stop watch. In order
to minimize the human error the measurements were repeated for 2 to 3 times.
8.5.2 The water flow can be calculated with help of following formula,
Water Flow (m3/hr) = (Volume of Barrel×3600)/(1000×Time in seconds)
8.6 Actual head measurement
8.6.1 Since water pipelines are PVC & flexible, there is no provision for pressure gauge /head
measurement. Hence, head estimation by suction & discharge pressure measurement
was not feasible.

Energy Management Centre Study of Agriculture Pump Sets in the State
Kerala of Kerala-Detailed Project Report
Page | 50
8.6.2 For open well, water level below ground level is measured with measuring tape whereas
for bore wells depth of water levels is noted based on farmers input and same has been
verified from local boring agencies. Height of discharge from ground level and length&
diameter of pipe were measured. All these constitute to actual pump head including
losses.
8.7 Frictional / Pressure losses in pipes
8.7.1 Whenever water flows in a pipe, there will be some loss of pressure due to following
factors:
Friction: This is affected by the roughness of the inside surface of the pipe, the
pipe diameter, and the physical properties of the fluid.
Changes in size and shape or direction of flow.
Obstructions: For normal cylindrical straight pipes, the major cause of pressure
loss will be due to friction. Pressure loss in a fitting or valve is greater than a
straight pipe. When fluid flows in a straight pipe, the flow pattern will be the same
throughout the pipe. Valve or fitting, changes the flow pattern. This causes extra
pressure drops.
Pressure drop has been measured as per the following Darcy Weichbach equation.
𝐻𝑓 = 4 𝑋 𝑓 𝑋 𝐿 𝑋 𝑉2
2 𝑋 𝑔 𝑋 𝑑
Where,
Hf = Head loss to friction (m)
L = Length (m)
V = Flow velocity (m/s)
g = Gravitational constant (9.81 m/s²)
d = Pipe inside diameter (m)
f = Friction factor (dimensionless)
8.8 Electrical Power Measurements
8.8.1 The electric parameters like current, voltage, power factor and active power for
agriculture pumps were measured.

Energy Management Centre Study of Agriculture Pump Sets in the State
Kerala of Kerala-Detailed Project Report
Page | 51
8.9 Pump set efficiency calculation
8.9.1 The pump set efficiency has been calculated with the help of following formula.
Pump set Efficiency =𝑄 𝑥 ℎ 𝑥 ρ x g x100
1000 𝑥 3600 𝑥 𝑘𝑊𝑚
Where,
Q = Volume flow rate (m3/hr.)
h = (Net Static Head + Velocity Head at Suction & Discharge +
Friction losses due to fittings & length), (m)
ρ = Density of the fluid (kg/m3)
g = Acceleration due to gravity (9.81 m/s2)
kWm = Motor input power
8.10 Based on the site survey and field test conducted, the overall operating efficiencies of
the individual pumps were calculated.
8.11 The sample efficiency evaluation of an agricultural pump is given below:
PUMP PERFORMANCE ANALYSIS
Consumer No. 1155012029933
Pump Specifications
Motor Rating HP 1.5
kW 1.125
Q l/s 5.5
m3/sec 0.01
Rated head (H) m 17
Pump Efficiency = Hydraulic Power (Ph) X 100
Power Input to the pump shaft
Where,
Hydraulic Power, Ph (KW)
Q = Volume flow rate (m3/s)
r = density of the fluid (Kg/m3)
g = acceleration due to gravity (m/s2)
(hd-hs) = Total head in metres
Pump shaft power Ps = Pm x h Motor
Measured data
Pump flow, Q l/s 1.43
m3/s 0.001
Power absorbed, P kW 1.05

Energy Management Centre Study of Agriculture Pump Sets in the State
Kerala of Kerala-Detailed Project Report
Page | 52
Total head h M 25.0
Motor efficiency % 68.0
Type of drive : Direct coupled
Density of water kg/ m3 1000
Pump efficiency
Flow delivered by the pump m3/s 0.001
Hydraulic power kW 0.35
Actual power consumption kW 1.05
Overall system efficiency % 33.4
Pump efficiency % 49
8.12 Similarly, the overall efficiency of the 150 pumps were evaluated and the consolidated
details are given below:
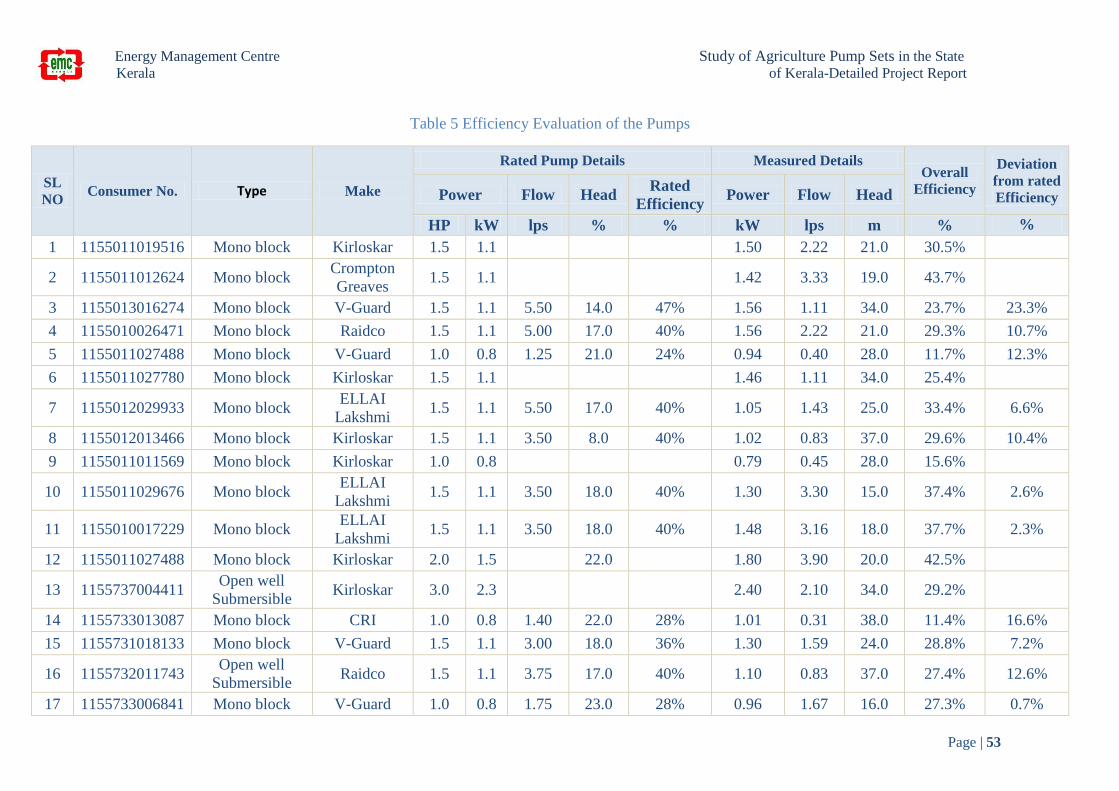
Energy Management Centre Study of Agriculture Pump Sets in the State
Kerala of Kerala-Detailed Project Report
Page | 53
Table 5 Efficiency Evaluation of the Pumps
SL
NO Consumer No. Type Make
Rated Pump Details Measured Details Overall
Efficiency
Deviation
from rated
Efficiency Power Flow Head Rated
Efficiency Power Flow Head
HP kW lps % % kW lps m % %
1 1155011019516 Mono block Kirloskar 1.5 1.1 1.50 2.22 21.0 30.5%
2 1155011012624 Mono block Crompton
Greaves 1.5 1.1 1.42 3.33 19.0 43.7%
3 1155013016274 Mono block V-Guard 1.5 1.1 5.50 14.0 47% 1.56 1.11 34.0 23.7% 23.3%
4 1155010026471 Mono block Raidco 1.5 1.1 5.00 17.0 40% 1.56 2.22 21.0 29.3% 10.7%
5 1155011027488 Mono block V-Guard 1.0 0.8 1.25 21.0 24% 0.94 0.40 28.0 11.7% 12.3%
6 1155011027780 Mono block Kirloskar 1.5 1.1 1.46 1.11 34.0 25.4%
7 1155012029933 Mono block ELLAI
Lakshmi 1.5 1.1 5.50 17.0 40% 1.05 1.43 25.0 33.4% 6.6%
8 1155012013466 Mono block Kirloskar 1.5 1.1 3.50 8.0 40% 1.02 0.83 37.0 29.6% 10.4%
9 1155011011569 Mono block Kirloskar 1.0 0.8 0.79 0.45 28.0 15.6%
10 1155011029676 Mono block ELLAI
Lakshmi 1.5 1.1 3.50 18.0 40% 1.30 3.30 15.0 37.4% 2.6%
11 1155010017229 Mono block ELLAI
Lakshmi 1.5 1.1 3.50 18.0 40% 1.48 3.16 18.0 37.7% 2.3%
12 1155011027488 Mono block Kirloskar 2.0 1.5 22.0 1.80 3.90 20.0 42.5%
13 1155737004411 Open well
Submersible Kirloskar 3.0 2.3 2.40 2.10 34.0 29.2%
14 1155733013087 Mono block CRI 1.0 0.8 1.40 22.0 28% 1.01 0.31 38.0 11.4% 16.6%
15 1155731018133 Mono block V-Guard 1.5 1.1 3.00 18.0 36% 1.30 1.59 24.0 28.8% 7.2%
16 1155732011743 Open well
Submersible Raidco 1.5 1.1 3.75 17.0 40% 1.10 0.83 37.0 27.4% 12.6%
17 1155733006841 Mono block V-Guard 1.0 0.8 1.75 23.0 28% 0.96 1.67 16.0 27.3% 0.7%

Energy Management Centre Study of Agriculture Pump Sets in the State
Kerala of Kerala-Detailed Project Report
Page | 54
18 1155733007122 Mono block Kirloskar 3.0 2.3 2.10 4.00 26.0 48.6%
19 1155732012415 Mono block ELLAI
Lakshmi 1.5 1.1 5.00 12.0 1.20 2.22 16.0 29.0%
20 1155732022011 Mono block Crompton
Greaves 1.5 1.1 4.25 16.0 44% 1.14 2.60 17.0 38.0% 6.0%
21 1155672000029 Mono block Ellen 5.0 3.8 10.00 30.0 50% 3.90 7.40 25.0 46.5% 3.5%
22 1155670006005 Mono block Batuboi 3.0 2.3 3.90 3.80 29.0 27.7%
23 1155670013900 Mono block Kirloskar 3.0 2.3 4.80 4.10 27.0 22.6%
24 1155670010745 Mono block Ellen 3.0 2.3 5.50 20.0 45% 4.90 4.00 27.0 21.6% 23.4%
25 1155671001665 Split case Kirloskar 3.0 2.3 9.00 16.0 56% 2.80 5.60 25.0 49.1% 7.0%
26 1155671005035 Open well
Submersible Kirloskar 5.0 3.8 4.40 5.00 18.0 20.1%
27 1155670013412 Mono block Crompton
Greaves 1.5 1.1 1.40 2.10 19.0 28.0%
28 1155480019031 Mono block Crompton
Greaves 1.0 0.8 3.17 14.5 0.96 0.53 31.0 16.8%
29 1155482033984 Mono block V-Guard 0.5 0.4 2.40 10.0 28% 0.86 1.67 12.0 22.9% 5.1%
30 1155483013862 Mono block Vaisac-
Renuka 0.5 0.4 0.68 1.00 11.0 15.9%
31 1156183033719 Mono block Megha 1.0 0.8 1.90 21.0 28% 1.29 2.11 17.0 27.3% 0.7%
32 1156189035187 Mono block Kirloskar 1.0 0.8 1.40 19.0 28% 1.12 1.12 23.0 22.6% 5.4%
33 1156182004206 Mono block Texmo 1.5 1.1 3.50 20.0 1.20 2.22 16.0 29.0%
34 1156180031811 Split case Crompton
Greaves 1.0 0.8 1.10 0.52 27.0 12.5%
35 1156181007645 Mono block Aquatex 1.5 1.1 4.15 16.0 40% 1.32 2.22 17.0 28.0% 12.0%
36 1156183011927 Mono block CRI 1.5 1.1 2.22 23.0 38% 1.30 1.13 34.0 29.0% 9.0%
37 1156181002910 Mono block Aquatex 1.5 1.1 4.15 16.0 40% 1.24 3.90 10.0 30.9% 9.1%
38 1156181008670 Mono block Crompton
Greaves 1.0 0.8 2.20 12.0 28% 0.85 0.93 24.0 25.8% 2.2%
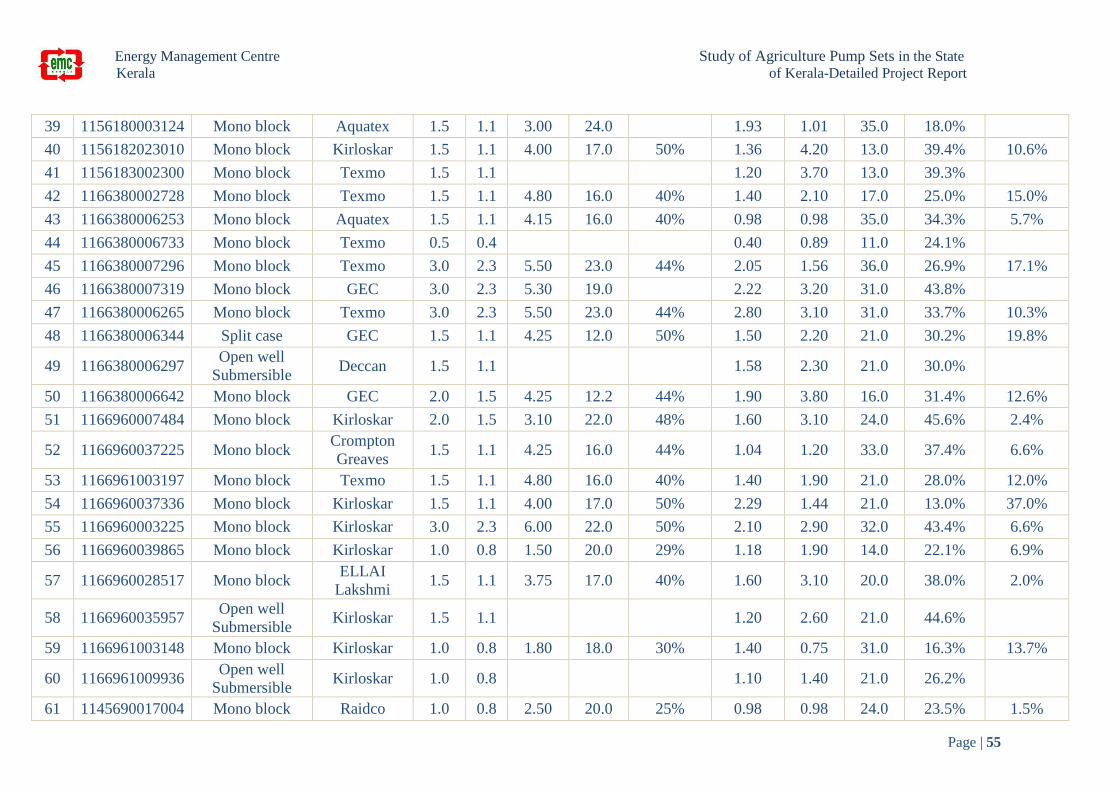
Energy Management Centre Study of Agriculture Pump Sets in the State
Kerala of Kerala-Detailed Project Report
Page | 55
39 1156180003124 Mono block Aquatex 1.5 1.1 3.00 24.0 1.93 1.01 35.0 18.0%
40 1156182023010 Mono block Kirloskar 1.5 1.1 4.00 17.0 50% 1.36 4.20 13.0 39.4% 10.6%
41 1156183002300 Mono block Texmo 1.5 1.1 1.20 3.70 13.0 39.3%
42 1166380002728 Mono block Texmo 1.5 1.1 4.80 16.0 40% 1.40 2.10 17.0 25.0% 15.0%
43 1166380006253 Mono block Aquatex 1.5 1.1 4.15 16.0 40% 0.98 0.98 35.0 34.3% 5.7%
44 1166380006733 Mono block Texmo 0.5 0.4 0.40 0.89 11.0 24.1%
45 1166380007296 Mono block Texmo 3.0 2.3 5.50 23.0 44% 2.05 1.56 36.0 26.9% 17.1%
46 1166380007319 Mono block GEC 3.0 2.3 5.30 19.0 2.22 3.20 31.0 43.8%
47 1166380006265 Mono block Texmo 3.0 2.3 5.50 23.0 44% 2.80 3.10 31.0 33.7% 10.3%
48 1166380006344 Split case GEC 1.5 1.1 4.25 12.0 50% 1.50 2.20 21.0 30.2% 19.8%
49 1166380006297 Open well
Submersible Deccan 1.5 1.1 1.58 2.30 21.0 30.0%
50 1166380006642 Mono block GEC 2.0 1.5 4.25 12.2 44% 1.90 3.80 16.0 31.4% 12.6%
51 1166960007484 Mono block Kirloskar 2.0 1.5 3.10 22.0 48% 1.60 3.10 24.0 45.6% 2.4%
52 1166960037225 Mono block Crompton
Greaves 1.5 1.1 4.25 16.0 44% 1.04 1.20 33.0 37.4% 6.6%
53 1166961003197 Mono block Texmo 1.5 1.1 4.80 16.0 40% 1.40 1.90 21.0 28.0% 12.0%
54 1166960037336 Mono block Kirloskar 1.5 1.1 4.00 17.0 50% 2.29 1.44 21.0 13.0% 37.0%
55 1166960003225 Mono block Kirloskar 3.0 2.3 6.00 22.0 50% 2.10 2.90 32.0 43.4% 6.6%
56 1166960039865 Mono block Kirloskar 1.0 0.8 1.50 20.0 29% 1.18 1.90 14.0 22.1% 6.9%
57 1166960028517 Mono block ELLAI
Lakshmi 1.5 1.1 3.75 17.0 40% 1.60 3.10 20.0 38.0% 2.0%
58 1166960035957 Open well
Submersible Kirloskar 1.5 1.1 1.20 2.60 21.0 44.6%
59 1166961003148 Mono block Kirloskar 1.0 0.8 1.80 18.0 30% 1.40 0.75 31.0 16.3% 13.7%
60 1166961009936 Open well
Submersible Kirloskar 1.0 0.8 1.10 1.40 21.0 26.2%
61 1145690017004 Mono block Raidco 1.0 0.8 2.50 20.0 25% 0.98 0.98 24.0 23.5% 1.5%
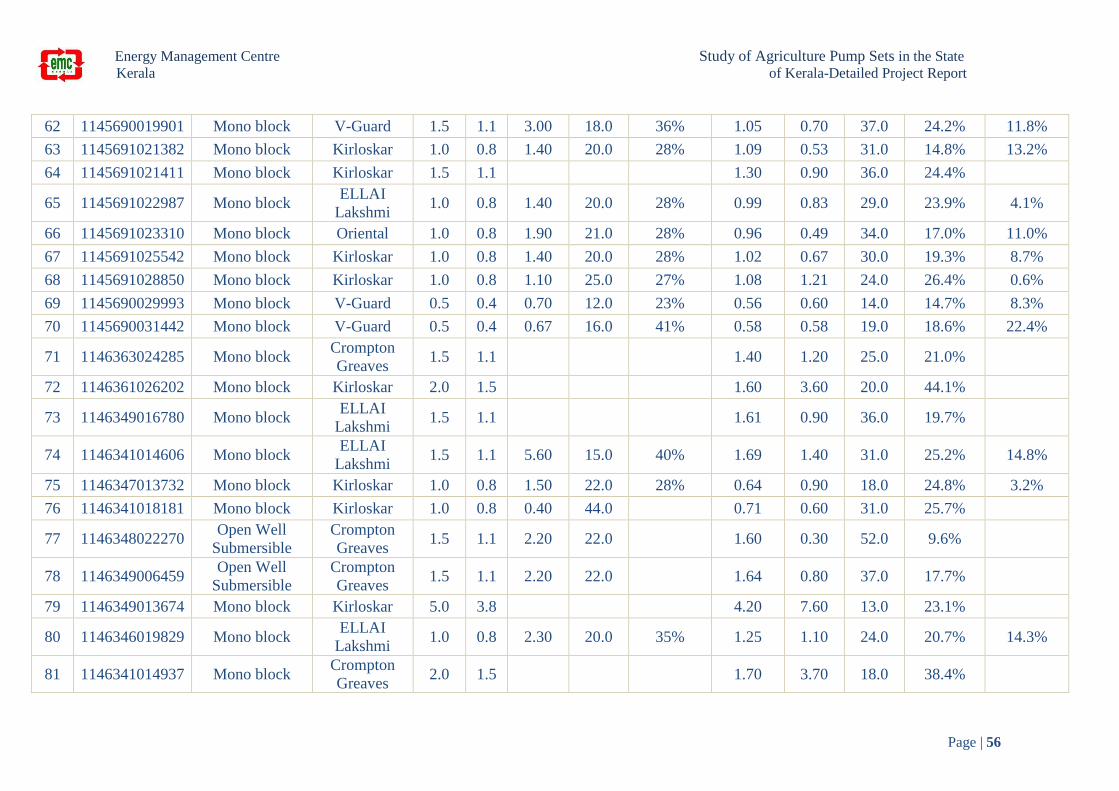
Energy Management Centre Study of Agriculture Pump Sets in the State
Kerala of Kerala-Detailed Project Report
Page | 56
62 1145690019901 Mono block V-Guard 1.5 1.1 3.00 18.0 36% 1.05 0.70 37.0 24.2% 11.8%
63 1145691021382 Mono block Kirloskar 1.0 0.8 1.40 20.0 28% 1.09 0.53 31.0 14.8% 13.2%
64 1145691021411 Mono block Kirloskar 1.5 1.1 1.30 0.90 36.0 24.4%
65 1145691022987 Mono block ELLAI
Lakshmi 1.0 0.8 1.40 20.0 28% 0.99 0.83 29.0 23.9% 4.1%
66 1145691023310 Mono block Oriental 1.0 0.8 1.90 21.0 28% 0.96 0.49 34.0 17.0% 11.0%
67 1145691025542 Mono block Kirloskar 1.0 0.8 1.40 20.0 28% 1.02 0.67 30.0 19.3% 8.7%
68 1145691028850 Mono block Kirloskar 1.0 0.8 1.10 25.0 27% 1.08 1.21 24.0 26.4% 0.6%
69 1145690029993 Mono block V-Guard 0.5 0.4 0.70 12.0 23% 0.56 0.60 14.0 14.7% 8.3%
70 1145690031442 Mono block V-Guard 0.5 0.4 0.67 16.0 41% 0.58 0.58 19.0 18.6% 22.4%
71 1146363024285 Mono block Crompton
Greaves 1.5 1.1 1.40 1.20 25.0 21.0%
72 1146361026202 Mono block Kirloskar 2.0 1.5 1.60 3.60 20.0 44.1%
73 1146349016780 Mono block ELLAI
Lakshmi 1.5 1.1 1.61 0.90 36.0 19.7%
74 1146341014606 Mono block ELLAI
Lakshmi 1.5 1.1 5.60 15.0 40% 1.69 1.40 31.0 25.2% 14.8%
75 1146347013732 Mono block Kirloskar 1.0 0.8 1.50 22.0 28% 0.64 0.90 18.0 24.8% 3.2%
76 1146341018181 Mono block Kirloskar 1.0 0.8 0.40 44.0 0.71 0.60 31.0 25.7%
77 1146348022270 Open Well
Submersible
Crompton
Greaves 1.5 1.1 2.20 22.0 1.60 0.30 52.0 9.6%
78 1146349006459 Open Well
Submersible
Crompton
Greaves 1.5 1.1 2.20 22.0 1.64 0.80 37.0 17.7%
79 1146349013674 Mono block Kirloskar 5.0 3.8 4.20 7.60 13.0 23.1%
80 1146346019829 Mono block ELLAI
Lakshmi 1.0 0.8 2.30 20.0 35% 1.25 1.10 24.0 20.7% 14.3%
81 1146341014937 Mono block Crompton
Greaves 2.0 1.5 1.70 3.70 18.0 38.4%

Energy Management Centre Study of Agriculture Pump Sets in the State
Kerala of Kerala-Detailed Project Report
Page | 57
82 1146340022199 Mono block ELLAI
Lakshmi 0.5 0.4 50.0 0.60 0.50 28.0 22.9%
83 1165983019849 Open Well
Submersible Kirloskar 1.5 1.1 1.13 2.00 19.0 33.0%
84 1165980016716 Mono block Kirloskar 1.5 1.1 4.00 17.0 50% 1.28 2.80 21.0 45.1% 4.9%
85 1165981013207 Vertical-
Centrifugal SSF 1.0 0.8 0.71 2.20 11.0 33.4%
86 1165988015579 Jet Centrifugal Keragro 1.0 0.8 25.0 0.73 1.10 21.0 31.0%
87 1165985015242 Mono block Kirloskar 1.0 0.8 2.20 20.0 28% 1.26 1.20 21.0 19.6% 8.4%
88 1165981016171 Mono block Crompton
Greaves 1.0 0.8 20.0 34% 1.10 3.20 9.0 25.7% 8.3%
89 1165988011465 Mono block Kirloskar 3.0 2.3 4.50 30.0 40% 2.92 3.30 32.0 35.5% 4.5%
90 1165985022921 Mono block Raidco 1.0 0.8 1.40 20.0 27% 0.78 1.10 18.0 24.9% 1.6%
91 1165987018871 Mono block Kirloskar 1.0 0.8 1.40 20.0 28% 0.64 1.30 13.0 25.9% 2.1%
92 1165985026138 Mono block Kirloskar 2.0 1.5 1.40 2.22 24.0 37.3%
93 1165553044980 Mono block V-Guard 0.5 0.4 1.00 15.0 25% 0.65 1.20 9.0 16.3% 8.7%
94 1165551046007 Open Well
Submersible Akash 1.5 1.1 1.92 2.77 21.0 29.7%
95 1165553017646 Mono block Akash 1.5 1.1 1.80 1.92 19.0 19.9%
96 1165551034763 Bore Well
Submersible Kirloskar 1.5 1.1 1.90 1.27 26.0 17.0%
97 1165551012671 Mono block Kirloskar 1.5 1.1 4.00 17.0 1.85 2.67 21.0 29.7%
98 1165551018027 Mono block Kirloskar 1.5 1.1 4.00 17.0 1.90 2.50 21.0 27.1%
99 1165551010952 Open Well
Submersible Kirloskar 1.5 1.1 1.13 1.86 21.0 33.8%
100 1165550014689 Mono block Kirloskar 5.0 3.8 10.00 23.5 50% 3.40 7.90 19.0 43.3% 6.7%
101 1165553013418 Open Well
Submersible CRI 1.5 1.1 1.30 2.90 17.0 37.2%
102 1165551036309 Mono block Kirloskar 1.5 1.1 13.0 45% 1.20 2.10 19.0 32.6% 12.4%
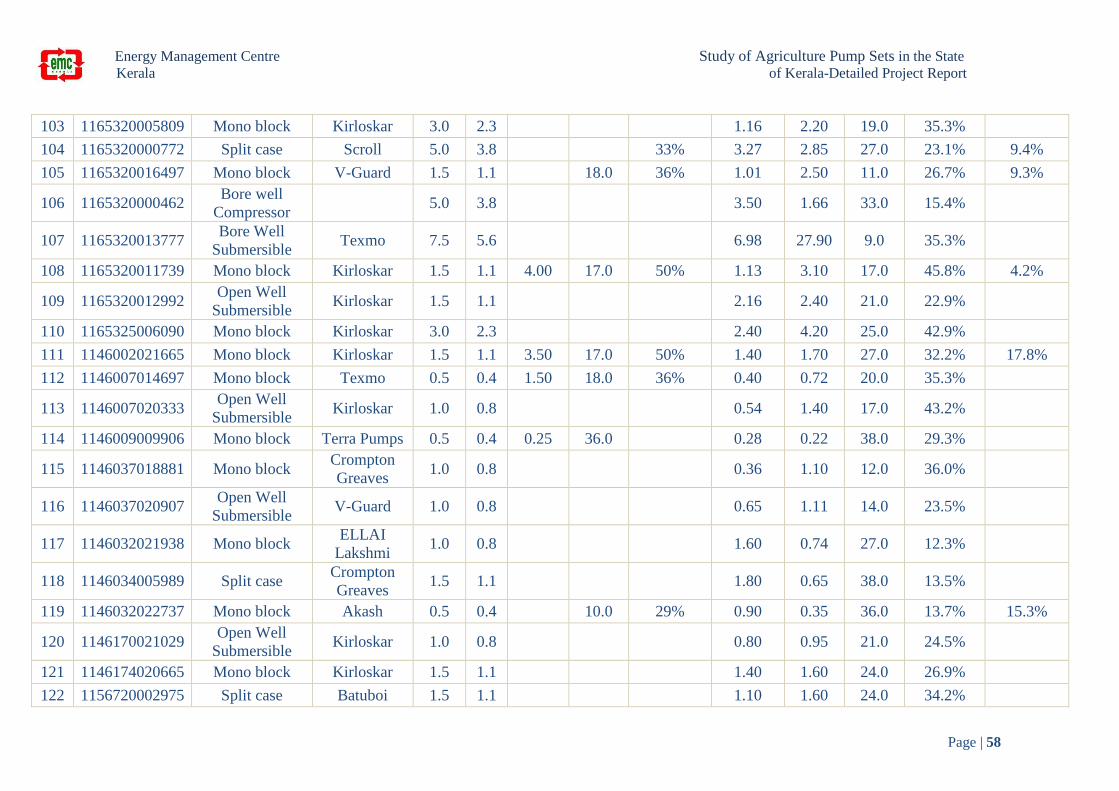
Energy Management Centre Study of Agriculture Pump Sets in the State
Kerala of Kerala-Detailed Project Report
Page | 58
103 1165320005809 Mono block Kirloskar 3.0 2.3 1.16 2.20 19.0 35.3%
104 1165320000772 Split case Scroll 5.0 3.8 33% 3.27 2.85 27.0 23.1% 9.4%
105 1165320016497 Mono block V-Guard 1.5 1.1 18.0 36% 1.01 2.50 11.0 26.7% 9.3%
106 1165320000462 Bore well
Compressor 5.0 3.8 3.50 1.66 33.0 15.4%
107 1165320013777 Bore Well
Submersible Texmo 7.5 5.6 6.98 27.90 9.0 35.3%
108 1165320011739 Mono block Kirloskar 1.5 1.1 4.00 17.0 50% 1.13 3.10 17.0 45.8% 4.2%
109 1165320012992 Open Well
Submersible Kirloskar 1.5 1.1 2.16 2.40 21.0 22.9%
110 1165325006090 Mono block Kirloskar 3.0 2.3 2.40 4.20 25.0 42.9%
111 1146002021665 Mono block Kirloskar 1.5 1.1 3.50 17.0 50% 1.40 1.70 27.0 32.2% 17.8%
112 1146007014697 Mono block Texmo 0.5 0.4 1.50 18.0 36% 0.40 0.72 20.0 35.3%
113 1146007020333 Open Well
Submersible Kirloskar 1.0 0.8 0.54 1.40 17.0 43.2%
114 1146009009906 Mono block Terra Pumps 0.5 0.4 0.25 36.0 0.28 0.22 38.0 29.3%
115 1146037018881 Mono block Crompton
Greaves 1.0 0.8 0.36 1.10 12.0 36.0%
116 1146037020907 Open Well
Submersible V-Guard 1.0 0.8 0.65 1.11 14.0 23.5%
117 1146032021938 Mono block ELLAI
Lakshmi 1.0 0.8 1.60 0.74 27.0 12.3%
118 1146034005989 Split case Crompton
Greaves 1.5 1.1 1.80 0.65 38.0 13.5%
119 1146032022737 Mono block Akash 0.5 0.4 10.0 29% 0.90 0.35 36.0 13.7% 15.3%
120 1146170021029 Open Well
Submersible Kirloskar 1.0 0.8 0.80 0.95 21.0 24.5%
121 1146174020665 Mono block Kirloskar 1.5 1.1 1.40 1.60 24.0 26.9%
122 1156720002975 Split case Batuboi 1.5 1.1 1.10 1.60 24.0 34.2%
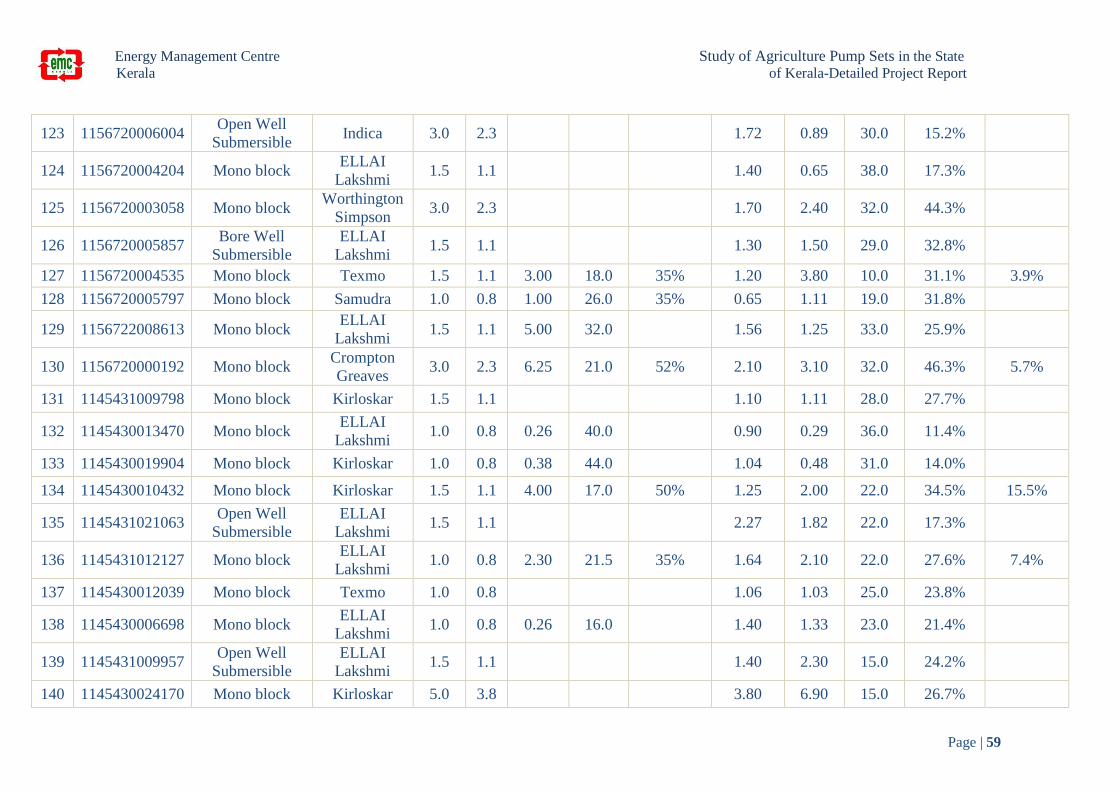
Energy Management Centre Study of Agriculture Pump Sets in the State
Kerala of Kerala-Detailed Project Report
Page | 59
123 1156720006004 Open Well
Submersible Indica 3.0 2.3 1.72 0.89 30.0 15.2%
124 1156720004204 Mono block ELLAI
Lakshmi 1.5 1.1 1.40 0.65 38.0 17.3%
125 1156720003058 Mono block Worthington
Simpson 3.0 2.3 1.70 2.40 32.0 44.3%
126 1156720005857 Bore Well
Submersible
ELLAI
Lakshmi 1.5 1.1 1.30 1.50 29.0 32.8%
127 1156720004535 Mono block Texmo 1.5 1.1 3.00 18.0 35% 1.20 3.80 10.0 31.1% 3.9%
128 1156720005797 Mono block Samudra 1.0 0.8 1.00 26.0 35% 0.65 1.11 19.0 31.8%
129 1156722008613 Mono block ELLAI
Lakshmi 1.5 1.1 5.00 32.0 1.56 1.25 33.0 25.9%
130 1156720000192 Mono block Crompton
Greaves 3.0 2.3 6.25 21.0 52% 2.10 3.10 32.0 46.3% 5.7%
131 1145431009798 Mono block Kirloskar 1.5 1.1 1.10 1.11 28.0 27.7%
132 1145430013470 Mono block ELLAI
Lakshmi 1.0 0.8 0.26 40.0 0.90 0.29 36.0 11.4%
133 1145430019904 Mono block Kirloskar 1.0 0.8 0.38 44.0 1.04 0.48 31.0 14.0%
134 1145430010432 Mono block Kirloskar 1.5 1.1 4.00 17.0 50% 1.25 2.00 22.0 34.5% 15.5%
135 1145431021063 Open Well
Submersible
ELLAI
Lakshmi 1.5 1.1 2.27 1.82 22.0 17.3%
136 1145431012127 Mono block ELLAI
Lakshmi 1.0 0.8 2.30 21.5 35% 1.64 2.10 22.0 27.6% 7.4%
137 1145430012039 Mono block Texmo 1.0 0.8 1.06 1.03 25.0 23.8%
138 1145430006698 Mono block ELLAI
Lakshmi 1.0 0.8 0.26 16.0 1.40 1.33 23.0 21.4%
139 1145431009957 Open Well
Submersible
ELLAI
Lakshmi 1.5 1.1 1.40 2.30 15.0 24.2%
140 1145430024170 Mono block Kirloskar 5.0 3.8 3.80 6.90 15.0 26.7%

Energy Management Centre Study of Agriculture Pump Sets in the State
Kerala of Kerala-Detailed Project Report
Page | 60
141 1167821010562 Mono block Kirloskar 10.0 7.5 7.40 4.17 30.0 16.6%
142 1167820001495 Mono block ELLAI
Lakshmi 1.5 1.1 1.03 1.50 22.0 31.4%
143 1167820010418 Mono block CRI 1.5 1.1 2.50 32.0 32% 0.98 1.20 25.0 30.0% 2.0%
144 1167823010385 Split case Kirloskar 7.5 5.6 7.75 12.0 54% 5.78 5.55 19.0 17.9% 36.1%
145 1167823010474 Mono block Crompton
Greaves 10.0 7.5 20.00 24.0 7.90 6.00 32.0 23.8%
146 1167820010586 Monoblock Kirloskar 10.0 7.5 8.40 11.40 11.0 14.6%
147 1167821012408 Open Well
Submersible CRI 1.5 1.1 1.23 2.20 16.0 28.1%
148 1167821014450 Open Well
Submersible Shakthi 1.5 1.1 1.77 1.45 25.0 20.1%
149 1167821010166 Monoblock Kirloskar 1.5 1.1 1.60 24.0 32% 1.39 1.91 21.0 28.3% 3.7%
150 1167821011726 Open Well
Submersible V-Guard 1.5 1.1 1.60 0.90 36.0 19.9%
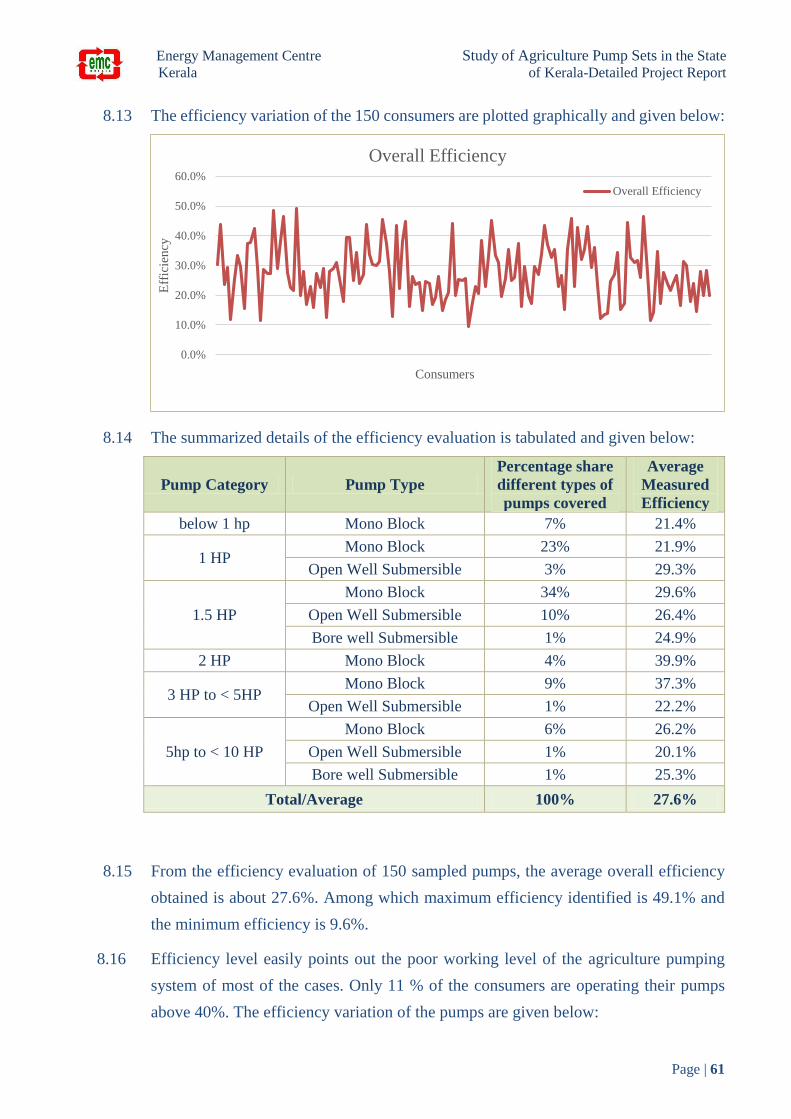
Energy Management Centre Study of Agriculture Pump Sets in the State
Kerala of Kerala-Detailed Project Report
Page | 61
8.13 The efficiency variation of the 150 consumers are plotted graphically and given below:
8.14 The summarized details of the efficiency evaluation is tabulated and given below:
Pump Category Pump Type
Percentage share
different types of
pumps covered
Average
Measured
Efficiency
below 1 hp Mono Block 7% 21.4%
1 HP Mono Block 23% 21.9%
Open Well Submersible 3% 29.3%
1.5 HP
Mono Block 34% 29.6%
Open Well Submersible 10% 26.4%
Bore well Submersible 1% 24.9%
2 HP Mono Block 4% 39.9%
3 HP to < 5HP Mono Block 9% 37.3%
Open Well Submersible 1% 22.2%
5hp to < 10 HP
Mono Block 6% 26.2%
Open Well Submersible 1% 20.1%
Bore well Submersible 1% 25.3%
Total/Average 100% 27.6%
8.15 From the efficiency evaluation of 150 sampled pumps, the average overall efficiency
obtained is about 27.6%. Among which maximum efficiency identified is 49.1% and
the minimum efficiency is 9.6%.
8.16 Efficiency level easily points out the poor working level of the agriculture pumping
system of most of the cases. Only 11 % of the consumers are operating their pumps
above 40%. The efficiency variation of the pumps are given below:
0.0%
10.0%
20.0%
30.0%
40.0%
50.0%
60.0%E
ffic
iency
Consumers
Overall Efficiency
Overall Efficiency

Energy Management Centre Study of Agriculture Pump Sets in the State
Kerala of Kerala-Detailed Project Report
Page | 62
8.17 The comparative analysis has been carried out between present overall efficiency and
rated efficiency of different category pumps. The details of analysis is given below:
Eff below 10%
1%10%<Eff<20%
22%
20%<Eff<30%
43%30%<Eff<40%
23%
Eff above 40%
11%
Efficiency Variation of the pumps
Eff below 10% 10%<Eff<20% 20%<Eff<30% 30%<Eff<40% Eff above 40%
0%
10%
20%
30%
40%
50%
60%
5.0 3.0 1.5 1.5 1.5 3.0 1.5 5.0 1.5 1.5 3.0 1.5 7.5
Effi
cie
ncy
(%
)
Rated Capacity (HP)
Rated Vs Measured Efficiency( >=50% rated Eff.)
Rated Overall Efficiency Measured Overall Efficiency
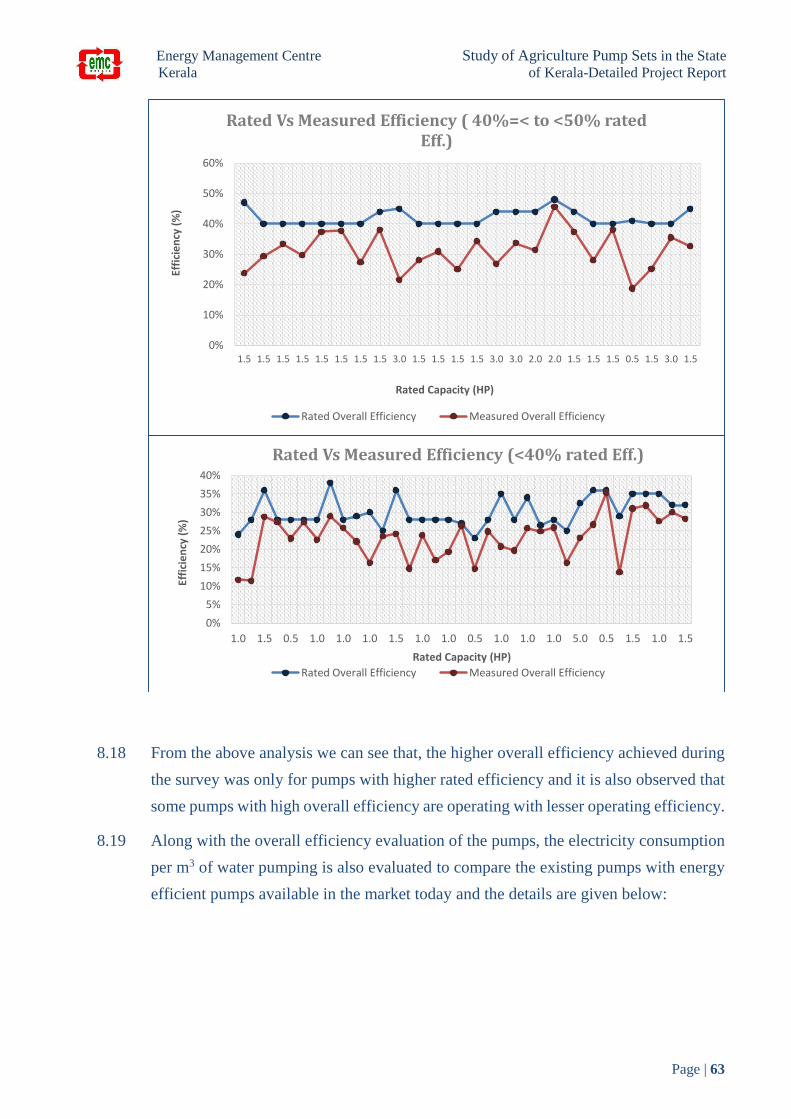
Energy Management Centre Study of Agriculture Pump Sets in the State
Kerala of Kerala-Detailed Project Report
Page | 63
8.18 From the above analysis we can see that, the higher overall efficiency achieved during
the survey was only for pumps with higher rated efficiency and it is also observed that
some pumps with high overall efficiency are operating with lesser operating efficiency.
8.19 Along with the overall efficiency evaluation of the pumps, the electricity consumption
per m3 of water pumping is also evaluated to compare the existing pumps with energy
efficient pumps available in the market today and the details are given below:
0%
10%
20%
30%
40%
50%
60%
1.5 1.5 1.5 1.5 1.5 1.5 1.5 1.5 3.0 1.5 1.5 1.5 1.5 3.0 3.0 2.0 2.0 1.5 1.5 1.5 0.5 1.5 3.0 1.5
Effi
cie
ncy
(%
)
Rated Capacity (HP)
Rated Vs Measured Efficiency ( 40%=< to <50% rated Eff.)
Rated Overall Efficiency Measured Overall Efficiency
0%
5%
10%
15%
20%
25%
30%
35%
40%
1.0 1.5 0.5 1.0 1.0 1.0 1.5 1.0 1.0 0.5 1.0 1.0 1.0 5.0 0.5 1.5 1.0 1.5
Effi
cie
ncy
(%
)
Rated Capacity (HP)
Rated Vs Measured Efficiency (<40% rated Eff.)
Rated Overall Efficiency Measured Overall Efficiency
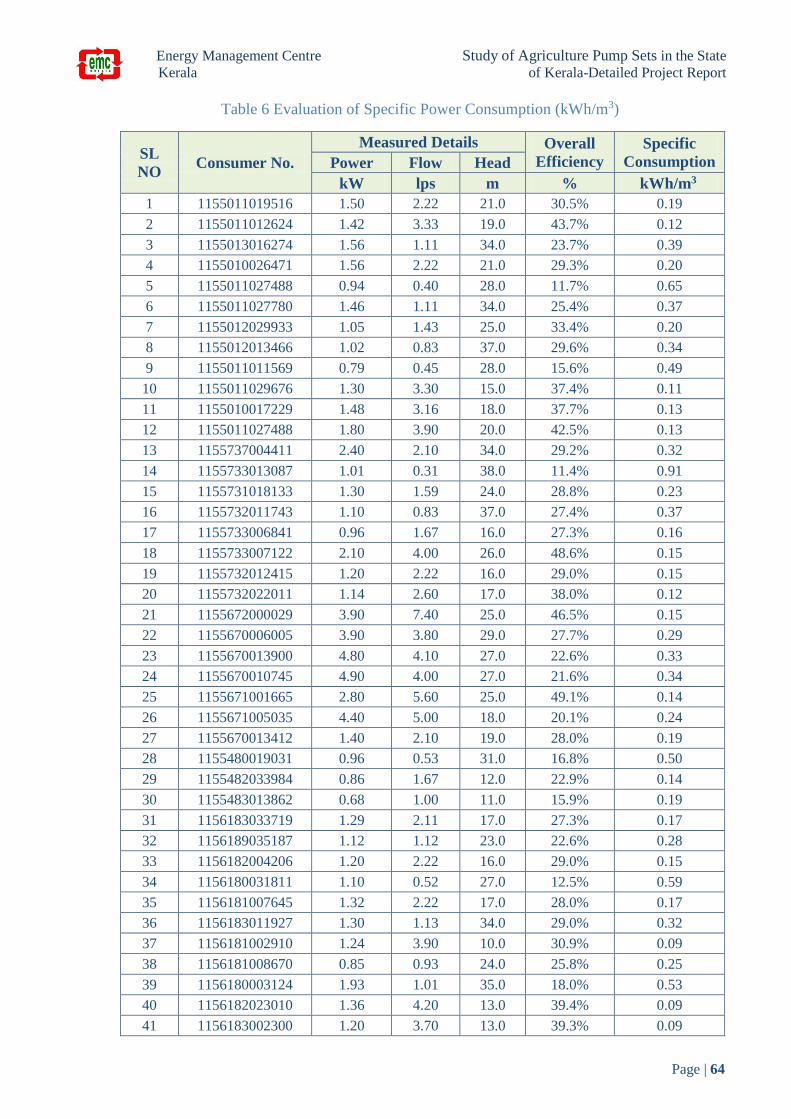
Energy Management Centre Study of Agriculture Pump Sets in the State
Kerala of Kerala-Detailed Project Report
Page | 64
Table 6 Evaluation of Specific Power Consumption (kWh/m3)
SL
NO Consumer No.
Measured Details Overall
Efficiency
Specific
Consumption Power Flow Head
kW lps m % kWh/m3
1 1155011019516 1.50 2.22 21.0 30.5% 0.19
2 1155011012624 1.42 3.33 19.0 43.7% 0.12
3 1155013016274 1.56 1.11 34.0 23.7% 0.39
4 1155010026471 1.56 2.22 21.0 29.3% 0.20
5 1155011027488 0.94 0.40 28.0 11.7% 0.65
6 1155011027780 1.46 1.11 34.0 25.4% 0.37
7 1155012029933 1.05 1.43 25.0 33.4% 0.20
8 1155012013466 1.02 0.83 37.0 29.6% 0.34
9 1155011011569 0.79 0.45 28.0 15.6% 0.49
10 1155011029676 1.30 3.30 15.0 37.4% 0.11
11 1155010017229 1.48 3.16 18.0 37.7% 0.13
12 1155011027488 1.80 3.90 20.0 42.5% 0.13
13 1155737004411 2.40 2.10 34.0 29.2% 0.32
14 1155733013087 1.01 0.31 38.0 11.4% 0.91
15 1155731018133 1.30 1.59 24.0 28.8% 0.23
16 1155732011743 1.10 0.83 37.0 27.4% 0.37
17 1155733006841 0.96 1.67 16.0 27.3% 0.16
18 1155733007122 2.10 4.00 26.0 48.6% 0.15
19 1155732012415 1.20 2.22 16.0 29.0% 0.15
20 1155732022011 1.14 2.60 17.0 38.0% 0.12
21 1155672000029 3.90 7.40 25.0 46.5% 0.15
22 1155670006005 3.90 3.80 29.0 27.7% 0.29
23 1155670013900 4.80 4.10 27.0 22.6% 0.33
24 1155670010745 4.90 4.00 27.0 21.6% 0.34
25 1155671001665 2.80 5.60 25.0 49.1% 0.14
26 1155671005035 4.40 5.00 18.0 20.1% 0.24
27 1155670013412 1.40 2.10 19.0 28.0% 0.19
28 1155480019031 0.96 0.53 31.0 16.8% 0.50
29 1155482033984 0.86 1.67 12.0 22.9% 0.14
30 1155483013862 0.68 1.00 11.0 15.9% 0.19
31 1156183033719 1.29 2.11 17.0 27.3% 0.17
32 1156189035187 1.12 1.12 23.0 22.6% 0.28
33 1156182004206 1.20 2.22 16.0 29.0% 0.15
34 1156180031811 1.10 0.52 27.0 12.5% 0.59
35 1156181007645 1.32 2.22 17.0 28.0% 0.17
36 1156183011927 1.30 1.13 34.0 29.0% 0.32
37 1156181002910 1.24 3.90 10.0 30.9% 0.09
38 1156181008670 0.85 0.93 24.0 25.8% 0.25
39 1156180003124 1.93 1.01 35.0 18.0% 0.53
40 1156182023010 1.36 4.20 13.0 39.4% 0.09
41 1156183002300 1.20 3.70 13.0 39.3% 0.09
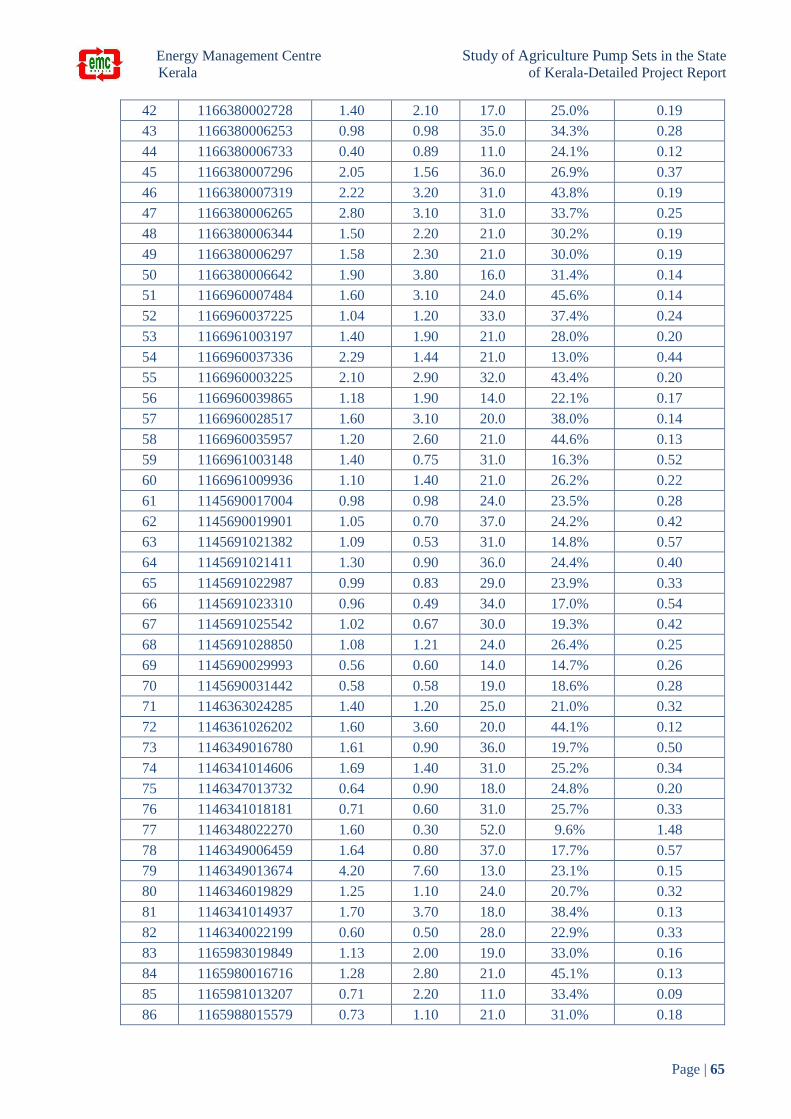
Energy Management Centre Study of Agriculture Pump Sets in the State
Kerala of Kerala-Detailed Project Report
Page | 65
42 1166380002728 1.40 2.10 17.0 25.0% 0.19
43 1166380006253 0.98 0.98 35.0 34.3% 0.28
44 1166380006733 0.40 0.89 11.0 24.1% 0.12
45 1166380007296 2.05 1.56 36.0 26.9% 0.37
46 1166380007319 2.22 3.20 31.0 43.8% 0.19
47 1166380006265 2.80 3.10 31.0 33.7% 0.25
48 1166380006344 1.50 2.20 21.0 30.2% 0.19
49 1166380006297 1.58 2.30 21.0 30.0% 0.19
50 1166380006642 1.90 3.80 16.0 31.4% 0.14
51 1166960007484 1.60 3.10 24.0 45.6% 0.14
52 1166960037225 1.04 1.20 33.0 37.4% 0.24
53 1166961003197 1.40 1.90 21.0 28.0% 0.20
54 1166960037336 2.29 1.44 21.0 13.0% 0.44
55 1166960003225 2.10 2.90 32.0 43.4% 0.20
56 1166960039865 1.18 1.90 14.0 22.1% 0.17
57 1166960028517 1.60 3.10 20.0 38.0% 0.14
58 1166960035957 1.20 2.60 21.0 44.6% 0.13
59 1166961003148 1.40 0.75 31.0 16.3% 0.52
60 1166961009936 1.10 1.40 21.0 26.2% 0.22
61 1145690017004 0.98 0.98 24.0 23.5% 0.28
62 1145690019901 1.05 0.70 37.0 24.2% 0.42
63 1145691021382 1.09 0.53 31.0 14.8% 0.57
64 1145691021411 1.30 0.90 36.0 24.4% 0.40
65 1145691022987 0.99 0.83 29.0 23.9% 0.33
66 1145691023310 0.96 0.49 34.0 17.0% 0.54
67 1145691025542 1.02 0.67 30.0 19.3% 0.42
68 1145691028850 1.08 1.21 24.0 26.4% 0.25
69 1145690029993 0.56 0.60 14.0 14.7% 0.26
70 1145690031442 0.58 0.58 19.0 18.6% 0.28
71 1146363024285 1.40 1.20 25.0 21.0% 0.32
72 1146361026202 1.60 3.60 20.0 44.1% 0.12
73 1146349016780 1.61 0.90 36.0 19.7% 0.50
74 1146341014606 1.69 1.40 31.0 25.2% 0.34
75 1146347013732 0.64 0.90 18.0 24.8% 0.20
76 1146341018181 0.71 0.60 31.0 25.7% 0.33
77 1146348022270 1.60 0.30 52.0 9.6% 1.48
78 1146349006459 1.64 0.80 37.0 17.7% 0.57
79 1146349013674 4.20 7.60 13.0 23.1% 0.15
80 1146346019829 1.25 1.10 24.0 20.7% 0.32
81 1146341014937 1.70 3.70 18.0 38.4% 0.13
82 1146340022199 0.60 0.50 28.0 22.9% 0.33
83 1165983019849 1.13 2.00 19.0 33.0% 0.16
84 1165980016716 1.28 2.80 21.0 45.1% 0.13
85 1165981013207 0.71 2.20 11.0 33.4% 0.09
86 1165988015579 0.73 1.10 21.0 31.0% 0.18
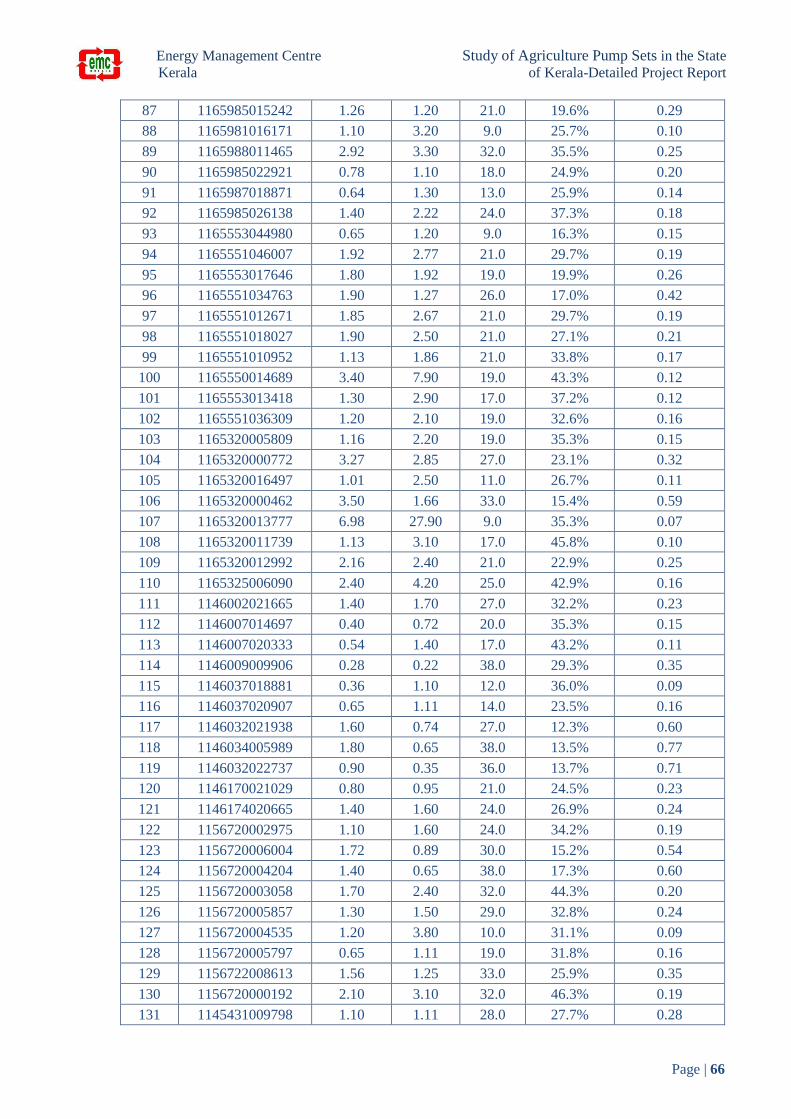
Energy Management Centre Study of Agriculture Pump Sets in the State
Kerala of Kerala-Detailed Project Report
Page | 66
87 1165985015242 1.26 1.20 21.0 19.6% 0.29
88 1165981016171 1.10 3.20 9.0 25.7% 0.10
89 1165988011465 2.92 3.30 32.0 35.5% 0.25
90 1165985022921 0.78 1.10 18.0 24.9% 0.20
91 1165987018871 0.64 1.30 13.0 25.9% 0.14
92 1165985026138 1.40 2.22 24.0 37.3% 0.18
93 1165553044980 0.65 1.20 9.0 16.3% 0.15
94 1165551046007 1.92 2.77 21.0 29.7% 0.19
95 1165553017646 1.80 1.92 19.0 19.9% 0.26
96 1165551034763 1.90 1.27 26.0 17.0% 0.42
97 1165551012671 1.85 2.67 21.0 29.7% 0.19
98 1165551018027 1.90 2.50 21.0 27.1% 0.21
99 1165551010952 1.13 1.86 21.0 33.8% 0.17
100 1165550014689 3.40 7.90 19.0 43.3% 0.12
101 1165553013418 1.30 2.90 17.0 37.2% 0.12
102 1165551036309 1.20 2.10 19.0 32.6% 0.16
103 1165320005809 1.16 2.20 19.0 35.3% 0.15
104 1165320000772 3.27 2.85 27.0 23.1% 0.32
105 1165320016497 1.01 2.50 11.0 26.7% 0.11
106 1165320000462 3.50 1.66 33.0 15.4% 0.59
107 1165320013777 6.98 27.90 9.0 35.3% 0.07
108 1165320011739 1.13 3.10 17.0 45.8% 0.10
109 1165320012992 2.16 2.40 21.0 22.9% 0.25
110 1165325006090 2.40 4.20 25.0 42.9% 0.16
111 1146002021665 1.40 1.70 27.0 32.2% 0.23
112 1146007014697 0.40 0.72 20.0 35.3% 0.15
113 1146007020333 0.54 1.40 17.0 43.2% 0.11
114 1146009009906 0.28 0.22 38.0 29.3% 0.35
115 1146037018881 0.36 1.10 12.0 36.0% 0.09
116 1146037020907 0.65 1.11 14.0 23.5% 0.16
117 1146032021938 1.60 0.74 27.0 12.3% 0.60
118 1146034005989 1.80 0.65 38.0 13.5% 0.77
119 1146032022737 0.90 0.35 36.0 13.7% 0.71
120 1146170021029 0.80 0.95 21.0 24.5% 0.23
121 1146174020665 1.40 1.60 24.0 26.9% 0.24
122 1156720002975 1.10 1.60 24.0 34.2% 0.19
123 1156720006004 1.72 0.89 30.0 15.2% 0.54
124 1156720004204 1.40 0.65 38.0 17.3% 0.60
125 1156720003058 1.70 2.40 32.0 44.3% 0.20
126 1156720005857 1.30 1.50 29.0 32.8% 0.24
127 1156720004535 1.20 3.80 10.0 31.1% 0.09
128 1156720005797 0.65 1.11 19.0 31.8% 0.16
129 1156722008613 1.56 1.25 33.0 25.9% 0.35
130 1156720000192 2.10 3.10 32.0 46.3% 0.19
131 1145431009798 1.10 1.11 28.0 27.7% 0.28

Energy Management Centre Study of Agriculture Pump Sets in the State
Kerala of Kerala-Detailed Project Report
Page | 67
132 1145430013470 0.90 0.29 36.0 11.4% 0.86
133 1145430019904 1.04 0.48 31.0 14.0% 0.60
134 1145430010432 1.25 2.00 22.0 34.5% 0.17
135 1145431021063 2.27 1.82 22.0 17.3% 0.35
136 1145431012127 1.64 2.10 22.0 27.6% 0.22
137 1145430012039 1.06 1.03 25.0 23.8% 0.29
138 1145430006698 1.40 1.33 23.0 21.4% 0.29
139 1145431009957 1.40 2.30 15.0 24.2% 0.17
140 1145430024170 3.80 6.90 15.0 26.7% 0.15
141 1167821010562 7.40 4.17 30.0 16.6% 0.49
142 1167820001495 1.03 1.50 22.0 31.4% 0.19
143 1167820010418 0.98 1.20 25.0 30.0% 0.23
144 1167823010385 5.78 5.55 19.0 17.9% 0.29
145 1167823010474 7.90 6.00 32.0 23.8% 0.37
146 1167820010586 8.40 11.40 11.0 14.6% 0.20
147 1167821012408 1.23 2.20 16.0 28.1% 0.16
148 1167821014450 1.77 1.45 25.0 20.1% 0.34
149 1167821010166 1.39 1.91 21.0 28.3% 0.20
150 1167821011726 1.60 0.90 36.0 19.9% 0.49
8.20 The inverse relation between the overall efficiency and the specific Power
consumption (kWh/m3) of pumping system is plotted and given below:
Figure 9 Relationship between Overall efficiency & Specific Power Consumption
8.21 Major observations during the site study are listed below
8.21.1 Mono block pump sets are installed by most of the consumers. Submersible pump sets
are also installed in some of the open wells & bore wells. In case of agriculture pumps,
physical accurate head measurement was not possible.
8.21.2 Flexible P.V.C. pipes were commonly used for both suction and delivery sides.
0.00
0.20
0.40
0.60
0.80
1.00
1.20
1.40
1.60
0.0%
10.0%
20.0%
30.0%
40.0%
50.0%
60.0%
Sp
ecif
ic C
onsu
mp
tio
n
(kW
h/m
3)
Over
all
Eff
icie
ncy
(%
)
Overall Efficiency kWh/m3
Energy Management Centre Study of Agriculture Pump Sets in the State
Kerala of Kerala-Detailed Project Report
Page | 68
8.21.3 The nameplate details of the submersible and most of the aged Mono block pumps are
not available.
8.21.4 The workmanship quality for pump set installation was poor.
8.22 Observations: Factors effecting the overall efficiency of agriculture pumps
8.22.1 Actual Pump set rating higher than name plate rating and sanctioned load: It is a
observed that even though sanctioned demand is 3 HP or 5 HP, power rating of most
of the pump sets is higher than sanctioned demand. The reason for measured power
consumption rating higher than sanctioned demand is that most of the farmers have
rewound the pump sets suitably to draw more power and deliver higher water discharge.
Since farmers are not charged for energy consumption. This is the major reason for no
encouragement for deployment of more efficient pumps. It is difficult to make the
farmers agree to have their pumps replaced, as it requires repeated efforts to make the
farmers fully conversant to the objectives of the project.
8.22.2 It is also observed that the power consumption of the most of locally made lower rated
pumps is much higher than the name plate rated capacity. Even though it will give
higher flow the operating efficiency will be very low. This will have an inverse effect
to the energy efficient pump promotion as the farmers are comparing the pump with
low rate high flow parameter.
8.22.3 Mismatching pump and system Head-Flow characteristic: - The pump efficiency
varies with flow and pressure and it is highest at one particular flow rate. When a pump
is installed in a system, the operating point will always be intersecting point of two
curves (pump and system curves). The pumps are operating at efficiencies less than the
optimum efficiency because the units are not operating in the high efficiency range of
Q and H. In the above scenario pumps are not operated at the BEP which results in the
deviation in the characteristic curve his results in the lower efficiency than rated. This
is mainly due to the improper selection of the pumps. Oversized pumps are main
reasons for the curve shifting. Due to the variation in the water level seasonally, the
pumps are selected considering the worst scenario.
8.23 There are various parameters that could affect the pump set efficiency performance.
Parameters identified that could affect the pump performance are listed below and
discussed in detail in subsequent sections,
Energy inefficient pump sets
Improper pump selection and usage
Undersized pipes
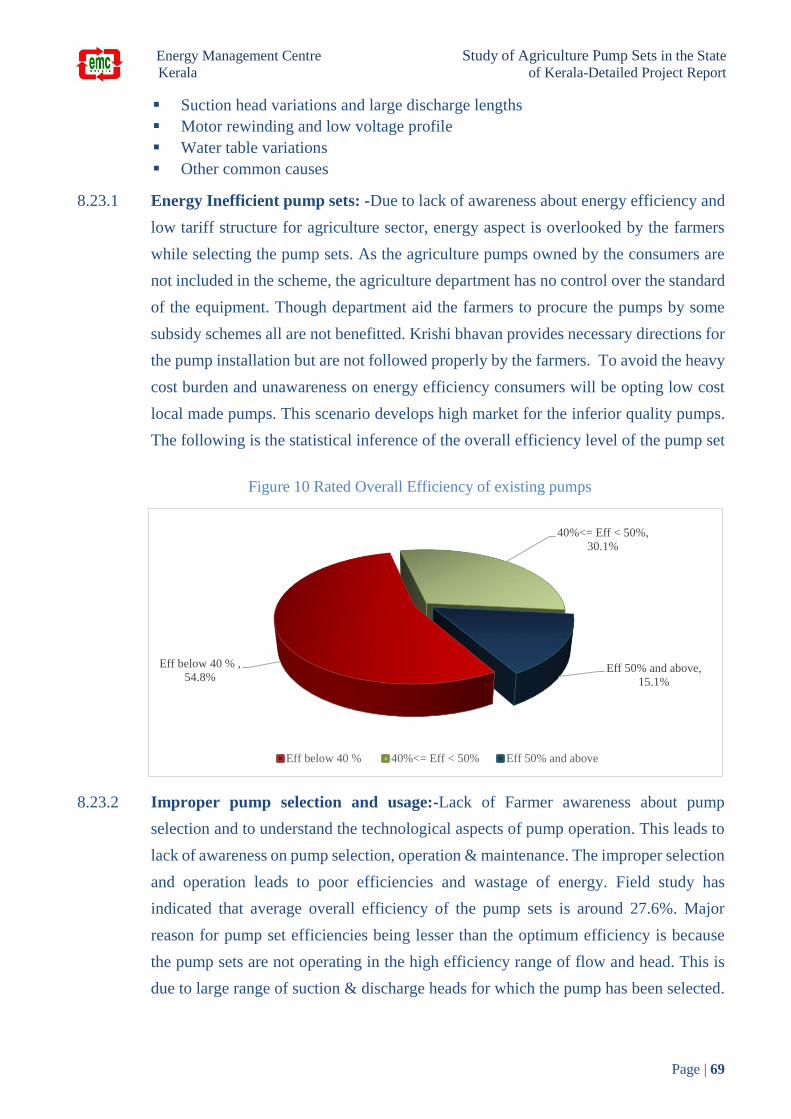
Energy Management Centre Study of Agriculture Pump Sets in the State
Kerala of Kerala-Detailed Project Report
Page | 69
Suction head variations and large discharge lengths
Motor rewinding and low voltage profile
Water table variations
Other common causes
8.23.1 Energy Inefficient pump sets: -Due to lack of awareness about energy efficiency and
low tariff structure for agriculture sector, energy aspect is overlooked by the farmers
while selecting the pump sets. As the agriculture pumps owned by the consumers are
not included in the scheme, the agriculture department has no control over the standard
of the equipment. Though department aid the farmers to procure the pumps by some
subsidy schemes all are not benefitted. Krishi bhavan provides necessary directions for
the pump installation but are not followed properly by the farmers. To avoid the heavy
cost burden and unawareness on energy efficiency consumers will be opting low cost
local made pumps. This scenario develops high market for the inferior quality pumps.
The following is the statistical inference of the overall efficiency level of the pump set
Figure 10 Rated Overall Efficiency of existing pumps
8.23.2 Improper pump selection and usage:-Lack of Farmer awareness about pump
selection and to understand the technological aspects of pump operation. This leads to
lack of awareness on pump selection, operation & maintenance. The improper selection
and operation leads to poor efficiencies and wastage of energy. Field study has
indicated that average overall efficiency of the pump sets is around 27.6%. Major
reason for pump set efficiencies being lesser than the optimum efficiency is because
the pump sets are not operating in the high efficiency range of flow and head. This is
due to large range of suction & discharge heads for which the pump has been selected.
Eff below 40 % ,
54.8%
40%<= Eff < 50%,
30.1%
Eff 50% and above,
15.1%
Eff below 40 % 40%<= Eff < 50% Eff 50% and above

Energy Management Centre Study of Agriculture Pump Sets in the State
Kerala of Kerala-Detailed Project Report
Page | 70
8.23.3 Improper sizing of pipes: -Efficiency of pumping system is a function of efficiency
of the system components, i.e. ƞ system = ƒ (ƞ Pump-set , ƞ Piping).Sizing of the pipes
for the system is also a major factor influencing the efficiency of the overall system is
due to the inverse relationship between the pipe dia. and frictional loss. The intersecting
point between the economy curve and the friction curve is considered to be the pipe
selection criteria. The undersized pipes in the system reduce the initial cost but increase
the head loss. The oversized pipe dia reduces the frictional loss but increases the initial
cost also the increases the power consumption. The improper selection of the pipe dia
will affect the operating curve of the pump. The survey indicates 55% of the pumping
systems are provided with improper pipe configuration.
Figure 11 Sizing of the pipelines for Existing Pumps
8.23.4 Rewinding of motors: -It is common practice to rewind burnt-out motors. Careful
rewinding can sometimes maintain motor efficiency at previous levels, but in most
cases, losses in efficiency result. Rewinding can affect a number of factors that
contribute to deteriorated motor efficiency: winding and slot design, winding material,
insulation performance, and operating temperature. However, if proper measures are
taken, motor efficiency can be maintained, and in some cases increased, after
rewinding. From the survey, it is identified that18% of the sampled pumps were
rewounded more than 2 times
Improper sizing55%
proper sizing45%
Improper sizing proper sizing

Energy Management Centre Study of Agriculture Pump Sets in the State
Kerala of Kerala-Detailed Project Report
Page | 71
Figure 12 Rewinding Motors of existing Pump sets
The efficiency of a pump set also varies with input voltage. Low power supply often,
leads to motor burnouts and several hours of downtime for maintenance & repair. The
efficiency and life of a motor can be increased by achieving low iron loss, copper loss,
windage loss and suitability for operation at low voltage levels. Hence motors for
agriculture pumps are always designed for a wide voltage band. The improvement in
the quality of power in terms of frequency and supply voltage by fully implementing
HVDS can significantly improve pump set efficiency and realize energy savings. The
efficiency of motors in EEPS is higher due to low iron, copper & windage losses. Better
design and quality control have resulted in development of energy efficient pump sets.
To overcome the issues of lower voltage operation, the new motors are also designed
for a voltage fluctuation between 300 V to 440 V.
8.23.5 Inferior quality network: -The fittings provided by most of the farmers are very poor
resulting in large losses and leakage. Head losses in a poor quality foot valves are high.
An efficient low friction ISI mark foot-valve, though slightly costlier, pays back fast
the extra cost by saving. Similarly the head loss in the sharp bends are also high. The
farmers are mostly ignorant about the operational quality of the components. Low
friction pipe (HDPE) network can also reduce the friction loss, eventually improves the
efficiency of the system. Also proper pipe layout reduces the length and reduces friction
loss.
The energy requirement of a pumping system operating over a period of time ‘t’ can be
expressed as,
𝐸𝑝 = 𝑡 𝑥 𝑄 𝑥 ∆𝑝
η
Where,
t = time (sec)
Q = volume flow rate (m3/sec)
Rewinded motors
19%
Non rewinded motors
81%
Rewinded motors Non rewinded motors

Energy Management Centre Study of Agriculture Pump Sets in the State
Kerala of Kerala-Detailed Project Report
Page | 72
ΔP = total pressure drop (m)
η = motor pump set efficiency
Assuming that the only losses are due to friction, ΔP is proportional to the square of
volume flow (ΔP ~ Q2). Therefore, the power required to overcome friction increases
as the cube of the volume flow. This relationship can be used to quantify the effect of
diameter on energy costs. For a given volume flow rate, the above expression for (ΔP)
indicates that pumping energy is inversely proportional to piping diameter raised to the
5th power and directly proportional to friction factor. Since the friction factor also has
a slight dependence on diameter, the pumping energy required to overcome friction in
piping for different diameter is,
𝐸𝑃1
𝐸𝑃2= (
𝐷2
𝐷1)4.84
As per the Darcy Weichbach equation for frictional factor (Hf) estimation for frictional
loss to be minimum pipe diameter should be as large as possible. The suction pipe
length should be short, just adequate to keep the foot valve submerged and straight with
minimum bends. Bends wherever unavoidable, should be of long radius. The
coefficient of friction is less in case of PVC pipes. The friction loss will increase
drastically in GI pipes, as they are prone to corrosion as compared to PVC pipes. The
latest low friction loss PVC pipes will be installed in place of GI pipes, wherever
applicable, to reduce the frictional loss on a sustained basis. The problems of erosion,
corrosion and resultant clogging will also be avoided.
Most farmers are using PVC pipeline and the details is given below:
Figure 13 Pipe Type for Existing pump sets
PVC Pipes
98%
Non PVC Pipes
2%
PVC Pipes Non PVC Pipes
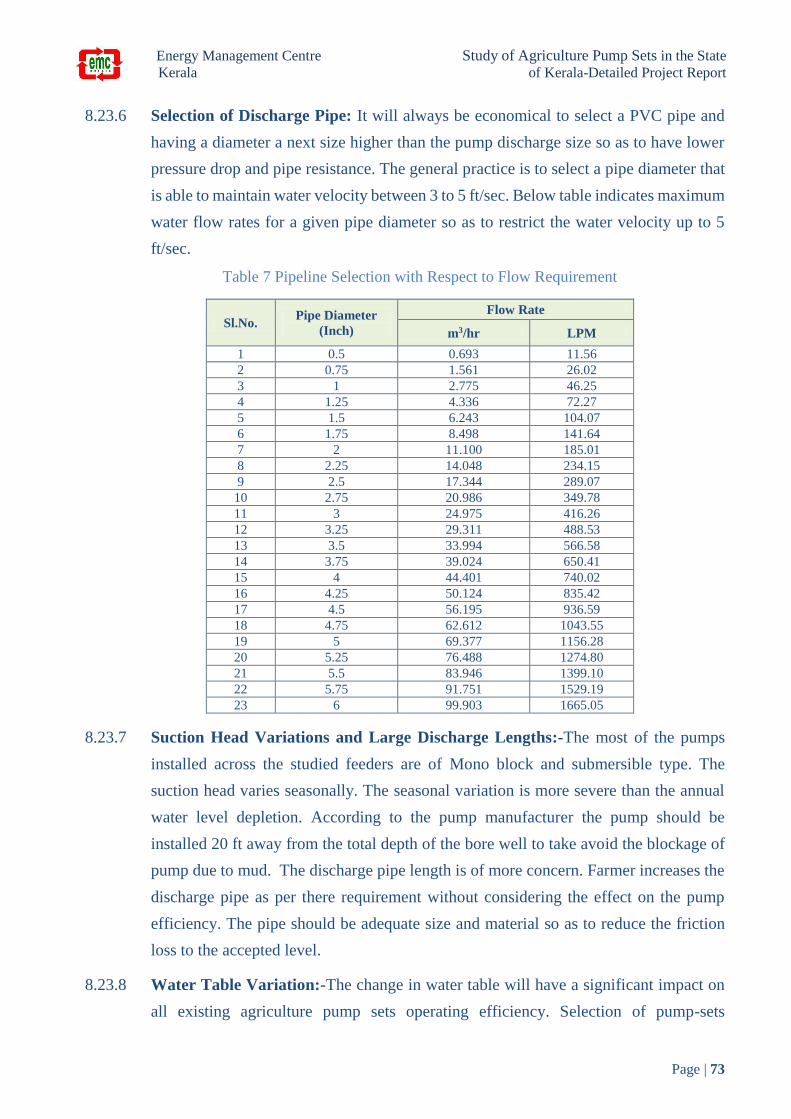
Energy Management Centre Study of Agriculture Pump Sets in the State
Kerala of Kerala-Detailed Project Report
Page | 73
8.23.6 Selection of Discharge Pipe: It will always be economical to select a PVC pipe and
having a diameter a next size higher than the pump discharge size so as to have lower
pressure drop and pipe resistance. The general practice is to select a pipe diameter that
is able to maintain water velocity between 3 to 5 ft/sec. Below table indicates maximum
water flow rates for a given pipe diameter so as to restrict the water velocity up to 5
ft/sec.
Table 7 Pipeline Selection with Respect to Flow Requirement
Sl.No. Pipe Diameter
(Inch)
Flow Rate
m3/hr LPM
1 0.5 0.693 11.56
2 0.75 1.561 26.02
3 1 2.775 46.25
4 1.25 4.336 72.27
5 1.5 6.243 104.07
6 1.75 8.498 141.64
7 2 11.100 185.01
8 2.25 14.048 234.15
9 2.5 17.344 289.07
10 2.75 20.986 349.78
11 3 24.975 416.26
12 3.25 29.311 488.53
13 3.5 33.994 566.58
14 3.75 39.024 650.41
15 4 44.401 740.02
16 4.25 50.124 835.42
17 4.5 56.195 936.59
18 4.75 62.612 1043.55
19 5 69.377 1156.28
20 5.25 76.488 1274.80
21 5.5 83.946 1399.10
22 5.75 91.751 1529.19
23 6 99.903 1665.05
8.23.7 Suction Head Variations and Large Discharge Lengths:-The most of the pumps
installed across the studied feeders are of Mono block and submersible type. The
suction head varies seasonally. The seasonal variation is more severe than the annual
water level depletion. According to the pump manufacturer the pump should be
installed 20 ft away from the total depth of the bore well to take avoid the blockage of
pump due to mud. The discharge pipe length is of more concern. Farmer increases the
discharge pipe as per there requirement without considering the effect on the pump
efficiency. The pipe should be adequate size and material so as to reduce the friction
loss to the accepted level.
8.23.8 Water Table Variation:-The change in water table will have a significant impact on
all existing agriculture pump sets operating efficiency. Selection of pump-sets
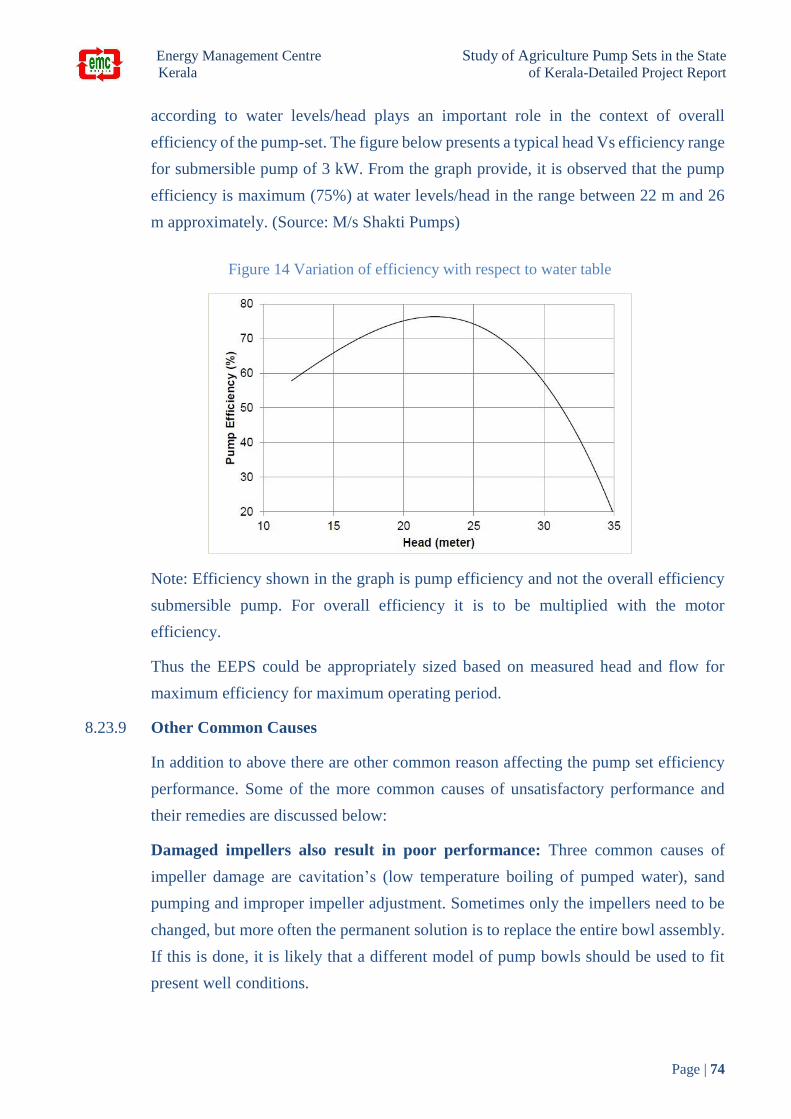
Energy Management Centre Study of Agriculture Pump Sets in the State
Kerala of Kerala-Detailed Project Report
Page | 74
according to water levels/head plays an important role in the context of overall
efficiency of the pump-set. The figure below presents a typical head Vs efficiency range
for submersible pump of 3 kW. From the graph provide, it is observed that the pump
efficiency is maximum (75%) at water levels/head in the range between 22 m and 26
m approximately. (Source: M/s Shakti Pumps)
Figure 14 Variation of efficiency with respect to water table
Note: Efficiency shown in the graph is pump efficiency and not the overall efficiency
submersible pump. For overall efficiency it is to be multiplied with the motor
efficiency.
Thus the EEPS could be appropriately sized based on measured head and flow for
maximum efficiency for maximum operating period.
8.23.9 Other Common Causes
In addition to above there are other common reason affecting the pump set efficiency
performance. Some of the more common causes of unsatisfactory performance and
their remedies are discussed below:
Damaged impellers also result in poor performance: Three common causes of
impeller damage are cavitation’s (low temperature boiling of pumped water), sand
pumping and improper impeller adjustment. Sometimes only the impellers need to be
changed, but more often the permanent solution is to replace the entire bowl assembly.
If this is done, it is likely that a different model of pump bowls should be used to fit
present well conditions.
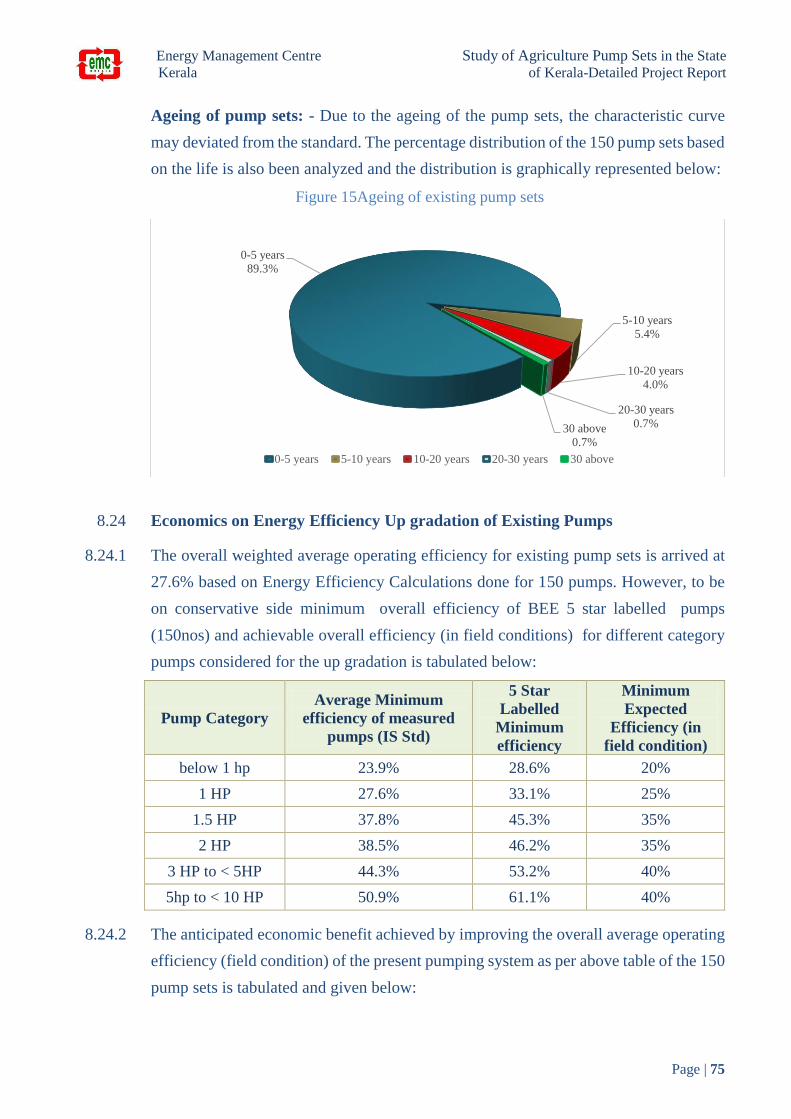
Energy Management Centre Study of Agriculture Pump Sets in the State
Kerala of Kerala-Detailed Project Report
Page | 75
Ageing of pump sets: - Due to the ageing of the pump sets, the characteristic curve
may deviated from the standard. The percentage distribution of the 150 pump sets based
on the life is also been analyzed and the distribution is graphically represented below:
Figure 15Ageing of existing pump sets
8.24 Economics on Energy Efficiency Up gradation of Existing Pumps
8.24.1 The overall weighted average operating efficiency for existing pump sets is arrived at
27.6% based on Energy Efficiency Calculations done for 150 pumps. However, to be
on conservative side minimum overall efficiency of BEE 5 star labelled pumps
(150nos) and achievable overall efficiency (in field conditions) for different category
pumps considered for the up gradation is tabulated below:
Pump Category
Average Minimum
efficiency of measured
pumps (IS Std)
5 Star
Labelled
Minimum
efficiency
Minimum
Expected
Efficiency (in
field condition)
below 1 hp 23.9% 28.6% 20%
1 HP 27.6% 33.1% 25%
1.5 HP 37.8% 45.3% 35%
2 HP 38.5% 46.2% 35%
3 HP to < 5HP 44.3% 53.2% 40%
5hp to < 10 HP 50.9% 61.1% 40%
8.24.2 The anticipated economic benefit achieved by improving the overall average operating
efficiency (field condition) of the present pumping system as per above table of the 150
pump sets is tabulated and given below:
0-5 years
89.3%
5-10 years
5.4%
10-20 years
4.0%
20-30 years
0.7%30 above
0.7%
0-5 years 5-10 years 10-20 years 20-30 years 30 above
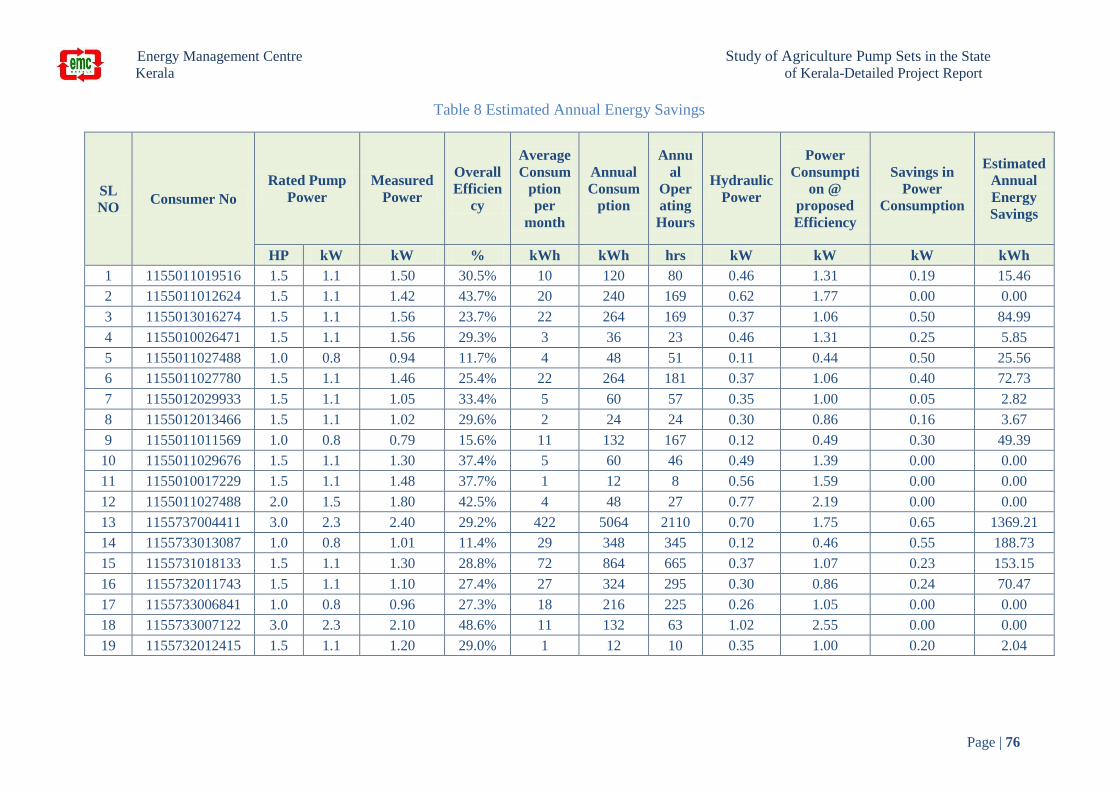
Energy Management Centre Study of Agriculture Pump Sets in the State
Kerala of Kerala-Detailed Project Report
Page | 76
Table 8 Estimated Annual Energy Savings
SL
NO Consumer No
Rated Pump
Power
Measured
Power
Overall
Efficien
cy
Average
Consum
ption
per
month
Annual
Consum
ption
Annu
al
Oper
ating
Hours
Hydraulic
Power
Power
Consumpti
on @
proposed
Efficiency
Savings in
Power
Consumption
Estimated
Annual
Energy
Savings
HP kW kW % kWh kWh hrs kW kW kW kWh
1 1155011019516 1.5 1.1 1.50 30.5% 10 120 80 0.46 1.31 0.19 15.46
2 1155011012624 1.5 1.1 1.42 43.7% 20 240 169 0.62 1.77 0.00 0.00
3 1155013016274 1.5 1.1 1.56 23.7% 22 264 169 0.37 1.06 0.50 84.99
4 1155010026471 1.5 1.1 1.56 29.3% 3 36 23 0.46 1.31 0.25 5.85
5 1155011027488 1.0 0.8 0.94 11.7% 4 48 51 0.11 0.44 0.50 25.56
6 1155011027780 1.5 1.1 1.46 25.4% 22 264 181 0.37 1.06 0.40 72.73
7 1155012029933 1.5 1.1 1.05 33.4% 5 60 57 0.35 1.00 0.05 2.82
8 1155012013466 1.5 1.1 1.02 29.6% 2 24 24 0.30 0.86 0.16 3.67
9 1155011011569 1.0 0.8 0.79 15.6% 11 132 167 0.12 0.49 0.30 49.39
10 1155011029676 1.5 1.1 1.30 37.4% 5 60 46 0.49 1.39 0.00 0.00
11 1155010017229 1.5 1.1 1.48 37.7% 1 12 8 0.56 1.59 0.00 0.00
12 1155011027488 2.0 1.5 1.80 42.5% 4 48 27 0.77 2.19 0.00 0.00
13 1155737004411 3.0 2.3 2.40 29.2% 422 5064 2110 0.70 1.75 0.65 1369.21
14 1155733013087 1.0 0.8 1.01 11.4% 29 348 345 0.12 0.46 0.55 188.73
15 1155731018133 1.5 1.1 1.30 28.8% 72 864 665 0.37 1.07 0.23 153.15
16 1155732011743 1.5 1.1 1.10 27.4% 27 324 295 0.30 0.86 0.24 70.47
17 1155733006841 1.0 0.8 0.96 27.3% 18 216 225 0.26 1.05 0.00 0.00
18 1155733007122 3.0 2.3 2.10 48.6% 11 132 63 1.02 2.55 0.00 0.00
19 1155732012415 1.5 1.1 1.20 29.0% 1 12 10 0.35 1.00 0.20 2.04
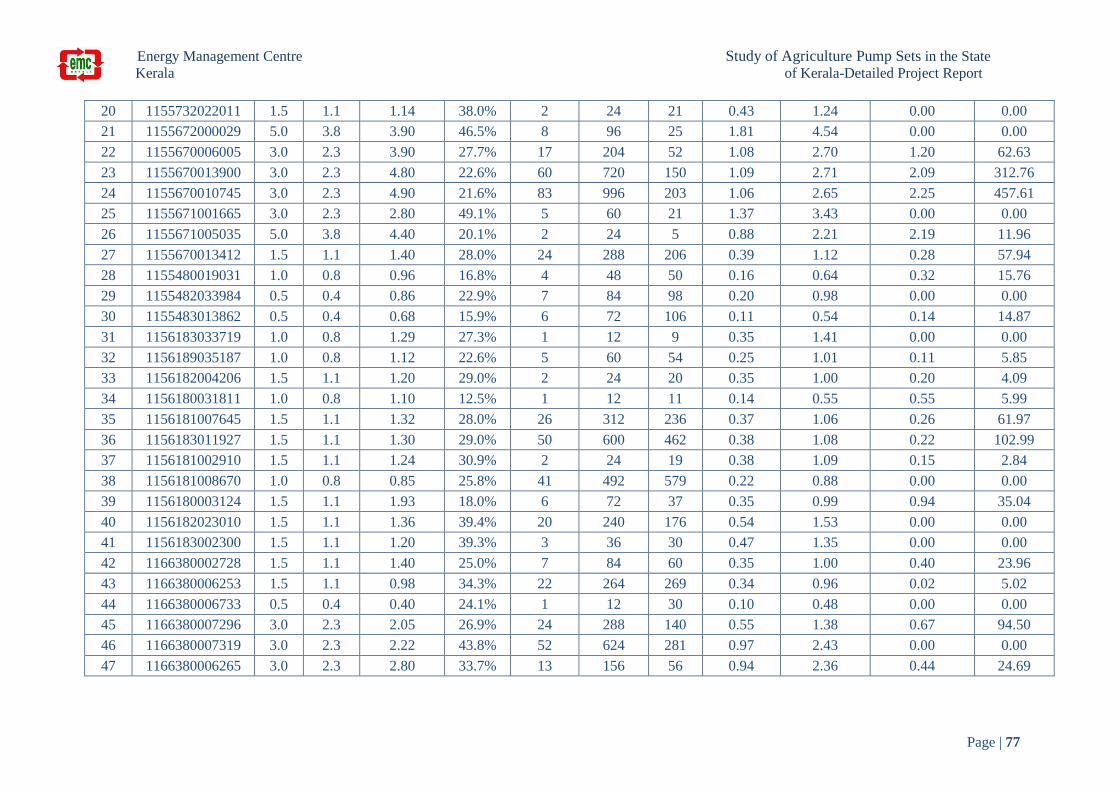
Energy Management Centre Study of Agriculture Pump Sets in the State
Kerala of Kerala-Detailed Project Report
Page | 77
20 1155732022011 1.5 1.1 1.14 38.0% 2 24 21 0.43 1.24 0.00 0.00
21 1155672000029 5.0 3.8 3.90 46.5% 8 96 25 1.81 4.54 0.00 0.00
22 1155670006005 3.0 2.3 3.90 27.7% 17 204 52 1.08 2.70 1.20 62.63
23 1155670013900 3.0 2.3 4.80 22.6% 60 720 150 1.09 2.71 2.09 312.76
24 1155670010745 3.0 2.3 4.90 21.6% 83 996 203 1.06 2.65 2.25 457.61
25 1155671001665 3.0 2.3 2.80 49.1% 5 60 21 1.37 3.43 0.00 0.00
26 1155671005035 5.0 3.8 4.40 20.1% 2 24 5 0.88 2.21 2.19 11.96
27 1155670013412 1.5 1.1 1.40 28.0% 24 288 206 0.39 1.12 0.28 57.94
28 1155480019031 1.0 0.8 0.96 16.8% 4 48 50 0.16 0.64 0.32 15.76
29 1155482033984 0.5 0.4 0.86 22.9% 7 84 98 0.20 0.98 0.00 0.00
30 1155483013862 0.5 0.4 0.68 15.9% 6 72 106 0.11 0.54 0.14 14.87
31 1156183033719 1.0 0.8 1.29 27.3% 1 12 9 0.35 1.41 0.00 0.00
32 1156189035187 1.0 0.8 1.12 22.6% 5 60 54 0.25 1.01 0.11 5.85
33 1156182004206 1.5 1.1 1.20 29.0% 2 24 20 0.35 1.00 0.20 4.09
34 1156180031811 1.0 0.8 1.10 12.5% 1 12 11 0.14 0.55 0.55 5.99
35 1156181007645 1.5 1.1 1.32 28.0% 26 312 236 0.37 1.06 0.26 61.97
36 1156183011927 1.5 1.1 1.30 29.0% 50 600 462 0.38 1.08 0.22 102.99
37 1156181002910 1.5 1.1 1.24 30.9% 2 24 19 0.38 1.09 0.15 2.84
38 1156181008670 1.0 0.8 0.85 25.8% 41 492 579 0.22 0.88 0.00 0.00
39 1156180003124 1.5 1.1 1.93 18.0% 6 72 37 0.35 0.99 0.94 35.04
40 1156182023010 1.5 1.1 1.36 39.4% 20 240 176 0.54 1.53 0.00 0.00
41 1156183002300 1.5 1.1 1.20 39.3% 3 36 30 0.47 1.35 0.00 0.00
42 1166380002728 1.5 1.1 1.40 25.0% 7 84 60 0.35 1.00 0.40 23.96
43 1166380006253 1.5 1.1 0.98 34.3% 22 264 269 0.34 0.96 0.02 5.02
44 1166380006733 0.5 0.4 0.40 24.1% 1 12 30 0.10 0.48 0.00 0.00
45 1166380007296 3.0 2.3 2.05 26.9% 24 288 140 0.55 1.38 0.67 94.50
46 1166380007319 3.0 2.3 2.22 43.8% 52 624 281 0.97 2.43 0.00 0.00
47 1166380006265 3.0 2.3 2.80 33.7% 13 156 56 0.94 2.36 0.44 24.69
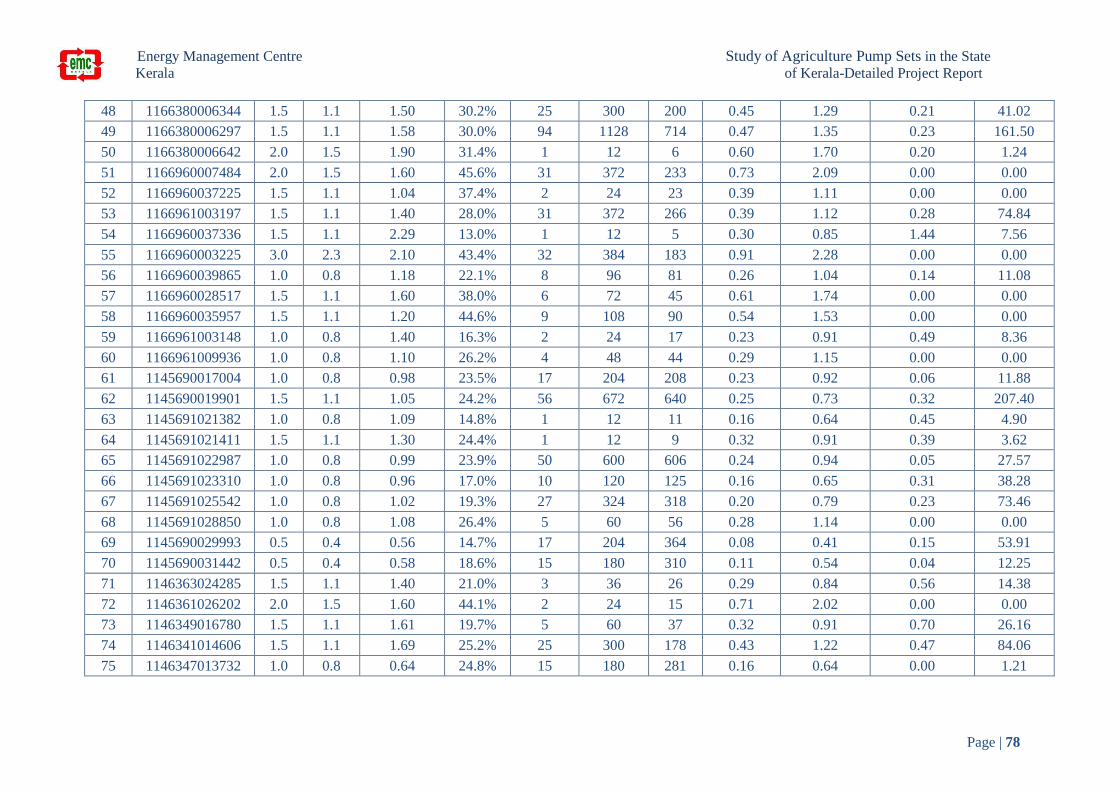
Energy Management Centre Study of Agriculture Pump Sets in the State
Kerala of Kerala-Detailed Project Report
Page | 78
48 1166380006344 1.5 1.1 1.50 30.2% 25 300 200 0.45 1.29 0.21 41.02
49 1166380006297 1.5 1.1 1.58 30.0% 94 1128 714 0.47 1.35 0.23 161.50
50 1166380006642 2.0 1.5 1.90 31.4% 1 12 6 0.60 1.70 0.20 1.24
51 1166960007484 2.0 1.5 1.60 45.6% 31 372 233 0.73 2.09 0.00 0.00
52 1166960037225 1.5 1.1 1.04 37.4% 2 24 23 0.39 1.11 0.00 0.00
53 1166961003197 1.5 1.1 1.40 28.0% 31 372 266 0.39 1.12 0.28 74.84
54 1166960037336 1.5 1.1 2.29 13.0% 1 12 5 0.30 0.85 1.44 7.56
55 1166960003225 3.0 2.3 2.10 43.4% 32 384 183 0.91 2.28 0.00 0.00
56 1166960039865 1.0 0.8 1.18 22.1% 8 96 81 0.26 1.04 0.14 11.08
57 1166960028517 1.5 1.1 1.60 38.0% 6 72 45 0.61 1.74 0.00 0.00
58 1166960035957 1.5 1.1 1.20 44.6% 9 108 90 0.54 1.53 0.00 0.00
59 1166961003148 1.0 0.8 1.40 16.3% 2 24 17 0.23 0.91 0.49 8.36
60 1166961009936 1.0 0.8 1.10 26.2% 4 48 44 0.29 1.15 0.00 0.00
61 1145690017004 1.0 0.8 0.98 23.5% 17 204 208 0.23 0.92 0.06 11.88
62 1145690019901 1.5 1.1 1.05 24.2% 56 672 640 0.25 0.73 0.32 207.40
63 1145691021382 1.0 0.8 1.09 14.8% 1 12 11 0.16 0.64 0.45 4.90
64 1145691021411 1.5 1.1 1.30 24.4% 1 12 9 0.32 0.91 0.39 3.62
65 1145691022987 1.0 0.8 0.99 23.9% 50 600 606 0.24 0.94 0.05 27.57
66 1145691023310 1.0 0.8 0.96 17.0% 10 120 125 0.16 0.65 0.31 38.28
67 1145691025542 1.0 0.8 1.02 19.3% 27 324 318 0.20 0.79 0.23 73.46
68 1145691028850 1.0 0.8 1.08 26.4% 5 60 56 0.28 1.14 0.00 0.00
69 1145690029993 0.5 0.4 0.56 14.7% 17 204 364 0.08 0.41 0.15 53.91
70 1145690031442 0.5 0.4 0.58 18.6% 15 180 310 0.11 0.54 0.04 12.25
71 1146363024285 1.5 1.1 1.40 21.0% 3 36 26 0.29 0.84 0.56 14.38
72 1146361026202 2.0 1.5 1.60 44.1% 2 24 15 0.71 2.02 0.00 0.00
73 1146349016780 1.5 1.1 1.61 19.7% 5 60 37 0.32 0.91 0.70 26.16
74 1146341014606 1.5 1.1 1.69 25.2% 25 300 178 0.43 1.22 0.47 84.06
75 1146347013732 1.0 0.8 0.64 24.8% 15 180 281 0.16 0.64 0.00 1.21

Energy Management Centre Study of Agriculture Pump Sets in the State
Kerala of Kerala-Detailed Project Report
Page | 79
76 1146341018181 1.0 0.8 0.71 25.7% 2 24 34 0.18 0.73 0.00 0.00
77 1146348022270 1.5 1.1 1.60 9.6% 35 420 263 0.15 0.44 1.16 305.22
78 1146349006459 1.5 1.1 1.64 17.7% 26 312 190 0.29 0.83 0.81 154.16
79 1146349013674 5.0 3.8 4.20 23.1% 1 12 3 0.97 2.42 1.78 5.08
80 1146346019829 1.0 0.8 1.25 20.7% 18 216 173 0.26 1.04 0.21 36.99
81 1146341014937 2.0 1.5 1.70 38.4% 1 12 7 0.65 1.87 0.00 0.00
82 1146340022199 0.5 0.4 0.60 22.9% 16 192 320 0.14 0.69 0.00 0.00
83 1165983019849 1.5 1.1 1.13 33.0% 3 36 32 0.37 1.07 0.06 2.07
84 1165980016716 1.5 1.1 1.28 45.1% 5 60 47 0.58 1.65 0.00 0.00
85 1165981013207 1.0 0.8 0.71 33.4% 3 36 51 0.24 0.95 0.00 0.00
86 1165988015579 1.0 0.8 0.73 31.0% 2 24 33 0.23 0.91 0.00 0.00
87 1165985015242 1.0 0.8 1.26 19.6% 2 24 19 0.25 0.99 0.27 5.16
88 1165981016171 1.0 0.8 1.10 25.7% 8 96 87 0.28 1.13 0.00 0.00
89 1165988011465 3.0 2.3 2.92 35.5% 9 108 37 1.04 2.59 0.33 12.21
90 1165985022921 1.0 0.8 0.78 24.9% 5 60 77 0.19 0.78 0.00 0.23
91 1165987018871 1.0 0.8 0.64 25.9% 3 36 56 0.17 0.66 0.00 0.00
92 1165985026138 2.0 1.5 1.40 37.3% 39 468 334 0.52 1.49 0.00 0.00
93 1165553044980 0.5 0.4 0.65 16.3% 6 72 111 0.11 0.53 0.12 13.32
94 1165551046007 1.5 1.1 1.92 29.7% 19 228 119 0.57 1.63 0.29 34.39
95 1165553017646 1.5 1.1 1.80 19.9% 2 24 13 0.36 1.02 0.78 10.37
96 1165551034763 1.5 1.1 1.90 17.0% 22 264 139 0.32 0.92 0.98 135.50
97 1165551012671 1.5 1.1 1.85 29.7% 2 24 13 0.55 1.57 0.28 3.61
98 1165551018027 1.5 1.1 1.90 27.1% 69 828 436 0.52 1.47 0.43 186.74
99 1165551010952 1.5 1.1 1.13 33.8% 8 96 85 0.38 1.09 0.04 3.16
100 1165550014689 5.0 3.8 3.40 43.3% 140 1680 494 1.47 3.68 0.00 0.00
101 1165553013418 1.5 1.1 1.30 37.2% 30 360 277 0.48 1.38 0.00 0.00
102 1165551036309 1.5 1.1 1.20 32.6% 19 228 190 0.39 1.12 0.08 15.52
103 1165320005809 3.0 2.3 1.16 35.3% 11 132 114 0.41 1.03 0.13 15.35
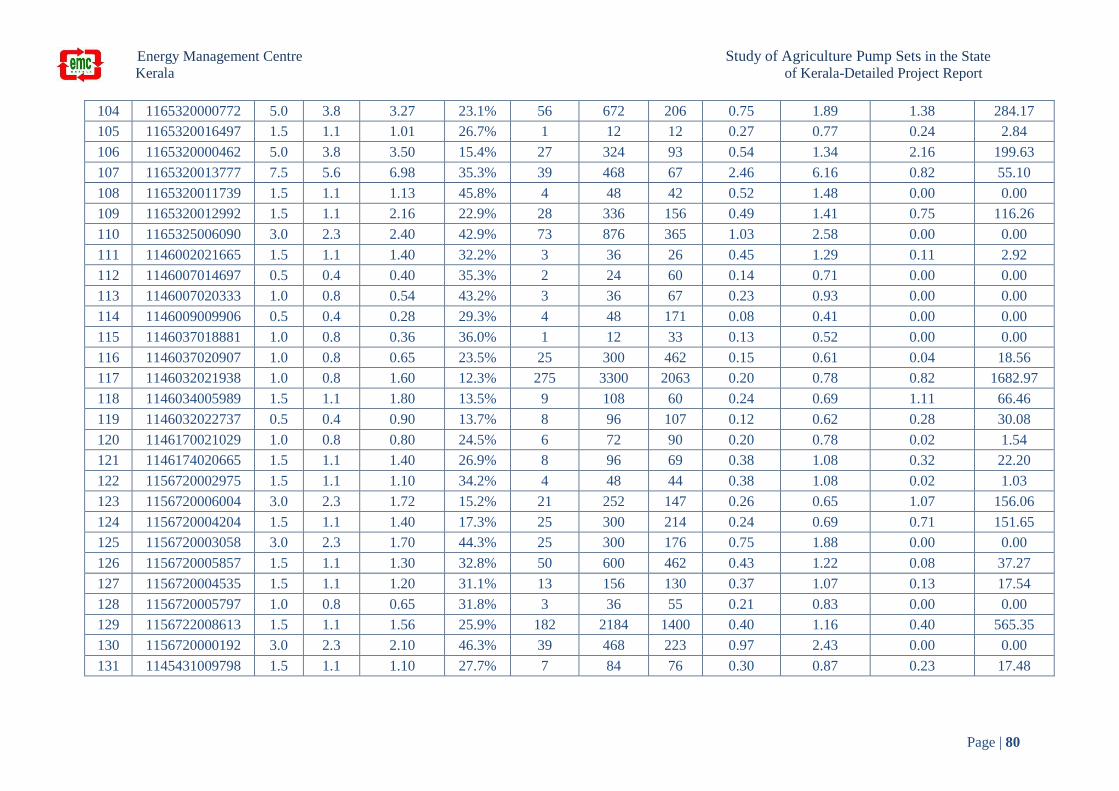
Energy Management Centre Study of Agriculture Pump Sets in the State
Kerala of Kerala-Detailed Project Report
Page | 80
104 1165320000772 5.0 3.8 3.27 23.1% 56 672 206 0.75 1.89 1.38 284.17
105 1165320016497 1.5 1.1 1.01 26.7% 1 12 12 0.27 0.77 0.24 2.84
106 1165320000462 5.0 3.8 3.50 15.4% 27 324 93 0.54 1.34 2.16 199.63
107 1165320013777 7.5 5.6 6.98 35.3% 39 468 67 2.46 6.16 0.82 55.10
108 1165320011739 1.5 1.1 1.13 45.8% 4 48 42 0.52 1.48 0.00 0.00
109 1165320012992 1.5 1.1 2.16 22.9% 28 336 156 0.49 1.41 0.75 116.26
110 1165325006090 3.0 2.3 2.40 42.9% 73 876 365 1.03 2.58 0.00 0.00
111 1146002021665 1.5 1.1 1.40 32.2% 3 36 26 0.45 1.29 0.11 2.92
112 1146007014697 0.5 0.4 0.40 35.3% 2 24 60 0.14 0.71 0.00 0.00
113 1146007020333 1.0 0.8 0.54 43.2% 3 36 67 0.23 0.93 0.00 0.00
114 1146009009906 0.5 0.4 0.28 29.3% 4 48 171 0.08 0.41 0.00 0.00
115 1146037018881 1.0 0.8 0.36 36.0% 1 12 33 0.13 0.52 0.00 0.00
116 1146037020907 1.0 0.8 0.65 23.5% 25 300 462 0.15 0.61 0.04 18.56
117 1146032021938 1.0 0.8 1.60 12.3% 275 3300 2063 0.20 0.78 0.82 1682.97
118 1146034005989 1.5 1.1 1.80 13.5% 9 108 60 0.24 0.69 1.11 66.46
119 1146032022737 0.5 0.4 0.90 13.7% 8 96 107 0.12 0.62 0.28 30.08
120 1146170021029 1.0 0.8 0.80 24.5% 6 72 90 0.20 0.78 0.02 1.54
121 1146174020665 1.5 1.1 1.40 26.9% 8 96 69 0.38 1.08 0.32 22.20
122 1156720002975 1.5 1.1 1.10 34.2% 4 48 44 0.38 1.08 0.02 1.03
123 1156720006004 3.0 2.3 1.72 15.2% 21 252 147 0.26 0.65 1.07 156.06
124 1156720004204 1.5 1.1 1.40 17.3% 25 300 214 0.24 0.69 0.71 151.65
125 1156720003058 3.0 2.3 1.70 44.3% 25 300 176 0.75 1.88 0.00 0.00
126 1156720005857 1.5 1.1 1.30 32.8% 50 600 462 0.43 1.22 0.08 37.27
127 1156720004535 1.5 1.1 1.20 31.1% 13 156 130 0.37 1.07 0.13 17.54
128 1156720005797 1.0 0.8 0.65 31.8% 3 36 55 0.21 0.83 0.00 0.00
129 1156722008613 1.5 1.1 1.56 25.9% 182 2184 1400 0.40 1.16 0.40 565.35
130 1156720000192 3.0 2.3 2.10 46.3% 39 468 223 0.97 2.43 0.00 0.00
131 1145431009798 1.5 1.1 1.10 27.7% 7 84 76 0.30 0.87 0.23 17.48
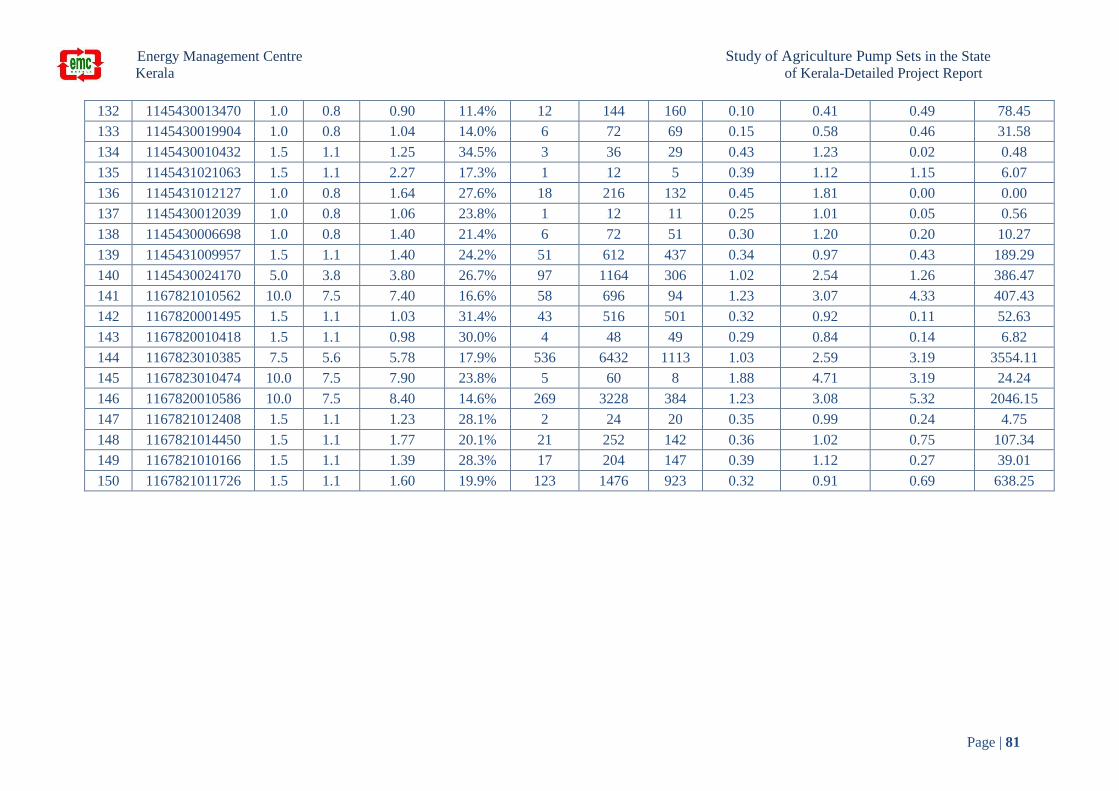
Energy Management Centre Study of Agriculture Pump Sets in the State
Kerala of Kerala-Detailed Project Report
Page | 81
132 1145430013470 1.0 0.8 0.90 11.4% 12 144 160 0.10 0.41 0.49 78.45
133 1145430019904 1.0 0.8 1.04 14.0% 6 72 69 0.15 0.58 0.46 31.58
134 1145430010432 1.5 1.1 1.25 34.5% 3 36 29 0.43 1.23 0.02 0.48
135 1145431021063 1.5 1.1 2.27 17.3% 1 12 5 0.39 1.12 1.15 6.07
136 1145431012127 1.0 0.8 1.64 27.6% 18 216 132 0.45 1.81 0.00 0.00
137 1145430012039 1.0 0.8 1.06 23.8% 1 12 11 0.25 1.01 0.05 0.56
138 1145430006698 1.0 0.8 1.40 21.4% 6 72 51 0.30 1.20 0.20 10.27
139 1145431009957 1.5 1.1 1.40 24.2% 51 612 437 0.34 0.97 0.43 189.29
140 1145430024170 5.0 3.8 3.80 26.7% 97 1164 306 1.02 2.54 1.26 386.47
141 1167821010562 10.0 7.5 7.40 16.6% 58 696 94 1.23 3.07 4.33 407.43
142 1167820001495 1.5 1.1 1.03 31.4% 43 516 501 0.32 0.92 0.11 52.63
143 1167820010418 1.5 1.1 0.98 30.0% 4 48 49 0.29 0.84 0.14 6.82
144 1167823010385 7.5 5.6 5.78 17.9% 536 6432 1113 1.03 2.59 3.19 3554.11
145 1167823010474 10.0 7.5 7.90 23.8% 5 60 8 1.88 4.71 3.19 24.24
146 1167820010586 10.0 7.5 8.40 14.6% 269 3228 384 1.23 3.08 5.32 2046.15
147 1167821012408 1.5 1.1 1.23 28.1% 2 24 20 0.35 0.99 0.24 4.75
148 1167821014450 1.5 1.1 1.77 20.1% 21 252 142 0.36 1.02 0.75 107.34
149 1167821010166 1.5 1.1 1.39 28.3% 17 204 147 0.39 1.12 0.27 39.01
150 1167821011726 1.5 1.1 1.60 19.9% 123 1476 923 0.32 0.91 0.69 638.25

Energy Management Centre Study of Agriculture Pump Sets in the State
Kerala of Kerala-Detailed Project Report
Page | 82
8.25 The economics on efficiency enhancement by improving the average overall efficiency
to the anticipated efficiencies is summarized and given below:
Power Consumption of the 150 no. of pumps = 254.4 kW
Total Consumption of 150 no of pumps = 52776 kWh
Power Estimated at anticipated overall efficiencies = 199.8 kW
Savings in the power = 54.6 kW
Percentage Savings in Power = 21.5%
Estimated Consumption after improving the overall
efficiency = 36615 kWh
Total Estimated savings on consumption of 150 no of
pumps = 16161 kWh
Estimated percentage Savings = 30.6%
8.26 The energy saving potential is estimated only for improvement in the system efficiency
due to replacement of existing pump sets with energy efficient pump sets.
8.27 The consumption pattern of the various rated pumps are also analyzed during the study
and the percentage contribution of each to the total consumption is given below:
Figure 16 Consumption pattern of the different rated pumps
8.28 Based on the above the Contribution each category to the savings is estimated and given
below:
below 1 hp, 0.4%
1 hp, 1.2%1.5 hp, 20.5%
2 hp, 0.9%
3 hp to < 5 hp, 9.6%
5hp to < 10hp, 39.6%
10hp to < 20hp ,
4.6%
20hp to < 30hp ,
5.0%
30hp to < 50hp, 9.8%
50hp to < 100hp,
7.0%
100hp to < 150hp,
1.3% 150hp to < 200hp,
0.1%
below 1 hp
1 hp
1.5 hp
2 hp
3 hp to < 5 hp
5hp to < 10hp
10hp to < 20hp
20hp to < 30hp
30hp to < 50hp
50hp to < 100hp
100hp to < 150hp
150hp to < 200hp
Energy Management Centre Study of Agriculture Pump Sets in the State
Kerala of Kerala-Detailed Project Report
Page | 83
8.29 Irrigation Pumps
8.29.1 From the study conducted it is found a that around 600 number of higher rated pumps
are been utilized by the irrigation department for the irrigation purpose. A separate
analysis has been carried out to understand the nature of operation and efficiency level
of these pumps.
8.29.2 Based on the above it is observed that irrigation pumps are operating 16 hrs per day
and overall efficiency level of these pumps are falling in the range of 40% - 45%.
8.29.3 This consumes around 5% of the total consumption. As the pumps are operating
throughout the year, improving the overall efficiency to 65% has a better influence on
the percentage reduction in consumption. It is identified to have scope for separate
study on the energy efficiency improvement in this sector.
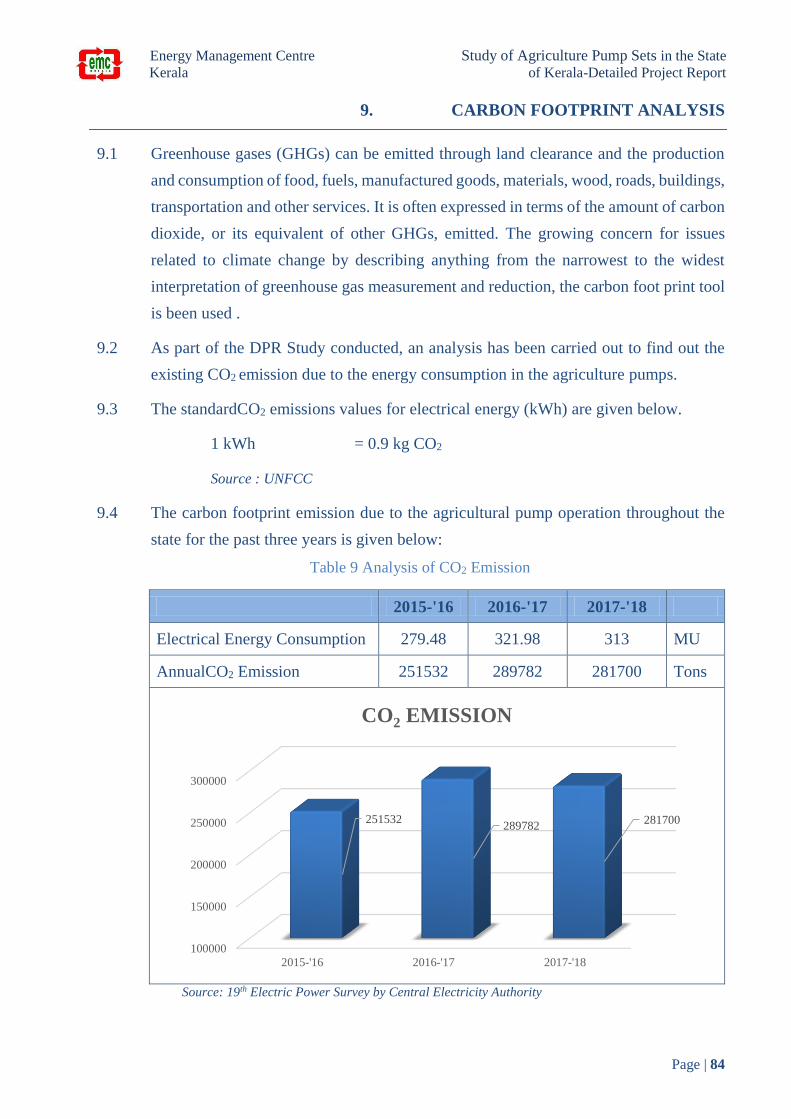
Energy Management Centre Study of Agriculture Pump Sets in the State
Kerala of Kerala-Detailed Project Report
Page | 84
9. CARBON FOOTPRINT ANALYSIS
9.1 Greenhouse gases (GHGs) can be emitted through land clearance and the production
and consumption of food, fuels, manufactured goods, materials, wood, roads, buildings,
transportation and other services. It is often expressed in terms of the amount of carbon
dioxide, or its equivalent of other GHGs, emitted. The growing concern for issues
related to climate change by describing anything from the narrowest to the widest
interpretation of greenhouse gas measurement and reduction, the carbon foot print tool
is been used .
9.2 As part of the DPR Study conducted, an analysis has been carried out to find out the
existing CO2 emission due to the energy consumption in the agriculture pumps.
9.3 The standardCO2 emissions values for electrical energy (kWh) are given below.
1 kWh = 0.9 kg CO2
Source : UNFCC
9.4 The carbon footprint emission due to the agricultural pump operation throughout the
state for the past three years is given below:
Table 9 Analysis of CO2 Emission
2015-'16 2016-'17 2017-'18
Electrical Energy Consumption 279.48 321.98 313 MU
AnnualCO2 Emission 251532 289782 281700 Tons
Source: 19th Electric Power Survey by Central Electricity Authority
100000
150000
200000
250000
300000
2015-'16 2016-'17 2017-'18
251532289782
281700
CO2 EMISSION
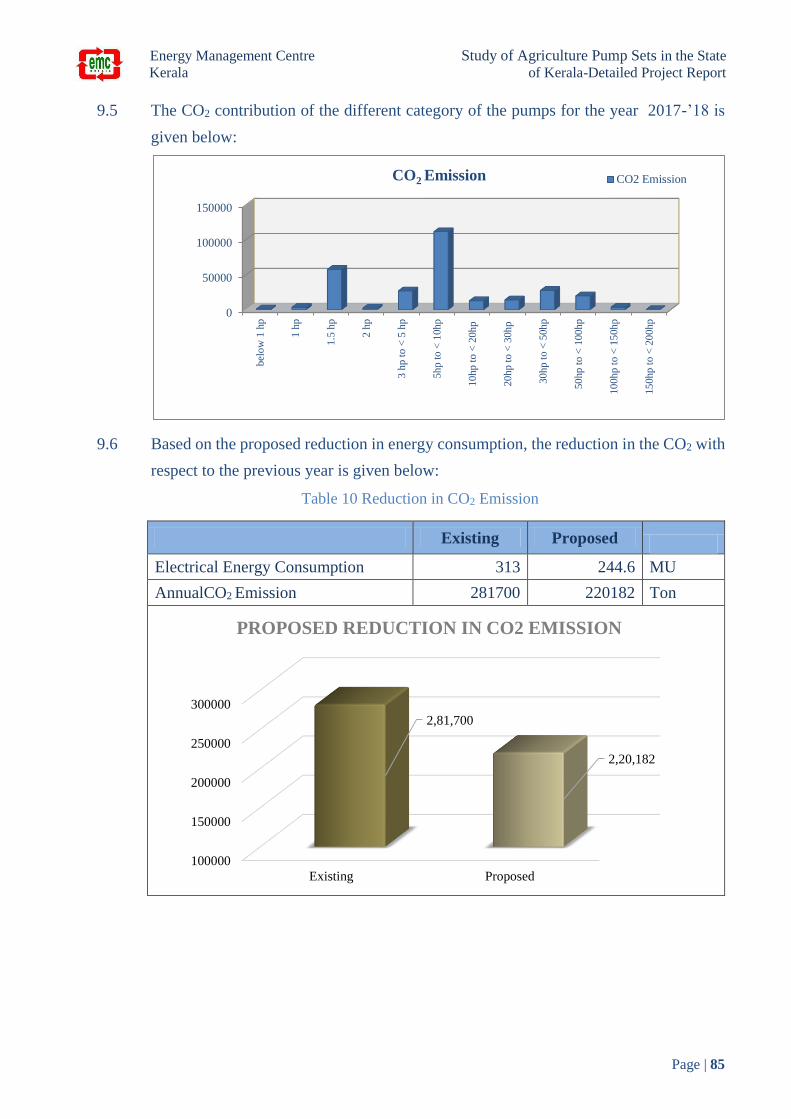
Energy Management Centre Study of Agriculture Pump Sets in the State
Kerala of Kerala-Detailed Project Report
Page | 85
9.5 The CO2 contribution of the different category of the pumps for the year 2017-’18 is
given below:
9.6 Based on the proposed reduction in energy consumption, the reduction in the CO2 with
respect to the previous year is given below:
Table 10 Reduction in CO2 Emission
Existing Proposed
Electrical Energy Consumption 313 244.6 MU
AnnualCO2 Emission 281700 220182 Ton
0
50000
100000
150000
bel
ow
1 h
p
1 h
p
1.5
hp
2 h
p
3 h
p t
o <
5 h
p
5h
p t
o <
10hp
10
hp t
o <
20h
p
20
hp t
o <
30h
p
30
hp t
o <
50h
p
50
hp t
o <
100
hp
10
0hp
to <
15
0hp
15
0hp
to <
20
0hp
CO2 Emission CO2 Emission
100000
150000
200000
250000
300000
Existing Proposed
2,81,700
2,20,182
PROPOSED REDUCTION IN CO2 EMISSION

Energy Management Centre Study of Agriculture Pump Sets in the State
Kerala of Kerala-Detailed Project Report
Page | 86
10. PROJECT PHASE
10.1 Among the 4,45,223 agriculture pump sets in Kerala, 97.8% of total pumps is falling
under the category of below 10 hp capacity and its consumption is around 72.2% of the
total consumption.
10.2 The overall rated efficiency of 54.8% of sampled pumps of 150 Nos is only less than
40%. From the analysis it is estimated that the present average overall efficiency of
these pumps is only 23.3%.
10.3 The chart below shows the rated efficiency variation of the sampled pumps.
10.4 The inferior quality pumps used in the sector is identified as one of the primary reasons
for the poor operating efficiency in agriculture pumping sector. Implementation of
replacement is recommended to carry out phase by phase.
10.5 Phase -1 : Replacement of pump sets with overall rated efficiency less than 40%
with energy efficient pump sets
10.5.1 Based on the analysis carried out, a savings potential of about 69 MU per year has been
identified by the replacement existing local made & low rated overall efficiency
(below 40% efficiency) pumps falling under below 10 hp category. The detailed
analysis is given below:
Eff below 40 %
54.8%
40%<= Eff < 50%
30.1%
Eff 50% and above
15.1%
Eff below 40 % 40%<= Eff < 50% Eff 50% and above
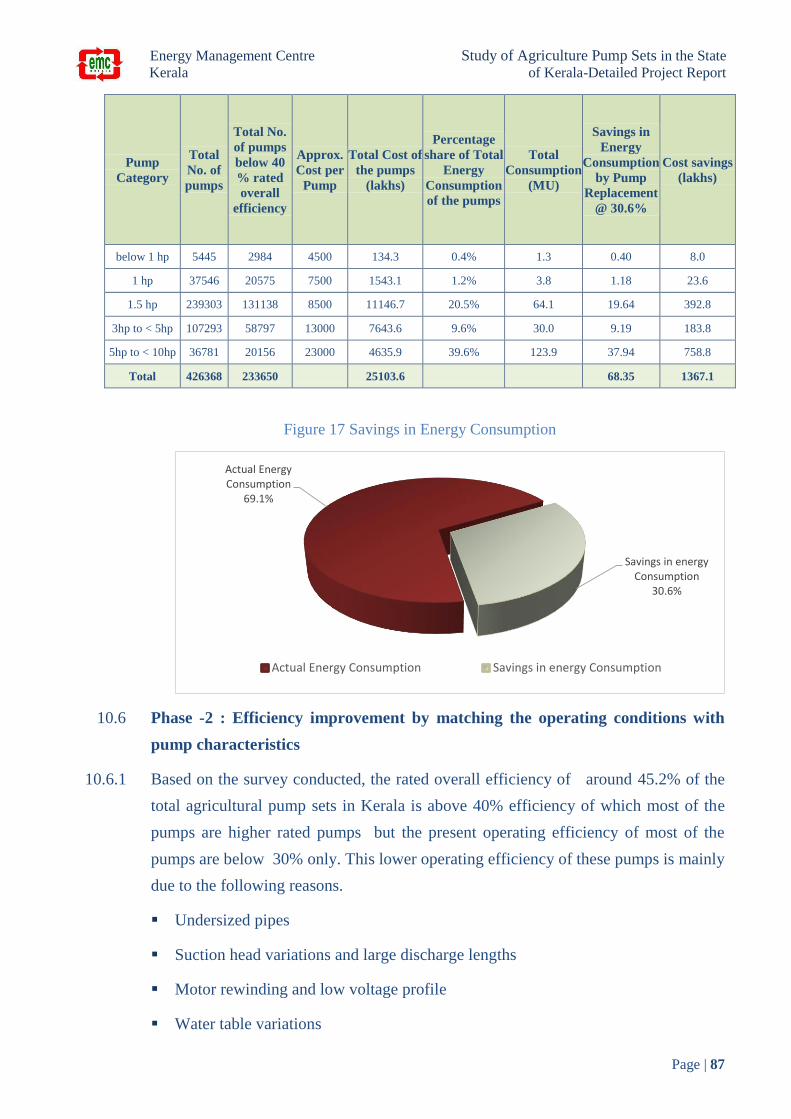
Energy Management Centre Study of Agriculture Pump Sets in the State
Kerala of Kerala-Detailed Project Report
Page | 87
Pump
Category
Total
No. of
pumps
Total No.
of pumps
below 40
% rated
overall
efficiency
Approx.
Cost per
Pump
Total Cost of
the pumps
(lakhs)
Percentage
share of Total
Energy
Consumption
of the pumps
Total
Consumption
(MU)
Savings in
Energy
Consumption
by Pump
Replacement
@ 30.6%
Cost savings
(lakhs)
below 1 hp 5445 2984 4500 134.3 0.4% 1.3 0.40 8.0
1 hp 37546 20575 7500 1543.1 1.2% 3.8 1.18 23.6
1.5 hp 239303 131138 8500 11146.7 20.5% 64.1 19.64 392.8
3hp to < 5hp 107293 58797 13000 7643.6 9.6% 30.0 9.19 183.8
5hp to < 10hp 36781 20156 23000 4635.9 39.6% 123.9 37.94 758.8
Total 426368 233650 25103.6 68.35 1367.1
Figure 17 Savings in Energy Consumption
10.6 Phase -2 : Efficiency improvement by matching the operating conditions with
pump characteristics
10.6.1 Based on the survey conducted, the rated overall efficiency of around 45.2% of the
total agricultural pump sets in Kerala is above 40% efficiency of which most of the
pumps are higher rated pumps but the present operating efficiency of most of the
pumps are below 30% only. This lower operating efficiency of these pumps is mainly
due to the following reasons.
Undersized pipes
Suction head variations and large discharge lengths
Motor rewinding and low voltage profile
Water table variations
Actual Energy Consumption
69.1%
Savings in energy Consumption
30.6%
Actual Energy Consumption Savings in energy Consumption
Energy Management Centre Study of Agriculture Pump Sets in the State
Kerala of Kerala-Detailed Project Report
Page | 88
10.6.2 Considering the above facts and higher rating of the pumps, it would be feasible to
improve the operating efficiency of these pumps by improving the operational
condition rather going for pump replacement. This can be implemented by adopting
the following :
A proper study should be carried out focusing on matching the existing operating
point of pumps to the BEP by analyzing the flow, head, average water table on
different locations, layouts, capacity analysis etc.
The modification of the pipe layout maybe done to match the designed head-flow
of the existing pumps.
After the doing the above exercises and next phase study pumps operating with
lesser efficiency may be replaced with star labeled/energy efficient pumps as next
stage.
10.7 Business model for replacement of inefficient pump sets to conserve energy
10.7.1 The purpose of the exhaustive study on agricultural pumps across Kerala is to develop
an implementable Detailed Project Report for replacement of inefficient pump sets to
conserve energy.
10.7.2 Implementations of pump replacement projects offer opportunity to reduce overall
energy consumption, cut down energy bill to the farmers, reduces subsidy burdens on
the distribution companies and state governments and mitigate the energy shortage
situation while improving the water extraction efficiency. However for sustainable
investment in the project it is required to develop business models to assure
sustainability of the savings for loan repayments and to provide adequate incentives to
the investors.
Guiding Parameters
10.7.3 To capitalize the potential savings, it requires to develop effective financing and
business models to create benefits and incentives for all stakeholders which includes
distribution utilities, farmers, private sector participants (ESCOS) investing for
implementation of pump replacement projects, state governments etc.
10.7.4 Hence an effective business model must meet the objectives of all key parties which
include distribution utilities, regulatory commission, ESCO or contractor, investor,
farmers and local communities etc.

Energy Management Centre Study of Agriculture Pump Sets in the State
Kerala of Kerala-Detailed Project Report
Page | 89
Project Financing
10.7.5 To create appropriate framework for market based interventions in agriculture pumping
sector through Public Private Partnership (PPP) mode, the Agriculture pump
replacement project funding has to come from ESCO which will be repaid over time
from the stream of project benefits.
10.7.6 To create appropriate framework for market based interventions in agriculture pumping
sector through Public Private Partnership (PPP) mode, the Agriculture pump
replacement project funding has to come from ESCO which will be repaid over time
from the stream of project benefits.
10.7.7 With the above-noted background in mind and after taken in to account the possible
financing options, two different business models can be been developed and
categorized as ESCO Mode and DISCOM Mode as described below:
10.7.8 In ESCO Mode business model, ESCO has to sign a contract with participant Company
to finance and implement project; the ESCO would borrow the project debt and repay
it from project revenues.
10.7.9 Overall Project Cost: The total project cost estimate for the Project, is about Rs.
31505Lakh
Particulars Value in
(lakhs)
Cost of Energy Efficient Pump Sets (EEPS) (Rs.) 25103.6
Cost of dismantling existing pump sets and installing EEPS
(approx.10%)(Rs.) 2510.4
Contingencies (approx.3.5%) (Rs.) 878.6
Project Management Consultancy (approx.12%) (Rs.) 3012.4
Total project cost (Rs.) 31505.0
Estimated Annual Savings (Rs.) @ Rs. 2/kWh –LT-V Tariff 1367.1
Simple payback period (years) @ Rs. 2/kWh –LT-V Tariff 23.0
Estimated Annual Savings (Rs.) @ Rs. 6.2/kWh –Purchase Tariff 4237.9
Simple payback period (years) @ Rs. 6.2/kWh –Purchase Tariff 7.4
Demand Savings
Estimated annual Savings (MU) 68.35
Average annual pump operating days 250
Average daily pump operating hours (hrs) 2.75
Daily savings in energy consumption (kWh) 273413
Anticipated Demand Savings (MW) 100

Energy Management Centre Study of Agriculture Pump Sets in the State
Kerala of Kerala-Detailed Project Report
Page | 90
11. POLICY REVIEW
11.1 Existing Policy
11.1.1 Agriculture Department does not properly documenting the details of the agriculture
consumers falling under each Krishi Bhavan.
11.1.2 No comparative analysis on energy consumption of agriculture consumers.
11.1.3 No updation on consumer data base like existing land occupied, capacity of pump
installed, crop details, eligibility for availing the agriculture scheme etc.
11.1.4 Pump purchase policy for purchasing new pump by the consumer is not standardized.
11.1.5 No system for encouraging consumers to buy energy efficient pumps to improve the
overall pumping efficiency.
11.1.6 Though Energy Management Centre-Kerala had issued an order in 2011 stating that
all agriculture pump sets purchasing hereafter shall be star labeled /ISI marked , the
present agriculture pumping system reveals not that much impact on the pumping
energy efficiency improvement. The details of the GO is given below:
11.1.7 Existing Policy for agriculture pump sets purchasing (Kerala Gazette No. 21/2015/PD
dated 11th June 2015)
All new connections to the agricultural pump sets must mandatory use Bureau of
Energy Efficiency (BEE) Star labelled pump sets(with minimum 4 star rating) and
Bureau of Indian Standards rated accessories Distribution Licensee, Department
of Electrical Inspectorate and Agriculture Department must make necessary
amendments to this effect in their relevant regulations and guidelines pertaining to
granting permission for new agricultural connection and awarding financial grants
and tariff concessions.
The pump sets which are in use and not having four or five star rating must be
replaced with new four or five Bureau of Energy Efficiency star labelled pump
sets in a phased manned within three years as notified by Government of Kerala
vide GO (P) No. 10/2014/PD dated 11-04-2014.
In case the type and rating of pumps required are not covered under Star labelling
programme, highest energy efficiency, Complying with relevant Bureau of India
Standard must only be procured.
Energy Management Centre Study of Agriculture Pump Sets in the State
Kerala of Kerala-Detailed Project Report
Page | 91
11.2 Guidelines for the Policy review for improving the energy efficiency in agriculture
pumping sector
11.2.1 Create a data base of the existing eligible agriculture consumers with various
parameters like pump type, age, size, make, rating, purpose, usage, water use, energy
consumption, geographic/spatial deployment etc. in a pre-designed format.
11.2.2 Make statutory the purchase of star labeled agriculture pumps to avail subsidy for pump
purchase cost.
11.2.3 Ensure that the installation of the pump sets is as per the guidelines of the agriculture
department for bet operating efficiency and it should be certified by a competent
person.
11.2.4 Any changes in the existing pumping system can be done only after getting prior
approval from the concerned authority in a proper format.
11.2.5 An awareness on energy efficiency pumping operation may be given to officials of the
agriculture departments as well as the consumers to ensure optimum operating
efficiency.
11.3 Roles and responsibilities of various departments for improving Energy efficiency
in agriculture pumping system
A Proper documentation of the agriculture pump consumer should be created under
each krishi bhavan with the collaborating with KSEBL.
Create a data base of the existing eligible agriculture consumers with various
parameters like pump type, age, size, make, rating, purpose, usage, water use, energy
consumption, geographic/spatial deployment etc. in a pre-designed format by the
Agriculture department.
Department should prepare a standard protocol for the selection of the pump and the
layout designing. The layout should also consider the water table variation by arranging
a proper study by classifying the geographical area into different zones.
The pump selection should be verified by the competent person which should be
organized by the agriculture department. The pump selection should follow the G.O
(P) No.21/2015/PD dated 11th June 2015
Make statutory the purchase of star labeled agriculture pumps to avail subsidy for pump
purchase cost and consumption cost. Agriculture department should ensure the proper
purchase through local self-bodies.
Energy Management Centre Study of Agriculture Pump Sets in the State
Kerala of Kerala-Detailed Project Report
Page | 92
Ensure that the installation of the pump sets is as per the guidelines of the agriculture
department for best operating efficiency and it should be certified by a competent
person.
Any changes in the existing pumping system can be done only after getting prior
approval from the concerned authority in a proper format.
Yearly updation of the details should be mandatorily followed by the agriculture
department and so as the updation should be reflected in the primary data base.
The Existing lower efficiency rated pumps should be mandatorily replaced either by
ESCO or DISCOM model so as the sector should be operated at maximum efficiency
pumps available in the market.
The proper pump selection and layout design should be corrected along with the phase
one.
The agriculture department should monitor the consumption pattern of the agricultural
pumps of the entire state.
Irrigation Department should monitor the consumption of the irrigation pump sets.
Irrigation department should conduct a separate study on each pump sets and identify
the operating efficiency of the pumps throughout the year.
Department should recognize the opportunity for replacing the old inefficient pump
sets through ESCO/ DISCOM route.
EMC should act as the monitoring agency verifying the consumption pattern,
Efficiency improvement strategies adapted by the department through a competent
agency.
EMC should provide achievable targets to the Departments and should verify it
annually with a competent agency.
EMC should arrange necessary support to organize awareness program for the
concerned staff and the consumers.

APPENDICIES
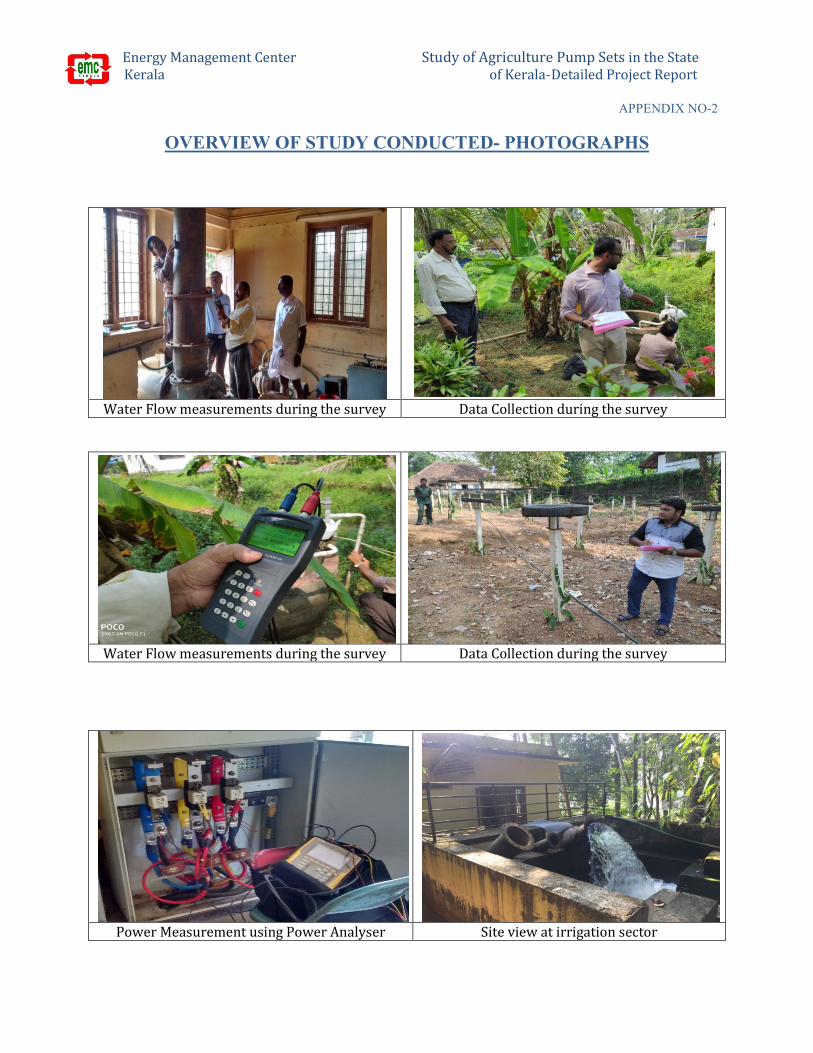
Energy Management Center Study of Agriculture Pump Sets in the State Kerala of Kerala-Detailed Project Report
APPENDIX NO-2
OVERVIEW OF STUDY CONDUCTED- PHOTOGRAPHS
Water Flow measurements during the survey Data Collection during the survey
Water Flow measurements during the survey Data Collection during the survey
Power Measurement using Power Analyser Site view at irrigation sector

Energy Management Center Study of Agriculture Pump Sets in the State Kerala of Kerala-Detailed Project Report
Data Collection during the Survey Pump Inspection during the Survey
Power Measurement during the survey Field Interaction during the Survey
Site view during the Survey Flow Measurement during the Survey
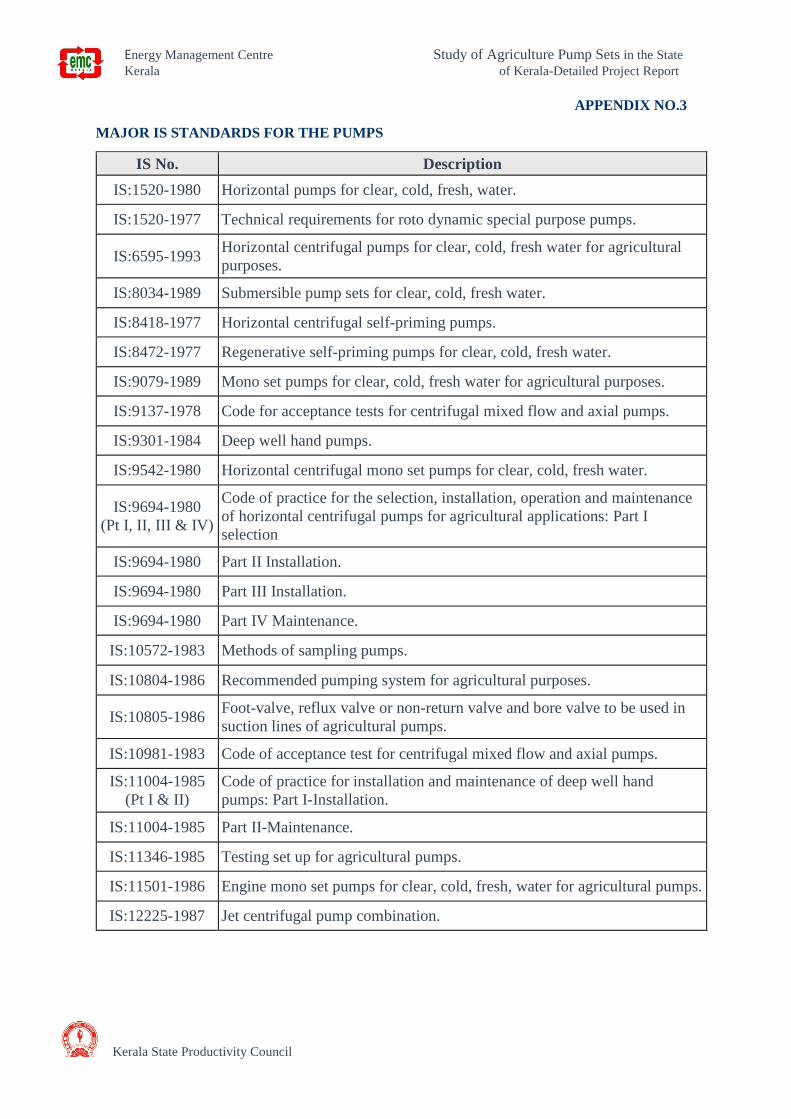
Energy Management Centre Study of Agriculture Pump Sets in the State
Kerala
Kerala State Productivity Council
MAJOR IS STANDARDS FOR THE PUMPS
IS No.
of Kerala-Detailed Project Report
APPENDIX NO.3
Description
IS:1520-1980 Horizontal pumps for clear, cold, fresh, water.
IS:1520-1977 Technical requirements for roto dynamic special purpose pumps.
IS:6595-1993 Horizontal centrifugal pumps for clear, cold, fresh water for agricultural
purposes.
IS:8034-1989 Submersible pump sets for clear, cold, fresh water.
IS:8418-1977 Horizontal centrifugal self-priming pumps.
IS:8472-1977 Regenerative self-priming pumps for clear, cold, fresh water.
IS:9079-1989 Mono set pumps for clear, cold, fresh water for agricultural purposes.
IS:9137-1978 Code for acceptance tests for centrifugal mixed flow and axial pumps.
IS:9301-1984 Deep well hand pumps.
IS:9542-1980 Horizontal centrifugal mono set pumps for clear, cold, fresh water.
IS:9694-1980
(Pt I, II, III & IV)
Code of practice for the selection, installation, operation and maintenance
of horizontal centrifugal pumps for agricultural applications: Part I
selection
IS:9694-1980 Part II Installation.
IS:9694-1980 Part III Installation.
IS:9694-1980 Part IV Maintenance.
IS:10572-1983 Methods of sampling pumps.
IS:10804-1986 Recommended pumping system for agricultural purposes.
IS:10805-1986 Foot-valve, reflux valve or non-return valve and bore valve to be used in
suction lines of agricultural pumps.
IS:10981-1983 Code of acceptance test for centrifugal mixed flow and axial pumps.
IS:11004-1985
(Pt I & II)
Code of practice for installation and maintenance of deep well hand
pumps: Part I-Installation.
IS:11004-1985 Part II-Maintenance.
IS:11346-1985 Testing set up for agricultural pumps.
IS:11501-1986 Engine mono set pumps for clear, cold, fresh, water for agricultural pumps.
IS:12225-1987 Jet centrifugal pump combination.
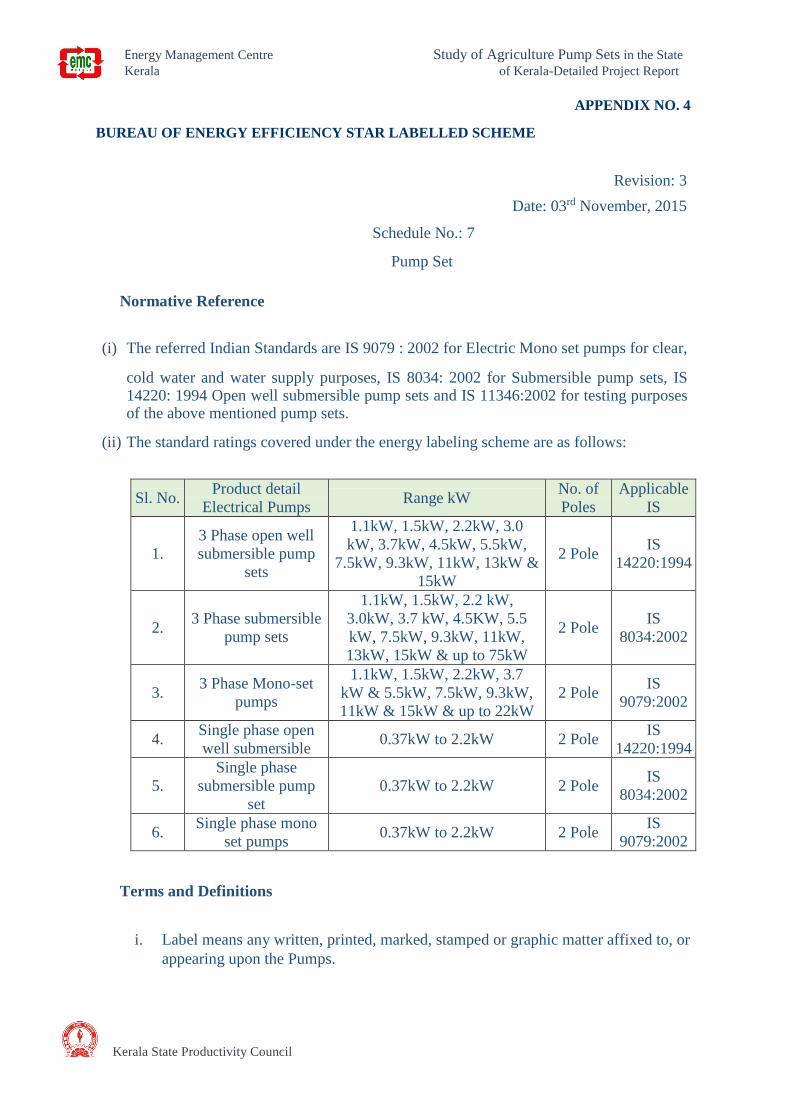
Energy Management Centre Study of Agriculture Pump Sets in the State
Kerala
Kerala State Productivity Council
of Kerala-Detailed Project Report
APPENDIX NO. 4
BUREAU OF ENERGY EFFICIENCY STAR LABELLED SCHEME
Revision: 3
Date: 03rd November, 2015
Schedule No.: 7
Pump Set
Normative Reference
(i) The referred Indian Standards are IS 9079 : 2002 for Electric Mono set pumps for clear,
cold water and water supply purposes, IS 8034: 2002 for Submersible pump sets, IS 14220: 1994 Open well submersible pump sets and IS 11346:2002 for testing purposes of the above mentioned pump sets.
(ii) The standard ratings covered under the energy labeling scheme are as follows:
Sl. No. Product detail
Electrical Pumps Range kW
No. of
Poles
Applicable
IS
1.
3 Phase open well
submersible pump
sets
1.1kW, 1.5kW, 2.2kW, 3.0
kW, 3.7kW, 4.5kW, 5.5kW,
7.5kW, 9.3kW, 11kW, 13kW &
15kW
2 Pole IS
14220:1994
2. 3 Phase submersible
pump sets
1.1kW, 1.5kW, 2.2 kW,
3.0kW, 3.7 kW, 4.5KW, 5.5
kW, 7.5kW, 9.3kW, 11kW,
13kW, 15kW & up to 75kW
2 Pole IS
8034:2002
3. 3 Phase Mono-set
pumps
1.1kW, 1.5kW, 2.2kW, 3.7
kW & 5.5kW, 7.5kW, 9.3kW,
11kW & 15kW & up to 22kW
2 Pole IS
9079:2002
4. Single phase open
well submersible 0.37kW to 2.2kW 2 Pole
IS
14220:1994
5.
Single phase
submersible pump
set
0.37kW to 2.2kW 2 Pole IS
8034:2002
6. Single phase mono
set pumps 0.37kW to 2.2kW 2 Pole
IS
9079:2002
Terms and Definitions
i. Label means any written, printed, marked, stamped or graphic matter affixed to, or
appearing upon the Pumps.
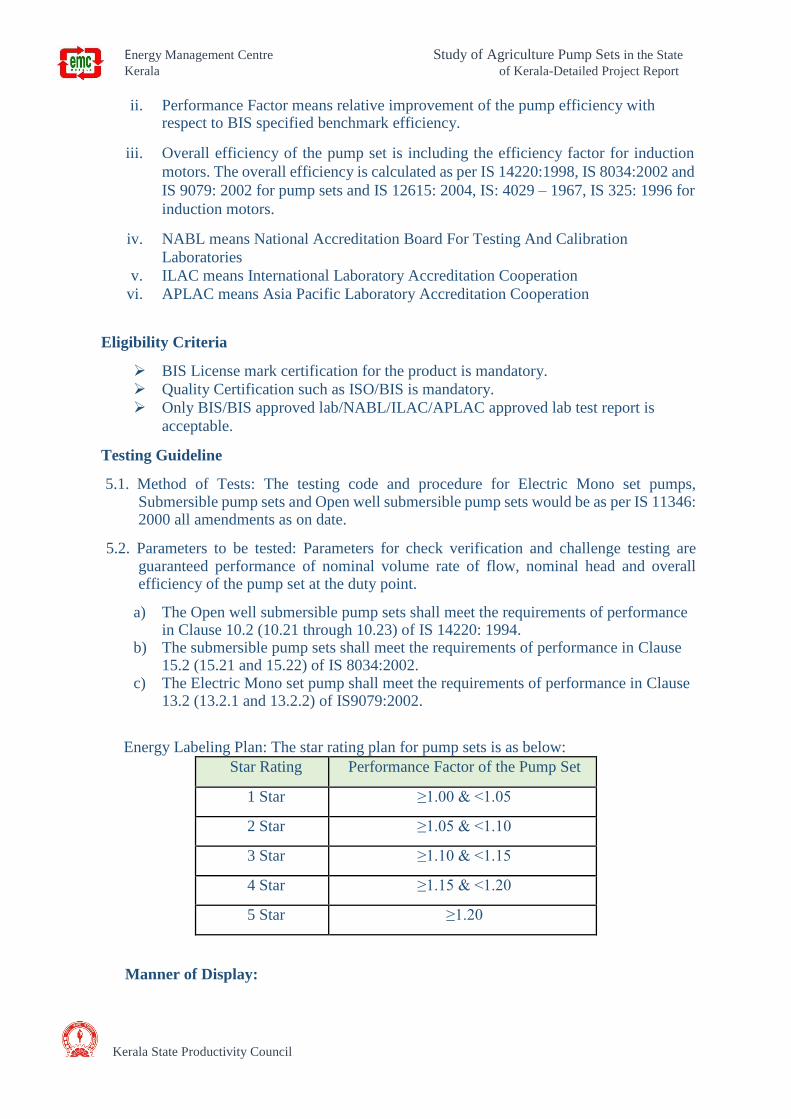
Energy Management Centre Study of Agriculture Pump Sets in the State
Kerala of Kerala-Detailed Project Report
Kerala State Productivity Council
ii. Performance Factor means relative improvement of the pump efficiency with respect to BIS specified benchmark efficiency.
iii. Overall efficiency of the pump set is including the efficiency factor for induction
motors. The overall efficiency is calculated as per IS 14220:1998, IS 8034:2002 and
IS 9079: 2002 for pump sets and IS 12615: 2004, IS: 4029 – 1967, IS 325: 1996 for
induction motors.
iv. NABL means National Accreditation Board For Testing And Calibration
Laboratories
v. ILAC means International Laboratory Accreditation Cooperation
vi. APLAC means Asia Pacific Laboratory Accreditation Cooperation
Eligibility Criteria
BIS License mark certification for the product is mandatory.
Quality Certification such as ISO/BIS is mandatory.
Only BIS/BIS approved lab/NABL/ILAC/APLAC approved lab test report is
acceptable.
Testing Guideline
5.1. Method of Tests: The testing code and procedure for Electric Mono set pumps, Submersible pump sets and Open well submersible pump sets would be as per IS 11346: 2000 all amendments as on date.
5.2. Parameters to be tested: Parameters for check verification and challenge testing are guaranteed performance of nominal volume rate of flow, nominal head and overall efficiency of the pump set at the duty point.
a) The Open well submersible pump sets shall meet the requirements of performance in Clause 10.2 (10.21 through 10.23) of IS 14220: 1994.
b) The submersible pump sets shall meet the requirements of performance in Clause 15.2 (15.21 and 15.22) of IS 8034:2002.
c) The Electric Mono set pump shall meet the requirements of performance in Clause 13.2 (13.2.1 and 13.2.2) of IS9079:2002.
Energy Labeling Plan: The star rating plan for pump sets is as below:
Star Rating Performance Factor of the Pump Set
1 Star ≥1.00 & <1.05
2 Star ≥1.05 & <1.10
3 Star ≥1.10 & <1.15
4 Star ≥1.15 & <1.20
5 Star ≥1.20
Manner of Display:
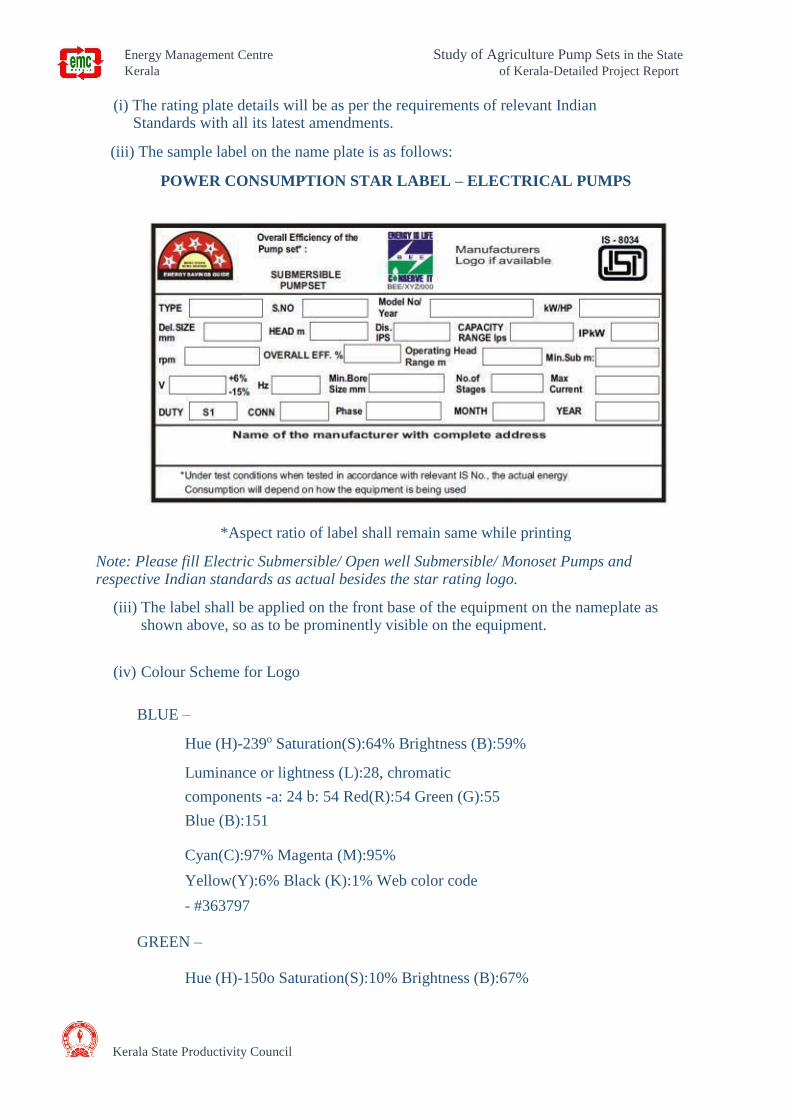
Energy Management Centre Study of Agriculture Pump Sets in the State
Kerala of Kerala-Detailed Project Report
Kerala State Productivity Council
(i) The rating plate details will be as per the requirements of relevant Indian Standards with all its latest amendments.
(iii) The sample label on the name plate is as follows:
POWER CONSUMPTION STAR LABEL – ELECTRICAL PUMPS
*Aspect ratio of label shall remain same while printing
Note: Please fill Electric Submersible/ Open well Submersible/ Monoset Pumps and respective Indian standards as actual besides the star rating logo.
(iii) The label shall be applied on the front base of the equipment on the nameplate as shown above, so as to be prominently visible on the equipment.
(iv) Colour Scheme for Logo
BLUE –
Hue (H)-239o Saturation(S):64% Brightness (B):59%
Luminance or lightness (L):28, chromatic
components -a: 24 b: 54 Red(R):54 Green (G):55
Blue (B):151
Cyan(C):97% Magenta (M):95%
Yellow(Y):6% Black (K):1% Web color code
- #363797
GREEN –
Hue (H)-150o Saturation(S):10% Brightness (B):67%
Energy Management Centre Study of Agriculture Pump Sets in the State
Kerala of Kerala-Detailed Project Report
Kerala State Productivity Council
Luminance or lightness (L):61, chromatic components -a: 53 b: 32 Red(R):0
Green (G):170 Blue (B):87
Cyan(C):81% Magenta (M):10% Yellow(Y):90%
Black (K):1% Web color code - #00AA56
Tolerances
The tolerance shall be as specified in IS 11346: 2002. However, there shall be no tolerance for star rating band, the average of products tested must be at par or better than the label threshold.
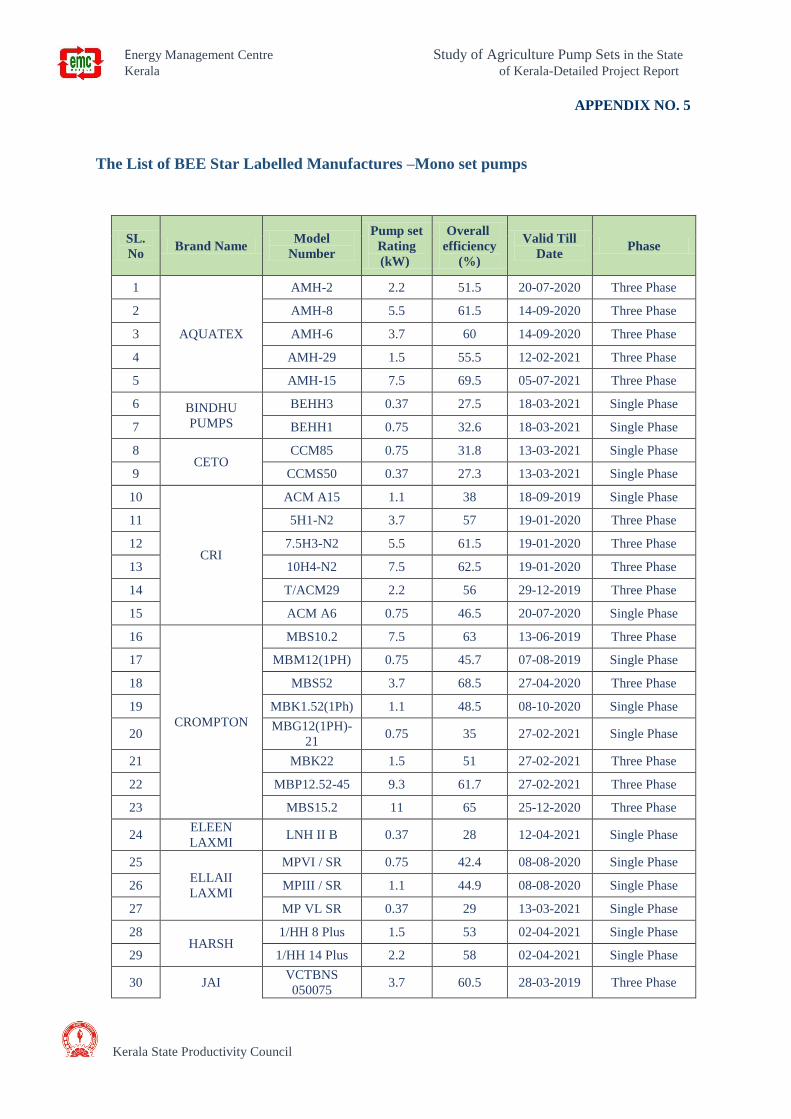
Energy Management Centre Study of Agriculture Pump Sets in the State
Kerala
Kerala State Productivity Council
of Kerala-Detailed Project Report
APPENDIX NO. 5
The List of BEE Star Labelled Manufactures –Mono set pumps
SL.
No Brand Name
Model
Number
Pump set
Rating
(kW)
Overall
efficiency
(%)
Valid Till
Date Phase
1
AQUATEX
AMH-2 2.2 51.5 20-07-2020 Three Phase
2 AMH-8 5.5 61.5 14-09-2020 Three Phase
3 AMH-6 3.7 60 14-09-2020 Three Phase
4 AMH-29 1.5 55.5 12-02-2021 Three Phase
5 AMH-15 7.5 69.5 05-07-2021 Three Phase
6 BINDHU
PUMPS
BEHH3 0.37 27.5 18-03-2021 Single Phase
7 BEHH1 0.75 32.6 18-03-2021 Single Phase
8 CETO
CCM85 0.75 31.8 13-03-2021 Single Phase
9 CCMS50 0.37 27.3 13-03-2021 Single Phase
10
CRI
ACM A15 1.1 38 18-09-2019 Single Phase
11 5H1-N2 3.7 57 19-01-2020 Three Phase
12 7.5H3-N2 5.5 61.5 19-01-2020 Three Phase
13 10H4-N2 7.5 62.5 19-01-2020 Three Phase
14 T/ACM29 2.2 56 29-12-2019 Three Phase
15 ACM A6 0.75 46.5 20-07-2020 Single Phase
16
CROMPTON
MBS10.2 7.5 63 13-06-2019 Three Phase
17 MBM12(1PH) 0.75 45.7 07-08-2019 Single Phase
18 MBS52 3.7 68.5 27-04-2020 Three Phase
19 MBK1.52(1Ph) 1.1 48.5 08-10-2020 Single Phase
20 MBG12(1PH)-
21 0.75 35 27-02-2021 Single Phase
21 MBK22 1.5 51 27-02-2021 Three Phase
22 MBP12.52-45 9.3 61.7 27-02-2021 Three Phase
23 MBS15.2 11 65 25-12-2020 Three Phase
24 ELEEN
LAXMI LNH II B 0.37 28 12-04-2021 Single Phase
25
ELLAII
LAXMI
MPVI / SR 0.75 42.4 08-08-2020 Single Phase
26 MPIII / SR 1.1 44.9 08-08-2020 Single Phase
27 MP VL SR 0.37 29 13-03-2021 Single Phase
28 HARSH
1/HH 8 Plus 1.5 53 02-04-2021 Single Phase
29 1/HH 14 Plus 2.2 58 02-04-2021 Single Phase
30 JAI VCTBNS
050075 3.7 60.5 28-03-2019 Three Phase

Energy Management Centre Study of Agriculture Pump Sets in the State
Kerala of Kerala-Detailed Project Report
Kerala State Productivity Council
31 VCTBNS
030065 2.2 52.45 28-08-2019 Three Phase
32
KALPA
PUMPS
5 STAR KERA
052525L. 0.37 28.6 19-12-2020 Single Phase
33 5 STAR KERA
104040. 0.75 38.6 19-12-2020 Single Phase
34 5 STAR KERA
155040. 1.1 45.7 19-12-2020 Single Phase
35
KERA PUMPS
5 STAR KERA
052525L 0.37 28.6 26-01-2020 Single Phase
36 5 STAR KERA
104040 0.75 38.6 26-01-2020 Single Phase
37 5 STAR KERA
155040 1.1 45.7 26-01-2020 Single Phase
38
KIRLOSKAR
KDS-515E 3.7 62.6 20-07-2020 Three Phase
39 KDS-1.514++ 1.1 48.5 14-09-2020 Single Phase
40 KDS-325F 2.2 57 19-12-2020 Three Phase
41 KDS-1331F 9.3 66.6 12-02-2021 Three Phase
42 KDS-1537F 11.2 66.1 19-12-2020 Three Phase
43 KDS-822F 5.5 64.5 23-05-2021 Three Phase
44 KDS-1030F 7.5 65.3 23-05-2021 Three Phase
45 KDS-1555F 58.5 23-05-2021 Three Phase
46 KDS-2050F 64.8 23-05-2021 Three Phase
47 KDS-0510+ 0.37 37 25-09-2021 Single Phase
48 KDS-116++ 0.75 43.5 25-09-2021 Single Phase
49 KDS-527S 3.7 55 01-11-2021 Three Phase
50 KDS-216F 1.5 55.1 18-01-2022 Three Phase
51 LAURA
LMB-1S 0.37 27.3 27-02-2021 Single Phase
52 LMB-3S 0.75 31.8 27-02-2021 Single Phase
53
LUBI
LBH-29AA 15 64.95 06-11-2019 Three Phase
54 LBI-15A 3.7 58.78 23-05-2020 Three Phase
55 MDH-12SV 0.37 27.3 20-07-2020 Single Phase
56 LBI-27H 5.5 58.08 20-07-2020 Three Phase
57 LBH-12AR 7.5 66.85 20-07-2020 Three Phase
58 LBH-21AR 9.3 66.35 20-07-2020 Three Phase
59 LBH-29BR 11 65.9 20-07-2020 Three Phase
60 MDH-21S 1.5 59 12-02-2022 Single Phase
61 MDH-17S 0.75 48 12-02-2022 Single Phase
62 MDH-20S 1.1 50 12-02-2022 Single Phase
63
MAHENDRA
JR60 1.1 51.5 18-01-2020 Single Phase
64 JR50 0.75 48 18-01-2020 Single Phase
65 JR3+ 34 18-01-2020 Single Phase
66 MCH80 0.55 34 18-01-2020 Single Phase
67 CHV1HH 0.37 39 18-01-2020 Single Phase
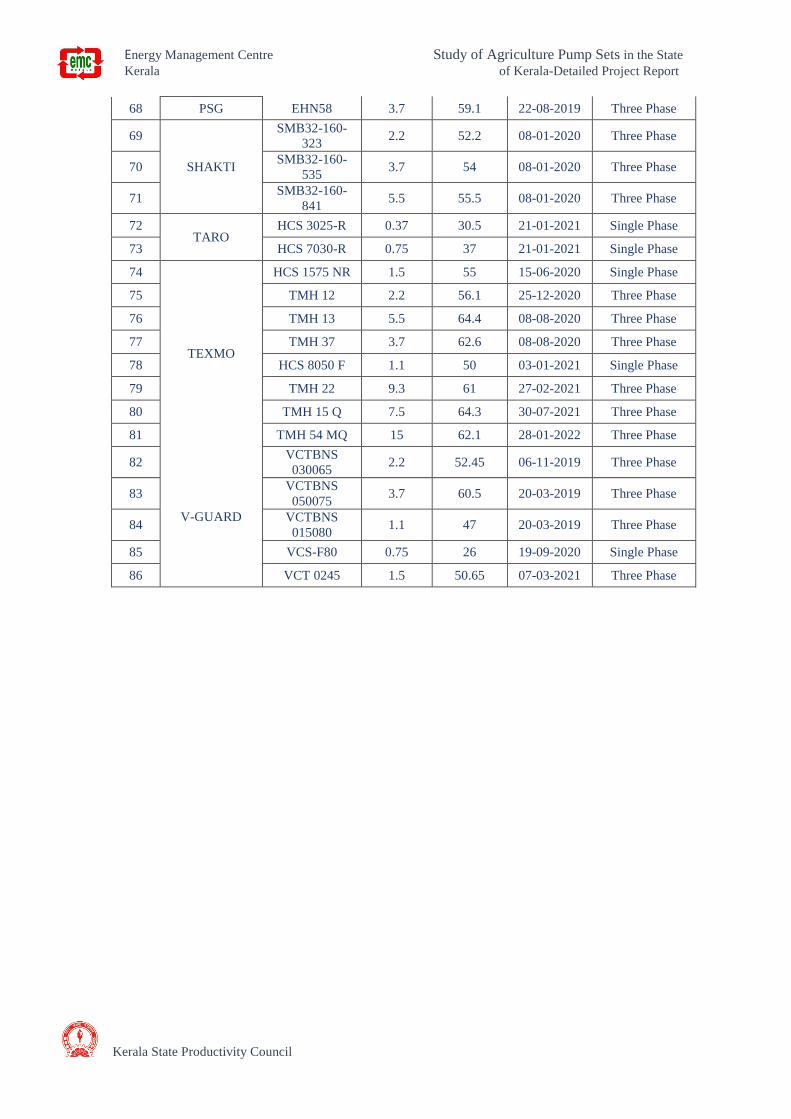
Energy Management Centre Study of Agriculture Pump Sets in the State
Kerala of Kerala-Detailed Project Report
Kerala State Productivity Council
68 PSG EHN58 3.7 59.1 22-08-2019 Three Phase
69
SHAKTI
SMB32-160-
323 2.2 52.2 08-01-2020 Three Phase
70 SMB32-160-
535 3.7 54 08-01-2020 Three Phase
71 SMB32-160-
841 5.5 55.5 08-01-2020 Three Phase
72 TARO
HCS 3025-R 0.37 30.5 21-01-2021 Single Phase
73 HCS 7030-R 0.75 37 21-01-2021 Single Phase
74
TEXMO
HCS 1575 NR 1.5 55 15-06-2020 Single Phase
75 TMH 12 2.2 56.1 25-12-2020 Three Phase
76 TMH 13 5.5 64.4 08-08-2020 Three Phase
77 TMH 37 3.7 62.6 08-08-2020 Three Phase
78 HCS 8050 F 1.1 50 03-01-2021 Single Phase
79 TMH 22 9.3 61 27-02-2021 Three Phase
80 TMH 15 Q 7.5 64.3 30-07-2021 Three Phase
81 TMH 54 MQ 15 62.1 28-01-2022 Three Phase
82
V-GUARD
VCTBNS
030065 2.2 52.45 06-11-2019 Three Phase
83 VCTBNS
050075 3.7 60.5 20-03-2019 Three Phase
84 VCTBNS
015080 1.1 47 20-03-2019 Three Phase
85 VCS-F80 0.75 26 19-09-2020 Single Phase
86 VCT 0245 1.5 50.65 07-03-2021 Three Phase
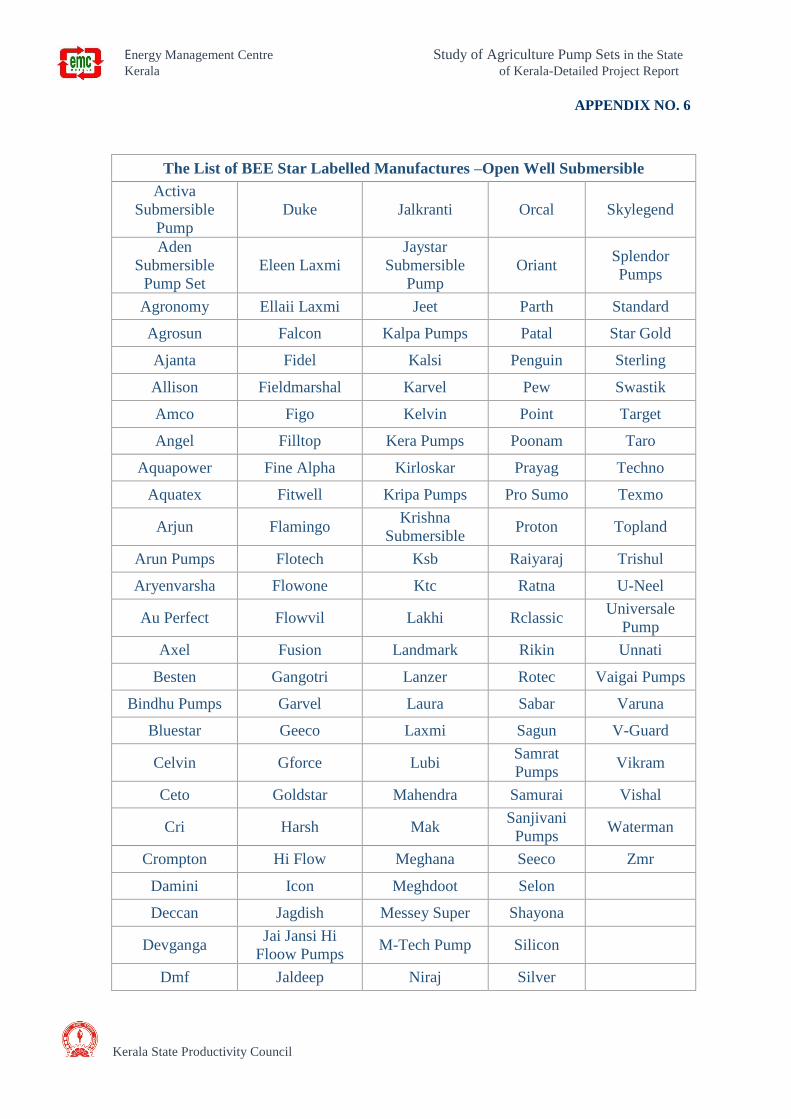
Energy Management Centre Study of Agriculture Pump Sets in the State
Kerala
Kerala State Productivity Council
of Kerala-Detailed Project Report
APPENDIX NO. 6
The List of BEE Star Labelled Manufactures –Open Well Submersible
Activa
Submersible
Pump
Duke Jalkranti Orcal Skylegend
Aden
Submersible
Pump Set
Eleen Laxmi
Jaystar
Submersible
Pump
Oriant Splendor
Pumps
Agronomy Ellaii Laxmi Jeet Parth Standard
Agrosun Falcon Kalpa Pumps Patal Star Gold
Ajanta Fidel Kalsi Penguin Sterling
Allison Fieldmarshal Karvel Pew Swastik
Amco Figo Kelvin Point Target
Angel Filltop Kera Pumps Poonam Taro
Aquapower Fine Alpha Kirloskar Prayag Techno
Aquatex Fitwell Kripa Pumps Pro Sumo Texmo
Arjun Flamingo Krishna
Submersible Proton Topland
Arun Pumps Flotech Ksb Raiyaraj Trishul
Aryenvarsha Flowone Ktc Ratna U-Neel
Au Perfect Flowvil Lakhi Rclassic Universale
Pump
Axel Fusion Landmark Rikin Unnati
Besten Gangotri Lanzer Rotec Vaigai Pumps
Bindhu Pumps Garvel Laura Sabar Varuna
Bluestar Geeco Laxmi Sagun V-Guard
Celvin Gforce Lubi Samrat
Pumps Vikram
Ceto Goldstar Mahendra Samurai Vishal
Cri Harsh Mak Sanjivani
Pumps Waterman
Crompton Hi Flow Meghana Seeco Zmr
Damini Icon Meghdoot Selon
Deccan Jagdish Messey Super Shayona
Devganga Jai Jansi Hi
Floow Pumps M-Tech Pump Silicon
Dmf Jaldeep Niraj Silver
