june 2016 investor conference presentation
TRANSCRIPT

June 2016 Investor Conference Presentation

Forward Looking Statements
Statements and information included in this presentation that are not purely historical are forward-looking statementswithin the meaning of the Private Securities Litigation Reform Act of 1995 and are made pursuant to the “safe harbor”provisions of such Act .
Forward-looking statements include, but are not limited to statements regarding our expectations, intentions, beliefsand strategies regarding the future, including statements regarding trends, cyclicality and changes in the markets wesell into; strategic direction; changes to procurement processes; the cost of compliance with environmental and otherlaws; expected tax rates; planned capital expenditures; liquidity positions; ability to generate cash from continuingoperations; the potential impact of adopting new accounting pronouncements; expected financial results, includingrevenue and profitability; obligations under our retirement plans; savings or additional costs from business integrationsand cost containment programs; and the adequacy of accruals.
All forward-looking statements we make are based on information available to us at the time the statements are made,and we assume no obligation to update any forward-looking statements, except as may be required by law. Thepotential risks and uncertainties that could cause actual results to differ from the results predicted or implied by ourforward-looking statements include, among others, changes in federal or state laws or regulations that affect ourbusiness, changes in the types of replacement parts that insurance carriers will accept, fluctuations in the prices ofmetals, as well as the risks and uncertainties included under the captions “Risk Factors” and “Management’s Discussionand Analysis of Financial Condition and Results of Operations” in our Annual Report on Form 10-K for the year endedDecember 31, 2015 and any of our subsequent Quarterly Reports on Form 10-Q. These reports are available on ourinvestor relations website at lkqcorp.com and on the SEC website at sec.gov.

Mission Statement
To be the leading global value-added distributor of vehicle parts and accessories
by offering our customers the most comprehensive, available and cost effective
selection of part solutions while building strong partnerships with our employees and
the communities in which we operate.
2

LKQ’s Evolution
3
Total Revenue$328M
Total Revenue$1.11B
Total Revenue$3.27B
Aftermarket Collision
Refurbished Wheels Heavy Duty Europe-UK Keystone Specialty
Wholesale Salvage Self Serve Keystone / Paint Reman-US Europe-Benelux Rhiag / PGW
18%
29%
2%2%
28%
15%
6%
Total Revenue$7.34B
Recycled Products Aftermarket NA Self Service-Parts Heavy Truck-Parts European Operations Specialty Other
2003 2007 2011 2016*
* TTM as of 3/31/2016
1998 2004 2005 2006 2007 2008 2009 2010 2011 2012 2013 2014 2015 2016

Operating Unit Overview
North America
• Collision
– Aftermarket automotive products
– Recycled & Refurbished
• Mechanical
– Recycled engines & transmissions
– Remanufactured Engines
Europe
• Mechanical
– 175,000+ small part SKUs
– Brakes, filters, hoses, belts, etc.
• Collision (limited)
— Aftermarket (UK)
— Recycled (Sweden)
Specialty
– Performance products
– Appearance & accessories
– RV, trailer & other
– Specialty wheels & tires
4
(1) TTM 3/31/16(2) Pro Forma 2015 reflects a full year impact of Rhiag and PGW acquisitions. Financial information reflects FY 2015 for LKQ, LTM 9/30/2015 for Rhiag and LTM 10/31/2015 for PGW.
Revenue
Parts & Services Revenue by Business Line
Parts & Services94%
Other6%
55%
15%
30%42%
12%
34%
12%
North America Europe Specialty Glass
2015 Actual 2015 Pro Forma with Rhiag and PGW (2)
(1)

Operating Segments

Large & Fragmented US Market
6
Automotive Repair Market
$213 bn
Do It For Me (DIFM)
$165 bn
Collision
$40 bn
Collision Parts
$22 bn
Collision
(Wholesale)
$15 bn
Markup
$7 bn
Labor
$18 bn
Mechanical
$125 bn
Mechanical Parts
$68 bn
Mechanical
(Wholesale)
$46 bn
Markup
$22 bn
Labor
$57 bn
DIY(1)
$48 bn
Retail
Price
Parts &
Labor
Market Opportunity – $61 billion
Source: AAIA Factbook, 24rd Edition 2014; 2014 data is estimated, excludes tires.2014 Collision Trends.(1) * Do It Yourself ecommerce only.

Collision Products, a $15 Billion Industry
7
Repair Shop
New OEM Manufacturers
64%
Aftermarket18%
Recycled OEM12%
Refurbished & Optional OE
Products6%
Insurance Companies (Indirect Customers)
Alternative parts = 36% of parts costs
Source: CCC Information Services –Crash Course 2015.

Clear Value Proposition
8
…and Improved Cycle Time for Repairs
2008 Chevrolet Corvette
Wheel2006 Chevrolet Silverado
Engine2005 Honda Accord
Bumper Cover
New OEM $995 $3,499 $610
Remanufactured $454 $2,454 $272
Recycled OEM $425 $1,450 $345
New A/M $354 N/A $231
Average Savings 55% 39% 49%
Note: Parts price only – excludes labor.

Shift Toward Alternative Parts Usage
9
Source: CCC Information Services Inc.
Over 20 million vehicle claims
5.8
2.1
7.9
6.4
2.8
9.2
0.0
2.0
4.0
6.0
8.0
10.0
OEM Alternative Parts Total
2010 2011 2012 2013 2014 2015
Average Parts Used Per Claim
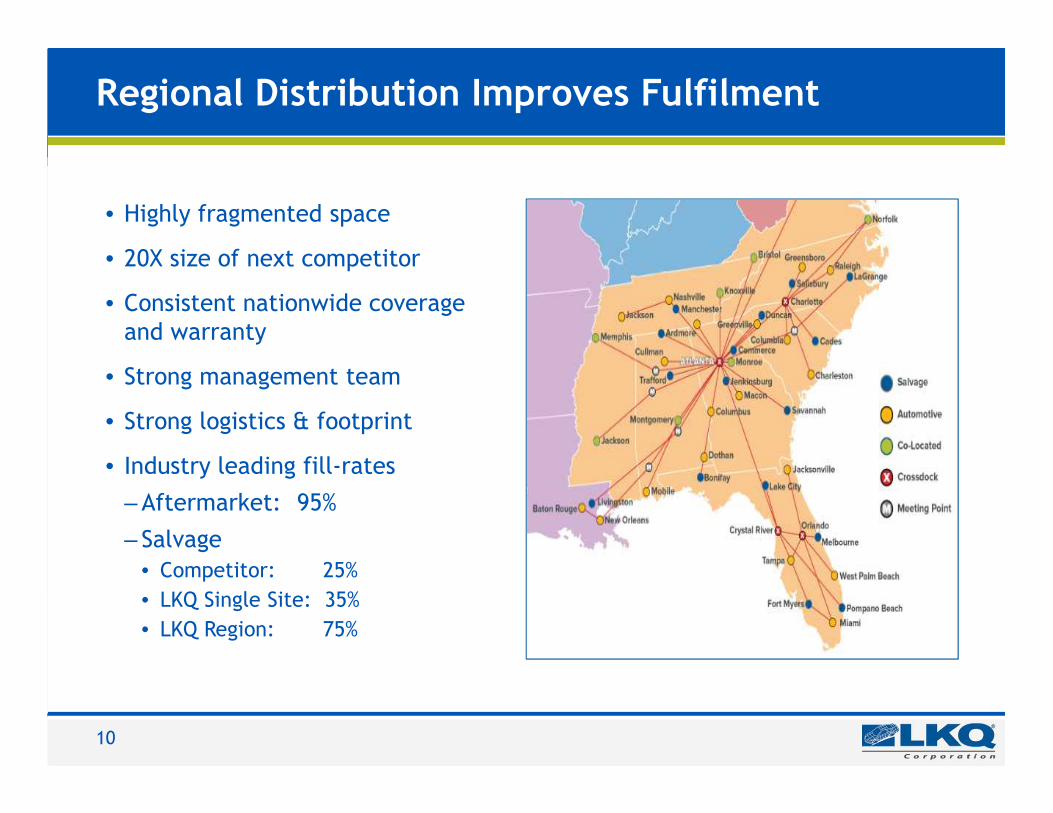
Regional Distribution Improves Fulfilment
• Highly fragmented space
• 20X size of next competitor
• Consistent nationwide coverage and warranty
• Strong management team
• Strong logistics & footprint
• Industry leading fill-rates
– Aftermarket: 95%
– Salvage• Competitor: 25%
• LKQ Single Site: 35%
• LKQ Region: 75%
10

Wholesale North America Footprint
11

4 year timehorizon
LKQ’s “Sweet Spot” is Growing
12
2004 2005 2006 2007 2008 2009 2010 2011 2012 2013 2014 2015 2016 2017 2018 2019
New 17 17 17 16 13 10 12 13 14 16 16 17 18 19 20 19
3-10 years 114 115 117 119 118 117 113 107 102 97 95 94 94 98 106 114
3-7 years 68 68 67 67 67 66 63 56 51 48 49 54 59 64 68 71
17 17 17 16
13
10 12
13 14
16 16 17 18 19 20 19
114 115 117 119 118 117 113
107 102
97 95 94 94 98
106
114
68 68 67 67 67 66 63
56 51
48 49 54
59 64
68 71
-
5
10
15
20
25
30
35
40
45
50
-
20
40
60
80
100
120
140
Num
ber
of
Vehic
les
(millions)
Sources: Sales & Production-Wards; Projections-Bank of America Merrill Lynch, 1/11/2016.Data assumes oldest vehicles are retired first in each year (not a precise assumption).
Age & size of US Car Parc

Crash Avoidance Systems Growing…But Impact will Be Very Slow
13
(0.1%)
(0.1%)
(0.2%)
(0.2%)
(0.4%)
(0.7%)
(3.3%)
(6.8%)
(10.3%)
(13.8%)
(17.3%)
(20.8%)
(24.3%)
(30.0%)(25.0%)(20.0%)(15.0%)(10.0%) (5.0%) 0.0%
CY 2010
CY 2011
CY 2012
CY 2013
CY 2014
CY 2015
CY 2020
CY 2025
CY 2030
CY 2035
CY 2040
CY 2045
CY 2050
78%
22%
CY 2040
All Other
Conventional Gasoline Vehicles
U.S. EIA Energy Outlook 2014
Light Duty Vehicle Sales by Energy Use
CCC estimates a 10.3% impact to losses in next 15 years
Source: CCC Information Services Inc.

Europe - Market Observations
14
• Large car parc
• Fragmented industry
• Dominated by country champions
• In transition from 3 step to 2 step distribution
• Professional repairer focused
• Segmented by the suppliers
• Focused on mechanical parts
• Low penetration of alternative collision parts with ~7% APU across Europe
Sweden
U. K.

Large European Market
15
Automotive Repair Market €198B
Do It For Me (DIFM)€188B
Collision€30B
Collision Parts€22B
Collision(Wholesale)
€14B
Markup€8B
Labor€8B
Mechanical€158B
Mechanical Parts€120B
Mechanical(Wholesale)
€78B
Markup€42B
Labor€38B
DIY (1)
€10B
Market Opportunity – €102 billion
Retail Price
Parts & Labor
Source: 2014 Datamonitor; Management estimates.Note: All € in millions; Excludes VAT and sales taxes.(1) Do It Yourself e-commerce only.

European Operations
16
• Leading distributor of automotive aftermarket mechanical parts in the UK
• Nearly 55,000 commercial customers
• 3 National Distribution Centers totaling 1.2M square feet
• 17 regional hubs, 199 branches, 20 paint distribution locations
• Leading distributor of automotive aftermarket mechanical parts in the Benelux
• Proprietary, best-in-class online ordering technology for local distributors & repair shops
• Opportunity for meaningful purchasing synergies with Euro Car Parts
• 11 distribution centers & 84 branches
• Rhiag is the leading automotive aftermarket mechanical parts distributor in Italy, The Czech Republic & Slovakia; #2 or #3 position in 6 other countries in Central & Eastern Europe
• Italy & Switzerland distribution networks operate under a 3 step model & Eastern Europe under a 2 step model
• Rhiag utilizes a network of 252 DC’s and 247 local branches, distributing product to over 5,700 wholesale customers.

Specialty
17
• Leading distributor and marketer of specialty aftermarket equipment, accessories, and products in North America
• Critical link between 800+ suppliers and approximately 20,000 customers selling over 250,000 total SKUs supported by a highly technical sales force
• Diverse product segments: truck and off-road; speed and performance; recreational vehicle; towing; wheels, tires and performance handling; and miscellaneous accessories
• Best-in-class logistics and distribution network with approximately 1,000,000 annual deliveries and ability to serve over 97% of dealer / jobber customers next-day
Specialty Directly Addressable Market (1)
($ in billions)
Specialty Overview
(1) Management estimates based on AAIA Factbook, SEMA and other industry research
Accessory and Appearance
$3.13B28%
Performance Products$3.99B
36%
RV and Towing$1.37B
12%
Wheels, Tires & Suspension
$2.65B24%
Towing
5th Wheels
Receiver Hitches
Wheels and Tires
Tires
Wheels
Accessories
Floor Liners
Fender Flares
Truck & Off-Road
Toolboxes
Winches
Speed & Performance
Superchargers
Air Intakes
Satellites
RV
Awnings

Automotive Glass
• Pittsburgh Glass Works LLC (“PGW” or the “Company”) is the leading North American manufacturer, supplier and distributor of automotive glass products
– #1 in OEM with approximately 20 global customers across 78 platforms
– #2 in aftermarket serving over 7,000 customers
• Worldwide, low-cost manufacturing footprint integrated across global supply chain
• Positioned to capitalize on increased use of innovative, high value applications
• Significant customer overlap with existing collision related activities
Market Leading Auto Glass Select Automotive Glass Capabilities
Global Manufacturing and Distribution Footprint(1)
Windshields Sidelites Backlites Roof Panels
(1) Facilities in Mexico and China are partially-owned JVs.(2) Management’s estimates.(3) U.S. distributed share.
12North
America
1
Mexico
1
Europe 1
China
OEM or ARG Presence Other countries served
North American AutomotiveGlass Competitive Landscape(2)
~22%
~78%
~25%
~75%
OEM Aftermarket(3)
Market Size: $2.3 billion Market Size: $1.2 billion
18

19
Consistent Business Model and Strategy
Niche and Fragmented
Markets
Industry Leading Management
High Fulfillment
Rates
Synergy and Leverage
Opportunities
Sustainable
Growth and Margin
Expansion
Attractive Adjacent Markets

Financial Overview

History of Strong Organic Growth
21
Organic Revenue Growth Rates(1)
(1) Parts and services only.
6.6%
7.9%
6.0%
11.0%
9.0%
7.0%
6.3%
0.0%
2.0%
4.0%
6.0%
8.0%
10.0%
12.0%
2010 2011 2012 2013 2014 2015 Q1-2016

LKQ’s Acquisition Philosophies
22
• Markets where we can be #1 or #2
• Strong and experienced management
• Opportunities for growth & synergies
• Financial returns
– IRR (mid-teens over 10 years)
– ROIC (10 years’ average >10%)
• Integrity
• Criteria in new markets
– Among the leaders in the market
– High fulfillment rates
– Consistent with LKQ culture
– Excellent management team that will stay post closing
• Criteria in existing markets
– “Tuck in” companies
– High synergies
– Additional capacity
• Substantial experience integrating acquisitions
Strong Brands

Historical Financial Performance
23
(1) $ in millions(2) Pro Forma 2015 reflects a full year impact of Rhiag and PGW acquisitions. Financial information reflects FY 2015 for LKQ, LTM 9/30/2015 for Rhiag and LTM 10/31/2015 for PGW. (3) Represents (i) LKQ Segment EBITDA and (ii) Adjusted EBITDA as defined by Rhiag and PGW with LTM results further adjusted by LKQ. (4) Debt/Adjusted EBITDA on a reported basis for 2010-2015 and a Pro Forma Basis for 2015 (see footnote 2)
Adjusted EBITDA(1)(2)(3)Revenue(1)(3)
Leverage (4)Cash Flow/Capex(1)
$159 $212 $206
$428 $371
$530
$61 $86 $88 $90 $141 $170
$-
$100
$200
$300
$400
$500
$600
2010 2011 2012 2013 2014 2015
Operating Cash Flow Capital Spending
$341 $424
$515 $629
$791 $855
$1,066
$-
$200
$400
$600
$800
$1,000
2010 2011 2012 2013 2014 2015 PF 2015
$2,470 $3,270
$4,123 $5,063
$6,740 $7,193
$9,230
$-
$2,000
$4,000
$6,000
$8,000
$10,000
2010 2011 2012 2013 2014 2015 PF 2015
1.8x 2.3x 2.2x 2.1x 2.4x
1.9x
3.2x
0.0x
1.0x
2.0x
3.0x
4.0x
5.0x
2010 2011 2012 2013 2014 2015 PF 2015

24
Q1 2016 Consolidated Results
Q1 2016
* Revenue in millions
• Organic growth of parts and services revenue of 6.3% • Segment EBITDA Margin** 12.3% Q1 2016 vs. 12.5% Q1 2015 • Adjusted diluted EPS*** increased 10.5% over Q1 2015
*** Refer to Adjusted Diluted EPS reconciliation on page 27** Refer to Segment EBITDA reconciliation on page 26
25
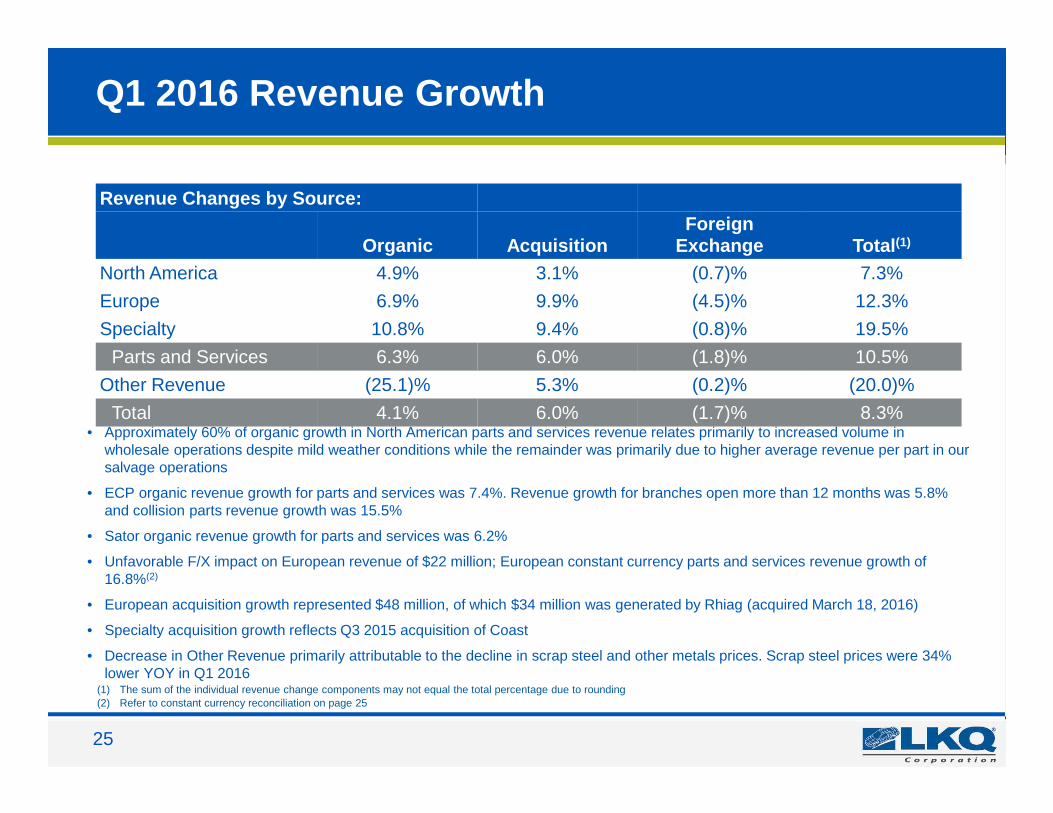
Q1 2016 Revenue Growth
• Approximately 60% of organic growth in North American parts and services revenue relates primarily to increased volume in wholesale operations despite mild weather conditions while the remainder was primarily due to higher average revenue per part in our salvage operations
• ECP organic revenue growth for parts and services was 7.4%. Revenue growth for branches open more than 12 months was 5.8% and collision parts revenue growth was 15.5%
• Sator organic revenue growth for parts and services was 6.2%
• Unfavorable F/X impact on European revenue of $22 million; European constant currency parts and services revenue growth of 16.8%(2)
• European acquisition growth represented $48 million, of which $34 million was generated by Rhiag (acquired March 18, 2016)
• Specialty acquisition growth reflects Q3 2015 acquisition of Coast
• Decrease in Other Revenue primarily attributable to the decline in scrap steel and other metals prices. Scrap steel prices were 34% lower YOY in Q1 2016
(1) The sum of the individual revenue change components may not equal the total percentage due to rounding
Revenue Changes by Source:
Organic AcquisitionForeign
Exchange Total(1)
North America 4.9% 3.1% (0.7)% 7.3%
Europe 6.9% 9.9% (4.5)% 12.3%
Specialty 10.8% 9.4% (0.8)% 19.5%
Parts and Services 6.3% 6.0% (1.8)% 10.5%
Other Revenue (25.1)% 5.3% (0.2)% (20.0)%
Total 4.1% 6.0% (1.7)% 8.3%
(2) Refer to constant currency reconciliation on page 25

26
Q1 2016 Operating Highlights
Europe
• On March 18, 2016, LKQ and its wholly-owned subsidiary LKQ Italia S.r.l. acquired Rhiag. Subsequent to the acquisition, we redeemedRhiag's public bonds and in early Q2, issued €500 million of 8 year senior notes.
• ECP's new national distribution center (Tamworth 2) is on track and on budget. We took possession of the building in Q1 and have begunto use the site for storage. We began recognizing rent and other property costs during Q1 with costs to date of £1.2 million ($1.8 million).
• Sator continued to integrate the acquired distributors to convert a portion of Sator's network to a two-step model.
• We acquired a small salvage business in Sweden in January 2016.
Specialty
• Integrated two additional Coast warehouses during Q1. As of March 2016, 7 of 17 Coast warehouses have been consolidated into theSpecialty network.
• Organic growth in Specialty parts and services revenue reflects an increase in service levels in various regions of North America as weadd delivery capacity to our integrated distribution network to allow us to realize synergies associated with the integration of Coast. Inaddition, we continue to see growth from favorable macro trends and economic conditions (which has increased consumer discretionaryspending on automotive and RV parts and accessories), as well as a boost from mild winter weather in 2016.
• Specialty distribution centers in Brownstown, MI and Spokane, WA became fully operational during Q1.
North America
• Roadnet routing software installed in 65% of North American fleet representing over 2,500 vehicles. Currently tracking over 140,000miles and 22,000 deliveries daily. Software will be fully installed and utilized by year-end.
• Sales responsibilities realignment in the US created a separate and more focused sales team.
• New sales KPIs being implemented. Early results positive and resulting in an increase in total talk time by 27% in Q1.
• New automated inventory tablet rolled out to 51 dismantling locations. Tablets will streamline the processing of vehicles, improveinventory accuracy and enhance the harvesting of parts.

27
Q1 2016 Capital Allocation
• Operating cash flows:- $152M of cash earnings(1) in Q1 2016 compared to $141M in Q1 2015- $22M cash outflow from operating assets and liabilities mainly $78M of receivables (seasonal build in
Q1) outflow and $13M of Rhiag related interest payments due to paying off the acquired Rhiag debt
• Investing activities include $601M related to the our acquisition of Rhiag less proceeds from ACM Parts and FX Hedge gain
• Financing activities include $1.2B increase in cash as a result of borrowings on our revolving credit facility and receivables securitization facility to fund the acquisition of Rhiag and to pay off debt assumed and related costs of $543M
(1) Cash earnings from the cash flow statement equals Net Income plus Depreciation and Amortization plus Stock-based Compensation Expense plus Deferred Income Tax plus Excess Tax Benefit from Stock-based Payments plus Costs Associated with Early Debt Termination plus Gain on Foreign Exchange Contract plus Other
28
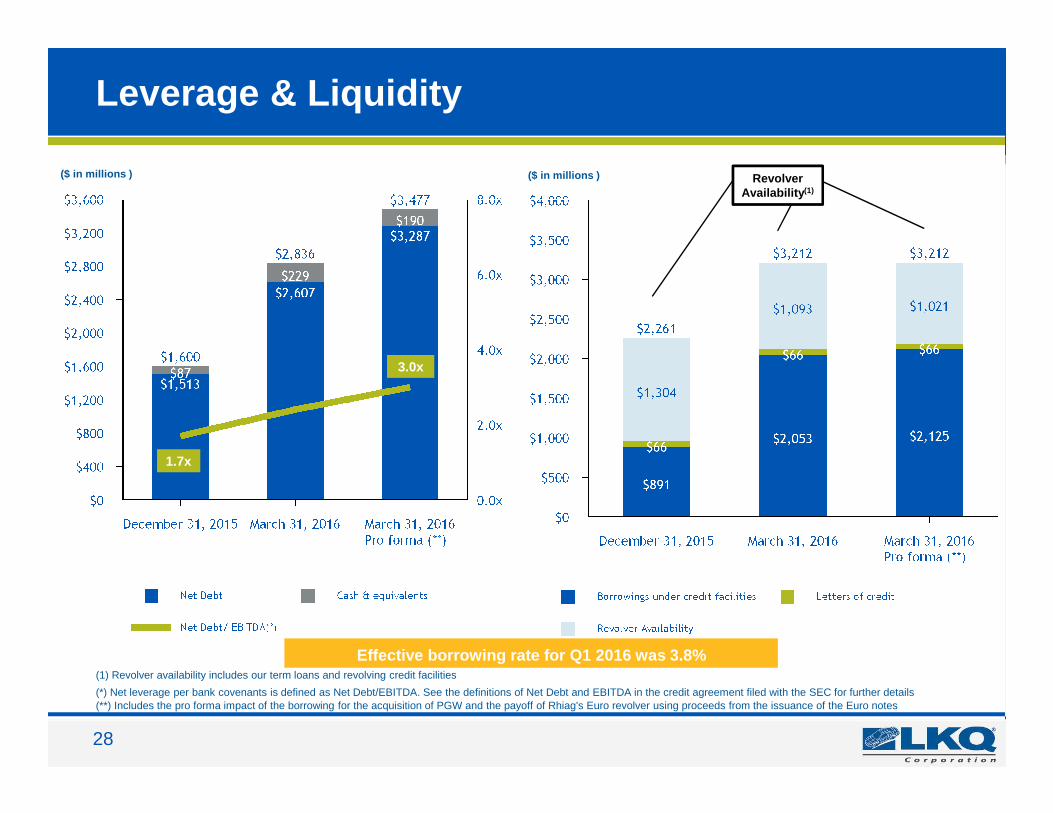
Leverage & Liquidity
Effective borrowing rate for Q1 2016 was 3.8%
Revolver Availability(1)
($ in millions )
(*) Net leverage per bank covenants is defined as Net Debt/EBITDA. See the definitions of Net Debt and EBITDA in the credit agreement filed with the SEC for further details
1.7x
3.0x
(1) Revolver availability includes our term loans and revolving credit facilities
($ in millions )
(**) Includes the pro forma impact of the borrowing for the acquisition of PGW and the payoff of Rhiag's Euro revolver using proceeds from the issuance of the Euro notes

29
Key Return Metrics
Return on Equity Return on Invested Capital

30
Guidance 2016 (effective only on the date issued: April 28, 2016)
(1) Guidance for 2016 is based on current conditions and excludes the impact of restructuring and acquisition related expenses, losses on debt extinguishment and amortization expense related to acquired intangibles. In addition, it excludes gains or losses (including changes in fair value of contingent consideration liabilities) and capital spending related to acquisitions or divestitures. Full year 2015 actual figures for Adjusted Net Income and Adjusted Diluted EPS were calculated using the same methodology as the 2016 guidance. Organic revenue guidance refers only to parts and services revenue. LKQ updated its guidance on April 28, 2016, and it is only effective on the date of issuance. It is LKQ’s policy to comment on its annual guidance only when the company issues its quarterly press releases with financial results. LKQ has no obligation to update this guidance.
($ in millions excluding EPS)
Full Year 2015 Actual
Full Year 2016 Guidance(1)
Organic Revenue Growth, for parts and services 7.0% 6.0%-8.0%
Adjusted Net Income $459 $545-$575
Adjusted Diluted EPS $1.49 $1.76-$1.86
Cash Flow from Operations $530 $575-$625
Capital Expenditures $170 $200-$225
Note: Guidance includes the projected results of Rhiag and PGW from the respective acquisition dates through year-end.
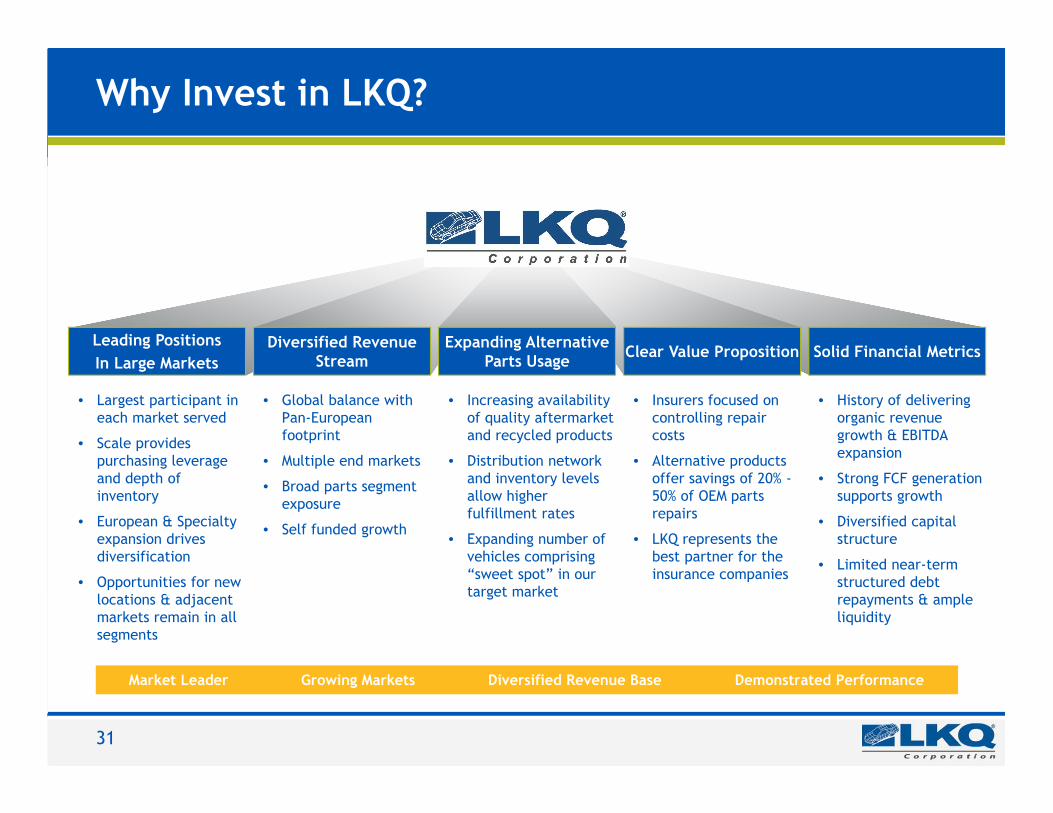
Why Invest in LKQ?
31
Market Leader Growing Markets Diversified Revenue Base Demonstrated Performance
Expanding Alternative Parts Usage
• Increasing availability of quality aftermarket and recycled products
• Distribution network and inventory levels allow higher fulfillment rates
• Expanding number of vehicles comprising “sweet spot” in our target market
Solid Financial Metrics
• History of delivering organic revenue growth & EBITDA expansion
• Strong FCF generation supports growth
• Diversified capital structure
• Limited near-term structured debt repayments & ample liquidity
Clear Value Proposition
• Insurers focused on controlling repair costs
• Alternative products offer savings of 20% -50% of OEM parts repairs
• LKQ represents the best partner for the insurance companies
• Global balance with Pan-European footprint
• Multiple end markets
• Broad parts segment exposure
• Self funded growth
Diversified Revenue Stream
Leading Positions
In Large Markets
• Largest participant in each market served
• Scale provides purchasing leverage and depth of inventory
• European & Specialty expansion drives diversification
• Opportunities for new locations & adjacent markets remain in all segments

Appendix
33
Appendix - Non-GAAP Financial Measures
The financial data contained in the presentation materials includes earnings before interest, taxes, depreciation andamortization ("EBITDA") and provides a reconciliation of net income to EBITDA. The financial data contained in thepresentation materials also includes adjusted net income and adjusted diluted earnings per share ("EPS") and providesa reconciliation of net income and diluted EPS to adjusted net income and adjusted diluted EPS. The Company definesadjusted net income and adjusted diluted EPS as net income and diluted EPS adjusted to eliminate the impact ofrestructuring and acquisition related expenses, net of tax, loss on debt extinguishment, net of tax, amortization expenserelated to acquired intangibles, net of tax, the change in fair value of contingent consideration liabilities and otheracquisition related gains and losses. EBITDA, adjusted net income and adjusted diluted EPS are not measures offinancial performance under generally accepted accounting principles in the United States.
We have presented EBITDA, adjusted net income and adjusted diluted EPS information solely as supplementaldisclosures because we believe they offer investors, securities analysts and other interested parties useful informationregarding our results of operations because they assist in analyzing our performance and the value of our business.EBITDA provides insight into our profitability trends, and allows management and investors to analyze our operatingresults with and without the impact of depreciation, amortization, interest and income tax expense. We believe EBITDAis used by securities analysts, investors and other interested parties in evaluating companies, many of which presentEBITDA when reporting their results. EBITDA should not be construed as an alternative to operating income, netincome or net cash provided by (used in) operating activities, as determined in accordance with accounting principlesgenerally accepted in the United States. Adjusted net income and adjusted diluted EPS are presented as supplementalmeasures of our performance that management believes are useful for evaluating and comparing our operatingactivities across reporting periods. Adjusted net income and adjusted diluted EPS should not be construed asalternatives to net income or diluted EPS as determined in accordance with accounting principles generally accepted inthe United States. Not all companies that report EBITDA, adjusted net income and adjusted diluted EPS informationcalculate these measures in the same manner as we do and, accordingly, our calculations are not necessarilycomparable to similarly named measures of other companies and may not be appropriate measures for performancerelative to other companies.

34
Appendix 1- Constant Currency Reconciliation
• The following unaudited table reconciles revenue growth for Parts and Services to constant currency revenue growth for the same measure:
• We evaluate growth in our operations on both an as reported and a constant currency basis. The constant currencypresentation, which is a non-GAAP measure, excludes the impact of fluctuations in foreign currency exchange rates.We believe providing constant currency information provides valuable supplemental information regarding our growth,consistent with how we evaluate our performance. Constant currency revenue results are calculated by translatingprior year revenue in local currency using the current year's currency conversion rate. This non-GAAP measure haslimitations as an analytical tool and should not be considered in isolation or as a substitute for an analysis of ourresults as reported under GAAP. Our use of this term may vary from the use of similarly-titled measures by otherissuers due to the potential inconsistencies in the method of calculation and differences due to items subject tointerpretation.
Three Months EndedMarch 31, 2016
Consolidated Europe
Parts and Services
Revenue Growth as reported 10.5% 12.3%
Less: Currency impact (1.8%) (4.5%)
Revenue growth at constant currency 12.3% 16.8%

35
Appendix 2- EBITDA and Segment EBITDA Reconciliation
* Loss on debt extinguishment is considered a component of interest in calculating EBITDA** The sum of the individual components may not equal the total due to rounding.
QTD**
(in millions) Q1 2016% of
revenue Q1 2015% of
revenue
Segment EBITDA
North America $ 147.4 13.6% $ 149.4 14.3%
Europe 57.5 10.5% 46.5 9.5%
Specialty 31.7 11.0% 25.4 10.5%
Total Segment EBITDA $ 236.6 12.3% $ 221.3 12.5%
Deduct:
Restructuring and acquisition related expenses 14.8 6.5
Change in fair value of contingent consideration liabilities 0.1 0.2
Add:
Equity in earnings of unconsolidated subsidiaries (0.4) (1.9)
Gains on foreign exchange contracts- acquisition related (18.3) —
EBITDA $ 239.7 12.5% $ 212.8 12.0%
Depreciation and Amortization 33.2 30.7
Interest Expense, Net 14.6 14.9
Loss on debt extinguishment* 26.7 —
Provision for Income Taxes 57.6 60.1
Net Income $ 107.7 $ 107.1

36
Appendix 3- Adjusted Net Income and EPS Reconciliation*
(in millions, except per share data) Q1 2016* Q1 2015*
Net Income $107.7 $107.1
Adjustments:
Restructuring and acquisition related expenses, net of tax 9.7 4.2
Loss of debt extinguishment, net of tax 17.4 —
Amortization of acquired intangibles, net of tax 5.8 5.3
Change in fair value of contingent consideration liabilities 0.1 0.2Gains on foreign exchange contracts- acquisition related, net of tax
(12.0) —
Adjusted net income $128.7 $116.8
Weighted average diluted common shares outstanding 308,369 306,691
Diluted earnings per share $0.35 $0.35
Adjusted diluted earnings per share $0.42 $0.38
*The sum of the individual components may not equal the total due to rounding.

37
Appendix 4- Adjusted Net Income and EPS Reconciliation*
(in millions, except per share data) 2015** 2014** 2013** 2012** 2011**
Net Income $423.2 $381.5 $311.6 $261.2 $210.3
Adjustments:
Restructuring and acquisition related expenses, net of tax 12.8 9.7 6.6 1.7 4.8
Loss on debt extinguishment, net of tax — 0.2 1.8 — 3.3
Change in fair value of contingent consideration liabilities 0.5 (1.9) 2.5 1.6 (1.4)
Amortization of acquired intangibles, net of tax 22.1 22.5 9.0 6.0 4.9
Adjusted net income $458.6 $412.0 $331.5 $270.7 $221.9
Weighted average diluted common shares outstanding307,496 306,045 304,131 300,693 296,750
Diluted earnings per share $1.38 $1.25 $1.02 $0.87 $0.71
Adjusted diluted earnings per share $1.49 $1.35 $1.09 $0.90 $0.75
**The sum of the individual components may not equal the total due to rounding.*Reflects the revision to Adjusted EPS to exclude amortization of acquired intangibles. Prior years information is presented for comparability.

38
Appendix 5- 2015 Quarterly Adjusted Net Income and EPS Reconciliation*
(in millions, except per share data) Q4** Q3** Q2** Q1**
Net Income $95.1 $101.3 $119.7 $107.1
Adjustments:
Restructuring and acquisition related expenses, net of tax 4.5 3.0 1.1 4.2
Change in fair value of contingent consideration liabilities 0.1 0.1 0.1 0.2
Amortization of acquired intangibles, net of tax 6.0 5.4 5.4 5.3
Adjusted net income $105.6 $109.9 $126.3 $116.8
Weighted average diluted common shares outstanding308,028 307,728 307,247 306,691
Diluted earnings per share $0.31 $0.33 $0.39 $0.35
Adjusted diluted earnings per share $0.34 $0.36 $0.41 $0.38
**The sum of the individual components may not equal the total due to rounding.*Reflects the revision to Adjusted EPS to exclude amortization of acquired intangibles.