june 2015report prepared for copp contract#1802 graffiti removal egs monthly report june 20151
TRANSCRIPT

June 2015REPORT
Prepared for COPP
Contract#1802
GRAFFITI REMOVAL
EGS Monthly Report June 2015 1

Executive SummaryExecutive Summary
EGS Monthly Report June 20152

EGS Monthly Report June 2015 3
Impact of Second Vehicle Impact of Second Vehicle
During the last 5 months COPP has engaged a second vehicle in Feb/Mar/Apr/May/June
Second Vehicle has been tasked with the weekly patrols of Carlisle St / Acland St / Bay St / Luna Park / O’Donnell Gardens and Marina Reserve in addition to assisting with run sheet and urgent works.
Total Volume removed during these periods 11,427m²
Total Volume removed without second vehicle 8,328m²
Monthly average without second vehicle 1,666m²
Monthly average with second vehicle 2,286m²
Engagement of second vehicle has resulted in a decrease of the number of hits and this has resulted in a substantial decrease in run requests for regularly patrolled areas. A majority of these jobs are smaller areas which have been identified during the extra weekly patrols.

Impact EvaluationImpact Evaluation
Mar2014
Apr2014
May2014
Jun2014
Jul2014
Aug2014
Sep2014
Oct2014
Nov2014
Dec2014
Jan2015
Feb 2015
Mar2015
Apr2015
May 2015
Jun2015
Jul2015
Aug2015
No. of Hits
72 111 121 78 104 82 102 81 72 69 54 85 185 116 120 100
Av Size of graffiti hit m2
20.8 15.8 17.4 16.7 19.8 20.2 9.8 15.6 16.2 14.3 14.6 16.8 16.85 20.66 15.14 18.14
Weekly Av of graffitim2
456 509 669 377 599 534 354 419 345 313 345 570 779 600 455 454
EGS Monthly Report June 2015 4
*Not including regular weekly patrols (Acland, Bay & Carlisle Streets, Marina Reserve, Luna Park and O’Donnell Gardens

EGS Monthly Report June 20155
Monthly Comparison
Feb – Mar YoY Comparison
2013 2014 201513,215m2 22,354m2 12,807m2
City Of Port Phillip City Of Port PhillipCity of Port Phillip
YearMont
hActual Sqm Year
Month
Actual Sqm Year Month
Actual Sqm
- - - 2014 Jan 1593 2015 Jan 13802013 Feb 754 2014 Feb 2515 2015 Feb 22812013 Mar 1545 2014 Mar 1823 2015 Mar 31182013 Apr 1046 2014 Apr 2035 2015 Apr 23972013 May 1034 2014 May 2678 2015 May 18172013 Jun 768 2014 Jun 1506 2015 Jun 18142013 Jul 1462 2014 Jul 2398 2015 Jul 2013 Aug 1830 2014 Aug 2138 2015 Aug 2013 Sept 920 2014 Sept 1416 2015 Sept 2013 Oct 1388 2014 Oct 1679 2015 Oct 2013 Nov 1357 2014 Nov 1380 2015 Nov 2013 Dec 1111 2014 Dec 1193 2015 Dec

EGS Monthly Report June 2015 6
FY2013 FY2014 FY2015MTH SQM Mnth by Mnth SQM Mnth by Mnth SQM Mnth by Mnth
MAR 1545 - 1823 - 62% 3118 +14%
APR 1046 - 32% 2035 +21% 2397 -13%
MAY 1034 - 1% 2678 + 13% 1817 -9%
JUN 768 -21% 1506 -56% 1814 -1%
JUL 1462 +54% 2398 + 64%
AUG 1830 + 25% 2138 - 16%SEP 920 - 40% 1416 -54%
OCT 1388 + 51% 1679 - 28%
NOV 1357 -9% 1380 - 8%
DEC 1111 - 12% 1193 -12%
JAN 1593 +29% 1380 +12%
FEB 2515 + 71% 2281 +60%
Yearly Total 12,461 22,354 12,807
6

EGS Monthly Report June 2015 7
Service Actual M²
Paint Out 38,115
High Pressure Clean 19,263
Poster Removal 41
7

EGS Monthly Report June 20158

EGS Monthly Report June 201599999
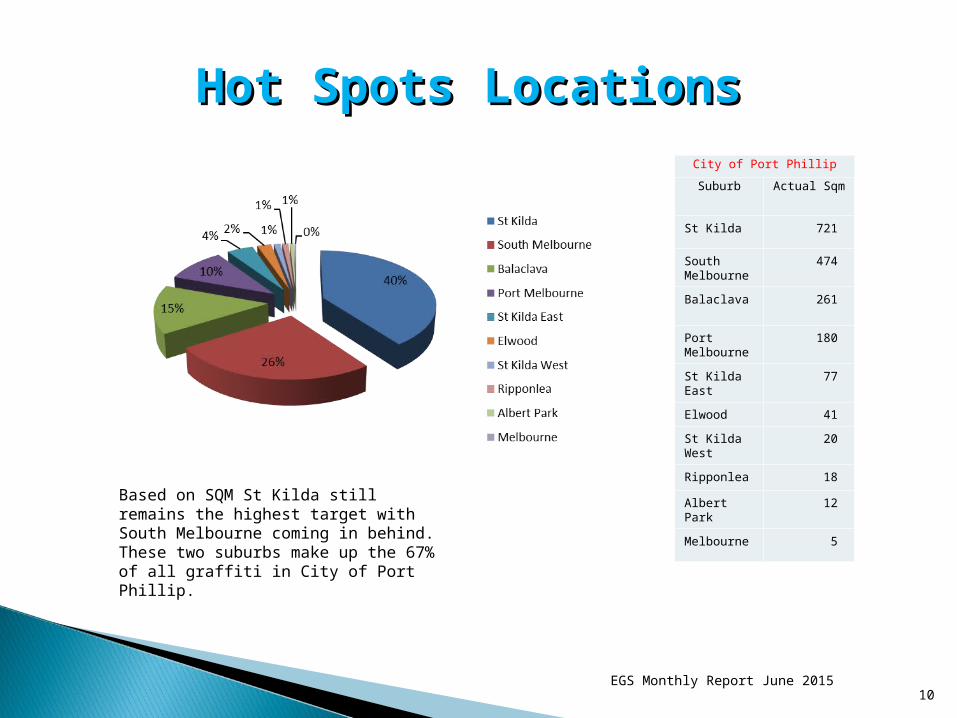
Hot Spots LocationsHot Spots Locations
EGS Monthly Report June 201510
City of Port Phillip
Suburb Actual Sqm
St Kilda 721
South Melbourne
474
Balaclava 261
Port Melbourne
180
St Kilda East
77
Elwood 41
St Kilda West
20
Ripponlea 18
Albert Park 12
Melbourne 5
Based on SQM St Kilda still remains the highest target with South Melbourne coming in behind. These two suburbs make up the 67% of all graffiti in City of Port Phillip.

EGS Monthly Report June 201511
Ownership Split by IncidentOwnership Split by Incident
Breakdown of the 100 jobs attended in June 2015. While June 2015 had a very slight reduction in graffiti removal, Residential and Council were again the high targets during the month as seen in this breakdown.

EGS Monthly Report June 2015
Actual percentage breakdown of the 100 jobs attended during June 2015
Ownership Split Ownership Split percentage breakdownpercentage breakdown
12

EGS Monthly Report June 201513
Top Ten Hot Spot Locations
Buckhurst St was by far the highest hit during the month of June 2015 with the Carlisle Weekly Patrol coming in second. Noting there is not a large difference in the amount of graffiti removed in comparison to the 3rd – 5th highest hit areas during June 2015.
City of Port Phillip
Location Actual Sqm per month
2 Buckhurst Street – South Melbourne
385
Carlisle Street Weekly Patrol - Balaclava
140
150 -200 Dandenong Rd – St Kilda
88
129 Wellington St – commercial – St Kilda
78
12A Blessington St - council – St Kilda
63
150 - 200 Alma Road – St Kilda
57
28 Grey St - resident –St Kilda
55
Centenary Reserve Playground – Port Melbourne
37
Nightingale St – Balaclava 34
283 Inkerman St – St Kilda East
33
Top 10 Hotspots account for approximately 50% of all graffiti removed under contract for the month of June.