june 2012 the longwave economic and financial cycle ian’s
TRANSCRIPT
IAN’S INVESTMENTMENT INSIGHTSSpecial Edi t ion
T H E L O N G W A V E E C O N O M I C A N D F I N A N C I A L C Y C L E
The Gold Rush of the1930s
Will Rise Again
June 2012
I am just trying to make sense of the lack of performance in gold shares, in particular in the junior stocks, because I have invested significantly in these issues. I am sure that many of my readers are also concerned about the poor stock price performance of the companies which I have endorsed. So, let me give you my take on the reasons for this and why I still believe that they will eventually provide us with a significant reward for our patience.
One of the principal reasons that gold shares are underperforming is because the general stock market has done excep-tionally well since March 2009. The Dow Jones Industrial Average (DJIA) has risen from a low of 6,470 points to a recent level of 13,289 points, which amounts to an increase of 105% over the past three years. I have demonstrated several times that the prices of gold bullion and gold shares always work contrary to the general stock market. When stock prices are rising, the price of gold and gold shares always underperform; conversely, when the stock market is falling, over the longer term the prices of gold and gold shares rise. (This is easily recognizable in the Dow/Gold chart, which we update daily on our website.) Why is this so? The answer is really quite simple. Gold is the money of fear and when stock prices are rising, there is little or no fear in the general marketplace. Investors are enjoying increasing wealth from the rising stock prices and as a consequence don’t need to seek the security of gold and gold stocks.
The Federal Reserve is desperately keen to support rising share price values because it equates such action with positive consumer confidence, which leads to increased consumer spending, which in turn expands the economy. “Higher stock prices will boost consumer wealth and help increase confidence, which can also spur spending. Increased spending will lead to higher incomes and profits that in a virtuous circle will further support economic expansion.” Ben Bernanke, Fed-eral Reserve Chairman, November 2010. “The economic outlook is going to depend to a very significant extent on what stock prices do. Through stocks comes a wealth effect from realized capital gains.” Alan Greenspan, former Federal Reserve Chairman, August 18, 2009.
The DJIA is just 6.5% below its record high of 14,200, which was reached in October 2007. How can that be, given that things in America are significantly worse now than they were then? Unemployment is much higher now than it was in 2007. Significantly more American families are now compelled to use food stamps. Several U.S. states, cities and towns are essentially bankrupt, and the Federal debt has increased from $9.23 trillion (U.S.) in October 2007 to its current level of $15.64 trillion (U.S.), which means to all intents and purposes that the United States is also bankrupt. However, all these dismal facts can’t hold back stock prices. “What those in charge of the system really don’t have a clue about is how they keep the markets functioning when they don’t dare allow them to reflect the state of economic reality.” The Privateer.

June 2012
Indirectly, the Federal Reserve helps boost stock prices by issuing banks interest free loans. The banks can and do use these loans to buy stocks, thus boosting share prices. Directly, the Federal Reserve, through its position in the President’s Work-ing Group on Financial Markets (Plunge Protection Team) intervenes in the equity market whenever share prices come under pressure. There are several examples of this and you can Google them for yourselves.
However, as you should know by now, I am a fervent believer in the concept that all markets are governed by natural law and that is ultimately what determines the direction of stock prices. The official efforts to right the market between Octo-ber 2007 and March 2009, and there were many of them including the banning of short sales, were to no avail and the DJIA dropped from 14,700 points to 6,470 points – a 66% loss. This chart of those losses, courtesy of Elliott Wave International, shows that all the official efforts to staunch the bleeding in stock prices were hopelessly unsuccessful.
June 2012
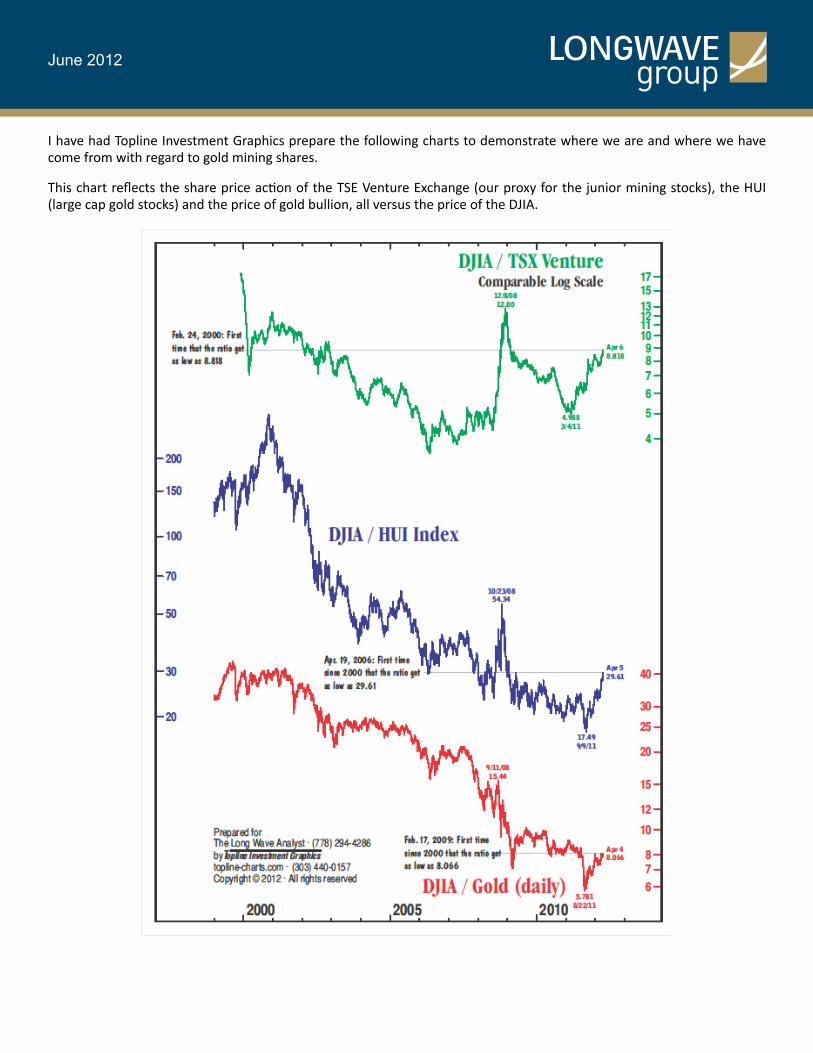
I have had Topline Investment Graphics prepare the following charts to demonstrate where we are and where we have come from with regard to gold mining shares.
This chart reflects the share price action of the TSE Venture Exchange (our proxy for the junior mining stocks), the HUI (large cap gold stocks) and the price of gold bullion, all versus the price of the DJIA.
June 2012
The higher chart levels denote when the DJIA is performing better by comparison to the three benchmarks and the lower ratio levels are when the benchmarks are performing better relative to the DJIA. The lowest low on the Venture Exchange versus the DJIA was reached in 2006 (equates to the best performance versus the DJIA). The lowest levels on the charts of the HUI and Gold versus the DJIA were both recorded in August and September of 2011. It is true that the Venture Ex-change versus the DJIA did make a low in March 2011, but that low was nowhere close to the low recorded in 2006. What this tells us is that since 2006 the junior mining stocks have been underperforming the stock market, whilst the senior mining stocks and gold itself have continued to perform better than the DJIA, at least until September and August of 2011.
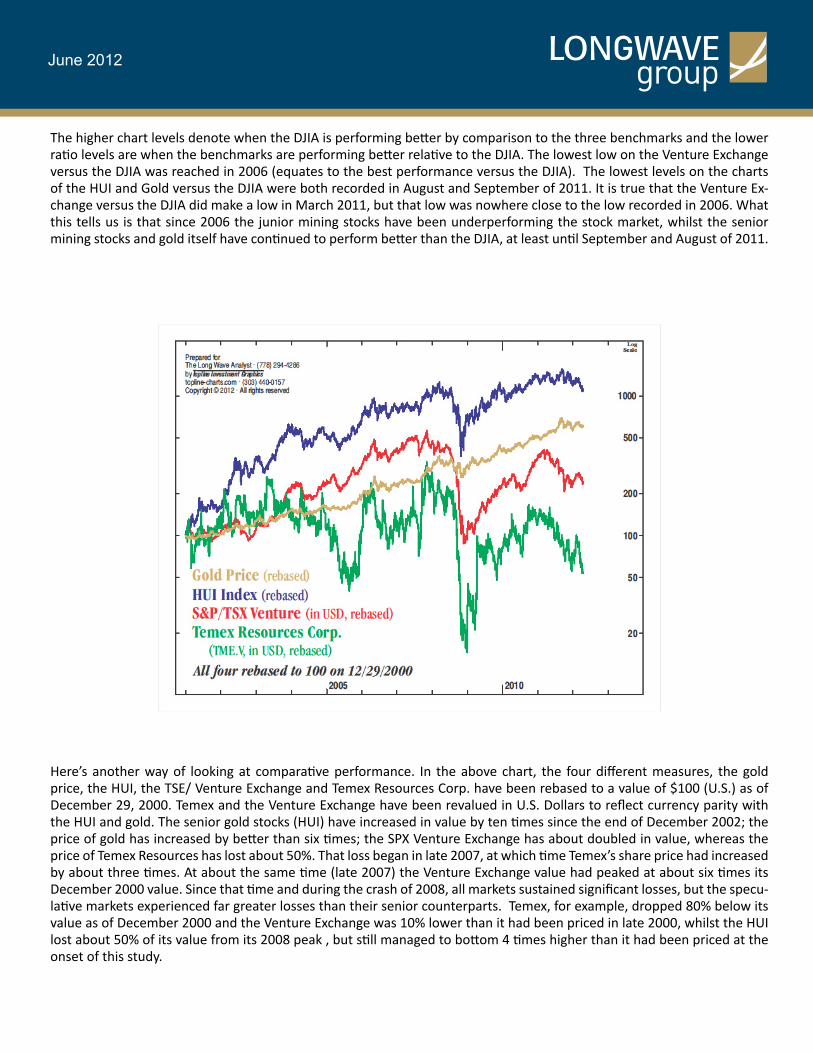
Here’s another way of looking at comparative performance. In the above chart, the four different measures, the gold price, the HUI, the TSE/ Venture Exchange and Temex Resources Corp. have been rebased to a value of $100 (U.S.) as of December 29, 2000. Temex and the Venture Exchange have been revalued in U.S. Dollars to reflect currency parity with the HUI and gold. The senior gold stocks (HUI) have increased in value by ten times since the end of December 2002; the price of gold has increased by better than six times; the SPX Venture Exchange has about doubled in value, whereas the price of Temex Resources has lost about 50%. That loss began in late 2007, at which time Temex’s share price had increased by about three times. At about the same time (late 2007) the Venture Exchange value had peaked at about six times its December 2000 value. Since that time and during the crash of 2008, all markets sustained significant losses, but the specu-lative markets experienced far greater losses than their senior counterparts. Temex, for example, dropped 80% below its value as of December 2000 and the Venture Exchange was 10% lower than it had been priced in late 2000, whilst the HUI lost about 50% of its value from its 2008 peak , but still managed to bottom 4 times higher than it had been priced at the onset of this study.
June 2012
Since those low prices, which were effectively made by the end of 2008, the prices of the four charts in our study have all rebounded, but the rebound has been most pronounced in gold and the senior gold stocks. The prices of Gold bullion and the HUI rebounded to record highs, which they achieved in September 2011, whereas the price rebounds in the Venture Exchange and Temex have been far more muted, particularly in Temex, which only recovered a little better than 50% of its losses into September 2010, and since that time the share price has fallen by 70%. Why is that?
One reason that I can give for the poor performance of these junior precious metals mining shares is that most investors, formerly in this sector, have become risk averse. This has become somewhat corroborated by a friend who has been plot-ting the buys and sells of a handful of junior companies and has reported that most of the selling of these companies’ shares is coming out of small brokerage houses, which are generally the guardians of retail investors.
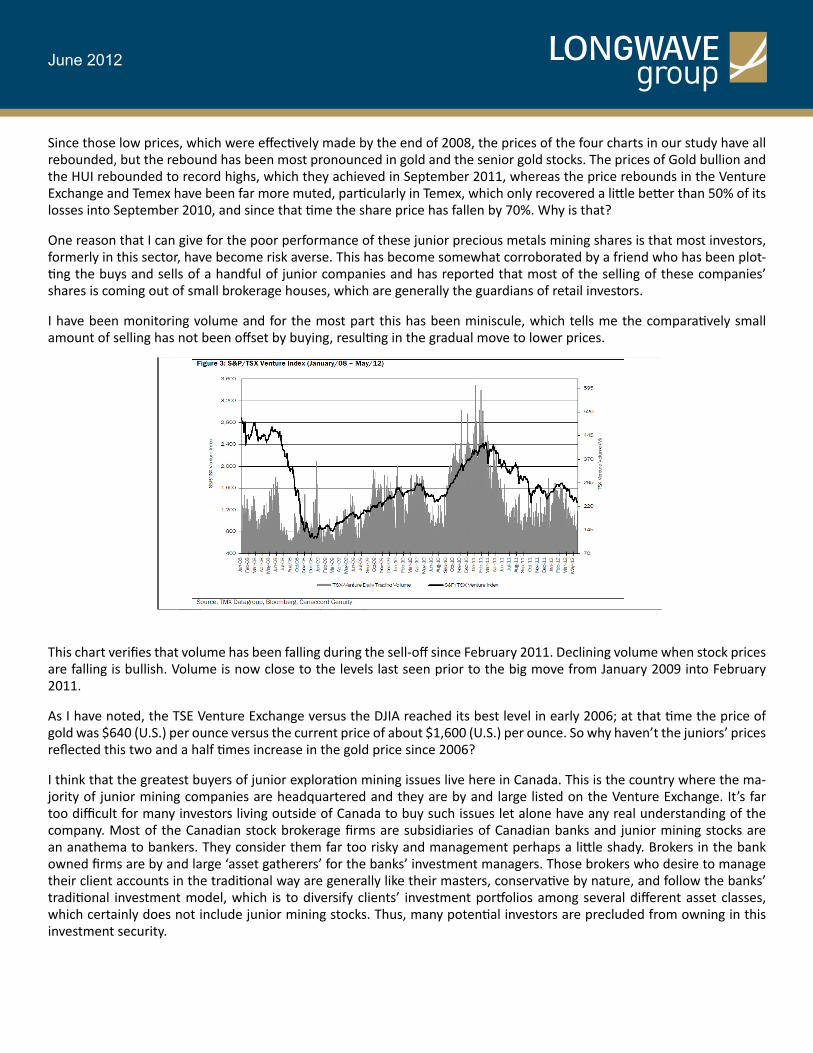
I have been monitoring volume and for the most part this has been miniscule, which tells me the comparatively small amount of selling has not been offset by buying, resulting in the gradual move to lower prices.
This chart verifies that volume has been falling during the sell-off since February 2011. Declining volume when stock prices are falling is bullish. Volume is now close to the levels last seen prior to the big move from January 2009 into February 2011.
As I have noted, the TSE Venture Exchange versus the DJIA reached its best level in early 2006; at that time the price of gold was $640 (U.S.) per ounce versus the current price of about $1,600 (U.S.) per ounce. So why haven’t the juniors’ prices reflected this two and a half times increase in the gold price since 2006?
I think that the greatest buyers of junior exploration mining issues live here in Canada. This is the country where the ma-jority of junior mining companies are headquartered and they are by and large listed on the Venture Exchange. It’s far too difficult for many investors living outside of Canada to buy such issues let alone have any real understanding of the company. Most of the Canadian stock brokerage firms are subsidiaries of Canadian banks and junior mining stocks are an anathema to bankers. They consider them far too risky and management perhaps a little shady. Brokers in the bank owned firms are by and large ‘asset gatherers’ for the banks’ investment managers. Those brokers who desire to manage their client accounts in the traditional way are generally like their masters, conservative by nature, and follow the banks’ traditional investment model, which is to diversify clients’ investment portfolios among several different asset classes, which certainly does not include junior mining stocks. Thus, many potential investors are precluded from owning in this investment security.

June 2012
I have been connected to junior precious metals mining companies since 1999. At that time, given my understanding of the Long Wave Cycle, I was convinced that a new precious metals’ bull market was about to begin and on that premise I was correct. So, I started to raise capital for those companies that I considered merited investors’ capital. At that time, it was very difficult to find investors of a like mind. Armed with my Long Wave chart I travelled to many countries visiting fund managers in an effort to demonstrate my thesis and convince them that the precious metals companies were about to shine parallel to the onset of the Long Wave Winter cycle. At that time I was one of the few voices crying in the golden wilderness. Since then I have been instrumental in raising hundreds of millions of dollars for what I have considered de-serving companies. I have met with many different mining company executives and analyzed perhaps more than a hun-dred different company projects. While I am not an accredited geologist, I have learned geology in a rudimentary way over the past 12 years or so.
I do think that I am a good judge of people and that I am able to evaluate management. I have been fortunate to have been educated at what I believe was one of the best management schools in the world, The Royal Military Academy, Sandhurst, England where leadership and man (people) management was a core part of the two-year curriculum.
It is difficult for me to fathom that when I passed out of Sandhurst, I became a twenty year old platoon commander in a Scottish regiment (The Cameronians, Scottish Rifles), which in the main recruited from the Gorbals of Glasgow. For those not in the know, the Gorbals were at that time reputed to be one of the toughest areas in the United Kingdom. Many of the wee Jocks who came from there were cognizant of murder and many of them would have grown up party to drunken pub brawls where the best offence or defense was the quick parry with a broken bottle into your opponent’s face.
Here I was, educated in a private (public) school in England, joining a bar battled Scottish regiment in Germany a month shy of my 21st birthday and in command of 31 of these tough ‘poison dwarfs’.
I remember my first day. The Battalion was drawn up on parade on the barrack square in Minden. The officers in their tar-tan trews stood off to the front and at the appointed time we moved to be greeted by our respective platoon sergeants. I was commander of 5 platoon, ‘B’ company. Sergeant Collinson moved towards me, came to attention and saluted, and said something to me in a broad Scottish accent that I could not understand. I presumed he meant that my platoon was present and ready for inspection. So, I walked slowly down the ranks of soldiers, looking at these fight-hardened faces, many with their noses flattened and several showing the broken glass scars sustained in their barroom brawls. I am sure that many of them were thinking ‘this one is going to be easy.’
Let me tell you that I grew to love these tough wee jocks and I never had a problem with any of them and I like to think that they respected me for my leadership ability, which I had learnt over my two years at Sandhurst.

June 2012
Here I am leading my platoon of jocks down the Royal Mile in Edinburgh en route to Holyrood Palace to guard Her Majesty Queen Elizabeth, who was in Edinburgh at that time.
I immigrated to Canada in 1967 and began a career in human resources. In 1983, I left human resources and began a career in the securities industry. For most of my working life I have been a manager and I have watched many managers in action. I am convinced that good management is the key to a successful enterprise.
Many junior mining companies and one might add, some large companies as well, are very poorly managed. That is be-cause many of the people operating these companies have never been taught, or if they have been taught are still inca-pable, to effectively manage people. Those few individuals who do have good skills and work effectively at the head of a team generally achieve excellent results and properly reward their shareholders. Bad managers, on the other hand, can ruin the companies that they are supposed to be leading and thereby destroy shareholders’ wealth. I have witnessed this too many times. Management of junior mining companies is closely scrutinized by investors in risk adverse periods. Inves-tors sell shares of companies operated by managers they believe are incapable of diligently and cheaply advancing the companies’ projects.
Even though I consider myself to be a very good judge of people, I have made some mistakes in that regard and it has always cost me dearly.
I want to draw your attention to another factor that is of grave concern to potential investors in the junior mining sector; this is the constant need to issue additional shares to raise capital to fund exploration, thereby, diluting the value of exist-ing shareholders. Over the past two years on the Venture Exchange there were 3,000 financings, which raised in excess of $10 billion (CAD); that’s a lot of dilution and all that money is now weighing heavily on the market.
When I first began to raise capital for this sector in 1999, the companies were starved for money to advance their projects. By 2004 or 2005 there was a surfeit of capital raisers and any number of individuals and investment funds prepared to participate in these equity financings. By 2007, the bloom in this field, was off the rose. The year 2008 was a disaster and the occurrences in that period effectively destroyed appetite for risk which has not yet been revived. Capital raising for the junior precious metals mining sector is now a very difficult task with only the most robust projects able to garner funding.
June 2012
Furthermore, there is far less available capital to finance this sector. Investment managers who have formerly funded these companies are experiencing cash withdrawals, not only because of their poor performance over the past two years or so, but also, because of the aversion to risk that is now prevalent throughout the world. These withdrawals create forced sell-ing in the junior precious metals companies shares’ as fund managers must raise cash.
The outcome of all of this will be far less dilution, simply because many companies will be unable to raise money. These companies will die. What we must do is hold shares in companies with already good gold in the ground assets, properly managed, and with sufficient cash to last at least another eighteen months, even if that means cutting back on planned exploration expenditures. Many managers in these exploration companies believe that all it will take to garner investment attention is to generate good exploration news. In the past, good exploration results have attracted large scale buying. Not anymore. As I have said, management at this time would be better off simply preserving capital.
This brings me to another possible reason regarding why the prices of junior precious metals companies are performing so poorly. That is because many investors are shunning all assets denominated in paper values. Yes, I know that the stock market has performed very well for the past three years, but the general stock market is the playground of the bankers, who have enriched themselves trading paper for paper. The public is shunning investing in stock markets, and who can blame them, given the amount of corruption and fraud that is prevalent in that sphere. The amount of money flowing into mutual funds has been steadily declining for more than a year.
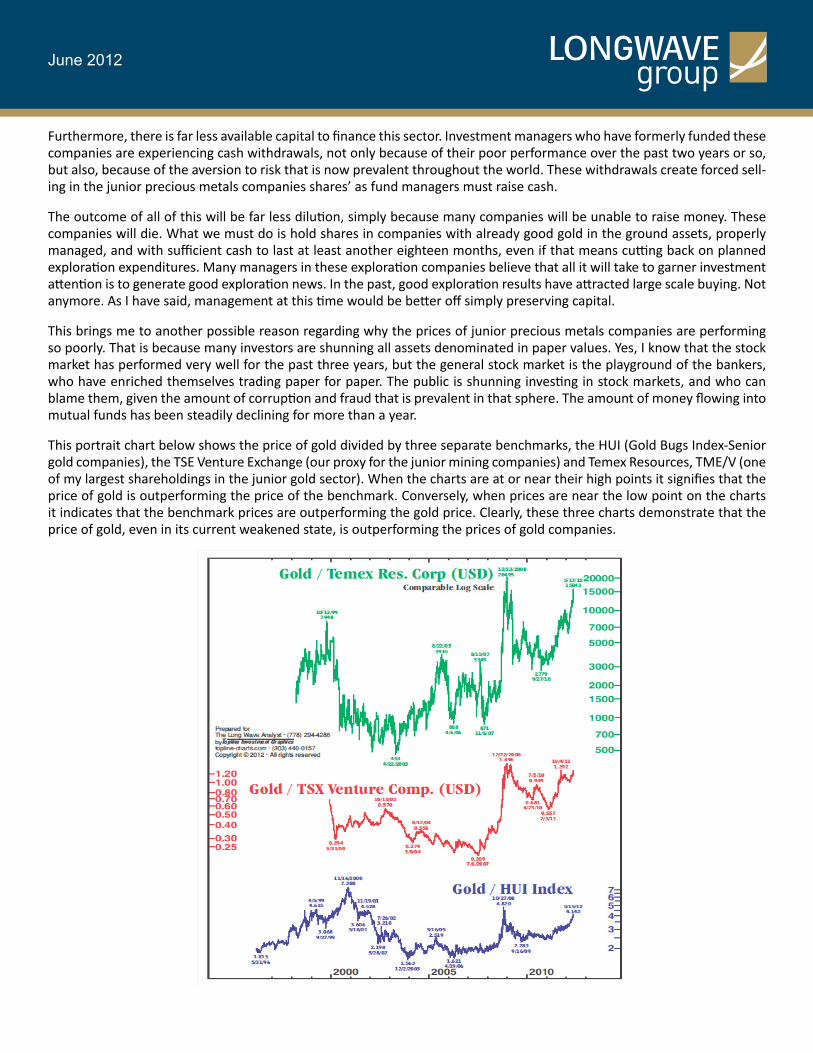
This portrait chart below shows the price of gold divided by three separate benchmarks, the HUI (Gold Bugs Index-Senior gold companies), the TSE Venture Exchange (our proxy for the junior mining companies) and Temex Resources, TME/V (one of my largest shareholdings in the junior gold sector). When the charts are at or near their high points it signifies that the price of gold is outperforming the price of the benchmark. Conversely, when prices are near the low point on the charts it indicates that the benchmark prices are outperforming the gold price. Clearly, these three charts demonstrate that the price of gold, even in its current weakened state, is outperforming the prices of gold companies.
June 2012
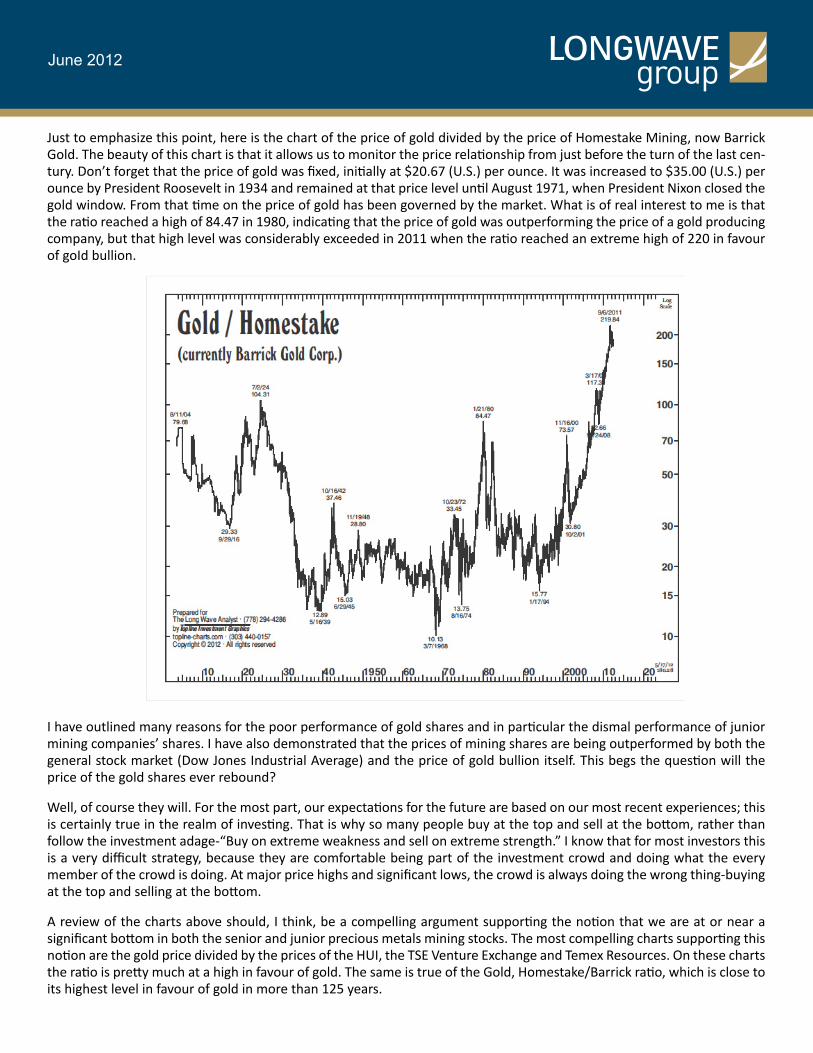
Just to emphasize this point, here is the chart of the price of gold divided by the price of Homestake Mining, now Barrick Gold. The beauty of this chart is that it allows us to monitor the price relationship from just before the turn of the last cen-tury. Don’t forget that the price of gold was fixed, initially at $20.67 (U.S.) per ounce. It was increased to $35.00 (U.S.) per ounce by President Roosevelt in 1934 and remained at that price level until August 1971, when President Nixon closed the gold window. From that time on the price of gold has been governed by the market. What is of real interest to me is that the ratio reached a high of 84.47 in 1980, indicating that the price of gold was outperforming the price of a gold producing company, but that high level was considerably exceeded in 2011 when the ratio reached an extreme high of 220 in favour of goId bullion.
I have outlined many reasons for the poor performance of gold shares and in particular the dismal performance of junior mining companies’ shares. I have also demonstrated that the prices of mining shares are being outperformed by both the general stock market (Dow Jones Industrial Average) and the price of gold bullion itself. This begs the question will the price of the gold shares ever rebound?
Well, of course they will. For the most part, our expectations for the future are based on our most recent experiences; this is certainly true in the realm of investing. That is why so many people buy at the top and sell at the bottom, rather than follow the investment adage-“Buy on extreme weakness and sell on extreme strength.” I know that for most investors this is a very difficult strategy, because they are comfortable being part of the investment crowd and doing what the every member of the crowd is doing. At major price highs and significant lows, the crowd is always doing the wrong thing-buying at the top and selling at the bottom.
A review of the charts above should, I think, be a compelling argument supporting the notion that we are at or near a significant bottom in both the senior and junior precious metals mining stocks. The most compelling charts supporting this notion are the gold price divided by the prices of the HUI, the TSE Venture Exchange and Temex Resources. On these charts the ratio is pretty much at a high in favour of gold. The same is true of the Gold, Homestake/Barrick ratio, which is close to its highest level in favour of gold in more than 125 years.
June 2012
More to the point, however, the prices of the junior precious metals stocks have been sold down to bargain basement levels. Shouldn’t we be buying these extreme price weaknesses? I think we should and I am.
You will have noticed, I am sure, that through most of this work I have emphasized gold rather than silver. This has been deliberate, because I am much more bullish on the gold price than I am on the price of silver. Gold is money. It has enjoyed this distinction for more than 5,000 years. Even to this day. It is considered the ultimate form of money. If that wasn’t so, why is gold currently priced just above $1,600 (U.S.) per ounce, when 11 years or so ago it could be purchased for $250 (U.S.) per ounce?
What we are now experiencing is the collapse of paper currencies all around the world. The desperate machinations of European politicians to mend the broken Euro are akin to the efforts to save the Kredit Anstalt bank in 1931 out of fear that its failure would lead to Austria’s bankruptcy. Those efforts failed and Austria’s demise was the beginning of the end for the world’s monetary system. The failure of the monetary system in the early 1930s and the ultimate failure of the cur-rent monetary mechanism can be attributable to just one cause – massive debt. Only this time, the debt is far greater and more pervasive than it was in 1930.
The fundamental difference between the monetary collapse during the third Long Wave Winter (1931-1933) and the cur-rent ongoing monetary failure in this the fourth Long Wave Winter is that in 1931 the world monetary system was based on gold and the current system anchored by the dollar is fiat paper. When the system started to fail in 1931, governments by and large were happy to opt off gold, because it allowed them to resort to paper money printing in an effort to buy their way out of economic depression. Today, governments are desperately trying to perpetuate the worldwide fiat currency system by printing huge amounts of paper money in an effort to stave off monetary, economic and financial collapse. These efforts, as were the official efforts in the early 1930s, are doomed to failure.
Prior to the 1929 stock market crash, smart money was already moving into gold and gold shares. Bernard Baruch, the leg-endary American financier, began buying gold and shares in Alaska Juneau Mines in 1928. The volume of buying increased after the stock market crash and intensified as the U.S. banking system began to fail. However, these purchases reached a fever pitch when the world monetary system began its collapse. The shares of Homestake Mining which traded at a low of $65 (U.S.) during the October 1929 stock crash, traded at a high of $83 (U.S.) in 1930. In 1931, which was the beginning of the monetary system’s collapse, the high price attained per Homestake share was $138 (U.S.). The company’s share price reached a high of $163 (U.S.) in 1932, but that level was more than doubled in 1933 to $373 (U.S.). These price advances occurred without any increase in the price of gold, which was pegged at $20.67 (U.S.) per ounce.
The demand for gold itself followed the same pattern as the demand for gold mining shares. It grew exponentially in line with increasing U.S. banking failures and the collapse of the world monetary system. “When the world credit crisis began in October 1929, there was first a flight from questionable securities into strong securities. The second phase saw an intense liquidation of inventories and commodities. The third phase involved the liquidation of commercial real estate, houses and farms, both through foreclosure and sacrifice sales at a fraction of prior values. The fourth stage was the flight from the banks into cash and gold (which ultimately caused the whole US banking system to collapse) and the fifth and final phase was the flight from the dollar into gold.” The Donald J. Hoppe Analysis, January 1985, P.11. This final flight into gold had nothing to do with inflation fears because the crisis was one of deflation and debt liquidation. It was simply the recognition that gold is the only financial asset that is not someone else’s liability and therefore the only financial asset that cannot be defaulted or become worthless.
During this fifth and final phase, “Foreigners cashed in not only their American stocks and bonds, but also their dollars and hauled American gold away by the boatload. Americans converted their paper dollars and bank deposits into gold coins and stashed them in mattresses, hid them in basements or attics or took them on one way trips to Bermuda or the Ba-hamas. By July of 1932, Treasury Secretary Mellon secretly informed President Hoover that the Treasury, the Fed and the banking system were being drained of gold at such an accelerating rate that a collapse of the gold standard was imminent.” Ibid, January 1986. P.9
June 2012
During the 1930’s most of the remaining capital was driven into gold mining ventures. Here in Canada during the 1930s, there was a frantic rush into gold exploration in most of the provinces and much of this exploration resulted in operational gold mines.
The area around Yellowknife in the Northwest Territories saw a staking rush at that time and the operation of the Con mine. In Red Lake, Northwestern Ontario, the home of Goldcorp’s Red Lake mine, there were six mines put into production during the 1930s, including the Cocheneur-Willans and the Madsen. The Pickle Crow mine in Pickle Lake, which is east of Red Lake, also entered production at that time. This mine is now in the hands of PC Gold, (PKL/T), which you will know is one of my favourite junior mining companies. Temex’s Juby project in the Shining Tree area of Northern Ontario was dis-covered in the 1930s, as were two of the past-producing mines on its 60% owned (Gold Corp 40%) Whitney property, the Hallnor mine and the Broulan mine. The Hallnor mine was the highest grade producing mine in the Timmins camp.
There were several other mines placed into production in Ontario during that decade. The story is the same in Quebec, where the value of gold production was $2.93 million (CAD) in 1930, $16.6 million (CAD) in 1935 and $39.2 million (CAD) in 1940.
Other Canadian provinces, like British Columbia and Manitoba, also experienced a gold mining boom in the 1930s.
Source-Free Gold, The Story of Canadian Mining by Arnold Hoffman. This is a great read about Canadian, principally gold, mining in the 1920s and 1930s, by a Mining Engineer with a degree from Harvard, who became a prospector in Canada, principally in Ontario and Quebec during that period.
In the United States, it was no different. According to the U.S. Bureau of Mines there were 9,000 gold mines operating in the country in 1940.
The point that I am making here is that capital flowed almost exclusively into the gold exploration and mining start-up companies during this time. Why should we expect that it will be any different this time, particularly since the world debt and monetary problems are much bigger now than they were at the onset of the 1930s?
Clearly the emphasis was on gold rather than silver during the turbulent 1930s.
For its part, silver was treated more as an industrial metal than a monetary metal. At the onset of the deflationary depres-sion, the price for silver dropped from $1.00 (U.S.) per ounce to $0.25 (U.S.) an ounce by 1932, giving silver about an 80 to 1 ratio to gold. After the dollar was devalued by increasing the price of gold from $20.67 (U.S.) an ounce to $35 (U.S.) per ounce in early 1934 the ratio approached 100 to 1 at times.
On June 19, 1934, at the instigation of several U.S. western state senators who wanted to get their silver mines back into production in order to reduce unemployment, President Roosevelt approved the Silver Purchase Act. This Act effectively nationalized all U.S. silver production which was purchased on behalf of the Treasury at $0.50 (U.S.) per ounce.
Later, on August 9, 1934, President Roosevelt issued a proclamation requiring the surrender of all silver bullion located within the United States. Under this proclamation the 113 million ounces of silver were seized at a cost to the government of 50 cents (U.S.) per ounce.
Had it not been for silver’s nationalization, the gold/silver ratio might well have remained at the 100 to 1 level attained in early 1934. The ratio might indeed have risen above that level had the demand for silver continued to wane as the depres-sion continued.
June 2012
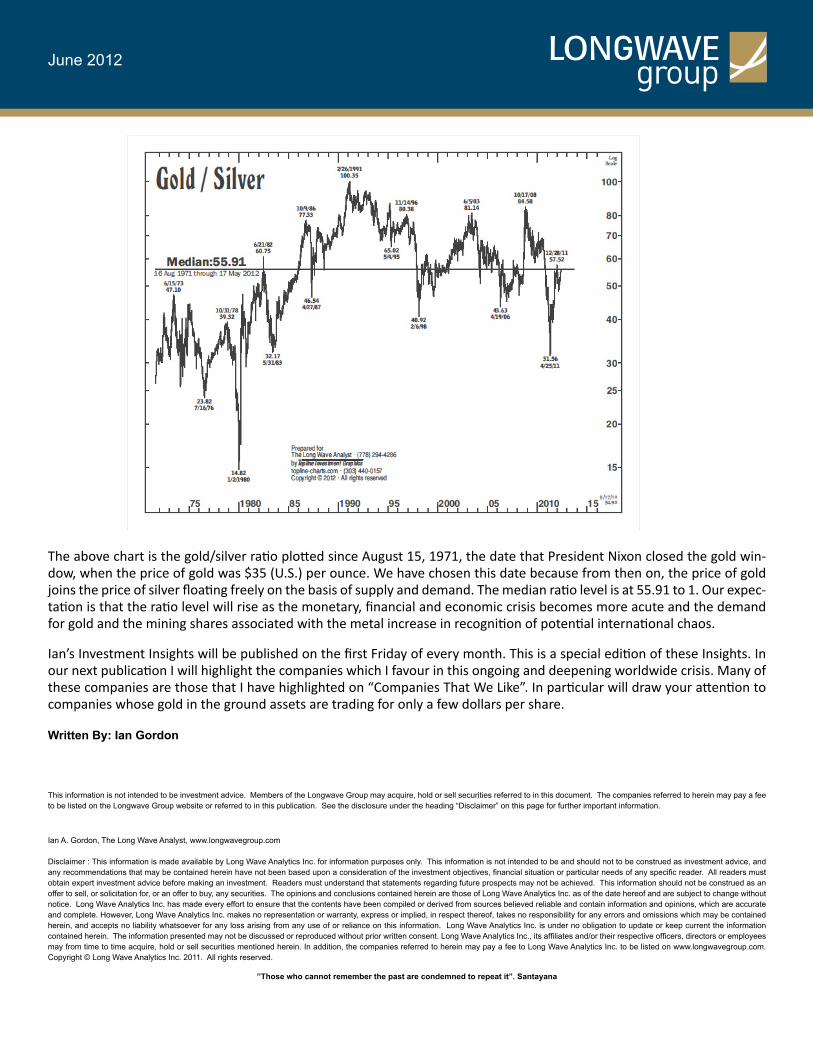
The above chart is the gold/silver ratio plotted since August 15, 1971, the date that President Nixon closed the gold win-dow, when the price of gold was $35 (U.S.) per ounce. We have chosen this date because from then on, the price of gold joins the price of silver floating freely on the basis of supply and demand. The median ratio level is at 55.91 to 1. Our expec-tation is that the ratio level will rise as the monetary, financial and economic crisis becomes more acute and the demand for gold and the mining shares associated with the metal increase in recognition of potential international chaos.
Ian’s Investment Insights will be published on the first Friday of every month. This is a special edition of these Insights. In our next publication I will highlight the companies which I favour in this ongoing and deepening worldwide crisis. Many of these companies are those that I have highlighted on “Companies That We Like”. In particular will draw your attention to companies whose gold in the ground assets are trading for only a few dollars per share.
Written By: Ian Gordon
This information is not intended to be investment advice. Members of the Longwave Group may acquire, hold or sell securities referred to in this document. The companies referred to herein may pay a fee to be listed on the Longwave Group website or referred to in this publication. See the disclosure under the heading “Disclaimer” on this page for further important information.
Ian A. Gordon, The Long Wave Analyst, www.longwavegroup.com
Disclaimer : This information is made available by Long Wave Analytics Inc. for information purposes only. This information is not intended to be and should not to be construed as investment advice, and any recommendations that may be contained herein have not been based upon a consideration of the investment objectives, financial situation or particular needs of any specific reader. All readers must obtain expert investment advice before making an investment. Readers must understand that statements regarding future prospects may not be achieved. This information should not be construed as an offer to sell, or solicitation for, or an offer to buy, any securities. The opinions and conclusions contained herein are those of Long Wave Analytics Inc. as of the date hereof and are subject to change without notice. Long Wave Analytics Inc. has made every effort to ensure that the contents have been compiled or derived from sources believed reliable and contain information and opinions, which are accurate and complete. However, Long Wave Analytics Inc. makes no representation or warranty, express or implied, in respect thereof, takes no responsibility for any errors and omissions which may be contained herein, and accepts no liability whatsoever for any loss arising from any use of or reliance on this information. Long Wave Analytics Inc. is under no obligation to update or keep current the information contained herein. The information presented may not be discussed or reproduced without prior written consent. Long Wave Analytics Inc., its affiliates and/or their respective officers, directors or employees may from time to time acquire, hold or sell securities mentioned herein. In addition, the companies referred to herein may pay a fee to Long Wave Analytics Inc. to be listed on www.longwavegroup.com. Copyright © Long Wave Analytics Inc. 2011. All rights reserved.
”Those who cannot remember the past are condemned to repeat it”. Santayana