june 2000 benthic survey of boston harbor navigational ... · list of figures figure 1 – location...
TRANSCRIPT

June 2000 Benthic Survey of
Boston Harbor Navigational Improvement
Project Confined Aquatic Disposal (CAD) Cells
Prepared by
ENSR Marine & Coastal Center
Woods Hole, Massachusetts
for
Massachusetts Coastal Zone Management
251 Causeway St. Suite 900
Boston, MA 02114-2119
September 2001

INTRODUCTION ...................................................................................................................................... 4
METHODS.................................................................................................................................................. 5
FIELD OPERATIONS ................................................................................................................................... 5 Sampling Design and Location of Stations............................................................................................ 5 Grab Sampling....................................................................................................................................... 5 Sediment Profile Imaging ...................................................................................................................... 5 Sediment Grain-Size Analysis................................................................................................................ 6
SAMPLE DOCUMENTATION, CUSTODY, AND QUALITY ASSURANCE/QUALITY CONTROL ....................... 6 LABORATORY METHODS: SAMPLE PROCESSING AND ANALYSIS............................................................. 6
Benthic Infauna ..................................................................................................................................... 6 Sediment Profile Image (SPI) Analysis ................................................................................................. 7
DATA MANAGEMENT AND ANALYSIS....................................................................................................... 8 Benthic Infauna ..................................................................................................................................... 8 Sediment Profile Image Analysis........................................................................................................... 8
RESULTS .................................................................................................................................................... 9
Sediment Grain Size .............................................................................................................................. 9 Benthos .................................................................................................................................................. 9 Taxonomic Composition........................................................................................................................ 9 Distribution and Density of Dominant Species ..................................................................................... 9 Species Richness and Diversity ........................................................................................................... 12 Sediment Profile Camera Imaging ...................................................................................................... 13 Distribution of Sediment Types ........................................................................................................... 13 Mean Apparent RPD Depths ............................................................................................................... 14 Benthic Processes................................................................................................................................ 14 Successional Status.............................................................................................................................. 15 Organism-Sediment Indices................................................................................................................. 15
DISCUSSION............................................................................................................................................ 16
REFERENCES CITED............................................................................................................................ 17
Appendix A. Station Co-ordinates for Analyzed Biology and Sediment Profile Image Photography Stations Appendix B. List of Species Identified from the June 2000 Samples Taken from Four CAD Cells
and Reference Stations for the BHNIP Appendix C. SPI Image Analysis Appendix D. Selected Images from Sediment Profile Camera Survey

List of Figures Figure 1 – Location of Dredging for the Boston Harbor Navigation Improvement Project Figure 2 – Mystic River/Inner Confluence Disposal Cells Figure 3a – Sampling Locations Cell IC2 Figure 3b – Sampling Locations Cells M2 and M4 Figure 3c – Sampling Locations Cell M8 Figure 4 – Diagram of the Benthos Model 3731 Sediment Profile Camera in Operational Mode Figure 5 – Grain Size Distribution at Biology CAD Cell Stations Figure 6a – Sediment Type Cell M2 Figure 6b – Sediment Type Cell M4 Figure 6c – Sediment Type Cell IC2 Figure 6d – Sediment Type Cell M8 Figure 7a – Sediment Description Cell M2 Figure 7b – Sediment Description Cell M4 Figure 7c – Sediment Description Cell IC2 Figure 7d – Sediment Description Cell M8 Figure 8a – Successional Stage Cell M2 Figure 8b – Successional Stage Cell M4 Figure 8c – Successional Stage Cell IC2 Figure 8d – Successional Stage Cell M8 Figure 9a – OSI Values Cell M2 Figure 9a – OSI Values Cell M4 Figure 9a – OSI Values Cell IC2 Figure 9a – OSI Values Cell M8
List of Tables Table 1 -- Grain Size analysis of sediments from stations sampled in June 2000 from four CAD
Cells and reference stations taken from benthic faunal grabs Table 2 -- Species identified from BHNIP CAD cell stations, their distribution and relative
occurrence Table 3 -- Community parameters from stations sampled within the BHNIP CAD cells

INTRODUCTION The US Army Corps of Engineers (Corps) and the Massachusetts Port Authority (Massport) received, in 1997, the local, state, and federal permits necessary to undertake long-awaited maintenance and improvement dredging of Boston Harbor (the Boston Harbor Navigation Improvement Project or BHNIP). The project involved dredging of both channel and berth areas. Of the total 3.7 million cubic yards of material to be removed, approximately 1.3 million were unsuitable for unconfined ocean disposal. The selected disposal alternative for the unsuitable material was placement in confined aquatic disposal (CAD) cells within the Harbor as described in the Final Environmental Impact Report/Statement (June, 1995). CAD cells were to be excavated beneath existing navigation channels dredged as part of the project and capped with sand following disposal of unsuitable material into the cell. The overall BHNIP included construction of nine CAD cells within Boston Harbor’s upper tributaries (Figure 1). A limited first phase of the BHNIP was completed in the summer of 1997 and included construction, filling, and capping of a single CAD cell. The main project or second phase began in the summer of 1998 and was essentially complete by early 2000. An additional eight CAD cells were constructed during this second phase. The cells were constructed, filled, and capped over three separate intervals within the second phase of the project. The sequencing of capping of eight of the CAD cells is presented in Figure 2. The ninth cell, located in the Chelsea River, was only partially filled and remains open for use in future projects. As part of the roll of Independent Observer for the BHNIP reporting to Massachusetts Coastal Zone Management, ENSR performed a benthic survey of selected CAD cells in June 2000 in an effort to assess re-colonization over the cells. The survey included assessment of benthic faunal composition and performance of sediment profile imaging at stations located in cells IC2, M2, M4, and M8 as well as at nearby reference areas. The following information summarizes the history of the CAD cells investigated in this survey: IC2 - CAD cell IC2 was constructed the week of 29 June 1997. Following the completion of the cell, the unsuitable dredge material was placed in the cell from 28 June to 4 July, 1997. One week later 14 July 1997- 25 July 1997 capping operations took place to cover the contaminated sediment with a sand cap. Follow up monitoring revealed that approximately 75% of the cell received an estimated 3+ foot layer of cap material, some of which was mixed with the underlying silt material within the cell, and that 25% of the cell received little or no cap material. M4 - Construction of CAD cell M4 took place from 10 September 1998 to 22 September 1998. Disposal of contaminated material took place from 23 September 1998 to 10 October 1998. Capping took place from 12 November to 17 November 1998. Follow up monitoring revealed that the sand cap had mixed with the cell contents over much of the cell, resulting in an estimated 6+ foot layer of sand/silt mixture. M2 - Construction of CAD cell M2 was initiated in October of 1998. Disposal took place from October 1998 to May 1999, and capping took place in October 1999. Follow up monitoring revealed a relatively uniform layer of 2+ foot thick sand cap over much of the cell. M8 - Construction of CAD cell M8 took place in March 1999. Disposal into the cell took place from March 1999 through January 2000. Cell M8 had not yet been capped at the time of this survey.

METHODS
Field Operations
Sampling Design and Location of Stations Sediment samples were collected along two transects across the length and width of four CAD cells shown in Figure 1a-1c. Reference stations for biological sampling and sediment profile image photography were selected outside the navigational channel adjacent to IC2, M2, and M4. Additionally, a sediment profile image photographic reference station was selected adjacent to M8, also outside the navigational channel. Station co-ordinates are provided in Appendix A. Eight stations were established and numbered within each CAD cell in a cross-pattern formation (Figure 3a-3c) for sediment profile image analyses. Stations within each CAD cell were located approximately 35 meters apart. A centerline across the length and width of each station was determined using a Trimble Global Positioning System (GPS) and ArcView GIS. Four stations were located along each edge and four stations were located in the middle of the individual CAD cells (Figure 3a-3c). At least three replicate sediment profile images were taken at each of the eight stations within the CAD cells. The sediment profile image photography reference stations for CAD cells M2, M4 and M8 each had three stations outside the navigational channel, CAD cell IC2 had 4 reference stations outside the navigational channel. These reference stations were located at least 50 meters away from their respective CAD cells. One replicate from each station was analyzed for the four CAD cells and their respective reference stations. This resulted in a total of 46 images analyzed for this report. Each image was scored for recent redox potential discontinuity (RPD), historical RPD’s, grain size (minimum, maximum and mode), and camera penetration depth (minimum, maximum and mean). The presence or absence of burrows, infauna, successional stage, anoxia, clay clasts, methane bubbles and boundary roughness were also recorded. Replicate benthic biology samples were taken at two separate stations within each CAD cell (stations 2 and 5, Figure 3a-3c) and a biology reference station was established approximately 50 meters away from CAD cell M4 and 80 meters away from CAD cell IC2. Dr. Pamela Arnofsky, Mr. Don Boyé Jr., and Ms. Lori Burdick directed the field survey. CR Environmental, a small business that specializes in field support services, provided the survey vessel, the R/V Cyprinodon and crew. The firm of Diaz and Daughters provided the SPI camera system and a scientist, Mr. Randy Cutter, to direct the SPI field effort.
Grab Sampling A 0.04-m² Ted Young grab was used to collect biology (benthic infaunal) samples. At each station, two grabs for benthic infauna were taken. Following collection, the benthic infaunal samples were checked for depth of the apparent RPD layer, sediment color and texture, and penetration depth of the grab, resulting in a rough estimate of the sample volume. The samples were then emptied into a bucket, sieved through 500-micron mesh screens, and fixed in 10% buffered formalin.
Sediment Profile Imaging At each of the SPI stations, the sediment profiling camera was deployed to the seafloor (Figure 4). The camera stayed on the bottom for 20 sec (measured with a stop watch on board ship starting at the point at which the wire went slack). Two photographs were taken with each deployment: the first one was taken 5 sec after the frame settled on the bottom and the second one, 15 sec later. This protocol assures that at least one useable photograph is produced during each lowering. If the bottom is very soft, the prism will over penetrate after 15 sec (no sediment-water interface on the photograph), but the first exposure, taken after 5 sec, usually shows the interface and will be suitable for a

full analysis. If the sediment is compacted or mixed with rocks, the second exposure will be used for analysis. At least three replicate sets (six exposures) were taken at each of the 35 stations. At the end of each station, the camera was hauled back on deck for transport to the next station. Sections of the film were cut and developed at the end of the day to ensure that the camera system was working correctly. The remaining film was developed by the MicroGraphics Laboratory, Woods Hole Oceanographic Institution. Mounted slides were later sent to a Kodak Laboratory for digitizing and archival on a CD-ROM. These digitized images were then analyzed in the laboratory.
Sediment Grain-Size Analysis Grain size was determined by a combination of wet and dry sieve and pipette analysis. The sediment was processed through a sieve series based on the Wentworth grade scale, including mesh sizes of 2 mm (-1 phi), 1 mm (0 phi), 0.5 mm (1 phi), 0.25 mm (2 phi), 0.125 mm (3 phi), and 0.063 mm (4 phi). The sediment fraction retained on each sieve was weighed and reported as percent gravel (grain size >2 mm) and percent sand (grain size 2 mm to 0.063 mm). Sediment passing through the 0.063-mm sieve was further analyzed by pipette analysis to obtain percent silt (grain size 0.063 mm to 0.004 mm) and percent clay (grain size <0.004 mm). For the sand fraction, the weight percent for each phi size was also determined.
Sample Documentation, Custody, and Quality Assurance/Quality Control Standard ENSR procedures for sample tracking and custody were followed. Prior to the survey, preprinted labels were produced. All sample containers were labeled on the outside, and the infauna containers were also labeled on the inside. Information on the labels included the survey number, date and time of sampling, station and replicate, sample type, and the laboratory to which the samples were to be delivered for analysis. All pertinent information on field activities and sampling efforts was recorded into a bound, numbered logbook. Entries were recorded in indelible ink and included, at a minimum,
• Date and time of starting work • Names of ship’s crew and scientific party • Sampling sites and activities and references to ship’s navigation system • Deviations from survey plan, if any • Field observations such as weather and sea state
Chain-of-custody forms were created by hand before the samples left the survey vessel or the custody of the scientist responsible for shipping. All coolers and boxes used for shipping were sealed with numbered chain-of-custody tape; the number on the tape was recorded on the chain-of-custody form. For additional information, ENSR has prepared a Quality Assurance Project Plan (QAPP) for Benthic Monitoring (Blake and Hilbig, 1995).
Laboratory Methods: Sample Processing and Analysis
Benthic Infauna In the laboratory, each benthic sample was resieved with fresh water through a 500-micron mesh screen and transferred to 70% alcohol for preservation. Before sorting, the samples were stained with a saturated alcoholic solution of Rose Bengal, a stain for proteins that enhances the visibility of organisms in the sediment. All animals, including anterior fragments, were removed from the sediment and sorted into major taxa, such as polychaetes, oligochaetes, mollusks, crustaceans, and echinoderms. Taxonomists then

identified each taxon to the lowest practical level (usually to species) and enumerated each taxon. Sorting and identification of the benthic infauna was performed by ENSR taxonomists. A detailed description of the procedure can be found in the QAPP for Benthic Monitoring (Blake and Hilbig, 1995). Replicate 1 from each station was analyzed; the second replicate from each station was archived at ENSR after transfer to ethanol.
Sediment Profile Image (SPI) Analysis One out of three replicate images from each station were analyzed with ImagePro Plus software in the ENSR Marine & Coastal Center's image analysis laboratory in Woods Hole. Each digitized image was analyzed for penetration depth, surface roughness, apparent redox potential discontinuity (RPD), grain size major mode, successional stage of the infauna, the presence of methane bubbles, and biogenic features such as burrows and tubes. Any additional observations were entered into a comment field. The data were compiled on separate data sheets for each image and the organism-sediment index (OSI) was calculated (Rhoads and Germano, 1982). The following is a description of each of the SPI parameters that were measured: 1. Penetration depth is measured from the bottom of the image to the sediment-water interface
(maximally 20 cm) and is a measure for softness of the substratum, which depends on characteristics such as water content and grain size.
2. Surface roughness is the difference between the least and greatest penetration depth across the
sediment-water interface depicted on a slide (the width is 15 cm). It may be a measure for physical disturbance—natural or anthropogenic—or biological activity such as burrowing.
3. The apparent RPD depth is measured from the sediment-water interface to the depth in the sediment
at which there is a change in sediment color caused by the lack or absence of oxygen at depth; the color commonly changes from tan or brownish (ferric hydroxides) in the well-oxygenated surface layer to greyish (ferric hydroxides being reduced) or black (presence of sulfide, anoxic conditions) at a few mm to several cm depth. The RPD depth depends on a variety of physical and biological factors, such as currents, organic loading, and bioturbation by infaunal organisms, and is commonly used as a first-approximation measure for the health of a habitat.
4. Methane bubbles, discernable by their strong reflectance (silvery color), form only under severely
oxygen-depleted sediment conditions as a result of anaerobic bacterial metabolism. 5. The grain size major mode is the dominant particle size in an image, measured visually by comparing
the slide with a photograph of phi size classes. 6. The infaunal successional stages are derived from a paradigm describing recolonization of disturbed
habitats. Stage I organisms are those that live very close to the sediment-water interface, and they are pioneers because they do not require much oxidized sediment. By their feeding and burrowing activities these stage I organisms, often small annelids, deepen the RPD, preparing the sediment for somewhat larger animals to colonize, such as certain amphipods (stage II). Stage III organisms are large, deep-burrowing, head-down deposit feeders, such as large polychaetes and echinoderms, that aerate the sediment to several cm depth. Their presence indicates an equilibrium community and healthy environment.

Data Management and Analysis
Benthic Infauna Data from infaunal identifications were either entered directly into a Microsoft Excel spreadsheet or documented manually on data sheets and then entered into a spreadsheet. Juvenile and indeterminable organisms were included in calculations of density. Data analysis included species richness as well as an assessment of faunal assemblages. Diversity was calculated as the Shannon-Wiener index (H') and Pileou’s evenness (J'). The Shannon-Wiener index was calculated using the base loge.
Sediment Profile Image Analysis A spreadsheet of the raw data was generated and several parameters mapped and contoured. Major modal grain size designations plotted for each station represent the dominant modal sediment type among the station replicates. The mean apparent RPD depth (rounded up to the first two decimal places) is plotted along with presence/absence of microbial mats, methane gas, dewatering pipes, and oxic/anoxic surfaces. Total number of relic and recent RPDs are also plotted. The successional status of each station is plotted as the dominant sere as inferred from the replicates. The OSI values that are plotted are the stations means rounded up to a whole number.

RESULTS
Sediment Grain Size Grain-size composition of sediments collected in June 2000 from the biology grabs collected at two stations in each of the CAD cells and at the references sites, as determined by sieving and gravimetric analysis, is given in Table 1. Inspection of the data shows that the majority of stations are characterized by fine-grained sediments typically found in anthropogenically affected areas of Boston Inner Harbor. Sediment grain size distribution associated with each biology station is plotted for each station in Figure 3. One station in CAD cell M8 (M8-B-1B) and one in CAD cell M4 (M4-2-1A) had >40% but <50%of very fine sand. The remaining stations were predominantly comprised of fine-grained sediments with varying percentages of silt and clay. Station M2-B-1a had highest percentage of clay (47%) and station M8-B-2A rep. 3 had highest percentage of silt (67.3%). The remaining stations had silt+clay values ranging from 69.1% to 95.1% (Table 1).
Benthos The benthic samples taken from the four CAD cells and the reference sites for the BHNIP project in June 2000 yielded no particularly rare or unusual organisms. Some samples contained plant material (e.g., M2, M4 and M8). Capitella capitata was the only species found at each of the CAD cells and at the reference stations. Polydora cornuta was found at every station in the four CAD cells except M2-B-1A and Streblospio benedicti was found at all stations in the four CAD cells except M2-B-1A and M2-B-2A. IC2 had the greatest abundance of Capitella capitata.
Taxonomic Composition A total of 22 taxa were identified from the benthic samples (Appendix B-1 and B-2). Polychaete annelids accounted for 11 taxa (50%) and all were identified to species. Two species of gastropods were identified from shells only, no live gastropods were found in any of the biology samples. Four species of bivalve molluscs were recorded all identified to species. Crustaceans were represented by one species of amphipod and one species of decapod. The remaining taxa included one species of hydroid and two species of oligochaete annelids.
Distribution and Density of Dominant Species Appendix B-2 includes the counts of each taxon recorded at each of the 10 stations sampled. Table 2 provides a list of the taxa recorded, along with the percentage contributed by each major taxonomic group and the number of stations at which each occurred.

Table 1. Grain-size analysis of sediments from stations sampled in June 2000 from four CAD cells and reference stations taken from benthic faunal
grabs.
Sample % % % % % P H I P E R C E N T Mean Std Gravel
Sand Silt Clay Silt + Clay
<-1 0 1 2 3 4 Dev
M2-B-1A
0 15.4 37.2 47.4 84.6 0 0.08 0.34 1.35 2.37 11.24 6.97 2.17M4-5B 0 15.2 58.2 26.6 84.8 0 2.35 0.65 1.29 4.69 6.22 6.23 2.18IC2BRA 0 16.2 48.6 35.2 83.8 0 0.28 1.75 3.55 3.33 7.33 6.48 2.27IC-B4-1A 0 16.2 57 26.9 83.9 0 0.12 0.35 1.67 3.23 10.8 6.32 1.97M8-B-1B 0 40.1 38.6 21.3 59.9 0 1.41 1.5 19.22
10.69
7.31 5.04 2.78
IC2-B-2A 0 23.9 45.5 30.6 76.1 0 0.06 0.88 3.64 6.9 12.42 6.15 2.32M2-4-REF 0 21 55.8 23.2 79 0 0.1 0.45 7.03 6.83 6.63 5.94 2.22M4-2-1A 0.2 46.9 30.3 22.6 52.9 0.16 0.56 10.19 22.89 8.88 4.42 4.62 3.09M2-B-2A 3.8 27.1 32.5 36.6 69.1 3.78 2.95 5.14 7.71 5.9 5.37 5.65 3.27M8-B-2A(A) 0 5.4 63 31.6 94.6 0 0 0.07 0.49 1.19 3.65 6.79 1.65M8-B-2A(B) 0 4.9 62.9 32.2 95.1 0 0 0.07 0.4 1.21 3.24 6.82 1.64M8-B-2A(C) 0 6.5 67.3 26.3 93.6 0 0.07 0.14 0.63 1.39 4.24 6.59 1.63

The numerically dominant species were not evenly distributed among the 10 stations. Polychaetes contributed the majority of species and the majority of individuals. However, Capitella capitata was only numerically dominant in CAD cells IC2-B-1A, M2-B-2A, M4-5A, and M8-B-2A. Polydora cornuta was numerically dominant at the reference station (IC2-B-RA), M4-2A, and M8-B-1A 4. The remaining stations had equivalent numbers of Capitella capitata and Polydora cornuta except station IC2-B-2A. This station was numerically dominated by Tubificoides apectinatus, an oligochaete worm and M2-B-1A had only 4 animals identified from the entire sample. These four animals were comprised of three tiny Mytilus edulis and one Capitella capitata. Reasons for such low numbers of individuals and species at M2-B-1A could be related to a recent slumping event from the CAD cell walls that would smother previously existing, living animals or anthropogenic disturbance. Capitella capitata, Polydora cornuta, and Tubificoides apectinatus are Stage I species that opportunistically enter open niche space (Rhoads and Germano, 1982). Mollusks, gastropods, and crusteacans were not numerically abundant at any of the 10 benthic faunal stations.
Table 2. Species identified from BHNIP CAD cell stations, their distribution and relative occurrence.
Taxon
No. of Individuals
Percent Total
No. of Stations
Percent of Stations
Cumulative percent by major
taxonomic groupCapitella capitata complex 165 29.6 10 100 33.13 Polydora cornuta 149 26.8 9 90 29.92 Tubificoides apectinatus 74 13.3 8 80 66.07 Streblospio benedicti 42 7.5 8 80 8.43 Tubificoides sp. 2 38 6.8 7 70 33.93 Tharyx acutus 30 5.4 5 50 6.02 Micropthalmus sczelkowii 14 2.5 2 20 2.81 Mytilus edulis 13 2.3 5 50 72.22 Mediomastus ambiseta 8 1.4 2 20 1.60 Spio thulini 6 1.1 3 30 1.20 Nephtys incisa 5 0.9 3 30 1.00 Trochochaeta multisetosa 3 0.5 3 30 0.60 Tellina agilis 3 0.5 3 30 16.67 Ampelisca abdita 2 0.4 1 10 66.67 Yoldia limatula 1 0.2 1 10 5.56 Nereis grayi 1 0.2 1 10 0.20 Mya arenaria 1 0.2 1 10 5.56 Glycera americana 1 0.2 1 10 0.20 Crangon septemspinosa 1 0.2 1 10 33.33 Lacuna vincta N/A N/A N/A N/A N/A Ilyanassa trivittata N/A N/A N/A N/A N/A Campanularia gigantea N/A N/A N/A N/A N/A
N/A= Not Applicable
Species Richness and Diversity Community parameters for each station are given in Table 3. Species diversity, as measured by the Shannon index H′, ranged from a low of 0.22 at Station M2-B-1A to a high of 1.92 at Station IC2-B-2A. Species richness (total number of taxa) and diversity were highest at CAD Cell IC2 and M8. Cell IC2 was the first to be constructed, filled and capped and therefore has had the greatest amount of settling time in the history of the BHNIP. CAD cell M8 has been constructed and filled with dredged sediment, but no coarse sand cap has been placed at the time of this study. All the cells are subject to natural filling from ambient sediment existing along the edges of the dredged cell. In addition, because the cells are depressed below the surrounding harbor bottom, the edges can potentially slump in over the cell contents and act as an ambient cap. As evidenced by the sediment profile imagery, diversity and species richness results, the natural benthic fauna are re-establishing themselves at the surface of the cells.

CAD cell M2 was reported to have the most evenly distributed sand cap but also had the lowest diversity and species richness of all 4 CAD cells investigated. This could result from recent depositional events that take place as the cell walls slump into the cell thus creating temporary anoxic environments. Cell M4 that was reported to have the most uneven distribution of sand cap material, and the reference station IC2-B-RA, both have diversity and species richness similar to that of IC2 and M8. The sediment profile image photography results of all stations within these 4 CAD cells show clear evidence of multiple resuspension events and potential slumping from the cell wall edges. This, in turn, supports the hypothesis that low diversity at cell M2 can be related to the recent slumping events and temporary anoxic environment created by this circumstance. It is also important to note that diversity is not exceptionally high at any of the BHNIP stations, but it is comparable to other areas with equal levels of disturbance and contamination such as western Long Island Sound and Inner Boston Harbor (ENSR, 2000; Blake et al., 1998).
Table 3. Community parameters from stations sampled within the BHNIP CAD cells.
Station Number of Individuals
Number of Taxa
H' J'
IC2-B-1A 96 10 1.58 0.68 IC2-B-2A 144 12 1.92 0.77 IC2-B-RA 100 9 1.14 0.52 M2-4 26 6 1.38 0.77 M2-B-1A 4 2 0.22 0.31 M2-B-2A 28 6 0.76 0.42 M4-2A 63 8 1.50 0.77 M4-5A 35 8 1.77 0.91 M8-B-1A 16 10 1.84 0.88 M8-B-2A 45 7 1.43 0.74
Total
557
22
Sediment Profile Camera Imaging Appendix C includes detailed information from the analysis of the images taken with the SPI camera. The plates referred to in the following section are presented in Appendix D.
Distribution of Sediment Types Figure 6a-6d show the distribution of major modal grain size and number of relic and recent RPD layers at each station as inferred from image analysis of the SPI data. Most stations (> 70%) consist of predominantly silt-clay mud with varying proportions of very fine sand and coarse sand cap material. Coarse sand is labeled CS, silt is labeled as Si, clay is labeled as C, and very fine sand is labeled VFS for all stations in each of the CAD cells and reference stations. CAD cell M2 has coarse sand cap material at all stations except 7 (Figure 6a). The major modal grain size at cell M2 is >4.0) phi indicating that silt dominates this cell and there was little very fine sand present. There were no samples taken from within the coarser sand cap material and the grain size data represents material taken from the top 15 cm. The three reference stations for cell M2 consisted of silt over clay with a minimal amount of very fine sand mixed throughout. CAD cell M4 has coarse sand cap material present at all stations except station 4 (Figure 6b). This cell has a greater amount of very fine sand present at the surface when compared to CAD cell M2. The major
May, 2003 13 DMMP-01-02
modal grain size at cell M4 is less than 4.0 but greater than 3.0 . The three reference stations for cell M4 were comprised of silt over clay with a major modal grain size >4.0 phi. No sand was present at these reference stations (Figure 6b). CAD cell IC2 consists of predominantly silt over clay. Stations 1, 2, and 3 at cell IC2 had minimal amounts of very fine sand mixed with silt at the surface. The remaining five stations were all comprised of silt over clay. The major modal grain size for this cell was >4.0. The four reference stations for IC2 were comprised of all silt over clay. No coarse sand cap material was visible within the view of the sediment profile image photographic prism (Figure 6c). CAD cell M8 had very fine sand mixed with silt at the surface for all stations. Below this layer was silt and the major modal grain size was >4.0 and since this cell remains uncapped there was no evidence of and coarse sand cap material. Reference stations EX1,2, and 3 were each comprised of silt/clay. (Figure 6d) There is evidence of relic RPD’s at every station in each of the CAD cells. Some relic layers are quite large and indicate quantum input (large quantities of sediment deposited in a single event) of material potentially caused from slumping events at the cell’s edge. There is also evidence for recent sediment depositional intervals (RSDIs). This is most likely caused by anthropogenic disturbance such as propeller thrusting and shipping vessel activity. These RSDI events are much thinner than the slumping quantum events and can be seen close to the surface (Plate 1, Appendix D).
Mean Apparent RPD Depths Figure 7a-7d show the distribution of the recent mean apparent RPD depths over the surveyed area in each of the four CAD cells and reference stations. These figures also map the presence or absence of dewatering pipes, methane bubbles, and anoxic (no oxygen at the sediment-water interface) surfaces. The recent apparent RPD depths (in cm) distinguish between the intensively mixed surface zone and the anoxic zone that lies beneath. Mixing processes include bioturbation, predator foraging, and water turbulence (resuspension and transport). Dewatering pipes are evidence of sediment compaction that forces interstitial water toward the surface (Plate 2, Appendix D). CAD cell IC2 (Figure 7c) had the deepest recent apparent RPD depths. The greatest recent RPD depth at IC2 was 1.08 cm. This CAD cell had the greatest abundance of benthic fauna, when compared to other CAD cells, and thus the deeper recent RPD depths may be attributed to bioturbation (Table 3). The remaining cells did not have recent RPD depth greater than 1.0 cm. CAD cell M8 (Figure 5D), which was most recently dredged and filled but not capped, had recent RPD values ranging between 0.38cm to 0.93cm. CAD cell M4 (Figure 7b) that had the most uneven distribution of cap material over the contaminated sediment had recent RPD depth values ranging between 0.27cm and 0.66cm. CAD cell M2 (Figure 7a) had only oxic surfaces at stations 1 and 2 with shallow recent RPD depths of 0.24cm and 0.40cm, respectively. Stations 2,3,4,5,7,and 8 all had anoxic surfaces and this may be attributed to recent quantum input of edge material overlaying the capped toxic sediment caused by the slumping of the CAD cell walls. Overall, the aggregate recent RPD depths are shallow in all the CAD cells, likely due to cell edge slumping and redepositional disturbance events caused by anthropogenic uses of the shipping channel (Plate 3, Appendix D).
Benthic Processes Figure 7a-7d show the presence of methane gas as imaged in sediment profile photographs. Also included on these figures are apparent anoxic/oxic conditions at the sediment-water interface as inferred May, 2003 14 DMMP-01-02

from the presence/absence of low-reflectance sulfidic sediment, RPD depth and the presence/absence of dewatering pipes. All stations at each of the CAD cells and reference stations showed physical disturbance. Physical bottom disturbance can be caused by turbulent resuspension from currents, prop wash, bow-wave wash, bottom scouring, or foraging activities of demersal fish and crustaceans. Any activity associated with dredging, disposal of material and erosion of cell edges would cause physical disturbance of the bottom. The quality of the over-lying water column and sediment itself impacts benthic community structure. Areas that experience high rates of nitrogen loading (eutrophication) and presence of organic toxic chemicals tend to generate sediment inventories of methane gas by promoting the growth of bacteria that reduce dissolved oxygen in the water column. As the bacteria thrive and create an anoxic environment, the benthic faunal diversity (which depends on oxygenated sediment-water interface) decreases. Certain anaerobic bacteria species are able to fix excess carbon to produce methane gas while others have the ability to fix excess sulfur and produce hydrogen sulfide gas. When the inventory of methane gas is large, sediment profile images show the presence of gas bubbles within the sediment column. Three stations at cell M2 (2, 7, and 8) and two stations at M4 (2 and 7) show the presence of methane gas bubbles below the sediment surface (Plate 4, Appendix D). When oxygen concentrations are low, sediment profile images show a very thin apparent RPD (or no RPD) and low-reflectance sulfidic microbial mat at the sediment-water interface (Plate 5, Appendix D). Fourteen of the 45 stations had a recent RPD depth of 0.40 cm or less which suggests that approximately 30% of the surveyed stations demonstrate sediments with very shallow oxidation. 100% of these stations including the reference sites are physically disturbed.
Successional Status The successional status of each CAD cell station is shown in Figure 8a-8d along with the presence or absence of microbial mats of sulfur reducing bacteria. These microbial mats are present when the sediment-water interface is anoxic (Plate 5, Appendix D). CAD cell M4, M2 and M8 (Figures 8a, 8b, and 8d) are dominated by Stage I organisms that include polychaetes (Capitella capitata, Polydora cornuta, and Streblospio benedicti), and oligochaetes (Tubificoides apectinatus). CAD cell IC2 (Figure 8c) was also dominated by Stage I organisms but also had Stage II and III organisms present in very low numbers. These Stage II and III organisms found at IC2 were: one amphipod (Ampelisca abdita), one decapod (Crangon septimspinosa), and one polychaete (Nephtys incisa). Two opportunistic species of bivalves (Tellina agilis and Yoldia limatula) were also found at CAD cell IC2 and the reference station IC2-R but were not present at any other cell or reference station. This is typical for benthic habitats that are recently and/or consistently disturbed.
Organism-Sediment Indices Spatial trends in the organism-sediment indices (OSI) are shown in Figures 9a-9d along with the number of relic RPDs found at each station. The lowest indices (negative) are found at CAD cell M2 at stations 2 (-10), 3 (-3), 4 (-8), 5 (-3), 7 (-10), and 8. All of these stations show evidence of no dissolved oxygen near the sediment-water interface (see Figure 9A). Experience with mapping OSI values has shown that OSI values of less than +6 represent physically disturbed or otherwise degraded benthic habitats. Using this threshold OSI criterion, 100% of the stations sampled in June 2000 represent physically disturbed or degraded conditions. This is to be expected as these CAD cells were recently constructed, filled and in some cases capped. All reference stations for each of the CAD cells had OSI values of either +1 or +2. There were oxic surfaces at each of these stations but these values suggest that even the reference stations are quite disturbed. Bottom scouring from marine vessel traffic is most likely the cause of this disturbance. One reference station at IC2 (IC2-R-2) had a value of +6 which suggests that IC2-R-2 is marginally less disturbed when compared to the other stations.
May, 2003 15 DMMP-01-02

Discussion This survey of the 4 CAD cells and their associated reference sites shows that bottom 20 cm of sediment located both inside and outside the cells are predominantly comprised of silt. The presence of dewatering pipes within CAD cell M8 is evidence that the dredged disposal material is settling and forcing trapped water toward the surface of the cell. Both CAD cell M4 and M8 had a thin layer of very fine sand at the surface, cells M2 and IC2 had silt at the surface. OSI values suggest that the CAD cell benthic surfaces and the reference sites are both disturbed. The low biodiversity values at both the cell stations and reference stations also suggest that the benthic environment over the entire in-channel area is consistently subjected to disturbance. Thus, impact to the benthic habitat caused by dredging, filling, and capping these cells is far less than if this area was completely undisturbed with naturally high biodiversity. Mean recent apparent RPD depths are equal to, or less than, 2.44 cm deep. The majority of stations have mean recent apparent RPD depths 0.30-0.75 cm. Most RPD depths (98%) are less than 2 cm deep and half (92%) are less than 1 cm deep. The thin depth of the RPD is attributed to the shallow bioturbation associated with Stage I species (see below), and the apparent high sediment oxygen demand of the organic mud fraction of these sediments. Most (> 90%) of the stations are dominated by Stage I seres (a sere is the successional stage of a habitat) or are apparently azoic with respect to macrofauna (M2-2-3-1, M2-4-4-1, and M2-7-2-2). Stage I seres are dominated by the opportunistic polychaetes and oligochaetes (Capitella capitata, Polydora cornuta, Tubificoides apectinaria). These assemblages are apparently productive but have low biodiversity. Only at IC2 were Stage II seres found with the appearance of an amphipod and decapod. Because most stations have thin apparent RPDs, low successional status, and some stations show the presence of methane and low dissolved oxygen at the sediment-water interface, the resulting OSI values for the surveyed stations are low compared outer Boston Harbor habitats. Only one station has an OSI value equal to +6. By comparison, stations sampled for the Boston Harbor Soft Bottom Benthic Monitoring Program (1996-1997) for MWRA showed that >80% of stations in outer Boston Harbor were >+6. Stations in the lower Charles River, for this MWRA survey, ranged between +4 to +7.3 (Blake et al. 1998). The majority of stations in the CAD cells and reference stations for the BHNIP June 2000 survey had OSI values of +2, much lower than any of the MWRA stations suggesting that the Inner Confluence/Mystic River area is more disturbed than the lower Charles River or outer Boston Harbor. The BHNIP stations had values similar to Dorchester and Hingham Bays, highly eutrophic and disturbed habitats. Factors that may be operating to produce degraded benthic habitats along the surveyed route include (but are not limited to) physical bottom instability, and other mechanisms that can suspend sediment or otherwise erode the bottom (e.g., prop wash, bow waves, bottom foraging). High rates of organic loading are also apparently degrading the benthic habitats as manifested in images of sediment methane gas and sulfidic sediment at the sediment-water interface. The impact of excavating, filling, and capping the cells for the BHNIP adds a level of local disturbance that is likely only slightly greater than the dredging that was performed in the area. However, this system is generally already experiencing high levels of ambient chemical and physical disturbance. Based on the results of this survey and because the ambient biological community is already adapted to disturbance, the recovery of the benthic habitat in the CAD cells is quite rapid, and recolonization can take place within days as evidenced by the multiple redepositional layers and presence of bioturbation in the sediment profile imagery.
May, 2003 16 DMMP-01-02

REFERENCES CITED
Blake, J.A. and B. Hilbig. 1995. Combined Work/Quality Assurance Program Plan (CW/QAPP) for Benthic Monitoring: 1995-1997. MWRA Environmental Quality Department Misc. Rpt. No. MS-34. Massachusetts Water Resources Authority, Boston, MA. 68 pp.
Blake, J.A., I.P. Williams, E.D. Gallagher, B. Hecker, D.C. Rhoads, and P.L. Arnofsky. 1998.
Massachusetts Bay Outfall Monitoring Program: Benthic Biology and Sedimentology Baseline Monitoring for 1997 and Retrospective Analysis of the 1992-1997 Database. Massachusetts Water Resources Authority, Environmental Quality Department, Technical Report Series No. 98-16. 153 pp. + 8 Appendices.
ENSR. 1997. Summary report of independent observations Phase I-Boston Harbor Navigation
Improvement Project. Prepared for Massachusetts Coastal Zone Management. ENSR. Document Number 4479-001-150, ENSR, Acton, MA.
ENSR. 2000. Application of Iroquois Gas Transmission System, L.P. for a Certificate of Public
Convenience and Necessity. Volume II. Environmental Resource Reports. 200 pp. Volume III. Biological Assessment. 135 pp. plus Appendices A–E.
Rhoads, D.C. and J.D. Germano. 1982. Characterization of organism-sediment relations using sediment
profile imaging: An efficient method of Remote Ecological Monitoring of the Seafloor (REMOTS system). Marine Ecology Progress Series 8: 115-128.
May, 2003 17 DMMP-01-02

ALL FIGURES NOT INCLUDED; CONTACT CZM FOR HARD COPY OF REPORT.
Figure 4. Diagram of the Benthos Model 3731 sediment profile camera in operational mode
DMMP-01-02 September, 2001 A-1
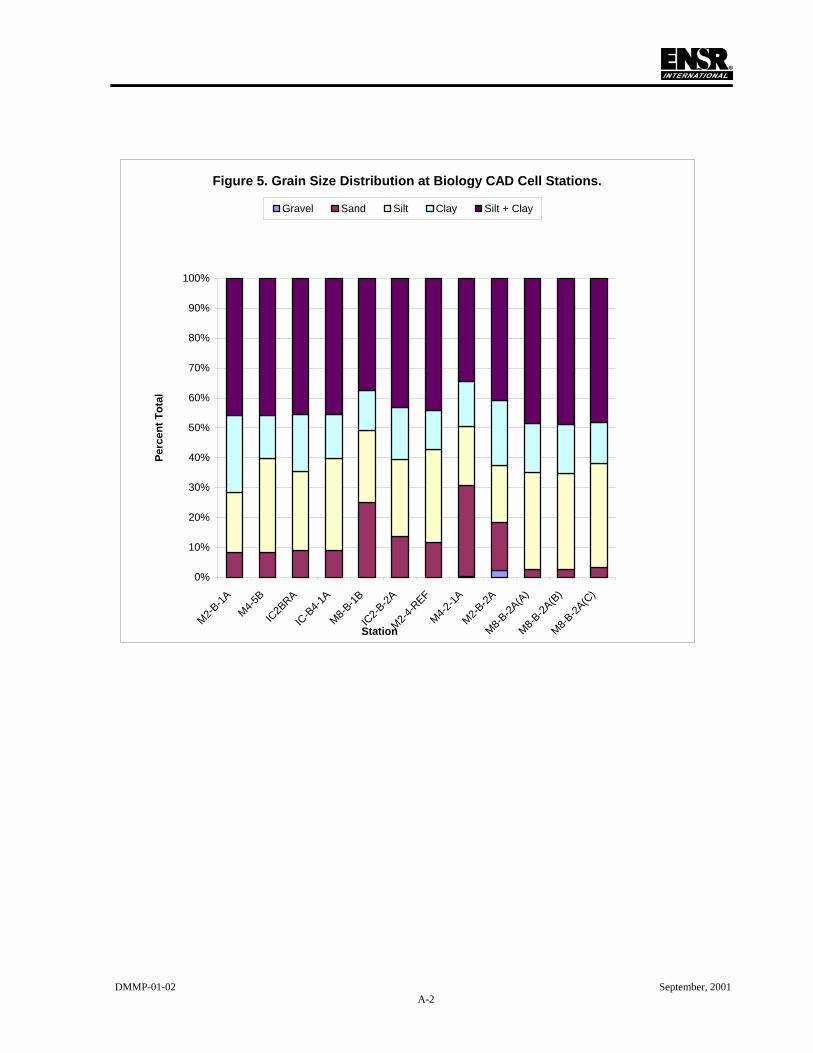
Figure 5. Grain Size Distribution at Biology CAD Cell Stations.
0%
10%
20%
30%
40%
50%
60%
70%
80%
90%
100%
M2-B-1A
M4-5B
IC2B
RA
IC-B
4-1A
M8-B-1B
IC2-B
-2A
M2-4-R
EF
M4-2-1A
M2-B-2A
M8-B-2A
(A)
M8-B-2A
(B)
M8-B-2A
(C)
Station
Perc
ent T
otal
Gravel Sand Silt Clay Silt + Clay
DMMP-01-02 September, 2001 A-2

Appendix A. Station Co-ordinates for Analyzed Biology and Sediment Profile Image Photography Stations
DMMP-01-02 September, 2001 A-3

COORDINATES FOR BIOLOGY SAMPLES
COLLECTED IN JUNE 2000
Station
Latitude (N) Longitude (W) Depth (ft)
IC2-B-1A 42.37862747 -71.04425922 54
IC2-B-2A 42.37947806 -71.04422916 50
IC2-B-RA 42.37849277 -71.04591025 46
M2-4 9046220 N 235808.5 E 36
M2B-1A 42.38787515 -71.06684355 55
M2-B-2A 42.38771944 -71.06580408 54
M4-2A 42.38767020 -71.06475624 43
M4-5A 42.38753603 -71.06375064 52
M8-B-1A 42.38617318 -71.05893384 58
M8-B-2A 42.38604286 -71.05727878 54
DMMP-01-02 September, 2001
B-5

COORDINATES FOR SPI CAMERA STATIONS FOR THE BHNIP JUNE 2000 SURVEY
Station Rep Latitude (N) Longitude (W) Depth (ft) IC2 1-1 42.37873332 -71.04426999 50 1-2 42.37875191 -71.04425747 50 1-3 42.37885241 -71.04417236 50 IC2 2-1 42.37865384 -71.04443255 55 2-2 42.37864745 -71.04418173 55 2-3 42.37869785 -71.04411082 55 IC2 3-1 42.37904518 -71.04422257 53 3-2 42.37893393 -71.04416181 53 3-3 42.37891555 -71.04422594 55 IC2 4-1 42.37919533 -71.0441286 53 4-1 42.37927268 -71.04415415 54 4-3 42.37926214 -71.04403923 54 4-4 42.37948053 -71.04389765 54 IC2 5-1 42.37943769 -71.04419801 55 5-2 42.37948862 -71.04405484 55 5-3 42.37948183 -71.04422732 55 IC2 6-1 42.37969370 -71.04427934 55 6-2 42.37967835 -71.04415390 55 6-3 42.37979020 -71.04416402 55 IC2 7-1 42.37898368 -71.04390354 54 7-2 42.37897270 -71.04385954 54 7-3 42.37889909 -71.04389055 56 7-4 42.37894121 -71.04379602 56 IC2 8-1 42.37897046 -71.04440623 55 8-2 42.37898550 -71.04434079 56 8-3 42.37893570 -71.04426720 56
DMMP-01-02 September, 2001
B-6

COORDINATES FOR SPI CAMERA STATIONS FOR THE BHNIP JUNE 2000 SURVEY
Station Rep Latitude (N) Longitude (W) Depth (ft) M8 1-1 42.38629566 -71.05929561 63 1-2 42.38625037 -71.05924832 62 1-3 42.38649058 -71.05892398 61 1-4 42.38627618 -71.05919313 61 1-5 42.38648008 -71.05907136 63 M8 2-1 42.38633716 -71.05877871 62 2-2 42.38634326 -71.05874977 62 2-3 42.38613411 -71.05883939 61 2-4 42.38610023 -71.05871612 61 M8 3-1 42.38602797 -71.05830033 63 3-2 42.38615475 -71.05828244 63 3-3 42.38620623 -71.05802037 63 3-4 42.38619826 -71.05810107 63 3-5 42.38610842 -71.0584795 63 M8 4-1 42.38613762 -71.05771434 63 4-1 42.38609791 -71.05782828 63 4-3 42.38619958 -71.05781373 63 M8 5-1 42.38607119 -71.05717888 63 5-2 42.38592715 -71.05727291 63 5-3 42.38605518 -71.05713685 63 M8 6-1 42.38602068 -71.05671072 56 6-2 42.38602271 -71.05669965 52 6-3 42.38584018 -71.05675946 53 M8 7-1 42.38634365 -71.05821809 59 7-2 42.3863386 -71.05819238 59 7-3 42.3865468 -71.0583709 48 7-4 42.3864107 -71.05825806 56 7-5 42.38629252 -71.05824262 59 M8 8-1 42.38611049 -71.05829234 58 8-2 42.3861166 -71.05826534 59 8-3 42.38607972 -71.05815764 59
DMMP-01-02 September, 2001
B-7

COORDINATES FOR SPI CAMERA STATIONS FOR THE BHNIP JUNE 2000 SURVEY
Station Rep Latitude (N) Longitude (W) Depth (ft) M4 1-1 42.38763746 -71.06485921 50 1-2 42.38770329 -71.06488936 55 1-3 42.38769683 -71.06486973 55 M4 2-1 42.38760940 -71.06486571 54 2-2 42.38756177 -71.06484163 45 2-3 42.38762929 -71.06462743 45 2-4 42.38764669 -71.06463362 58 2-5 42.38768743 -71.06469455 58 M4 3-1 42.38758373 -71.06438910 57 3-2 42.38763053 -71.06440833 57 3-3 42.38763358 -71.06438123 57 M4 4-1 42.38758071 -71.06413761 57 4-1 42.38753930 -71.06406795 53 4-3 42.38755263 -71.06423448 49 M4 5-1 42.38754768 -71.06380642 58 5-2 42.38753808 -71.06374467 58 5-3 42.38748696 -71.06374903 59 M4 6-1 42.38754197 -71.06348937 60 6-2 42.38748842 -71.06354038 60 6-3 42.38747124 -71.06356952 60 6-4 42.38742076 -71.06357497 48 6-5 42.38749007 -71.06350211 48 M4 7-1 42.38773441 -71.06440361 58 7-2 42.38774263 -71.06417451 58 7-3 42.38764856 -71.06434251 58 7-4 42.38771359 -71.06442197 58 7-5 42.38764350 -71.06433793 58 M4 8-1 42.38755144 -71.06444397 52 8-2 42.38751731 -71.06427370 52 8-3 42.38749675 -71.06440889 52 8-4 42.38762066 -71.06456008 52
DMMP-01-02 September, 2001
B-8

COORDINATES FOR SPI CAMERA STATIONS FOR THE BHNIP JUNE 2000 SURVEY
Station Rep Latitude (N) Longitude (W) Depth (ft) M2 1-1 42.38784513 -71.06680854 57 1-2 42.38793469 -71.06685092 57 1-3 42.38792470 -71.06678018 57 1-4 42.38798088 -71.06685364 57 M2 2-1 42.38787901 -71.06672135 61 2-2 42.38767213 -71.06653198 61 2-3 42.38783615 -71.06667197 61 M2 3-1 42.38783390 -71.06631336 60 3-2 42.38780366 -71.06631515 60 3-3 42.38782125 -71.06639555 60 3-4 42.38784965 -71.06635941 61 3-5 42.38784058 -71.06641266 61 M2 4-1 42.38776886 -71.06608756 59 4-1 42.38777407 -71.06608461 59 4-3 42.38777760 -71.06609029 60 4-4 42.38779231 -71.06607416 59 M2 5-1 42.38769238 -71.06574197 63 5-2 42.38776358 -71.06576128 62 5-3 42.38776359 -71.06574148 63 M2 6-1 42.38766371 -71.06542216 63 6-2 42.38771404 -71.06535113 63 6-3 42.38768494 -71.06541521 63 6-4 42.38770604 -71.06542491 63 M2 7-1 42.38800909 -71.06633682 60 7-2 42.38796956 -71.06638117 60 7-3 42.38803283 -71.06632925 61 7-4 42.38796250 -71.06629912 60 M2 8-1 42.38776599 -71.06649575 61 8-2 42.38774341 -71.06638114 61 8-3 42.38774685 -71.06638695 61 8-4 42.38775276 -71.06647374 61
DMMP-01-02 September, 2001
B-9

COORDINATES FOR REFERENCE SPI CAMERA STATIONS FOR THE BHNIP JUNE 2000 SURVEY
Station
Rep
Latitude (N) Longitude (W) Depth (ft)
M4-R 1-1 42.38710810 -71.06512371 43 1-2 42.38708856 -71.06507381 43 1-3 42.38673276 -71.06509581 43 M4-S 2-1 42.38654124 -71.06401775 43 2-2 42.38654092 -71.06398217 43 2-3 42.38653520 -71.06396921 43 M4-T 3-1 42.38645764 -71.06329295 43 3-2 42.38645597 -71.06325374 43 3-3 42.38642888 -71.06316357 43 M2-R 4-1 42.38678825 -71.06593945 38 4-1 42.38687188 -71.06603409 38 4-3 42.38687572 -71.06609636 38 EX 1 42.38761073 -71.05932737 53 2 42.38757627 -71.05928474 53 3 42.38759985 -71.05921123 53 IC2-R 1-1 42.37886326 -71.04520781 48 1-2 42.37880773 -71.04582919 48 1-3 42.37847922 -71.04592080 48 1-4 42.37859959 -71.04587561 48 IC2-R 2-1 42.37870945 -71.04601519 47 2-2 42.37891048 -71.04592850 47 2-3 42.37895787 -71.04602846 47 IC2-R 3-1 42.37924265 -71.04598514 47 3-2 42.37917095 -71.04600058 48 3-3 42.37908515 -71.04604613 48 3-4 42.37923441 -71.04605380 48 IC2-R 4-1 42.37966881 -71.04584219 48 4-2 42.37967674 -71.04588851 48 4-3 42.37960392 -71.04591417 48
DMMP-01-02 September, 2001
B-10

Appendix B-1 and B-2. List of Species Identified from the June 2000 Samples Taken from Four CAD Cells and Reference Stations for the
BHNIP.
DMMP-01-02 September, 2001
B-11

Appendix B-1. Species Identified in the June 2000 Samples CNIDARIA Hydrodea Campanularidae
Campanularia gigantea Hincks, 1865 ANNELIDA Polychaeta Capitellidae Capitella capitata Eisig, 1887
Mediomastus ambiseta Hartman, 1947 Cirratulidae
Tharyx acutus Webster & Benedict, 1887 Glyceridae
Glycera americana Leidy, 1855 Hesionidae Microphthalmus sczelkowii Mecanikow, 1865 Nephtyidae
Nephtys incisa Malmgren, 1865 Nereididae
Nereis grayi Pettibone, 1956 Spionidae
Polydora cornuta Bosc, 1802 Spio thuleni Maciolek, 1990 Streblospio benedicti Webster, 1879 Trochochaeta multisetosa (Oersted, 1844)
Oligochaeta Tubificidae Tubificoides apectinatus Brinkhurst, 1965 Tubificoides sp. 2 CRUSTACEA Amphipoda Ampeliscidae
Ampelisca abdita Mills, 1864 Decapoda Crangonidae Crangon septemspinosa (Say, 1818) MOLLUSCA Bivalvia Myacidae Mya arenaria Linnaeus, 1758 Mytilidae Mytilus edulis Linnaeus, 1758 Nuculidae
Yoldia limatula (Say, 1831) Tellinidae
Tellina agilis Stimpson, 1857 Gastropoda Lacuna vincta Montagu, 1803 Ilyanassa trivittata (Say, 1822)
DMMP-01-02 September, 2001
B-12

Appendix B-2. Taxa recorded at each of the stations sampled in June 2000. *Taxa not included in diversity calculations.
STAT_ID IC2-B-1A IC2-B-2A IC2-BR-A M2-4 M2-B-1A M2-B-2A M4-2A M4-5A M8-B-1A M8-B-2A Individual species sum
STAT_ARRIV 06/2000 6/2000 6/2000 6/2000 6/2000 6/2000 6/2000 6/2000 6/2000 6/2000
DESCRIPTION SPEC_CODE Bio. Ref.Cnidaria Campanularia gigantea* 3704010119 1 colony 1 colony 1 colony 0 Polychaeta 0 Nereis grayi 5001240409 1 1Nephtys incisa 5001250115 1 3 1 5 Glycera americana 5001270104 1 1Polydora cornuta 5001430448 5 20 70 9 1 26 3 6 9 149Spio thulini 5001430709 1 3 2 6Streblospio benedicti 5001431801 9 8 5 2 9 6 2 1 42 Trochochaeta multisetosa 5001450203 1 1 1 3
Micropthalmus sczelkowii 5001210201 13 1 14Tharyx acutus 5001500305 3 21 4 1 1 30 Capitella capitata complex 5001600101 46 30 12 7 1 23 18 8 1 19 165 Mediomastus ambiseta 5001600401 7 1 8Oligochaeta 0 Tubificoides apectinatus 5009020906 9 37 2 1 3 8 2 12 74
Tubificoides sp. 2 50090209SP02 20 4 1 3 7 1 2 38 Gastropoda 0 Lacuna vincta* 5103090305 2 dead 0 Ilyanassa trivittata* 5105080202 1 dead 0 Bivalvia 0 Yoldia limatula 5502040511 1 1
Mytilus edulis 5507010101 6 3 1 1 2 13
Tellina agilis 5515310205 1 1 1 3
Mya arenaria 5517010201 1 1
Amphipoda 0 Ampelisca abdita 6169020108 2 2
Decapoda 0 Crangon septemspinosa 6179220103 1 1
Total spp. at station sum 96 144 100 26 4 28 63 35 16 45 557
DMMP-01-02 C-13 September, 2001

Appendix C. SPI Image analysis
DMMP-01-02 C-14 September, 2001

Station ID Penetration Depth Comments Boundary Roughness Redox Potential Discontiuity (PRD) Depth (cm)
RPD Comments
Minimum Maximum Mean Type Thickness (cm) Min. Max. MeanEX-1-2 21.23 22.62 21.87 undredged area, SPI ref physical 1.39 0.25 1.10 >0 to 0.75 0.70 EX-2-2 21.10 22.40 21.68 undredged area, SPI ref physical 1.30 0.28 0.66 >0 to 0.75 0.42 EX-3-2 21.34 21.32 20.69 undredged area, SPI ref physical -0.02 0.37 0.66 >0 to 0.75 0.50
IC2-1-1-1 15.75 16.51 16.14 physical 0.76 0.41 1.84 0.76 to 1.50 1. 08 IC2-2-2-2 17.87 18.48 18.08 physical 0.61 0.35 1.45 >0 to 0.75 0.73 IC2-3-2-2 18.19 18.86 18.49 physical 0.67 0.19 0.76 >0 to 0.75 IC2-4-2-2 17.78 18.67 18.12 physical 0.89 0.12 0.82 >0 to 0.75 0.500 IC2-5-2-2 17.37 17.84 17.59 biological 0.47 0.31 1.29 >0 to 0.75 0.64 IC2-6-2-2 17.65 18.32 17.89 physical 0.67 0.15 1.07 >0 to 0.75 0.67 IC2-7-4-2 17.62 18.73 18.14 physical 1.11 0.31 0.88 >0 to 0.75 0.47 IC2-8-2-2 15.47 15.93 physical 1.11 0.34 1.42 0.76 to 1.50 0.82 ICR-1-1-1 12.05 15.85 13.35 undredged area, cell ref physical 3.80 0.28 1.26 >0 to 0.75 0.76 ICR-2-3-2 10.41 11.77 11.29 undredged area, cell ref physical 1.36 1.39 3.10 2.26 to 3.00 2.44 ICR-3-3-2 12.43 13.32 12.51 undredged area, cell ref physical 0.89 0.25 0.75 >0 to 0.75 0.53 ICR-4-3-2 13.92 14.62 14.18 undredged area, cell ref physical 0.70 0.50 1.39 0.76 to 1.50 1.00 M2-1-5-2 12.65 13.6 13.02 physical 0.95 0.15 0.41 >0 to 0.75 0.24 M2-2-3-1 15.47 18.10 17.07 physical 2.63 0.00 0.00 0.00 No oxic surfaceM2-3-4-2 14.43 15.94 14.77 physical 1.51 0.00 0.00 0.00 No oxic surfaceM2-4-4-1 11.48 13.13 11.96 physical 1.65 0.00 0.00 0.00 No oxic surfaceM2-5-1-2 13.25 13.92 13.68 physical 0.67 0.00 0.00 0.00 No oxic surfaceM2-6-3-2 21.07 22.68 21.81 physical 1.61 0.12 0.75 >0 to 0.75 0.40 M2-7-2-2 15.34 17.02 16.18 physical 1.68 0.00 0.00 0.00 No oxic surfaceM2-8-1-2 20.75 21.42 21.10 physical 0.67 0.00 0.00 0.00 No oxic surface
M2-R-1-1-1 14.55 15.88 15.12 undredged area, cell ref physical 1.33 0.15 0.79 >0 to 0.75 0.40 M2-R-1-2-2 17.02 17.72 17.36 undredged area, cell ref physical 0.70 0.09 0.88 >0 to 0.75 0.41 M2-R-1-3-2 17.49 18.70 18.07 undredged area, cell ref physical 1.21 0.00 1.17 >0 to 0.75 0.53 M4-1-3-2 11.17 12.08 11.73 physical 0.91 0.15 0.56 >0 to 0.75 0.34 M4-2-2-2 12.65 13.25 12.81 physical 0.60 0.12 1.13 >0 to 0.75 0.46 M4-3-1-2 14.87 15.56 15.21 physical 0.69 0.06 0.56 >0 to 0.75 0.31 M4-4-1-2 11.26 11.55 11.39 physical 0.29 0.15 0.56 >0 to 0.75 0.33
16.58
DMMP-01-02 C-15 September, 20001

Station ID Penetration Depth Comments Boundary Roughness Redox Potential Discontiuity (PRD) Depth (cm)
RPD Comments
Minimum Maximum Mean Type Thickness (cm) Min. Max. MeanM4-5-3-2 11.39 13.98 12.79 physical 2.59 0.25 1.61 >0 to 0.75 0.66 M4-6-4-2 10.25 8.54 9.12 physical -1.71 0.09 0.50 >0 to 0.75 0.27 M4-7-5-2 15.31 16.07 15.51 physical 0.76 0.18 0.53 >0 to 0.75 0.32 M4-8-1-2 15.03 16.07 15.43 physical 1.04 0.12 0.75 >0 to 0.75 0.35 M4-R-3-2 18.57 19.39 18.86 undredged area, cell ref physical 0.82 0.15 1.17 0.76 to 1.50 0.78 M4-S-3-2 17.24 18.35 17.71 undredged area, cell ref physical 1.11 0.37 1.10 >0 to 0.75 0.61 M4-T-2-2 14.96 16.70 15.61 undredged area, cell ref physical 1.74 0.37 0.85 >0 to 0.75 0.47 M8-1-1-1 13.29 15.50 14.53 1.00 2.21 0.12 0.91 >0 to 0.75 0.43 M8-2-2-2 14.49 16.80 15.44 physical 2.31 0.31 0.82 >0 to 0.75 0.56 M8-3-5-2 16.77 18.13 17.15 physical 1.36 0.18 0.20 >0 to 0.75 0.42 M8-4-3-2 10.69 11.42 10.94 physical 0.73 0.31 0.75 >0 to 0.75 0.55 M8-5-2-2 22.56 22.72 22.64 physical 0.16 0.34 0.91 >0 to 0.75 0.63 M8-6-2-1 17.08 18.25 17.53 physical 1.17 0.15 0.75 >0 to 0.75 0.38 M8-7-3-2 5.82 9.05 8.24 physical 3.23 0.23 1.32 0.76 to 1.50 0.80 M8-8-2-1 13.06 13.67 13.41 physical 0.61 0.37 1.26 >0 to 0.75 0.93
DMMP-01-02 C-16 September, 2001

Station ID Grain Size (phi) Grain Size comments Minimum Maximum Mode
EX-1-2 >4 (<62 um) 4 to 3 (62 um to 125 um) >4 (<62 um) little amnts. v.f. sand at surface Silt/clay silt/clay clay at about 10cm
EX-2-2 >4 (<62 um) 4 to 3 (62 um to 125 um) >4 (<62 um) small amt. of v.f. sand at surface and to 8cm Silt/clay Silt/clay, clay at 10 cm
EX-3-2 >4 (<62 um) 4 to 3 (62 um to 125 um) >4 (<62 um) v.f. sand at surfance and to 8cm Silt/clay with v.f. sand at surface Silt/clay, clay depth indeterminant
IC2-1-1-1 >4 (<62 um) 4 to 3 (62 um to 125 um) >4 (<62 um) No Coarse sand visible by REMOTS v.f.s. over silt/clay
IC2-2-2-2 >4 (<62 um) 4 to 3 (62 um to 125 um) >4 (<62 um) No coarse sand visible by REMOTS v.f.s. over silt/clay
IC2-3-2-2 >4 (<62 um) 4 to 3 (62 um to 125 um) >4 (<62 um) No coarse sand visible by REMOTS v.f.s. over silt/clay
IC2-4-2-2 >4 (<62 um) >4 (<62 um) >4 (<62 um) organic mineral aggregates present No sand at these substations silt/clay
IC2-5-2-2 >4 (<62 um) >4 (<62 um) >4 (<62 um) No Sand at this replicate silt/clay
IC2-6-2-2 >4 (<62 um) >4 (<62 um) >4 (<62 um) No Sand Silt/clay
IC2-7-4-2 >4 (<62 um) 4 to 3 (62 um to 125 um) >4 (<62 um) small sub surface pockets of sand silt/clay
IC2-8-2-2 >4 (<62 um) >4 (<62 um) >4 (<62 um) only tiny fraction of v.f. sand at surface silt/clay
ICR-1-1-1 >4 (<62 um) >4 (<62 um) >4 (<62 um) OMA No sand, all silt
ICR-2-3-2 >4 (<62 um) >4 (<62 um) >4 (<62 um) all silt/clay with OMA
ICR-3-3-2 >4 (<62 um) >4 (<62 um) >4 (<62 um) all silt/clay with OMA and RDSI
ICR-4-3-2 >4 (<62 um) >4 (<62 um) >4 (<62 um) all silt/clay
M2-1-5-2 >4 (<62 um) 4 to 3 (62 um to 125 um) >4 (<62 um) two rows of sand cap material, 7 cm and 12 cm fine layer of sand at surface, not much Silt/clay over and between cap material
M2-2-3-1 >4 (<62 um) 3 to 2 (125 um to 250 um) >4 (<62 um) very fine layer of cap material at 12 cm Microbial mats at surface, all silt over clay Silt over clay, clay starts at about 9cm
M2-3-4-2 >4 (<62 um) >4 (<62 um) >4 (<62 um) slight amount of cap material 14 cm Silt at surface 0-8cm Silt/clay, clay starts at about 9 cm
M2-4-4-1 >4 (<62 um) 3 to 2 (125 um to 250 um) >4 (<62 um) layer of sand cap material at 11.5 cm Silt below surface to 8 cm Silt over clay, clay at 8 cm and below
M2-5-1-2 >4 (<62 um) 1 to 0 (500 um to 1 mm) >4 (<62 um) Very coarse cap material at 10 cm Silt at surface to 8cm Silt/clay, clay starts at 8cm
M2-6-3-2 >4 (<62 um) 1 to 0 (500 um to 1 mm) >4 (<62 um) Coarse sand cap at 12-14 cm Silt with pockets of v.f. sand throughout Silt/clay, clay at about 15 cm
M2-7-2-2 >4 (<62 um) >4 (<62 um) >4 (<62 um) No sand cap material in view Silt below surface to 10 cm Clay below silt from 10 cm to 17 cm
M2-8-1-2 >4 (<62 um) 3 to 2 (125 um to 250 um) >4 (<62 um) some cap material dispersed at 18 cm Silt at surface to 9 cm Clay below surface 9cm to 21 cm
M2-R-1-1-1 >4 (<62 um) 4 to 3 (62 um to 125 um) >4 (<62 um) pocket of sand around 8 cm RSDI present some sand near surface, mostly silt/clay
M2-R-1-2-2 >4 (<62 um) 4 to 3 (62 um to 125 um) >4 (<62 um) V.F. sand distributed throughout silt/clay
M2-R-1-3-2 >4 (<62 um) >4 (<62 um) 4 to 3 (62 um to 125 um) v.f. sand distributed throughout Silt/clay Silt/clay
M4-1-3-2 >4 (<62 um) 3 to 2 (125 um to 250 um) >4 (<62 um) minimal amounts of v.f.sand only at surface Coarse sand cap material 8cm below surface Silt/clay over coarse sand cap material
M4-2-2-2 >4 (<62 um) 1 to 0 (500 um to 1 mm) >4 (<62 um) Coarse cap sand material 13 cm below surface 2 cm v.f. sand at surface Silt/clay above coarse sand cap
M4-3-1-2 >4 (<62 um) 1 to 0 (500 um to 1 mm) >4 (<62 um) Coarse cap material 12 cm below surface v.f. sand at surface with silt Silt/clay above cap material
M4-4-1-2 >4 (<62 um) 3 to 2 (125 um to 250 um) >4 (<62 um) coarse cap material not visiable Silt at surface with 3 cm layer of sand below Silt/clay at bottom, boundary void present
M4-5-3-2 >4 (<62 um) 3 to 2 (125 um to 250 um) 3 to 2 (125 um to 250 um) mixed sand cap material throughout window Silty clay below surface Silt clay below defined layer of cap material
M4-6-4-2 >4 (<62 um) 3 to 2 (125 um to 250 um) 4 to 3 (62 um to 125 um) boundary void at clay/sand cap layer Silty clay just below surface sand throughout with min. v.f. sand at surface
DMMP-01-02 C-17 September, 2001

Station ID Grain Size (phi) Grain Size comments Minimum Maximum Mode
M4-7-5-2 >4 (<62 um) 4 to 3 (62 um to 125 um) >4 (<62 um) coarser cap sand throughout 1 cm v.f. sand at surface silt/clay above bottom
M4-8-1-2 >4 (<62 um) 3 to 2 (125 um to 250 um) >4 (<62 um) coarse sand cap at 13 cm below surface < 1cm sand at surface Silt/clay above sand cap to surface
M4-R-3-2 >4 (<62 um) >4 (<62 um) >4 (<62 um) all silt/clay
M4-S-3-2 >4 (<62 um) >4 (<62 um) >4 (<62 um) all silt/clay
M4-T-2-2 >4 (<62 um) >4 (<62 um) >4 (<62 um) all silt/clay
M8-1-1-1 >4 (<62 um) 4 to 3 (62 um to 125 um) >4 (<62 um) v.f. sand just at surface silt silt
M8-2-2-2 >4 (<62 um) 4 to 3 (62 um to 125 um) >4 (<62 um) v.f. sand just at surface Silt Silt
M8-3-5-2 >4 (<62 um) 4 to 3 (62 um to 125 um) >4 (<62 um) silt with v.f. sand at surface silt silt
M8-4-3-2 >4 (<62 um) 4 to 3 (62 um to 125 um) >4 (<62 um) small amts. v.f. sand at surface silt silt
M8-5-2-2 >4 (<62 um) 3 to 2 (125 um to 250 um) >4 (<62 um) sandy muds surface to 16 cm silt silt below sandy surface
M8-6-2-1 >4 (<62 um) 3 to 2 (125 um to 250 um) >4 (<62 um) V.F. sand at surface, sand pocket at rt. side silt at surface Silt to bottom, no clay, also RDSI
M8-7-3-2 >4 (<62 um) 3 to 2 (125 um to 250 um) >4 (<62 um) Chaotic fabric, sand suface to 3cm and throughout
sand and silt at surface silt below surface with dewatering pipe
M8-8-2-1 >4 (<62 um) 3 to 2 (125 um to 250 um) >4 (<62 um) Chaotic fabric, some sand mixed in with silt silt and f. sand at surface silt with some clay
DMMP-01-02 C-18 September, 2001
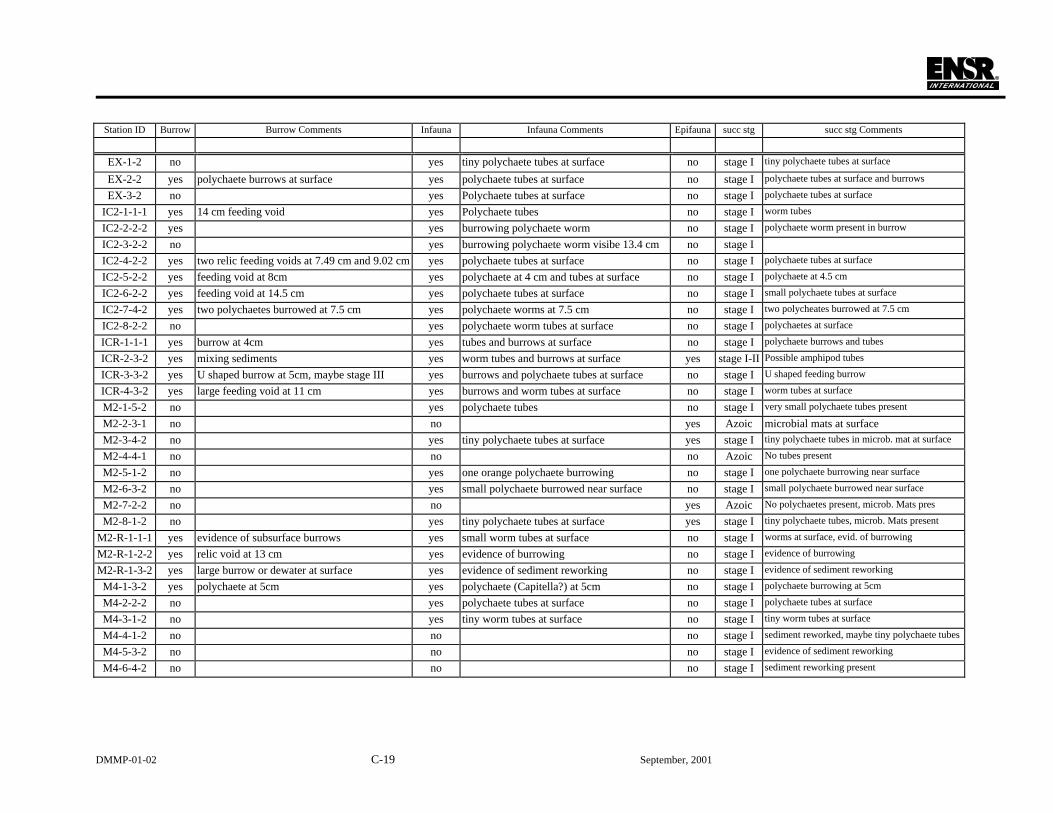
Station ID Burrow Burrow Comments Infauna Infauna Comments Epifauna succ stg succ stg Comments
EX-1-2 no yes tiny polychaete tubes at surface no stage I tiny polychaete tubes at surface
EX-2-2 yes polychaete burrows at surface yes polychaete tubes at surface no stage I polychaete tubes at surface and burrows
EX-3-2 no yes Polychaete tubes at surface no stage I polychaete tubes at surface
IC2-1-1-1 yes 14 cm feeding void yes Polychaete tubes no stage I worm tubes
IC2-2-2-2 yes yes burrowing polychaete worm no stage I polychaete worm present in burrow
IC2-3-2-2 no yes burrowing polychaete worm visibe 13.4 cm no stage I
IC2-4-2-2 yes two relic feeding voids at 7.49 cm and 9.02 cm yes polychaete tubes at surface no stage I polychaete tubes at surface
IC2-5-2-2 yes feeding void at 8cm yes polychaete at 4 cm and tubes at surface no stage I polychaete at 4.5 cm
IC2-6-2-2 yes feeding void at 14.5 cm yes polychaete tubes at surface no stage I small polychaete tubes at surface
IC2-7-4-2 yes two polychaetes burrowed at 7.5 cm yes polychaete worms at 7.5 cm no stage I two polycheates burrowed at 7.5 cm
IC2-8-2-2 no yes polychaete worm tubes at surface no stage I polychaetes at surface
ICR-1-1-1 yes burrow at 4cm yes tubes and burrows at surface no stage I polychaete burrows and tubes
ICR-2-3-2 yes mixing sediments yes worm tubes and burrows at surface yes stage I-II Possible amphipod tubes
ICR-3-3-2 yes U shaped burrow at 5cm, maybe stage III yes burrows and polychaete tubes at surface no stage I U shaped feeding burrow
ICR-4-3-2 yes large feeding void at 11 cm yes burrows and worm tubes at surface no stage I worm tubes at surface
M2-1-5-2 no yes polychaete tubes no stage I very small polychaete tubes present
M2-2-3-1 no no yes Azoic microbial mats at surface M2-3-4-2 no yes tiny polychaete tubes at surface yes stage I tiny polychaete tubes in microb. mat at surface
M2-4-4-1 no no no Azoic No tubes present
M2-5-1-2 no yes one orange polychaete burrowing no stage I one polychaete burrowing near surface
M2-6-3-2 no yes small polychaete burrowed near surface no stage I small polychaete burrowed near surface
M2-7-2-2 no no yes Azoic No polychaetes present, microb. Mats pres
M2-8-1-2 no yes tiny polychaete tubes at surface yes stage I tiny polychaete tubes, microb. Mats present
M2-R-1-1-1 yes evidence of subsurface burrows yes small worm tubes at surface no stage I worms at surface, evid. of burrowing
M2-R-1-2-2 yes relic void at 13 cm yes evidence of burrowing no stage I evidence of burrowing
M2-R-1-3-2 yes large burrow or dewater at surface yes evidence of sediment reworking no stage I evidence of sediment reworking
M4-1-3-2 yes polychaete at 5cm yes polychaete (Capitella?) at 5cm no stage I polychaete burrowing at 5cm
M4-2-2-2 no yes polychaete tubes at surface no stage I polychaete tubes at surface
M4-3-1-2 no yes tiny worm tubes at surface no stage I tiny worm tubes at surface
M4-4-1-2 no no no stage I sediment reworked, maybe tiny polychaete tubes
M4-5-3-2 no no no stage I evidence of sediment reworking
M4-6-4-2 no no no stage I sediment reworking present
DMMP-01-02 C-19 September, 2001

Station ID Burrow Burrow Comments Infauna Infauna Comments Epifauna succ stg succ stg Comments
M4-7-5-2 yes polychaetes at surface yes polychaete tubes at surface no stage I polychaete burrows and tubes present
M4-8-1-2 no yes worm tubes at surface no stage I tiny worm tubes at surface
M4-R-3-2 no maybe relic feeding voids yes worm tubes at surface no stage I worm tubes at surface
M4-S-3-2 yes relic feeding void at 7cm yes Worm tubes at surface no stage I worm tubes at surface
M4-T-2-2 no yes worm tubes at surface no stage I worm tubes at surface
M8-1-1-1 yes polychaet burrows yes polychaete tubes at surface, evidence of burrows yes stage I-II possible amphipod tubes at surface
M8-2-2-2 no yes Polychaetes yes stage I polychaetes, tubes present, dewatering pipe
M8-3-5-2 yes polychaete burrows yes polychaetes, burrrows and tubes present yes stage I-II polychaets and possible amphipod tubes
M8-4-3-2 yes yes polychaete worms no stage I Worm tubes at surface and burrows
M8-5-2-2 yes polychaete at 5cm and at surface yes polychaete tubes at surface no stage I worm tubes and burrows
M8-6-2-1 yes burrows at surface and RDSI yes Worms at surface no stage I tubes and polychaete worms
M8-7-3-2 yes yes worms and tubes, dewatering pipe yes stage I-II polychaetes and poss. amphipods at surf.
M8-8-2-1 yes polychaete at 4cm yes worms at surface, dewatering pipe no stage I worms burrowed with dewatering pipe
DMMP-01-02 C-20 September, 2001

Station ID Anoxia Clast Clast Comments Methane Methane Comments OSI Boudary Roughness Boundary Roughness Calc.
EX-1-2 no yes no sediment reworking by polychaetes 2 physical 1.39 EX-2-2 no no no 2 physical 1.3EX-3-2 no no no 2 physical -0.02
IC2-1-1-1 no no no 3 physical 0.76IC2-2-2-2 no no no 2 physical 0.61IC2-3-2-2 no no no 2 physical 0.67IC2-4-2-2 no no no . 2 physical 0.89IC2-5-2-2 no no no 2 biological 0.47IC2-6-2-2 no no no 2 physical 0.67IC2-7-4-2 no no no 2 physical 1.11IC2-8-2-2 no no no 3 physical 1.11ICR-1-1-1 no no no 2 physical 3.8ICR-2-3-2 no no no 6 physical 1.36ICR-3-3-2 no no no 2 physical 0.89ICR-4-3-2 no yes white clay clasts no 3 physical 0.7M2-1-5-2 no no no 2 physical 0.95M2-2-3-1 yes no yes present 3-5 cm, 8 bubbles 0.25-0.75 cm -10 physical 2.63 M2-3-4-2 yes no no no methane in this image -3 physical 1.51 M2-4-4-1 yes no no no methane present -8 physical 1.65 M2-5-1-2 yes yes small white clay clasts at 8cm no -3 physical 0.67 M2-6-3-2 no no no 2 physical 1.61M2-7-2-2 yes no yes Gas bubbles at 3-4 cm, 6 bubbles 0.5-1 cm -10 physical 1.68 M2-8-1-2 yes yes white clay clasts at 13 cm yes 7 gas bubbles, 0.5-1.0cm at 3cm -5 physical 0.67
M2-R-1-1-1 no no no 2 physical 1.33M2-R-1-2-2 no no no physical 0.7M2-R-1-3-2 no no no physical 1.21
M4-1-3-2 no no no 2 physical 0.91M4-2-2-2 no no yes methane around cap material as large bubble 0 physical 0.6 M4-3-1-2 no no no 2 physical 0.69M4-4-1-2 no no no 2 physical 0.29M4-5-3-2 no no no Iron oxide present at surface 2 physical 2.59 M4-6-4-2 no yes white clasts, could be clay no 2 physical -1.71
DMMP-01-02 C-21 September, 2001

Station ID Anoxia Clast Clast Comments Methane Methane Comments OSI Boudary Roughness Boundary Roughness Calc.
M4-7-5-2 no no yes tiny bubbles at 9 cm, 0.10-0.50 cm 0 physical 0.76 M4-8-1-2 no yes White clay clast at 7cm no 2 physical 1.04 M4-R-3-2 no no yes a large 2.5 cm bubble at 11 cm 1 physical 0.82 M4-S-3-2 no no no 2 physical 1.11M4-T-2-2 no yes white clay clasts no physical 1.74 M8-1-1-1 no no Organic mineral aggregates present no 3 1 2.21 M8-2-2-2 no no Organic mineral aggregates present no 2 physical 2.31 M8-3-5-2 no yes white clay clasts throughout slide no 3 physical 1.36 M8-4-3-2 no no no 2 physical 0.73M8-5-2-2 no no no 2 physical 0.16M8-6-2-1 no no no 2 physical 1.17M8-7-3-2 no no no 4 physical 3.23M8-8-2-1 no no no 2 physical 0.61
DMMP-01-02 C-22 September, 2001