june 2, 2014 2014 - jefferies · tennova healthcare •6 hospitals •1,000 physicians central...
TRANSCRIPT

2014
Jefferies Healthcare ConferenceJune 2, 2014

Forward-Looking Statements
This presentation contains forward looking statements within the meaning of Section 27A of the Securities Act,
Section 21E of the Exchange Act and the Private Securities Litigation Reform Act of 1995 that involve risk and
uncertainties. All statements in this presentation other than statements of historical fact, including statements
regarding projections, expected operating results, and other events that depend upon or refer to future events or
conditions or that include words such as “expects,” “anticipates,” “intends,” “plans,” “believes,” “estimates,” “thinks,”
and similar expressions, are forward ‐ looking statements. Although the Company believes that these forward ‐
looking statements are based on reasonable assumptions, these assumptions are inherently subject to significant
economic and competitive uncertainties and contingencies, which are difficult or impossible to predict accurately and
are beyond the control of the Company. Accordingly, the Company cannot give any assurance that its expectations
will in fact occur and cautions that actual results may differ materially from those in the forward‐looking statements.
A number of factors could affect the future results of the Company or the healthcare industry generally and could
cause the Company’s expected results to differ materially from those expressed in this presentation.
The consolidated operating results for the three months ended March 31, 2014, are not necessarily indicative of the
results that may be experienced for any such future period or for any future year. The Company cautions that the
projections for calendar year 2014 set forth in this presentation are given as of the date hereof based on currently
available information. The Company undertakes no obligation to revise or update any forward ‐ looking statements, or
to make any other forward ‐ looking statements, whether as a result of new information, future events or otherwise
2

CHS – An Experienced Operator
3
$1,306$1,531$2,039
$2,677$3,204
$3,738$4,180
$7,127
$10,840
$12,108
$11,092
$11,906
$13,029$12,998
0
2,500
5,000
7,500
10,000
12,500
15,000 ($MM) Revenues
$251 $291$349
$429$494
$573 $572
$827
$1,525
$1,671$1,761
$1,837$1,978
$1,841
0
250
500
750
1,000
1,250
1,500
1,750
2,000
EBITDA **($MM)
Proforma YE 2013
Revenue (1) $18,791 $12,998
EBITDA (1) ** $2,566 $1,841
** See the Unaudited Supplemental Information contained in this presentation for a definition of EBITDA and a reconciliation of Adjusted EBITDA, as defined, to our net cash provided by operating activities as derived directly from our consolidated financial statements for the three months ended March 31, 2014 and 2013 (Slides 34 and 35). For purposes of this presentation, EBITDA means Adjusted EBITDA.
(1) See note on slide 27.
* CAGR is calculated prior to the change in presentation of bad debt.
Revenue and EBITDA for 2009 and prior years have not been adjusted for discontinued operations.
2007 amounts include adjustments for change in estimate taken in Q407.
2006 EBITDA excludes increase in allowance for doubtful accounts of $65 million taken in Q306.

Community Health Systems
44
• Founded in 1985
• NYSE Listed Company since 2000 Symbol: CYH
• 208 Hospitals in 29 States
• 1 Million Annual Admissions
• 5 Million Annual ED Visits
• 135,000 Employees
• 22,000 Physicians on Medical Staffs

Why CHS has Long-Term Opportunities
• Improvement in the reduction of self-pay to insurance (Medicaid or Exchanges)
• Hospitals located in 9 of top 10 highest uninsured states and 26 of top 30 highest uninsured states
Affordable Care Act
• Potential synergies of $250 million over two years
• HMA’s adjusted EBITDA margin was 12-13% in 2013 vs. 15-16% in 2010, 2011 & 2012
• Key Markets of HMA transaction, including large presence in Florida, Tennessee, Oklahoma, and Mississippi. Building on network development.
HMA
• Proforma currently at 6x’s and expect to delever to mid 4x’s in 24 months
• Maintain disciplined approach to deploying capital
• ACA expected to contribute meaningfully to 2014 through 2017
Deleveraging
Low Valuation
5
• EV/EBITDA – Peers .7x differential or $54.07 stock price
• PE – Peers 9x differential or $62.48 stock price
Note: Calculations as of mid-May 2014
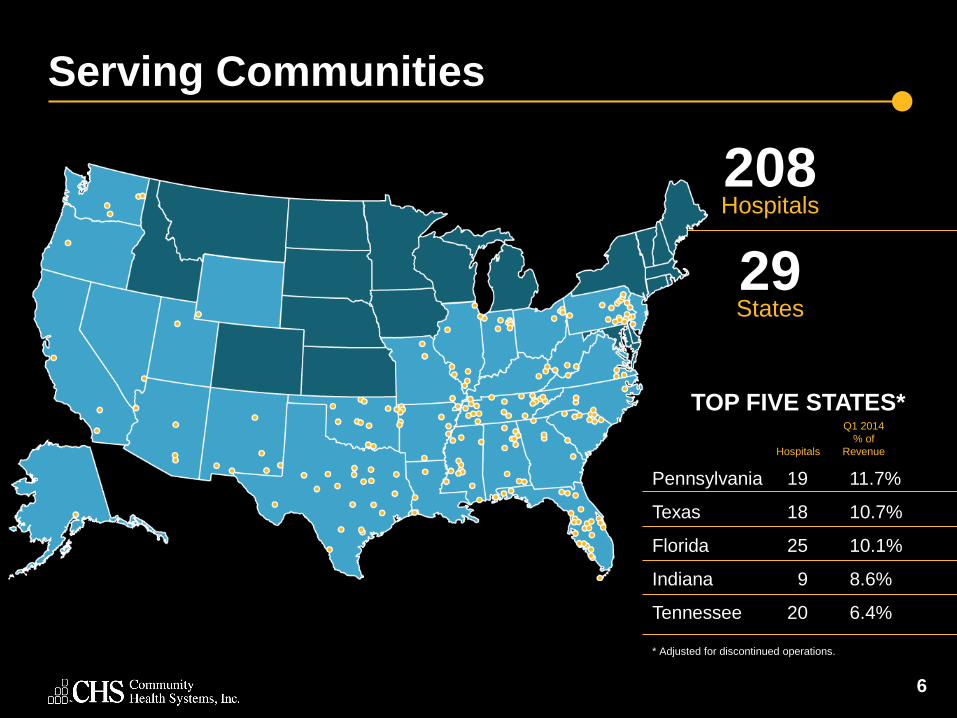
Serving Communities
6
208Hospitals
29States
Pennsylvania 19 11.7%
Texas 18 10.7%
Florida 25 10.1%
Indiana 9 8.6%
Tennessee 20 6.4%
Q1 2014
% of
Hospitals Revenue
TOP FIVE STATES*
* Adjusted for discontinued operations.
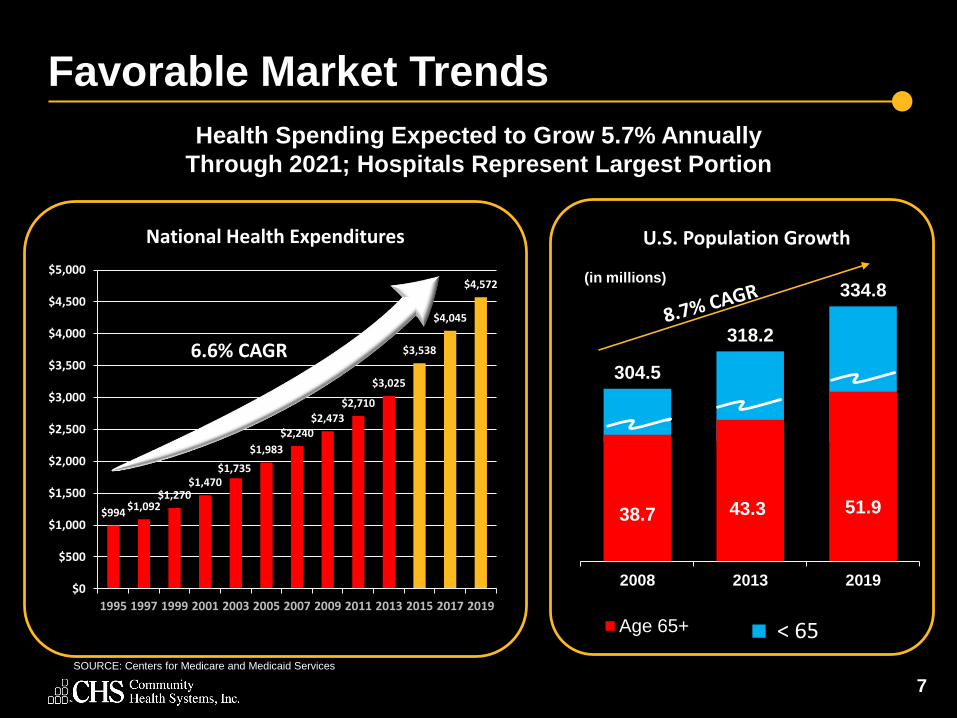
304.5
318.2
334.8
< 65
38.7 43.3 51.9
2008 2013 2019
Age 65+
Favorable Market Trends
7
$994$1,092
$1,270$1,470
$1,735
$1,983
$2,240$2,473
$2,710
$3,025
$3,538
$4,045
$4,572
$0
$500
$1,000
$1,500
$2,000
$2,500
$3,000
$3,500
$4,000
$4,500
$5,000
1995 1997 1999 2001 2003 2005 2007 2009 2011 2013 2015 2017 2019
Health Spending Expected to Grow 5.7% Annually
Through 2021; Hospitals Represent Largest Portion
National Health Expenditures U.S. Population Growth
SOURCE: Centers for Medicare and Medicaid Services
6.6% CAGR
(in millions)

Changing Healthcare Environment
Requires New Approaches
8
Movement to value-based payment
Challenging reimbursement
Narrow networks forming
More insured consumers through exchanges and Medicaid expansion

Well-Positioned for Healthcare Reform
Demonstrate Quality
Build Services and Infrastructure
Deliver Care More
Efficiently
Clinical Integration & Collaboration
26 million Newly Insured Patients by 2017*
* Congressional Budget Office: April 2014
9

Well-Positioned for Healthcare Reform
CHS and HMA are well positioned to participate as a network provider on
various health insurance exchanges
Hospitals located in 9 of top 10 highest uninsured states and 26 of top 30
highest uninsured states
195 of 197 hospitals participating
− Participating in the lowest cost HIX plan in our markets
− 90% in bronze plans
− 93% in silver plans
Most CHS exchange reimbursement arrangements reflect slight discount vs. commercial rates
2014 Healthcare Reform benefit to EBTIDA: 0.5% to 0.8% of net operating revenues; approx. $95 - $160 million
Our self-pay adjusted admissions are expected to decrease from approximately 8% into 4% in 2016.
10

Affordable Care Act
11
Admissions Q1 2013 Q1 2014 Change % Change
Self Pay
% of Admissions
3,783
6.6%
2,728
5.2%
-1,055 -28%
-140 BPS
Medicaid
% of Admissions
10,951
19.2%
11,415
21.7%
464 4%
+250 BPS
Adjusted Admissions Q1 2013 Q1 2014 Change % Change
Self Pay
% of Adjusted Admissions
8,102
7.1%
5,687
5.3%
-2,415 -30%
-180 BPS
Medicaid
% of Adjusted Admissions
23,413
20.6%
25,226
23.3%
1,813 8%
+270 BPS
Data from Same Store Expansion States
We have estimated an approximate 15% reduction in self-pay adjusted admissions in 2014.
Admissions and adjusted admissions from expansion states represent approximately 25% of the total.
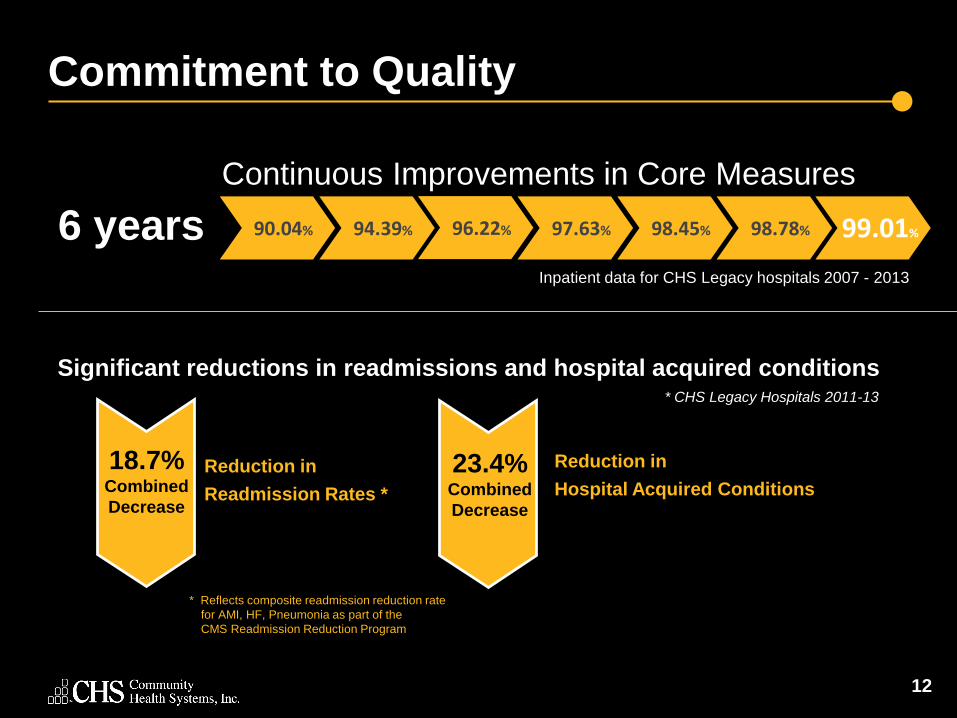
Commitment to Quality
Continuous Improvements in Core Measures
90.04%
Inpatient data for CHS Legacy hospitals 2007 - 2013
6 years 94.39% 96.22% 97.63% 98.45% 98.78% 99.01%
Reduction in
Readmission Rates *
18.7%Combined
Decrease
Reduction in
Hospital Acquired Conditions
23.4%Combined
Decrease
Significant reductions in readmissions and hospital acquired conditions* CHS Legacy Hospitals 2011-13
12
* Reflects composite readmission reduction rate
for AMI, HF, Pneumonia as part of the
CMS Readmission Reduction Program
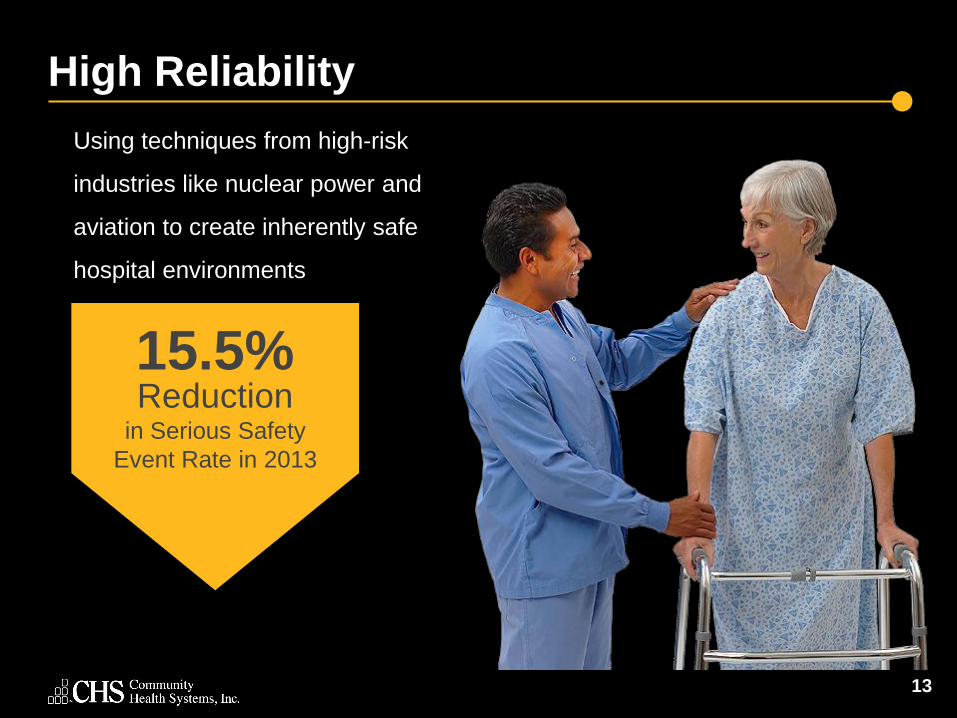
High Reliability
Using techniques from high-risk
industries like nuclear power and
aviation to create inherently safe
hospital environments
13
15.5% Reduction
in Serious Safety
Event Rate in 2013

Accreditations
14
Joint Commission Top Performers
on Key Quality Measures in 2013
93 hospitals
80 hospitalsCertified Chest Pain Centers
20+ hospitalsCertified Stroke Centers

CHS Network Development
15
Rockwood Health System• 2 hospitals
• 570 physicians
Commonwealth Health• 8 hospitals
• 890 physicians
Northwest Health Arkansas• 4 hospitals
• 500 physicians
Northwest Healthcare• 2 hospitals
• 540 physicians
Lutheran Health Network• 8 hospitals
• 1,420 physicians
Valley Care Health of Ohio• 3 hospitals
• 500 physicians
Central Mississippi• 6 hospitals
• 1,000 physicians* Active Medical Staff Physicians
Bayfront Health• 7 hospitals
• 1,100 physicians
Northern Alabama Network• 5 hospitals
• 880 physicians
Tennova Healthcare• 6 Hospitals
• 1,000 physicians
Central Oklahoma Healthcare• 7 hospitals
• 600 physicians

Lutheran Health Network
16
Physician
Offices/Clinics
8 Hospitals
Urgent Care/
Occupational Health
Outpatient
Clinics11
Ambulatory
Surgery Centers4
9
87

Regional Networks
• Building eleven major networks in key states:
- Incorporates over 30 percent of affiliated hospitals
- Supported by strong physician base and outpatient services
- Developing clinical destinations and centers of excellence
Growth Strategies
17
Service Line Approach
• Enhancing services with the
greatest growth potential:
– Orthopedics
– Neuroscience
– Cardiovascular Care
– Women’s Health
– Cancer Care
Access Points
• Maximizing existing physician practices
• Developing urgent care and retail
clinic partnerships
• Growing outpatient diagnostic and surgery
capacity
• Advancing tele-health strategies
Emergency Medicine
• Focusing on throughput and the
patient experience
• Expanding services and accreditations
• Building coordinated call and
transfer centers
• Developing EMS and other partnerships

1,679
1,852 1,864
2,125 2,141
418
613
0
500
1000
1500
2000
2500
2009 2010 2011 2012 2013 Q1 2013 Q1 2014
• Almost 10,000 physicians recruited over the past 5 years
• Over 1,100 mid-level licensed professionals employed at March 31, 2014
Physician Recruitment
18

Physician Satisfaction
19
I am satisfied with this hospital as a place to practice medicine.
I would recommend this hospital to my own family or friends.
I am satisfied with the quality of nursing care at this hospital.
I am satisfied with this hospital’s efforts to provide safe care to patients.
89%
94%
91%
92%
* CHS Legacy Hospitals 2013 Survey
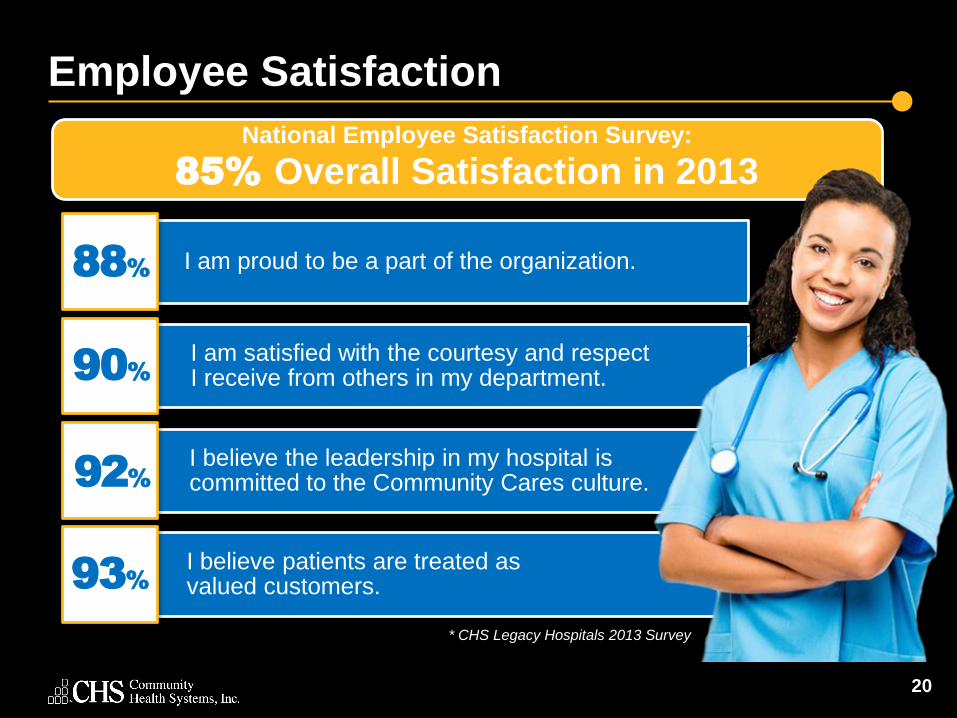
I am proud to be a part of the organization.
I am satisfied with the courtesy and respect I receive from others in my department.
I believe the leadership in my hospital iscommitted to the Community Cares culture.
I believe patients are treated as valued customers.
Employee Satisfaction
20
90%
92%
93%
National Employee Satisfaction Survey:
85% Overall Satisfaction in 2013
88%
* CHS Legacy Hospitals 2013 Survey

Standardized and Centralized
21
• Acquisitions
• Ancillary Services(Pharmacy, Laboratory, Imaging)
• Billing and Collections
• Compliance
• ER Management
• Executive Recruitment
• Facilities Management
• Financial Reporting
• Group Purchasing
• Health Information Management
• Home Care
• Human Resources/Recruiting
• Information Systems
• Legal Services
• Managed Care
• Physician Practice Management
• Physician Recruitment
• Quality and Clinical Support
• Revenue Strategies
• Strategy and Marketing
Shared Resources for Performance Improvement

Improve Efficiency to Lower Costs
• Consolidating some business office and other support functions to Shared Services Centers
• Standardized procurement processes
• Cost controls to manage operating expenses
Operational Efficiency
• Reducing clinical variation to improve quality and reduce costs
• Case management focus to reduce length of stay and improve clinical documentation
• Appropriate utilization of services and supplies
Clinical Efficiency
22

History of Successful Acquisitions
23
Focused on Network
Development, Clinical
Excellence and Value
to succeed in the Era of Healthcare
Reform
2014 - Future
71 Hospitals added in Health
Management AssociatesAcquisition
2014
Select Divestitures
Strategic Acquisitions
2008-2013
50+ Hospitals Added in Triad
Hospitals Acquisition
Larger, More Competitive
Markets
2007
Significant Growth through
Acquisitions
IPO on the NYSE in 2000
1985-2006
2007 Number of
Hospitals:1282013 Number
of Hospitals: 135Current Number
of Hospitals: 208
2006 Number of
Hospitals: 77

2013 Acquisition Performance –CHS Legacy
24
Trailing Actual 2013
2012 - 4 hospitals
2010 - 4 hospitals
2009 - 3 hospitals
2008 - 2 hospital
2007 - 2 hospitals & Triad
2006 - 7 hospitals
2005 - 4 hospitals
2004 - 2 hospitals
2003 - 10 hospitals
2002 - 6 hospitals
1997 - 2001 - 21 hospitals
Trailing Actual 2013
EBITDA **Net Revenue*
$1,718 (a)
$898
$10,308
$11,927
65 hospitals acquired since 1997, excluding Triad (approximately
50 hospitals)
15.7%
91.3%
* Revenues have not been restated to reflect the change in bad debt. ** See the Unaudited Supplemental Information contained in this presentation for a definition of EBITDA and a reconciliation of Adjusted EBITDA, as
defined, to our net cash provided by operating activities as derived directly from our consolidated financial statements for the three months ended March 31, 2014 and 2013 (Slides 34 and 35). For purposes of this presentation, EBITDA means Adjusted EBITDA.
(a) EBITDA includes corporate overhead.

2014 Acquisitions to Date
25
Health Management Associates
• 71 hospital facilities, 11,000 beds
Munroe Regional Medical Center
• 421 beds
Sharon Regional Medical Center
• 251 beds
January 27, 2014
April 1, 2014
April 1, 2014

HMA: A Strategic Acquisition
• Adds 71 hospital facilities to create the largest U.S. footprint
• Complementary geographic fit with hospitals in CHS states
• Expands and strengthens hospital and physician networks
• Leverages economies of scale and operating efficiencies
Unique Opportunity
• HMA’s adjusted EBITDA margin was 12-13% in 2013 vs. 15-16% in 2010, 2011 & 2012
• HMA lags CHS facilities in core measures and HCAHPs (patient satisfaction)
• Potential synergies of $250 million over two years
Improvement Potential
• CHS successfully integrated Triad - $5 billion revenue
• Improved Triad operating margin from 12% to 16%
• 94% of current CHS senior executives helped integrate Triad
Proven Ability to Integrate
26
Number of hospitals acquired since 1997: 115

Combined Company
CHS(1) HMA(1) Combined
Revenues $12,998 $5,793 $18,791
Adjusted EBITDA $1,841 $725 $2,566
Hospitals 135 71 206
Licensed Beds 20,175 11,065 31,245
Surgery Centers 35 17 52
Home Health Agencies 80 14 94
Employed Physicians 2,500 1,000 3,500
Employees 95,000 40,000 135,000
27
(1) Certain unaudited financial information has been previously disclosed in other public presentations.

Significant Synergies
28
• Overhead and Corporate
Service Reduction
• Supply Management
• Case Management
• Revenue Cycle Management
40 percent of synergy potential projected in the first year
$250 Million
of synergies
within 2 years

Revenue and EBITDA
11,906
13,029 12,998
3,274
4,195
5,053
5,836 5,793
0
2,000
4,000
6,000
8,000
10,000
12,000
14,000
2011 2012 2013 Q1 2013 Q1 2014
29
** See the Unaudited Supplemental Information contained in this presentation for a definition of EBITDA and a reconciliation of Adjusted EBITDA, as defined, to our net cash provided by operating activities as derived directly
from our consolidated financial statements for the three months ended March 31, 2014 and 2013 (Slides 34 and 35). For purposes of this presentation, EBITDA means Adjusted EBITDA.
* CAGR is calculated prior to the change in presentation of bad debt. Revenue and EBITDA for 2009 and prior years have not been adjusted for discontinued operations.
2007 amounts include adjustments for change in estimate taken in Q407. 2006 EBITDA excludes increase in allowance for doubtful accounts of $65 million taken in Q306.
1,837 1,880 1,841
495541
817
934
725
0
200
400
600
800
1,000
1,200
1,400
1,600
1,800
2,000
2011 2012 2013 Q1 2013 Q1 2014
Revenue EBITDA
CHSHMA
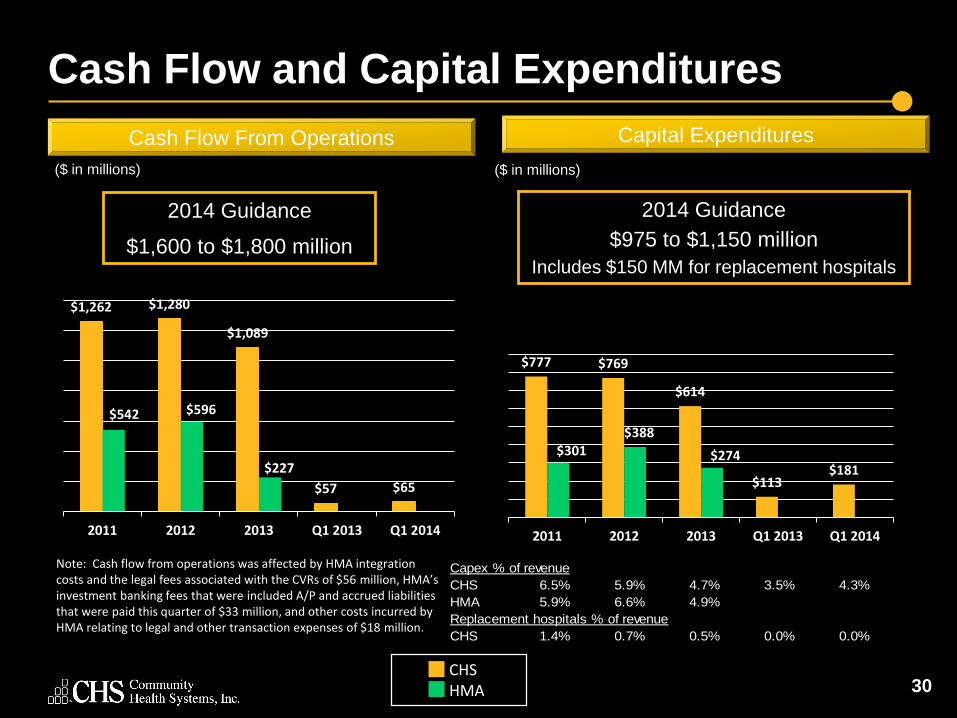
Cash Flow and Capital Expenditures
30
$1,262 $1,280
$1,089
$57 $65
$542 $596
$227
2011 2012 2013 Q1 2013 Q1 2014
$777 $769
$614
$113$181
$301$388
$274
2011 2012 2013 Q1 2013 Q1 2014
Capex % of revenue
CHS 6.5% 5.9% 4.7% 3.5% 4.3%
HMA 5.9% 6.6% 4.9%
Replacement hospitals % of revenue
CHS 1.4% 0.7% 0.5% 0.0% 0.0%
($ in millions)($ in millions)
2014 Guidance
$1,600 to $1,800 million
2014 Guidance
$975 to $1,150 million
Includes $150 MM for replacement hospitals
Capital ExpendituresCash Flow From Operations
Note: Cash flow from operations was affected by HMA integration costs and the legal fees associated with the CVRs of $56 million, HMA’s investment banking fees that were included A/P and accrued liabilities that were paid this quarter of $33 million, and other costs incurred by HMA relating to legal and other transaction expenses of $18 million.
CHSHMA

Quarterly Income Summary
31
(Amounts in millions, except margin and EPS)
Quarter Ended3-31-2014* 3-31-2013*
Net Revenue $ 4,195 $ 3,274
Adjusted EBITDA (2) ** $ 541 $ 495
EBITDA Margin ** 12.9% 15.1%
EPS from Continuing Operations Excluding Adjustments (1) $ 0.27 $ 0.89
Shares Outstanding (Weighted and Fully Diluted) 107 92
(1) The results for the three months ended March 31, 2014, include $0.30 per share of expenses related to acquisition and integration expenses from our acquisition of HMA; $0.02 per diluted
share of legal expenses related to HMA legal proceedings in existence prior to the HMA acquisition, which underlie the Contingent Value Rights (“CVR”) Agreement; $0.42 per diluted share of
expenses related to the loss from early extinguishment of debt; $0.24 per diluted share of expenses related to the accelerating amortization on software to be abandoned; $0.14 per diluted
share of expenses related to the impairment of software costs taken out of service; and a total after-tax loss of $0.19 per diluted share for discontinued operations. See slide 37 for
reconciliation.
(2) See slide 37 for reconciliation.
*2014 first quarter consolidated results include the HMA results from the acquisition date of January 27, 2014. The 2013 consolidated first quarter results represent last year’s performance for CHS
only. Same store results reflect the HMA performance from February 1st for both 2014 and 2013. Same store results include those hospitals that we have operated for a full year. CHS believes the
same store metrics are more meaningful since these metrics represent an equivalent comparison.
** See the Unaudited Supplemental Information contained in this presentation for a definition of EBITDA and a reconciliation of Adjusted EBITDA, as defined, to our net cash provided by operating
activities as derived directly from our consolidated financial statements for the three months ended March 31, 2014 and 2013 (Slides 34 and 35). For purposes of this presentation, EBITDA means
Adjusted EBITDA.

Financial Performance
32
$1,306$1,531
$2,039
$2,677$3,204
$3,738$4,180
$7,127
$10,840
$12,108
$11,092
$11,906
$13,029 $12,998
0
2,500
5,000
7,500
10,000
12,500
15,000
$251$291
$349$429
$494$573 $572
$827
$1,525
$1,671
$1,761$1,837
$1,978
$1,841
0
250
500
750
1,000
1,250
1,500
1,750
2,000
** See the Unaudited Supplemental Information contained in this presentation for a definition of EBITDA and a reconciliation of Adjusted EBITDA, as defined, to our net cash provided by operating activities as derived directly
from our consolidated financial statements for the three months ended March 31, 2014 and 2013 (Slides 34 and 35). For purposes of this presentation, EBITDA means Adjusted EBITDA.
* CAGR is calculated prior to the change in presentation of bad debt. Revenue and EBITDA for 2009 and prior years have not been adjusted for discontinued operations.
2007 amounts include adjustments for change in estimate taken in Q407. 2006 EBITDA excludes increase in allowance for doubtful accounts of $65 million taken in Q306.
Revenue EBITDA

Focused Strategy Delivers Results
33
Company
Growth
Quality
Improvements
Acquisition
Opportunities
ConsistentFinancial
Performance
Experienced
Management
Attractive
Markets
Geographic
Diversity
Proven
Formula

34
Unaudited Supplemental Information
EBITDA consists of net income attributable to Community Health Systems, Inc. before interest, income taxes,
and depreciation and amortization. Adjusted EBITDA is EBITDA adjusted to exclude discontinued
operations, gain/loss from early extinguishment of debt and net income attributable to noncontrolling
interests. The Company has from time to time sold noncontrolling interests in certain of its subsidiaries or
acquired subsidiaries with existing noncontrolling interest ownership positions. The Company believes that it
is useful to present adjusted EBITDA because it excludes the portion of EBITDA attributable to these third
party interests and clarifies for investors the Company’s portion of EBITDA generated by continuing
operations. The Company uses adjusted EBITDA as a measure of liquidity. The Company has included this
measure because it believes it provides investors with additional information about the Company’s ability to
incur and service debt and make capital expenditures. Adjusted EBITDA is the basis for a key component in
the determination of the Company’s compliance with some of the covenants under the Company’s senior
secured credit facility, as well as to determine the interest rate and commitment fee payable under the senior
secured credit facility.
Adjusted EBITDA is not a measurement of financial performance or liquidity under generally accepted
accounting principles. It should not be considered in isolation or as a substitute for net income, operating
income, cash flows from operating, investing or financing activities, or any other measure calculated in
accordance with generally accepted accounting principles. The items excluded from adjusted EBITDA are
significant components in understanding and evaluating financial performance and liquidity. This calculation
of adjusted EBITDA may not be comparable to similarly titled measures reported by other companies.

Unaudited Supplemental Information
35
The following table reconciles ADJUSTED EBITDA, as defined, to net cash provided by
operating activities as derived directly from the condensed consolidated financial statements
(in millions):
2014 2013
Adjusted EBITDA 485$ 495$
Interest expense, net (224) (156)
Provision for income taxes 57 (49)
Loss from operations of entities sold, net of taxes (2) (2)
Other non-cash expenses, net 17 11
Changes in operating assets and liabilities,
net of effects of acquisitions and divestitures (268) (242)
Net cash provided by operating activities 65$ 57$
Three Months Ended
March 31,

Other Financial Information

Q1 2014 Financial Results – Excluding Adjustments
37
Q1 2014 (1) Q1 2013
Net
Operating
Revenues
Adjusted
EBITDA **
EPS from
Cont.
Ops.
Net
Operating
Revenues
Adjusted
EBITDA **
EPS from
Cont.
Ops.
As Reported $ 4,195 $ 485 $ (1.04) $ 3,274 $ 495 $ 0.86
Discontinued Operations - - 0.19 - - 0.02
Loss on Early Extinguishment of Debt - - 0.42 - - 0.01
Amortization on Software to be Abandoned - - 0.24 - - -
Impairment of Long-Lived Assets - - 0.14 - - -
Subtotal Excluding Discontinued Operations,
Loss on Early Extinguishment of Debt,
Amortization on Software to be Abandoned,
and Impairment of Long-Lived Assets
$ 4,195 $ 485 $ (0.05) $ 3,274 $ 495 $ 0.89
Adjustments
HMA Acquisition and Integration Expenses - 53 0.30 - - -
CVR Legal Expense - 3 0.02 - - -
Subtotal of Above Adjustments - 56 0.32 - - -
Excluding All Adjustments, Discontinued
Operations, Loss on Early Extinguishment of Debt,
Amortization on Software to be Abandoned,
and Impairment of Long-Lived Assets
$ 4,195 $ 541 $ 0.27 $ 3,274 $ 495 $ 0.89
(1) The impact of the weather has not been factored into the calculation of net operating revenue, adjusted EBITDA, and EPS.
** See the Unaudited Supplemental Information contained in this presentation for a definition of EBITDA and a reconciliation of Adjusted EBITDA, as defined, to our net cash provided by
operating activities as derived directly from our consolidated financial statements for the three months ended March 31, 2014 and 2013 (Slides 34 and 35). For purposes of this
presentation, EBITDA means Adjusted EBITDA.