july 2021 transparency report
TRANSCRIPT

1
Transparency Report July 2021
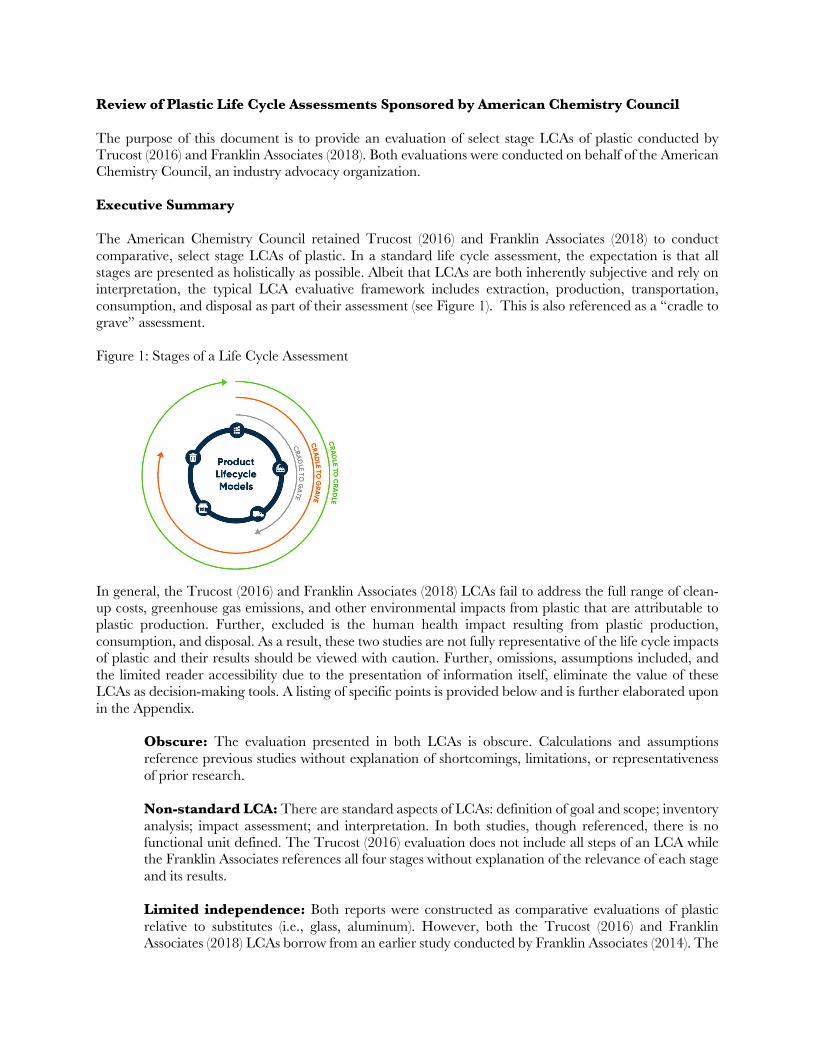
Review of Plastic Life Cycle Assessments Sponsored by American Chemistry Council The purpose of this document is to provide an evaluation of select stage LCAs of plastic conducted by Trucost (2016) and Franklin Associates (2018). Both evaluations were conducted on behalf of the American Chemistry Council, an industry advocacy organization. Executive Summary The American Chemistry Council retained Trucost (2016) and Franklin Associates (2018) to conduct comparative, select stage LCAs of plastic. In a standard life cycle assessment, the expectation is that all stages are presented as holistically as possible. Albeit that LCAs are both inherently subjective and rely on interpretation, the typical LCA evaluative framework includes extraction, production, transportation, consumption, and disposal as part of their assessment (see Figure 1). This is also referenced as a “cradle to grave” assessment. Figure 1: Stages of a Life Cycle Assessment
In general, the Trucost (2016) and Franklin Associates (2018) LCAs fail to address the full range of clean-up costs, greenhouse gas emissions, and other environmental impacts from plastic that are attributable to plastic production. Further, excluded is the human health impact resulting from plastic production, consumption, and disposal. As a result, these two studies are not fully representative of the life cycle impacts of plastic and their results should be viewed with caution. Further, omissions, assumptions included, and the limited reader accessibility due to the presentation of information itself, eliminate the value of these LCAs as decision-making tools. A listing of specific points is provided below and is further elaborated upon in the Appendix.
Obscure: The evaluation presented in both LCAs is obscure. Calculations and assumptions reference previous studies without explanation of shortcomings, limitations, or representativeness of prior research. Non-standard LCA: There are standard aspects of LCAs: definition of goal and scope; inventory analysis; impact assessment; and interpretation. In both studies, though referenced, there is no functional unit defined. The Trucost (2016) evaluation does not include all steps of an LCA while the Franklin Associates references all four stages without explanation of the relevance of each stage and its results. Limited independence: Both reports were constructed as comparative evaluations of plastic relative to substitutes (i.e., glass, aluminum). However, both the Trucost (2016) and Franklin Associates (2018) LCAs borrow from an earlier study conducted by Franklin Associates (2014). The

3
earlier study distorts the value of calculations made in the later evaluations, and the persistence of its use maintains the distortion.
Discounting of positive impact: When estimates of alternative products in lieu of plastic reveal a lower cost and impact, the discussion marginalizes and discounts these benefits. Opportunistic comparisons: Morbidity estimates from commercial fisheries and aquaculture are used in evaluating the impact of plastic on marine life. This comparison is opportunistic and, significantly understates the cost of plastic to ocean life compared with other studies. Faulty assumptions: Environmental impact of plastic is proxied by the opportunity cost of beach clean-ups, which is measured as the product of the average wage of beach clean-up participants and the average time attributed to beach clean-up participation. This understates the cost of plastic pollution. Methodological issues: Willingness to pay is used to assess the value of the environment but this method of valuation is dependent on informed respondents, otherwise the values collected is representative of information asymmetries.
Human health impacts: Human health impacts are excluded from the selected use of LCAs, across all stages. Non-representative data: The LCAs exclude the impact of methane and Halon 1301 and 1211, understating the greenhouse gas impact of the extraction stage of plastic production. Understated disposal impacts: The LCA’s assume the viability of recycling without accounting for any environmental cost or human health impact from recycling. Further, the assessment provides a positive value to incineration; again, without evaluation of the environmental and human health impact.

4
Appendix: Reference In 2018, Franklin Associates prepared a report for the Plastics Division of the American Chemistry Council (ACC). The report attempts to address life cycle impacts of plastic packaging. An earlier report, commissioned by the ACC in 2016, retained Trucost to assess plastics relative to sustainability: Plastics and Sustainability, A Valuation of Environmental Benefits, Costs, and Opportunities for Continuous Improvement. The discussion below provides an overview of these assessments highlighting specific areas that are in opposition with prevailing scientific opinion, as well as assumptions included in these evaluations that obscure the assessments conducted. Addressed are both the subjectivity inherent in LCA and the significance of omission in LCA with respect to the reliability of estimates. Further, given the limited to non-existent transparency in methodology for the calculations presented in both reports, this discussion surfaces the ease of masking marketing as scientific study. Limited independence In 2014, the United Nations Environment Programme (UNEP) released a report, Valuing Plastic. This report was produced by Trucost. The Trucost (2014) results are included in the Trucost (2016) and Franklin Associates (2018) evaluations, underestimating their assessments. In the 2014 Trucost report, the authors attempted to evaluate the cost of plastic to the environment but only included the impact of post-production consumer products, excluding plastic impacts resulting from the production process as well as portions of the product use-life:
As part of this report, only the natural capital cost of direct plastic use has been quantified. This means that the natural capital cost associated with plastic-in-supply-chain has been excluded, for lack of data. In addition, certain potentially significant impacts have been excluded, such as the impacts associated with microplastics. Science has yet to catch up for these impacts to be included these in the analysis (UNEP, 2014, 28).
The assessment of the natural cost of capital1 was then limited to plastic in use2. The cost was noted as being over “$75bn per year “(UNEP, 2014, 12). In their 2016 report, Trucost referenced the UNEP article but not their relationship to it and additionally used the same $75 billion figure without noting exclusions to state:
The total environmental cost of plastic use in the consumer goods sector is estimated at US$139 billion in 2015. This represents an increase from the $75 billion estimated in Valuing Plastic (UNEP, 2014) due to:
• Expansion of the analysis to include transport of plastic and alternative materials to consumer goods sector markets.
• Improvements in the valuation methodologies used to place a monetary value of environmental impacts.
• Growth in the consumer goods sector leading to higher estimated plastic demand. • Enhancements in the modeling of the ocean impacts of plastic waste based on more recent
research on this topic (Trucost, 2016, 22) This growth rate is inconsistent with growth estimates and present production and expansion plans. “As noted by the Center for International Environmental Law (2019(a)), “If plastic production and use grow as
1 The natural cost of capital is the product of the extraction of natural resources and the revenue attributed to their market value. 2 Plastic-in-use references plastic products at the consumer stage excluding plastic in the production process.

5
currently planned, by 2030, these emissions could reach 1.34 gigatons per year—equivalent to the emissions released by more than 295 new 500-megawatt coal-fired power plants. By 2050, the cumulation of these greenhouse gas emissions from plastic could reach over 56 gigatons—10–13 percent of the entire remaining carbon budget” (2). Discounting of positive impact Further, in their assessment, Trucost states that “the environmental cost per metric ton of plastic is marginally greater on average than the mix of alternatives – $1,654 per metric ton for plastic compared to $1,558 per metric ton for alternatives” (Trucost, 2016, 27). Trucost does then state that the “ocean cost of plastics [is] more than 2.6 times greater than that of alternatives – at $56 per metric ton of plastic compared to $21 for alternatives” (Trucost, 2016, 27) but notes “four metric tons of alternative materials are required on average to achieve the same function as one metric ton of plastic” (Trucost, 2016, 23). The discussion quickly deflects to the responsibility for ocean plastic noting “…the overwhelming majority of marine debris is estimated to originate in Asia, where the consumer goods sector is growing rapidly, and waste management systems are underdeveloped relative to North America and Europe. This finding is consistent with a recent study by the Ocean Conservancy” (Trucost, 2016, 27). The report referenced was developed by McKinsey & Co. in conjunction with the Ocean Conservancy and the authors noted, “Over half of land-based plastic-waste leakage originates in just five countries: China, Indonesia, the Philippines, Thailand, and Vietnam,” referred to in this report as the five focus countries for action. In concluding their report, Trucost (2016) states, “the ocean cost of alternatives is estimated to be 150% greater than this due to the sheer quantity of alternative materials needed to replace plastic. The greatest opportunities to reduce the ocean cost of plastic may lie in investments in waste collection systems in Asia” (Trucost, 2016, 40). McKinsey & Company and Ocean Conservancy noted in 2015, “The five countries noted have all succeeded at achieving significant growth in recent years, and they are at a stage of economic growth in which consumer demand for safe and disposable products is growing much more rapidly than local waste-management infrastructure. This creates a dual problem: the scale of collection and the retention of waste within the system itself. Our field research and interviews with public officials have also shown that these countries acknowledge the problem and are actively looking for collaborative solutions” (McKinsey & Company and Ocean Conservancy, 2015, 7). Following the publication of the McKinsey & Company and Ocean Conservancy report, in the past three years all five countries have instituted bans on single-use plastic. China instituted National Sword in 2017, significant impacting U.S. plastic disposal markets, and announced single use bans in January of 2020 (BBC News, 2020). Indonesia has single-use plastic bans in place, which are spreading throughout the country (Kahfl, 2019). The Philippines has banned single-use plastic in government offices and indications are the public opinion favors commercial bans (Hallare, 2021; Xinhua, 2021). Thailand started 2020 with a ban on single-use plastics (Chankaew, 2020) and Vietnam issued a government program to reduce ocean plastic (Nga, 2019). At the present time, the U.S. has no national policy related to plastic bans and instead has restrictions on instituting bans (Gibbens, 2019), while, as reported most recently by the New York Times, it is continuing to export plastic waste to poor countries (Tabuchi and Corkery, 2021). The latter relates to the U.S. non-adoption of the Basel Convention. With the focus on global reductions in greenhouse gas emissions in the energy sector, U.S.-based petrochemical industries have been focusing on plastics. “Since 2010, companies have invested more than $200 billion in 333 plastic and other chemical projects in the U.S.” (Gardiner, 2019). These actions leave no doubt of the trade-off of profits over known climate risk. Further and significant, the focus on profits has led to the obscuring of reality through incomplete information on the part of plastics industry and shifting blame to other countries while limiting responsibility domestically.

6
Opportunistic comparisons Trucost cites Mouat et al. (2010), FAO (2014) and Thompson et al. (2009) in deriving their estimates for the annual cost of plastic to fishing. However, in reviewing these articles it is unclear how these articles were incorporated into the stated estimates, “Trucost estimates total combined losses of $3.4 billion in 2015 due to marine debris (FAO, 2014). Considering that plastics comprise between 50% and 80% of marine waste, Trucost estimates that plastic debris is responsible for an annual revenue loss of $2.2 billion per annum for the fisheries and aquaculture sectors” (Trucost, 2016, 76). The value compares weakly to the World Trade Institute, who reports environmental damage to marine ecosystems is approximately $13 billion per year (Matsangou, 2018). Faulty assumptions Equally challenging is Trucost’s clean-up cost. “To calculate the clean-up cost imposed by plastics litter on beaches, Trucost based its model on the number of volunteers estimated globally by the Ocean Conservancy. In 2012, more than 560,000 volunteers helped clean beaches around the world. To put a value on the time spent by these volunteers on cleaning beaches, Trucost calculated the opportunity cost of their time, based on the global average income per capita per year and on the assumption that each volunteer dedicated half a day per year. As a result, the global opportunity cost of volunteers is $7.8 million” (2012 US dollars) (Trucost, 2016). Using a global average income equates to an opportunity cost of $14 per person based on 4 hours of wages or $3.50/hour. However, nearly 30% of the 560,000 volunteers recorded in the 2012 report were U.S. based highlighting a potential downward skew in the figures due to higher expected U.S. wages (Ocean Conservancy, 2013). Given that waste was catalogued and predominantly plastic, collection costs may significantly underrepresent the actual environmental impact cost of plastic debris. Methodological issues An additional cost, ecological impacts, which were documented in the Mouat et al. article cited by Trucost were proxied by a willingness to pay assessment. This type of evaluation is highly representative of a respondent’s understanding of an issue and references what they would be willing to pay to avoid what is being queried. In the case where there may be significant asymmetries in information, willingness to pay can provide an understanding of perception related to a resource but is a poor valuation tool (Burrows and Brown, 1992). Human health impacts Not included in the evaluation of plastic in either the Trucost (2016) or Franklin Associates (2018) studies is the human health impact related to ingestion of plastic leachate during the consumption life phase of the plastic. From a human health perspective, plastic has the potential to leach the chemicals that comprise it into the food and beverages it holds (Rustagi et al., 2011). The most well-known of these chemicals is bisphenol A (BPA), which was first used as a synthetic estrogen in the 1930s. During the plastic manufacturing process, not all BPA gets locked into chemical bonds; as a result, non-bonded, residual BPA can work itself free, especially when the plastic is heated, whether it’s a baby bottle in the dishwasher, a food container in the microwave, or a test tube being sterilized in an autoclave. Boa et al. (2020) found a relationship between higher BPA ingestion and higher risk for death. In recent years dozens of scientists around the globe have “linked BPA to myriad health effects in rodents: mammary and prostate cancer, genital defects in males, early onset of puberty in females, obesity and even behavior problems such as attention-deficit hyperactivity disorder” (Hinterthuer, 2008). Additional research is being conducted with respect to the connection between synthetic estrogens found in plastic and their impact on “the risks of heart attack, obesity and changes in the cardiovascular system” (Borrell, 2010). Other chemicals in plastic,
7
phthalates are often used as softeners for PVC plastic, to make plastic more flexible. Phthalates have been found to be harmful to human health. Bis(2-ethylhexyl) phthalate (DEHP), Benzyl butyl phthalate (BBP), Dibutyl phthalate (DBP), and Diisobutyl phthalate (DIBP) are classified as endocrine disruptors that are toxic to reproduction, which means that they may damage fertility or the unborn child (ECHA, n.d.). Both BPAs and phthalates are found in plastic containers available on the market today. New research is being conducted on the health impacts of single-use plastic in medical procedures. Specifically, phthalate chemicals that are used in medical devices have been associated with “alterations in autonomic regulation, heart rate variability, and cardiovascular reactivity” (James, 2017). Researchers caution that plastic use is not without an impact and may affect a patient’s ability to recover from medical processes (American Heart Association News, 2019). In addition to the health impacts related to plastic in-use, there are known issues specific to the health consequences of plastic production, which remain invisible to many consumers but are known to the plastics industry. “Many of these plastics manufacturing facilities are located in low-wealth, working class and minority communities lacking the resources to confront industry and defend themselves against unhealthy emissions and avoidable accidents” (Phillips, 2019). These are environmental justice issues that trace their origin to the inequity established by slavery and the persistence of poverty. The most significant geographic stretch of environmental injustice is referenced as “Cancer Alley”, which is located across Louisiana through Mississippi. “According to data from the Environmental Protection Agency's National Air Toxic Assessment map, the cancer risks in predominantly African American Districts in St James Parish [Louisiana] could be at 104 and 105 cases per million, while those threats in predominantly white districts range from 60 to 75 per million” (United Nations News, 2021). In Louisiana a recent Tulane Environmental Law Clinic study noted “our analysis provides compelling evidence that toxic air pollution is a significant driver of cancer rates in Louisiana. There is no evidence that lifestyle factors contributed to this finding” (Terrell & St. Julien, 2021, 16) Further, the report concluded, “We found that this geographic pattern is partly explained by the racial composition, poverty status, and the burden of toxic air pollution in a given community (i.e., census tract). Our analysis contributes to the growing body of evidence that Black and Brown communities in Louisiana are overburdened with the negative effects of toxic air pollution from petrochemical facilities and other sources” (Terrell & St. Julien, 2021, 16). Related to environmental justice, health and environmental issues are exacerbated by plastic industry non-compliance with Federal laws. In an evaluation of the Texas plastic industry, a 2019 Environmental Integrity Project report highlighted
“Nearly two thirds of the plastics plants examined for this report (57 of the 90) violated air pollution control laws and were subject to enforcement actions by the Texas Commission on Environmental Quality (TCEQ) or EPA over the last five years (a total of 222 violations). But that’s just the tip of the iceberg. State records show that these 90 plants were responsible for far more unauthorized pollution releases that went unpenalized by the state. This is primarily due to a loophole that allows companies to argue they should not be penalized for much of the air pollution they release because it is attributable to malfunctions or unplanned maintenance (what regulators call “upset” emission events). From 2015 to 2017, Texas imposed penalties on only 7 percent (57 out of 872) of these unpermitted pollution releases from the Houston area plastics plants, according to state records. These 872 incidents released 11 million pounds of air pollution. However, the 57 fines totaled only $665,172 – which means a penalty of only about 6 cents per pound of illegal pollution” (Phillips. 2019, 3).

8
Non-representative data
Omitted in the Franklin Associates evaluation of raw materials is methane. Specifically,
• methane, bromotrifluoro (a.k.a. bromochlorodifluoromethane or Halon 1301. • methane, bromochlorodifluoromethane (a.k.a. bromochlorodifluoromethane or Halon 1211)
(Franklin Associates, 2018, 33). The exclusion of these emissions significantly underestimates the greenhouse gas impact of the extraction process related to the production of plastic. Hydraulic fracking used in the production of natural gas impacts the amount of methane emitted as an outcome of extraction and production process. In addition, there is an issue related to the water used and contaminated during the process of fracking. Not only is this not potable but discharge affects groundwater and subsequent drinking water quality (USGS, n.d.).
Further there is an issue with the data included in the Franklin report in the time range specific to evaluating petroleum and natural gas impact. Data used in the evaluation are from “from late 1990s to 2011” (Franklin Associates, 2018, 34). The report highlights the emissions of substitutes to plastic but references plastic comparisons from the perspective of relative “higher” or “lower”. The challenge in estimating emissions is also related to the process of plastic manufacturing and the compilation of data. “Because the petrochemical industry has a high degree of flexibility in the feedstock it consumes and because [the Energy Information Agency] EIA does not collect detailed data on this aspect of industrial consumption, it is not possible for EIA to identify the actual amounts and origin of the materials used as inputs by industry to manufacture plastics” (EIA, 2020). However, it is possible to determine an attributable range.
According to the Center for International Environmental Law (2019(a)), in the United States in 2015, emissions from fossil fuel (largely fracked gas) extraction and production attributed to plastic production were at least 9.5–10.5 million metric tons of CO2 equivalents (CO2e) per year. “If growth in plastic production and incineration continue as predicted, cumulative greenhouse gas emissions by 2050 will be over 56 gigatons CO2e, or between 10-13 percent of the total remaining carbon budget” (Center for International Environmental Law, 2019(a)). “The total life cycle GHG emissions for fossil fuel-based, corn-based and sugarcane-based plastics are on average 4.1, 3.5 and 3.0 kgCO2e per kg plastic in 2050, respectively, under the current energy mix” (Zheng and Suh, 2019). “Plastic refining is among the most greenhouse-gas-intensive industries in the manufacturing sector—and the fastest growing. The manufacture of plastic is both energy intense and emissions intensive, producing significant emissions through the cracking of alkanes into olefins, the polymerization and plasticization of olefins into plastic resins, and other chemical refining processes. In 2015, 24 ethylene facilities in the U.S produced 17.5 million metric tons of CO2e, emitting as much CO2 as 3.8 million passenger vehicles. Globally in 2015, emissions from cracking to produce ethylene were 184.3–213.0 million metric tons of CO2e, as much as 45 million passenger vehicles driven for one year. These emissions are rising rapidly: a new Shell ethane cracker being constructed in Pennsylvania could emit up to 2.25 million tons of CO2e each year; a new ethylene plant at ExxonMobil’s Baytown, Texas, refinery could release up to 1.4 million tons. Annual emissions from just these two new facilities would be equal to adding almost 800,000 new cars to the road” (Center for International Environmental Law, 2019 (a), 2). From a social cost perspective, at a cost of $51 per metric ton of CO2e (Chemnick, 2021) the cost equivalent would equal $9.4 trillion dollars (significantly higher than the $139 billion estimates by Trucost).

9
Understated disposal impacts Specific to end of life and disposal impacts, Franklin Associates provide credit for recycling rates that may exceed recycling content in new products and make no adjustments related to further recycling capabilities after the first recycling cycle. The estimates do not consider a significant aspect of recycling, as noted in a recent report by Pew and SystemIQ (2020), “Design and packaging choices do not account for local infrastructure” (17). Additionally, no assessment is included related to the environmental impact of increased use of plastic in the environment as a result of recycling. Further, positive benefits are incorporated from waste to energy incineration of plastic, but the hazards related to gases emitted on both human and environmental health are excluded as are emerging issues related to plastic found in precipitation (Christensen, 2019) and in air (Gasper el al., 2018). “Burning waste can release thousands of pollutants. Incinerator workers and people living near facilities are particularly at risk to exposures. Landfilling has a much lower climate impact than incineration. But the placement of landfills can be associated with similar environmental injustices. Recycling is a different beast with an entirely different set of problems. Compared to the low costs of virgin materials, recycled plastics are high cost with low commercial value. This makes recycling profitable only rarely, so it requires considerable government subsidies. Research from the Ellen MacArthur Foundation suggests that only 2% of plastics are recycled into products with the same function. Another 8% are “downcycled” to something of lower quality. The rest is landfilled, leaked into the environment, or incinerated (Bauman, 2019).
U.S. emissions from plastic incineration in 2015 are estimated at 5.9 million metric tons of CO2e. For plastic packaging, which represents 40 percent of plastic demand, global emissions from incineration of this particular type of plastic waste totaled 16 million metric tons of CO2e in 2015. This estimate does not account for 32 percent of plastic packaging waste that is known to remain unmanaged, open burning of plastic or incineration that occurs without any energy recovery, or practices that are widespread and difficult to quantify (Center for International Environmental Law, 2019 (b)). “The climate impact isn’t the only concern. Incineration facilities are disproportionately built near communities of color and low-income populations” (Bauman, 2019).
“After plastics have been used, people may dump them into the environment, sometimes purposefully and other times accidentally. Even if plastics go to a landfill, some are light enough to blow in the wind and enter waterways. Plastics can break down into smaller pieces, called microplastics, through biodegradation or exposure to the sun, heat, or water. These microplastics scatter across the globe, even to the depths of the ocean. Toxic chemicals can bind to microplastics and create poison pills that aquatic animals eat. Plastics also harm animals through entanglement and ingestion at all levels of the food chain. Sarah-Jeanne Royer at Scripps Institution of Oceanography found that low-density polyethylene – one of the most common types of plastics found in the ocean – releases greenhouse gases as it breaks down in the environment” (Isola, 2018).
But beyond the direct emissions from plastics in the environment, there’s another issue with microplastics. Historically, the ocean has sequestered 30-50% of carbon dioxide emissions from human-related activities. However, evidence suggests that plankton are ingesting ever-greater quantities of microplastics. Researchers at the Ocean University of China discovered that microplastics reduced the growth of microalgae and the efficiency of photosynthesis. There is an emerging risk that producing more microplastics could degrade plankton’s ability to remove carbon dioxide from the atmosphere (Zhang, 2017).

10
References American Heart Association News. (2019). Chemical widely used in medical plastic alters heart function in lab tests. Retrieved from https://www.heart.org/en/news/2019/07/31/chemical-widely-used-in-medical-plastic-alters-heart-function-in-lab-tests Bauman, B. (2019 August 20). How plastics contribute to climate change. Retrieved from https://yaleclimateconnections.org/2019/08/how-plastics-contribute-to-climate-change/ BBC News. (2020 January 20). Single-use plastic: China to ban bags and other items. Retrieved from https://www.bbc.com/news/world-asia-china-51171491 Bao, W., Liu, B., Rong, S., Dai, S. Y., Trasande, L. & Lehmler, H. (2020). Association Between Bisphenol A Exposure and Risk of All-Cause and Cause-Specific Mortality in US Adults. JAMA Network Open, 3(8): e2011620. Borrell, B. (2010). Bisphenol A link to heart disease confirmed. Retrieved from https://www.nature.com/news/2010/100113/full/news.2010.7.html Burrows, C. & Brown, K. (1992). Are any numbers better than no numbers? The sorry state of willingness-to-pay and some major methodological shortcomings. Australian Health Review. 15(2),135-44. Center for International Environmental Law. (2019(a)). Plastic and climate: The hidden costs of a plastic planet. Retrieved from https://www.ciel.org/wp-content/uploads/2019/05/Plastic-and-Climate-FINAL-2019.pdf Center for International Environmental Law. (2019(b)). Sweeping New Report on Global Environmental Impact of Plastics Reveals Severe Damage to Climate. Retrieved from https://www.ciel.org/news/plasticandclimate/ Chankaew, P. (2020 January 1). Thailand kicks off 2020 with plastic bag ban. Retrieved from https://www.reuters.com/article/us-thailand-environment-plastic/thailand-kicks-off-2020-with-plastic-bag-ban-idUSKBN1Z01TR Chemnick, J. (2021 March 1). Cost of carbon pollution pegged at $51 a ton. Retrieved from https://www.scientificamerican.com/article/cost-of-carbon-pollution-pegged-at-51-a-ton/#:~:text=Contributing%20to%20climate%20change%20is,to%20about%20%2451%20per%20ton. Christensen, J. (2019). ‘It is raining plastic’: Scientists find colorful microplastic in rain. Retrieved from https://www.cnn.com/2019/08/14/health/plastic-rain-colorado-trnd/index.html ECHA. (n.d.). Chemicals in plastic products. Retrieved from https://chemicalsinourlife.echa.europa.eu/chemicals-in-plastic-products. Energy Information Agency. (2020). How much oil is used to make plastic? Retrieved from https://www.eia.gov/tools/faqs/faq.php?id=34&t=6 FAO. (2014). AQUASTAT database. Retrieved from: http://www.fao.org/nr/water/aquastat/data/query/index. html?lang=en

11
Franklin Associates. (2014). Impact of Plastics Packaging on Life Cycle Energy Consumption and Greenhouse Gas Emissions in the United States and Canada. Retrieved from https://plastics.americanchemistry.com/Education-Resources/Publications/Impact-of-Plastics-Packaging.pdf Franklin Associates. (2018). Life Cycle Impacts of Plastics Packaging Compared to Substitutes in the United States and Canada. Retrieved from https://plastics.americanchemistry.com/Reports-and-Publications/LCA-of-Plastic-Packaging-Compared-to-Substitutes.pdf Gardiner, B. (2019 December 19). The Plastics Pipeline: A Surge of New Production Is on the Way. Yale Environment 360. Retrieved from https://e360.yale.edu/features/the-plastics-pipeline-a-surge-of-new-production-is-on-the-way Gasperi, J., Wright, S. L., Dris, R., Collard, F., Mandin, C., Guerrouache, M., Langlois, V., Kelly, F. J. & Tassin, B. (2018). Microplastics in air: Are we breathing it in? Science & Health, 1, 1-5, Geyer, R., Jambeck, J. R. & Law, K. L. (2017). Production, use, and fate of all plastics ever made. Science Advances. 3, e1700782. Gibbens, S. (2019 August 15). See the complicated landscape of plastic bans in the U.S. Retrieved from https://www.nationalgeographic.com/environment/article/map-shows-the-complicated-landscape-of-plastic-bans Hallare, K. (2021 February 13). QC to resume ban on plastic bags, single-use plastics beginning March 1. Retrieved from: https://newsinfo.inquirer.net/1395399/qc-to-resume-ban-on-plastic-bags-single-use-plastics-on-march-1#ixzz6qH22Ht1b Hinterthuer, A. (2008). Safety Dance over Plastic. Scientific American, 299(3), 108-111. Isola, M. (2018 November 7). Plastic contributes to global warming as it breaks down, researchers find. Retrieved from https://yaleclimateconnections.org/2018/11/common-plastics-emit-global-warming-pollution/ Jaimes, R., 3rd, Swiercz, A., Sherman, M., Muselimyan, N., Marvar, P. J., & Posnack, N. G. (2017). Plastics and cardiovascular health: phthalates may disrupt heart rate variability and cardiovascular reactivity. American journal of physiology. Heart and circulatory physiology, 313(5). Kahfl, K. (2020 January 7). Jakarta to ban single-use plastic bags by June. Retrieved from https://www.thejakartapost.com/news/2020/01/07/jakarta-to-ban-single-use-plastic-bags-by-june.html Matsangou, E. (2018 July 2). Counting the cost of plastic pollution. Retrieved from https://www.worldfinance.com/markets/counting-the-cost-of-plastic-pollution McKinsey & Company and Ocean Conservancy. (2015). Stemming the tide Land based strategies for a plastic free ocean. Retrieved from https://www.mckinsey.com/~/media/McKinsey/Business%20Functions/Sustainability/Our%20Insights/Stemming%20the%20tide/Stemming%20the%20tide%20Land%20based%20strategies%20for%20a%20plastic%20free%20ocean.pdf

12
Mouat, T., Lopez-Lozano, R. & Bateson, H. (2010). Economic impacts of Marine litter, 117. Retrieved from http://www.kimointernational.org/wp/wp-content/uploads/2017/09/KIMO_Economic-Impacts-of-Marine-Litter.pdf Nga, M. (2019 December 21). Vietnam breaks plastic stranglehold in 2019. Retrieved from https://e.vnexpress.net/news/news/vietnam-breaks-plastic-stranglehold-in-2019-4029170.html Ocean Conservancy. (2013). Working for clean beaches and clean water, 2013 Report. Retrieved from https://oceanconservancy.org/wp-content/uploads/2017/04/2013-Ocean-Conservancy-ICC-Report.pdf Pew Charitable Trusts and SystemIQ. (2020). Breaking the Plastic Wave: A Comprehensive Assessment of Pathways Towards Stopping Ocean Plastic Pollution. Retrieved from https://oursharedseas.com/wp-content/uploads/2020/10/BreakingThePlasticWave_MainReport.pdf Phillips, A. (2019). Plastic pollution on the rise. Environmental Integrity Project. Retrieved from https://environmentalintegrity.org/wp-content/uploads/2019/09/Plastics-Pollution-on-the-Rise-report-final.pdf Rustagi, N., Pradhan, S. K., & Singh, R. (2011). Public health impact of plastics: An overview. Indian journal of occupational and environmental medicine, 15(3), 100–103. Terrell, K. A. & St. Julien, G. (2021). Toxic Air Pollution and Cancer in Louisiana. Retrieved from https://law.tulane.edu/sites/law.tulane.edu/files/u1625/LTR%20Cancer%20Rates%20v%20Pollution-Related%20Risk%202021-6-21%20FINAL_0.pdf Tetu, S.G., Sarker, I., & Schrameyer, V. (2019). Plastic leachates impair growth and oxygen production in Prochlorococcus, the ocean’s most abundant photosynthetic bacteria. Communications Biology 2, 184. https://doi.org/10.1038/s42003-019-0410-x Thompson, R. C., Moore, C. J., Vom Saal, F. S. & Swan, S. H. (2009). Plastics, the environment, and human health: current consensus and future trends. Philosophical Transactions of the Royal Society B: Biological Sciences, 364 (1526), 2153—2166. Trucost. (2016). Plastics and Sustainability. Retrieved from https://plastics.americanchemistry.com/Plastics-and-Sustainability.pdf United Nations Environment Programme. (2014). Valuing Plastic. Retrieved from https://wedocs.unep.org/bitstream/handle/20.500.11822/10970/wbrs16_4_valuing_plastic_new.pdf?sequence=1&%3BisAllowed= United Nations News. (2021 March 2). Human Rights. Retrieved from https://news.un.org/en/story/2021/03/1086172 USGD. (n.d.). What environmental issues are associated with hydraulic fracturing? Retrieved from https://www.usgs.gov/faqs/what-environmental-issues-are-associated-hydraulic-fracturing?qt-news_science_products=0#qt-news_science_products Xinhua. (2021 March 26). Philippines bans single-use plastics in government offices. Retrieved from http://www.xinhuanet.com/english/2020-02/26/c_138819579.htm#:~:text=26%20(Xinhua)%20%2D%2D%20The%20Philippines,and%20forks

13
%2C%20in%20government%20offices.&text=%22Following%20this%20trajectory%20of%20plastic,oceans%20than%20there%20are%20fish.%22 Zhang, C., Chen, X., Wang, J. & Tan, L. (2017). Toxic effects of microplastic on marine microalgae Skeletonema costatum: Interactions between microplastic and algae, Environmental Pollution, 220(Part B). Zheng, J. & Suh, S. (2019). Strategies to reduce the global carbon footprint of plastics. Nature Climate Change. 9, 374–378.