july 2013 final draft - city of greater bendigo · ref: m13038 final draft p a g e 1 | 74 hill pda...
TRANSCRIPT
Ref: M13038 FINAL DRAFT P a g e 1 | 74 Hill PDA
Hill PDA
Bendigo Hospital Precinct Structure Plan
Technical Assessment:
Economics and Land Use
PREPARED FOR
City of Greater Bendigo
July 2013
FINAL DRAFT
Hill PDA

ABN 52 003 963 755
Sydney
3rd
Floor 234 George Street Sydney
GPO Box 2748 Sydney NSW 2001
t. +61 2 9252 8777
f. +61 2 9252 6077
Melbourne
Level 9, 365 Little Collins St Melbourne
GPO Box 3424 Melbourne VIC 3001
t. +61 3 9642 2449
f. +61 3 9642 2459
www.hillpda.com
Liability limited by a scheme approved under the Professional Standards Legislation
Bendigo Hospital Precinct Structure Plan
Ref: M13038 FINAL DRAFT P a g e 3 | 74 Hill PDA
QUALITY ASSURANCE REPORT CONTACTS:
FERGUS STEWART
B. Urban Planning & Development (MELB)
Senior Consultant, Planning & Property Economics
BEN PEACH
B. Applied Science & Valuation (Hons) (RMIT) PMA PI
Consultant, Property Economics
[email protected] QUALITY CONTROL: This document is for discussion purposes only unless signed and dated by a Principal of Hill PDA. DRAFT Dated
VICTORIA TOMPSETT
B. Land Econ./B. Arts International Studies
Principal, Property Economics
REPORT DETAILS: Job Ref No: M13038 Version: FINAL DRAFT Date Printed: 3/07/2013 File Name: M13038 - Bendigo PSP - Hill PDA Technical Assessment FINAL DRAFT 260613
Bendigo Hospital Precinct Structure Plan
Ref: M13038 FINAL DRAFT P a g e 4 | 74 Hill PDA
CONTENTS
1. INTRODUCTION ............................................................................................................................................ 7
1.1 Project Brief ................................................................................................................................... 7
1.1 Background Documentation and Consultation .............................................................................. 7
2. PROJECT STUDY AREA ............................................................................................................................... 9
2.1 Bendigo Hospital Precinct ............................................................................................................. 9
2.2 Surrounding Land Uses ............................................................................................................... 14
3. CITY OF BENDIGO ECONOMIC CONTEXT ..................................................................................................... 20
3.1 Key Industry Sectors in Bendigo ................................................................................................. 20
3.2 Key Institutions and Businesses in Bendigo ................................................................................ 21
3.3 Tourism in Bendigo...................................................................................................................... 22
3.4 Significant Projects ...................................................................................................................... 22
4. SOCIO-ECONOMIC AND INDUSTRY PROFILING ............................................................................................. 23
4.2 Age Distribution and Population Growth ...................................................................................... 24
4.3 Household and Dwelling Characteristics ..................................................................................... 26
4.4 Employment and Workforce Profile ............................................................................................. 28
5. RESIDENTIAL AND ACCOMMODATION MARKET ........................................................................................... 31
5.1 Residential Dwelling Development Trends .................................................................................. 31
5.2 Student Housing Development Trends ........................................................................................ 39
5.3 Short-Term Accommodation Development Trends ..................................................................... 41
5.4 Implications ................................................................................................................................. 43
6. RETAIL AND COMMERCIAL MARKET ............................................................................................................ 46
6.1 Retail and Commercial Development Trends .............................................................................. 46
6.2 Retail Market ............................................................................................................................... 50
6.3 Commercial Market ..................................................................................................................... 63
6.4 Implications ................................................................................................................................. 66
7. IMPLICATIONS FOR THE STUDY AREA ......................................................................................................... 67
Appendix 1 - Commercial Market Evidence
Appendix 2 - Residential Market Evidence
LIST OF FIGURES
Figure 1 - Bendigo Hospital Precinct Map ......................................................................................................... 11
Figure 2 - Major Tenants in the Study Area ....................................................................................................... 15
Figure 3 - Bendigo Hospital Precinct Structure Plan Study Area Map ................................................................ 17
Figure 4 - Bendigo Hospital Precinct Structure Plan Land Use Map .................................................................. 18
Figure 5 - Bendigo Precinct Structure Plan Existing Zoning Map ....................................................................... 19
Figure 6 - Central SLA Context ......................................................................................................................... 23
Figure 7 - Median Age (2001-2011) .................................................................................................................. 24
Figure 8 - Distribution of Population by Age Cohort in the Central SLA (2001 to 2031) ..................................... 26
Bendigo Hospital Precinct Structure Plan
Ref: M13038 FINAL DRAFT P a g e 5 | 74 Hill PDA
Figure 9 - Median Weekly Household Income (2001 to 2011) ........................................................................... 28
Figure 10 - Residential Building Approvals by Dwelling Type (1996-2012) ........................................................ 31
Figure 11 - Average Residential Lots Constructed by Small Area Per Annum (2006-2012) ............................... 32
Figure 12 - Bendigo Core Development Areas .................................................................................................. 33
Figure 13 - Recent Townhouse Development in the Study Area ....................................................................... 34
Figure 14 - Vacant and Subdivided Lots in the Study Area ................................................................................ 35
Figure 15 - Sample of Newly Developed Townhouses and Villas in Bendigo (April 2013) ................................. 37
Figure 16 - Average Forecast Dwelling Growth and Change by Period (2011-2031) ......................................... 39
Figure 17 - Location of Accommodation Providers in Bendigo (2013) ............................................................... 41
Figure 18 - City of Greater Bendigo: Resident Main Trade Areas ...................................................................... 52
Figure 19 - Examples of Bendigo Retail and Bulky Goods Sales Transactions .................................................. 63
Figure 20 - 74 Queen Street, Bendigo ............................................................................................................... 64
Figure 21 - Examples of Bendigo Office Space Sales Transactions .................................................................. 64
LIST OF TABLES
Table 1 - Study Area Population and Age Distribution ......................................................................................... 9
Table 2 - Key Economic Drivers and Significant Local Industries in the City of Greater Bendigo (2012) ............ 20
Table 3 - Estimated Resident Population Change by Area (2001-2011) ............................................................ 24
Table 4 - Estimated Resident Population in the Central SLA (2001 to 2031) ..................................................... 25
Table 5 - Dwelling Change by Area (2001-2011) ............................................................................................... 26
Table 6 - Family and Dwelling Type and Household Structure (2001-2011) ...................................................... 27
Table 7 - Central SLA Industry of Employment (2001-2011) ............................................................................. 29
Table 8 - City of Greater Bendigo: Health Care & Social Assistance Workers (2011) ........................................ 30
Table 9 - City of Greater Bendigo Residential Development Pipeline in Inner Bendigo (2013) .......................... 36
Table 10 - City of Greater Bendigo Comparison of Median House and Unit Values (2009-2013)....................... 36
Table 11 - City of Greater Bendigo Residential Rental Comparison (September Qtr 2013) ............................... 38
Table 12 - Forecast Residential Dwelling Change to 2031 ................................................................................ 38
Table 13 - Hotels, Motels and Serviced Apartments* in the City of Greater Bendigo ......................................... 42
Table 14 - City of Greater Bendigo Activity Centre Hierarchy ............................................................................ 47
Table 15 - Total Shopfront Floorspace Supply in the City of Greater Bendigo (sqm GLA) ................................. 47
Table 16 - City of Greater Bendigo: Main Trade Area Population Growth (2013-2031) ...................................... 53
Table 17 - City of Greater Bendigo Primary Trade Area Resident Expenditure to 2031 ($m) ............................. 54
Table 18 - City of Greater Bendigo Secondary Trade Area Resident Expenditure to 2031 ($m) ........................ 54
Table 19 - Retail Spend Per Capita Comparison (2013) .................................................................................... 54
Table 20 - City of Greater Bendigo Tertiary Trade Area Resident Expenditure to 2031 ($m) ............................. 55
Table 21 - City of Greater Bendigo Assumed Capture Rates (2013-2031) ........................................................ 56
Table 22 - Capture of MTA Resident Retail Spend by the City of Greater Bendigo to 2031 ($m) ....................... 56

Bendigo Hospital Precinct Structure Plan
Ref: M13038 FINAL DRAFT P a g e 6 | 74 Hill PDA
Table 23 - Bendigo Loddon Region Tourism and Visitor Data* (2011) ............................................................... 57
Table 24 - Bendigo Loddon Region Tourism Expenditure by Type (2010/11) .................................................... 57
Table 25 - Bendigo Loddon Tourism Expenditure in 2013 ($m) ......................................................................... 58
Table 26 - Capture of Tourism Retail Spend by the City of Greater Bendigo to 2031 ($m) ................................ 58
Table 27 - Total Forecast Retail Expenditure in the City of Greater Bendigo to 2031 ($m) ................................ 59
Table 28 - Demand for Retail Floorspace in the City of Greater Bendigo to 2031 (sqm GLA) ............................ 59
Table 29 - Distribution of Floorspace Demand in the City of Greater Bendigo to 2004-2021 (sqm GLA)............ 61
Table 30 - Distribution of Floorspace Demand in the City of Greater Bendigo to 2031 (sqm GLA) .................... 61
Table 31 - Issues and Opportunities for the Study Area .................................................................................... 67
LIST OF ABBREVIATIONS Australian Bureau of Statistics ABS
Australian and New Zealand Standard Industrial Classification ANZSIC
Business 4 Zone B4Z
Commercial Land Strategy CLS
Community Focussed Development CFD
Department of Planning & Community Development DPCD
Discount Department Store DDS
Estimated Resident Population ERP
General Residential Zone GRZ
Global Financial Crisis GFC
Gross Domestic Product GDP
Gross Regional Product GRP
Gross Floor Area GFA
Gross Lettable Area GLA
Local Government Area LGA
Local Planning Policy Framework LPPF
Main Trade Area MTA
Municipal Strategic Statement MSS
Neighbourhood Residential Zone NRZ
Primary Trade Area PTA
Secondary Trade Area STA
Research and Development R&D
Residential 1 Zone R1Z
Residential Growth Zone RGZ
Residential Development Strategy RDS
State Planning Policy Framework SPPF
Statistical Local Area SLA
Tourism Research Australia TRA
Victoria in Future VIF
Visitor Profile & Satisfaction Project VPS

Bendigo Hospital Precinct Structure Plan
Ref: M13038 FINAL DRAFT P a g e 7 | 74 Hill PDA
1. INTRODUCTION
1.1 PROJECT BRIEF
Bendigo Hospital is currently undergoing an estimated $650m redevelopment which will see it become the largest
Hospital in regional Victoria. The redevelopment represents the greatest investment in regional health
infrastructure in Victoria’s history and will be a catalyst for a range of economic and business development
opportunities in the areas surrounding the Hospital. The scale of development is also expected to stimulate non -
health related sectors including education, business and residential development within the City of Greater
Bendigo and broader region.
Such growth requires careful management and in order to fully understand these impacts, a Bendigo Hospital
Precinct Structure Plan is being prepared. As part of the Structure Plan process, Hill PDA provides this Technical
Assessment of economic and land use conditions in the Study Area and other areas around the Hospital including
the CBD, central Bendigo and the broader City. Locations beyond the Study Area are analysed to provide a
better understanding of broader economic and land use issues and opportunities that have an influence on the
Study Area itself.
The Technical Assessment informs the future uses and opportunities for residential development, short -term
accommodation, retail, commercial, and other uses in the Study Area.
1.1 BACKGROUND DOCUMENTATION AND CONSULTATION
The following documents were reviewed as background to the Technical Assessment:
Bendigo Health Annual Report (2012)
Bendigo Health Report of Operations (2011)
Report on the Geographical Distribution of Patients who attend Bendigo Health (2011/12)
City of Greater Bendigo Commercial Land Strategy, Ratio Consultants (2005)
Bendigo Residential Development Strategy, Parsons Brinckerhoff (2004)
Bendigo Residential Development Strategy Review: Audit Report, City of Greater Bendigo (2011)
Bendigo Residential Development Strategy Review: Issues and Opportunities Paper (2013)
Bendigo Residential Development Strategy Review: Land Supply and Assessment (2013)
Visit Bendigo Tourism Development Plan (2007 to 2012)
Loddon Mallee South Regional Growth Plan, DPCD (2013)
Bendigo CBD Plan, Planisphere and the City of Greater Bendigo (2005)
Bendigo Hospital Precinct Structure Plan
Ref: M13038 FINAL DRAFT P a g e 8 | 74 Hill PDA
Greater Bendigo Economic Development Strategy: Volume 3 Background Material, SGS Economics &
Planning (2008)
Greater Bendigo Economic Development Strategy, SGS Economics & Planning (2008)
Regional Tourism Profile for Bendigo Loddon 2010/2011, Tourism Research Australia (2011)
Bendigo Visitor Profile and Tourism Survey, Tourism Research Australia (2011)
The following individuals were consulted as part of the research process which informed this Assessment.
Bendigo Health, Robyn Lindsay, consultation sessions (April 2013)
Bendigo Health, David Walker, consultation sessions (April 2013)
Doug Lougoon Real Estate, Doug Lougoon, phone interview (April 2013)
Professionals Real Estate Bendigo, Danny Clarke, phone interview (April 2013)
Luke Goggin Real Estate Bendigo, Paul Dalton, phone interview (April 2013)
Tweed Sutherland First National Bendigo, Tom Harrop, phone interview (April 2013)
Colliers International Ballarat, Travis Hurst, phone interview (April 2013)
Apelbaum Healthcare Real Estate, Phillip Apelbaum, phone interview (May 2013)
In order to inform the preparation of the Structure Plan, five workshops were undertaken with the community and
key stakeholders, with each focusing on broad topics such as transport, infrastructure, economics, planning,
urban design and health. The following groups attended the health and economics workshops which were
attended by Hill PDA:
Various Bendigo local residents, business operators and land owners;
Bendigo Health;
Bendigo Business Council;
Bendigo Holiday Accommodation;
Bendigo Chinese Association;
Centrum Town Planning;
City of Greater Bendigo Council staff;
Regional Development Victoria (Loddon Mallee); and
Bendigo Senior Secondary College.

Bendigo Hospital Precinct Structure Plan
Ref: M13038 FINAL DRAFT P a g e 9 | 74 Hill PDA
2. PROJECT STUDY AREA The Study Area for the Bendigo Hospital Precinct Structure Plan includes not only the Bendigo Hospital Precinct,
but also land on the periphery, of up to and sometimes more than a radius of 800m. The focus of the Structure
Plan is to understand the influence of the Hospital on redevelopment in the Study Area and therefore it is relevant
to understand the residential areas, institutional uses and retail and commercial land within this peripheral area.
At 2011, the Study Area accommodated an Estimated Resident Population (ERP) of 1,510 persons. The
distribution of population by age group is identified in the table below.
Table 1 - Study Area Population and Age Distribution
Age Cohort 2011
Population %
0-14 211 14.0
15-29 349 23.1
30-44 280 18.5
45-59 318 21.0
60-74 205 13.6
75+ 147 9.8
Total 1,509 100.0
Source: ABS Community Profiles
In 2011, the resident population was accommodated in approximately 600 occupied private dwellings, equivalent
to an average of 2.5 persons per dwelling. The vast majority of dwellings (approximately 79%) were separate
detached dwellings. The remainder of dwellings in the Study Area were either flat-unit-apartments or other
dwellings.
Just under half of all residents in the Study Area were employed at 2011 (approximately 710 residents). Of these
resident workers, around 155 (close to 22%) were employed in health care and social assistance, with the vast
majority of these likely to be employed within the Hospital Precinct. Other significant employing industries for
working residents in the Study Area included retail trade (84 resident workers or 11.8%) and education and
training (84 resident workers or 11.8%), which are both unsurprising given the proximity of the Bendigo CBD and
educational facilities present in the Study Area.
2.1 BENDIGO HOSPITAL PRECINCT
Bendigo Health is a 6781 bed service that includes a 60-bed rehabilitation unit, eight bed critical care unit and five
operating theatres where around 10,000 surgical procedures are performed annually2. Bendigo Health also
manages 5 residential care homes elsewhere off campus offer permanent and respite nursing home and hostel
care including Carshalton House, Golden Oaks Nursing Home, Joan Pinder Nursing Home, Simpkin House and
Stella Anderson Nursing Home.
1 Note: The 653 beds include the 60 bed rehabilitation unit and intensive care unit beds.
2 www.bendigohealth.com.au (2013)

Bendigo Hospital Precinct Structure Plan
Ref: M13038 FINAL DRAFT P a g e 10 | 74 Hill PDA
Bendigo Health is a significant provider of health services across the Loddon-Mallee Region. The main campus is
the Bendigo Hospital Precinct, with many services extended to regional areas including Mildura, Echuca, Swan
Hill, Kyneton and Castlemaine. In 2011/12 there were 35,497 discharges of patients of which 74% (26,276) were
patients who resided in the City of Greater Bendigo. Of the remaining 26% (9,221), 92.5% (8,535) were from other
parts of Victoria, 6.1% (562) were from NSW with the balance of patients from other states3.
Based on the 2012 Bendigo Health Annual Report:
In 2011 Bendigo Health employed 2,205 full-time equivalent staff, which increased to 2,254 staff in 2012.
In 2012 the majority of staff were in nursing services (45%), followed by administration and clerical
services (16.7%), ancillary support (9.8%) and medical support services (8.7%).
Bendigo Health currently employs almost 300 volunteers, in 32 areas. Volunteers give their time to
patients, residents and visitors in a range of settings including Child and Adolescent Unit, Day Procedure
Unit, Palliative Care, Emergency Department and our five residential aged care facilities.
In 2011 Bendigo Health hosted 26,199 student placement days and supported 11 educational partners.
Subsidised accommodation is provided for medical staff and some students, which includes meals and
entertainment benefits.
In 2011/2012 Bendigo Health secured Health Workforce Australia cl inical training funding which will allow
Bendigo Health to support additional staff, refurbishment of student learning areas and office spaces
together with purchasing additional equipment to support students undertaking clinical placement at
Bendigo Health.
In terms of staff characteristics, Bendigo Health has indicated4:
Where staff reside – the majority of staff live in the City of Greater Bendigo including the suburbs of
Bendigo (18% or 650 staff, also the largest representation), Golden Square (6.3% or 218), Eaglehawk
(6% or 208), Kangaroo Flat (5.7% or 198), Strathfieldsaye (5.1% or 176). Smaller proportions of staff do
travel from further afield including Castlemaine/Harcourt/Campbells Court (2.7% or 95), Echuca (0.7% or
24), and Mildura (0.4% or 14). A very small proportion reside in Melbourne metropolitan suburbs such as
Parkville, Richmond, Fitzroy, Hoppers Crossing, Melbourne, Brunswick East, Box Hill and Balwyn.
Mode of transport of staff - no formal study has been completed however anecdotally it is understood
existing staff travel to work by car, bike, walk and a minor proportion arrive by bus. Some catch the train
to Bendigo station and then either walk or take a taxi to the Hospital Precinct
Most common shift hours - most common shift hours are 7am to 3.30pm and 1.30pm to 10pm. Monday
to Friday is busier as there are large numbers of support staff on site.
Residential accommodation for visiting medical staff – subsidised accommodation is provided for visiting
medical staff dependent on salary packages and often includes meal and entertainment allowances. If
accommodation is not available on site, Bendigo Health has provided rooms in rented private dwellings
surrounding the Hospital Precinct.
3 Report on the Geographical Distribution of Patients who attend Bendigo Health (2011/12)
4 Robyn Lindsay, Bendigo Health (May 2013)

Bendigo Hospital Precinct Structure Plan
Ref: M13038 FINAL DRAFT P a g e 11 | 74 Hill PDA
Residential accommodation for medical students - subsidised accommodation for students is provided
dependent on the individual agreement Bendigo Health has with education providers.
The following information from the 2011 Bendigo Health Quality of Care Report indicates the extent of the
catchment of Bendigo Health services. In 20115:
58,797 occasions of service were provided by the outpatients clinic (acute and allied health);
45,368 people went through the Emergency Department for treatment;
37,709 people were admitted to the hospital;
9,975 operations were performed;
9,639 ambulance arrivals were handled by the Emergency Department;
1,938 admissions of children under age 19 to the Child and Adolescent Unit; and
1,169 babies were delivered.
The Hospital Precinct itself is located approximately 1km north of Bendigo CBD and comprises the Bendigo
Hospital and the Anne Caudle Centre. The St John of God Private Hospital is located at the corner of Lily and
Chum Street 2.5km west of the Bendigo Hospital Precinct. Bendigo Hospital and associated facilities provide a
range of medical and health related services including (but not limited to) emergency, women’s health, medical
imaging, pathology, rehabilitation, cardiology and renal dialysis.
Figure 1 - Bendigo Hospital Precinct Map
Source: Bendigo Health (2013)
5 Bendigo Health Quality of Care Report (2011)
Bendigo Hospital Precinct Structure Plan
Ref: M13038 FINAL DRAFT P a g e 12 | 74 Hill PDA
Outside of health services the Hospital Precinct accommodates a coffee shop, kiosk, gift shop (flowers, gifts and
personal items including toiletry packs), ATM, pastrol care and two chapels.
The health education precinct between Mercy and Arnold streets within the Hospital Precinct broadens the overall
health education role and function of the Hospital and accommodates the Monash University Bendigo Regional
Clinical School, the Bendigo Primary Care Centre and the new La Trobe University School of Rural Health . The
addition of these education facilities assists the Hospital in creating their own health workforce for the future. It is
anticipated that in doing so, the Hospital will not have to rely on the metropolitan clinical schools as has been the
case in the past6. In particular recent health education projects have included7:
The new Monash University facilities which opened in 2010 and were designed to draw students,
practitioners, clinical teaching staff and other institutions into much closer collaboration.
A Dental Training Clinic on the Anne Caudle Centre campus was opened in April 2010. The expansion
significantly increases the access of La Trobe dental and oral health students to the latest technology in
dental education.
La Trobe’s new Physiotherapy Clinical School, located on the Anne Caudle Centre campus, opened in
July 2010. Having this facility based at Bendigo Health enables students to have access to
physiotherapists and work in a variety of practice areas in rehabilitation and acute care.
The new La Trobe Rural Health School was opened in March 2013 and will offer an extra 750 student
places, and train an additional 200 graduates each year to tackle critical health care worker shortages.
The vision for the new school is to provide theoretical and clinical learning to students in the disciplines of
nursing and midwifery, dentistry, oral health, human biosciences, physiotherapy, occupational therapy,
podiatry, speech pathology, paramedic practice, health sciences and social work.
Other recent developments completed within the Hospital Precinct have included8:
The coffee shop on the hospital campus has been refurbished.
The re-development of the Emergency Department which officially opened in October 2010. It features
an increase in treatment spaces, a new short stay unit and a dedicated fast-track area, so patients with
less serious illnesses and injuries can receive quicker assessments and treatment.
Relocation of Ambulance Victoria services from Arnold Street to strategic locations in the Bendigo area
as part of the enabling works for the new Hospital. Stations were constructed at Epsom, Eaglehawk and
North Bendigo, the Bendigo CBD and Strathdale facilities nearing completion.
A temporary energy centre was built on the Barnard Street site near the front gate as part of the enabling
works for the new Hospital. For the first time in 60 years, all buildings are being fed from the front of the
site. This project delivers the site’s main electrical switchboard, generator enclosure, generator fuel tank
and boiler house.
6 Bendigo Health Quality of Care Report (2011)
7 Bendigo Health Quality of Care Report (2011)
8 Bendigo Health Annual Report (2012) and Bendigo Health Report of Operations (2011 )
Bendigo Hospital Precinct Structure Plan
Ref: M13038 FINAL DRAFT P a g e 13 | 74 Hill PDA
Demolition of existing buildings on the Barnard Street site as enabling works for the new Hospital.
In April 2013 the Exemplar consortium (Lend Lease, Capella, Spotless Services, Bates Smart and Silver Thomas
Hanley) was announced as the preferred bidder for the new Bendigo Hospital project. The new Bendigo Hospital
redevelopment will significantly expand the existing services offered at the Hospital Precinct. The redevelopment
will not only expand the existing facility but will also lead to a greater number of people working in, travelling
through and staying in the Study Area.
The redeveloped Hospital will provide9:
A new hospital built on one site at Barnard Street;
372 new beds and 10 new operating theatres;
An integrated cancer centre and mental health unit; and
A helipad to be built on top of a new multi-story car park on the Lucan Street site. A bridge link will
connect the car park to the main hospital site, making it easy for patients and visitors to get to the
hospital and other amenities.
Over and above health services, the redeveloped Hospital Precinct is also anticipated to include10:
A childcare and wellness centre;
128 serviced apartments and 15 apartments for short stay accommodation;
New kitchen, supply and linen handling facility within the new hospital;
180 seat conference facility;
A large atrium as the entrance with retail, cafes and multiple internal courtyards;
Enhanced landscaping across the entire hospital precinct;
Refurbishment and re-use of some heritage buildings; and
The latest integrated technology nurse call system.
The redeveloped Hospital will also accommodate approximately 1,800sqm of retail which will include cafes, a
florist, chemist, newsagents and a convenience store (less than 500sqm).
The redeveloped Hospital will also expand the capacity for daily and overnight treatment. It is expected that with
expanded capacity the number of annual patients will increase gradually over the coming years.
Construction of the new Hospital is anticipated to be complete in 2016 and will generate more than 770
construction industry and supply chain jobs, with at least 300 jobs maintained for a minimum of three years during
the peak construction period for the Hospital11.
9 www.newbendigohospital.org.au. (23.05.2013)
10 Health Precinct Benchmarking / Best Practice Review: Bendigo Hospital Precinct Structure Plan Draft 1, Billard Leece (May 2013)
11 www.newbendigohospital.org.au (31.05.2013)
Bendigo Hospital Precinct Structure Plan
Ref: M13038 FINAL DRAFT P a g e 14 | 74 Hill PDA
Once the Hospital redevelopment is complete and operational, there will be an increase of around 1,000 staff
working in the Hospital Precinct. Bendigo Health has indicated that the exact forecast of campus staff including a
breakdown of new recruits, visiting doctors/specialists and medical students is not yet available as it will depend
on a range of factors which are yet to be resolved12.
With an increase in capacity, beds and permanent staff will also be an increase in visiting medical specialists as
well as an increase in family and friends visiting patients in care. Many visitors from rural and regional
communities beyond the City of Greater Bendigo will choose to stay overnight and some may stay for weeks at a
time to offer support.
2.2 SURROUNDING LAND USES
Outside of the Hospital Precinct, the Study Area is defined by:
Hustlers Reef Reserve to the north-west;
The Catholic College located on the corner of Barkly and View Streets;
Rosalind Park including the primary school and secondary college and soon to developed theatre;
The north of Pall Mall, in particularly the area Park Road and the Chinese Precinct;
The Bendigo Creek to the south east; and
Residential areas to the north on rising topography leading towards the recently closed Bendigo North
Primary School.
The Study Area accommodates a range of regionally significant cultural, sporting and recreation precincts
including:
The Bendigo Chinese Association Precinct and Museum;
Tom Flood Sports Centre;
Bendigo Aquatic Centre;
Bendigo Bowling Club;
Bendigo Art Gallery;
The Queen Elizabeth Oval; and
Bendigo Tennis Complex.
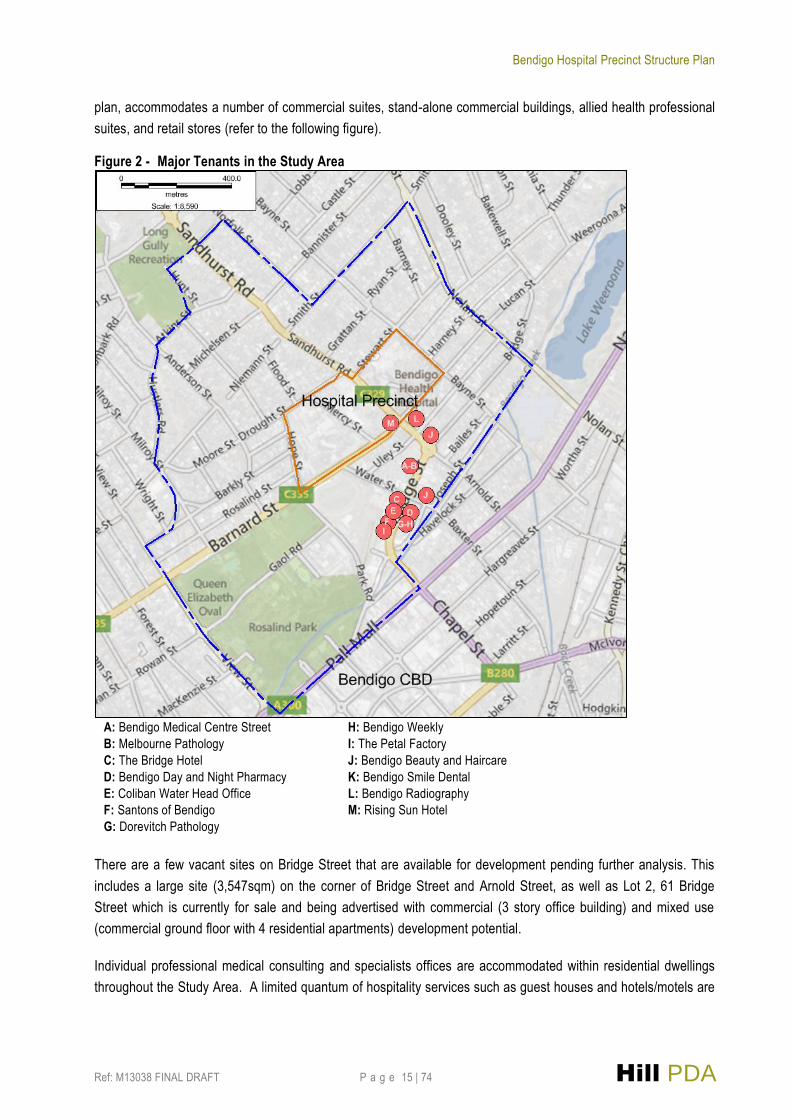
Retail and commercial uses are predominately located in the south-west of the Study Area in Bridge Street and
the southern part of Arnold Street. Bridge Street, which is quite arterial in nature, provides a direct vehicle
connection with Bendigo CBD via Charles Street and the Midland Highway. This area, as shown on the following
12 Robyn Lindsay, Bendigo Health (May 2013)
Bendigo Hospital Precinct Structure Plan
Ref: M13038 FINAL DRAFT P a g e 15 | 74 Hill PDA
plan, accommodates a number of commercial suites, stand-alone commercial buildings, allied health professional
suites, and retail stores (refer to the following figure).
Figure 2 - Major Tenants in the Study Area
A: Bendigo Medical Centre Street
B: Melbourne Pathology
C: The Bridge Hotel
D: Bendigo Day and Night Pharmacy
E: Coliban Water Head Office
F: Santons of Bendigo
G: Dorevitch Pathology
H: Bendigo Weekly
I: The Petal Factory
J: Bendigo Beauty and Haircare
K: Bendigo Smile Dental
L: Bendigo Radiography
M: Rising Sun Hotel
There are a few vacant sites on Bridge Street that are available for development pending further analysis. This
includes a large site (3,547sqm) on the corner of Bridge Street and Arnold Street, as well as Lot 2, 61 Bridge
Street which is currently for sale and being advertised with commercial (3 story office building) and mixed use
(commercial ground floor with 4 residential apartments) development potential.
Individual professional medical consulting and specialists offices are accommodated within residential dwellings
throughout the Study Area. A limited quantum of hospitality services such as guest houses and hotels/motels are
Bendigo Hospital Precinct Structure Plan
Ref: M13038 FINAL DRAFT P a g e 16 | 74 Hill PDA
scattered throughout the Study Area, although the majority of this type of accommodation is located outside of the
Study Area along Midland Highway and on the fringe of the CBD.
Whilst cultural, retail, commercial and civic uses lie predominately to the south of the Study Area, residential uses
are predominant to the north, east and west, both within and bounding the Study Area. The majority of housing is
detached with substantial pockets to the west and north-west covered by Heritage Overlays. There are some
instances of medium density residential, however this largely comprises small-lot subdivisions for townhouses and
villas.
Elsewhere within the Study Area there are scattered retail stores such as the small cluster located north of the
Hospital Precinct at the intersection of Arnold Street and Drought Street which include the likes of Arnold Street
Pharmacy, Central Victorian Sports Physiotherapy, Bendigo Eye Clinic, and other professional medical consulting
suites.
At the very north of the Study Area, 700m north of the Hospital Precinct, is the $25m Bendigo Health
Accommodation Project which is currently under construction and is due for completion in mid-2013. The project
comprises 120 one and two bedroom units to accommodate health professionals.

Bendigo Hospital Precinct Structure Plan
Ref: M13038 FINAL DRAFT P a g e 17 | 74 Hill PDA
Figure 3 - Bendigo Hospital Precinct Structure Plan Study Area Map
Source: Hansen Partnership (May 2013)

Bendigo Hospital Precinct Structure Plan
Ref: M13038 FINAL DRAFT P a g e 18 | 74 Hill PDA
Figure 4 - Bendigo Hospital Precinct Structure Plan Land Use Map
Source: Hansen Partnership (May 2013)

Bendigo Hospital Precinct Structure Plan
Ref: M13038 FINAL DRAFT P a g e 19 | 74 Hill PDA
Figure 5 - Bendigo Precinct Structure Plan Existing Zoning Map
Source: Hansen Partnership (May 2013)

Bendigo Hospital Precinct Structure Plan
Ref: M13038 DRAFT P a g e 20 | 74 Hill PDA
3. CITY OF BENDIGO ECONOMIC CONTEXT The City of Greater Bendigo is located approximately 150km to the north-west of Melbourne. Bendigo acts as a
major regional service centre providing a range of retail, commercial, entertainment, community and
administrative services for the municipality and wider region. The City is located at the confluence of a number of
major roads including the Calder Highway, Midland Highway and McIvor Highway. The centres of influence
outside the City include Horsham, Ballarat and Shepparton.
3.1 KEY INDUSTRY SECTORS IN BENDIGO
The City of Greater Bendigo’s Gross Regional Product (GRP) was $5.08b at 2012, with a per capita GRP of
approximately $50,500, which is higher than those found in the Loddon Mallee South Region ($44,110) but is
lower than the broader state of Victoria ($61,370)13.
Those industries which are considered to be key economic propulsive sectors in the City of Greater Bendigo given
their contributions to the local economy through employment, exports, value-added and local expenditure on
goods and services include: manufacturing; health care and social assistance; and financial and insurance
services.
The Bendigo Hospital is an especially important economic driver of the City. This is reflected in more detailed
REMPLAN data which shows that a number of industries sell a large amount of goods and services to the health
care and social assistance sector in the City.
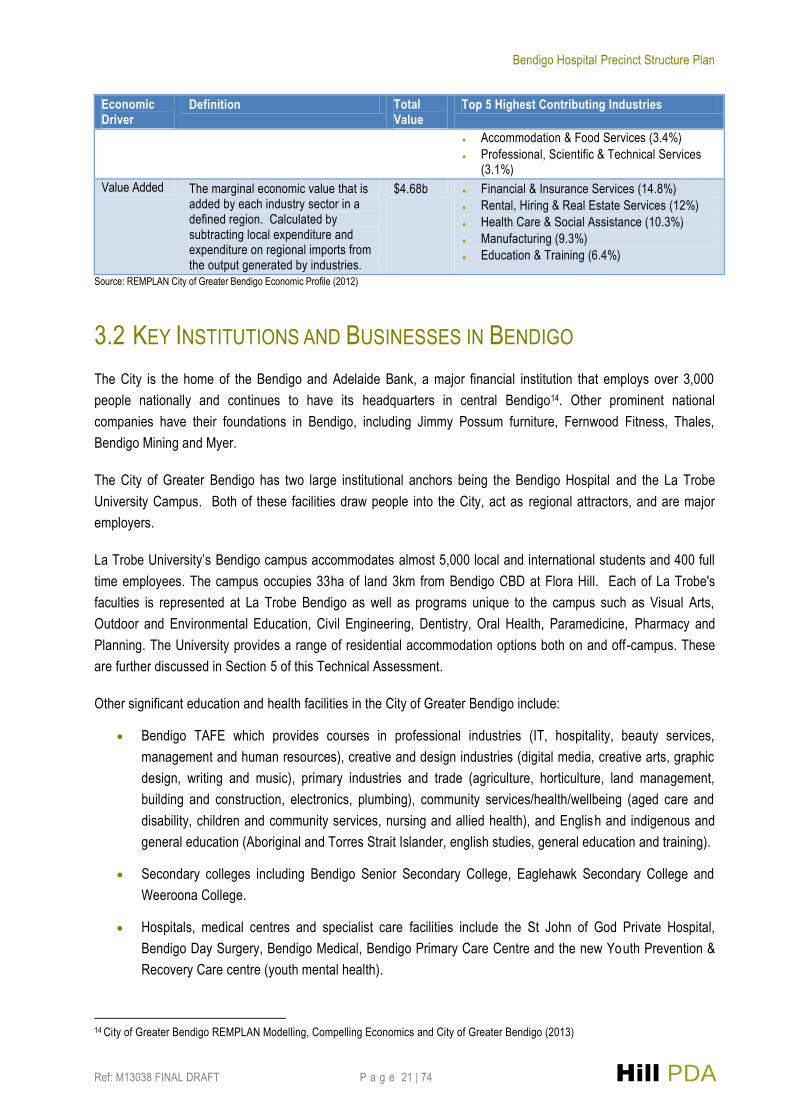
Table 2 - Key Economic Drivers and Significant Local Industries in the City of Greater Bendigo (2012)
Economic Driver
Definition Total Value
Top 5 Highest Contributing Industries
Output Total revenue generated by businesses/organisations in the City of Greater Bendigo. Can also be referred to as total sales or total income.
$10.19b Manufacturing (21.6% of total)
Financial and Insurance Services (9.3%)
Construction (8.9%)
Rental, Hiring & Real Estate Services (8.1%)
Health Care & Social Assistance (7.1%)
Employment Number of people employed by businesses/organisations in each industry sector in the City of Greater Bendigo.
37,659 jobs
Health Care & Social Assistance (17.3%)
Retail Trade (13.7%)
Education & Training (9.8%)
Manufacturing (9.4%)
Accommodation & Food Services (6.8%)
Regional Exports
Goods and services produced by industry sectors and then sold to consumers, businesses and government based beyond the City of Greater Bendigo.
$2.63b Manufacturing (33.6%)
Mining (20.1%)
Financial and Insurance Services (12.4%)
Health Care & Social Assistance (7.2%)
Electricity, Gas, Water & Waste Services (4.5%)
Regional Imports
Intermediate goods & services which are imported into the City of Greater Bendigo by local industry sectors.
$2.37b Manufacturing (48.8%)
Mining (10.8%)
Construction (6.2%)
13 REMPLAN Greater Bendigo Economic Snapshot, Compelling Economics and Regional Development Victoria (2012)
Bendigo Hospital Precinct Structure Plan
Ref: M13038 FINAL DRAFT P a g e 21 | 74 Hill PDA
Economic Driver
Definition Total Value
Top 5 Highest Contributing Industries
Accommodation & Food Services (3.4%)
Professional, Scientific & Technical Services (3.1%)
Value Added The marginal economic value that is added by each industry sector in a defined region. Calculated by subtracting local expenditure and expenditure on regional imports from the output generated by industries.
$4.68b Financial & Insurance Services (14.8%)
Rental, Hiring & Real Estate Services (12%)
Health Care & Social Assistance (10.3%)
Manufacturing (9.3%)
Education & Training (6.4%)
Source: REMPLAN City of Greater Bendigo Economic Profile (2012)
3.2 KEY INSTITUTIONS AND BUSINESSES IN BENDIGO
The City is the home of the Bendigo and Adelaide Bank, a major financial institution that employs over 3,000
people nationally and continues to have its headquarters in central Bendigo14. Other prominent national
companies have their foundations in Bendigo, including Jimmy Possum furniture, Fernwood Fitness, Thales,
Bendigo Mining and Myer.
The City of Greater Bendigo has two large institutional anchors being the Bendigo Hospital and the La Trobe
University Campus. Both of these facilities draw people into the City, act as regional attractors, and are major
employers.
La Trobe University’s Bendigo campus accommodates almost 5,000 local and international students and 400 full
time employees. The campus occupies 33ha of land 3km from Bendigo CBD at Flora Hill. Each of La Trobe's
faculties is represented at La Trobe Bendigo as well as programs unique to the campus such as Visual Arts,
Outdoor and Environmental Education, Civil Engineering, Dentistry, Oral Health, Paramedicine, Pharmacy and
Planning. The University provides a range of residential accommodation options both on and off-campus. These
are further discussed in Section 5 of this Technical Assessment.
Other significant education and health facilities in the City of Greater Bendigo include:
Bendigo TAFE which provides courses in professional industries (IT, hospitality, beauty services,
management and human resources), creative and design industries (digital media, creative arts, graphic
design, writing and music), primary industries and trade (agriculture, horticulture, land management,
building and construction, electronics, plumbing), community services/health/wellbeing (aged care and
disability, children and community services, nursing and allied health), and English and indigenous and
general education (Aboriginal and Torres Strait Islander, english studies, general education and training).
Secondary colleges including Bendigo Senior Secondary College, Eaglehawk Secondary College and
Weeroona College.
Hospitals, medical centres and specialist care facilities include the St John of God Private Hospital,
Bendigo Day Surgery, Bendigo Medical, Bendigo Primary Care Centre and the new Youth Prevention &
Recovery Care centre (youth mental health).
14 City of Greater Bendigo REMPLAN Modelling, Compelling Economics and City of Greater Bendigo (2013)

Bendigo Hospital Precinct Structure Plan
Ref: M13038 FINAL DRAFT P a g e 22 | 74 Hill PDA
3.3 TOURISM IN BENDIGO
Bendigo is also a popular tourist destination with over 2.5 million visitors travelling to the Bendigo Loddon Region
annually.15 Over the past few years tourism has further expanded, in part due to the popularity of a number of
high profile exhibitions at the Bendigo Art Gallery and improvements to regional rail infrastructure between
Bendigo and Melbourne (Regional Rail Link Authority figures show a 150% increase in V/Line services in
Bendigo, Geelong and Ballarat from 2005 to 201116).
Key cultural attractors and facilities in Bendigo include the Bendigo Art Gallery, Golden Dragon Museum, Bendigo
Pottery, Soldiers Memorial Museum, La Trobe University Visual Arts Centre, and the Discovery Science &
Technology Centre.
3.4 SIGNIFICANT PROJECTS
There are a number of significant projects which are either in the pipeline or have commenced development and
which are likely to encourage economic growth in the City. These include17:
Bendigo Airport Upgrade;
Bendigo Library Redevelopment;
Bendigo Art Gallery Extension;
Bendigo Health Accommodation Precinct;
Proposed Marong Business Park;
Edward Street Car Park Complex Development;
Kangaroo Flat Aquatic and Leisure Centre Development; and
Sandhurst Community Theatre Complex.
15 Bendigo Loddon Regional Tourism Profile, Tourism Research Australia (2011)
16 http://www.bendigoadvertiser.com.au/story/1232544/rail-upgrade-for-growth/ (25 June 2013)
17 Greater Bendigo Economic Snapshot, Compelling Economics and Regional Development Victoria (2012)

Bendigo Hospital Precinct Structure Plan
Ref: M13038 FINAL DRAFT P a g e 23 | 74 Hill PDA
4. SOCIO-ECONOMIC AND INDUSTRY PROFILING This Chapter reviews the social and economic profile of residents within the area directly influenced by the
Bendigo Hospital redevelopment. Bendigo Hospital is located within the suburb of Bendigo, however it also
affects (by way of land use, traffic, economic activity and planning) areas such as North Bendigo, Long Gully and
Golden Square. The Greater Bendigo – Central Statistical Local Area (Central SLA) broadly encompasses these
areas (refer to the following figure) and has been used as the area for social and economic profiling as part of this
Chapter.
Figure 6 - Central SLA Context
Source: ABS 2011 and Hill PDA
This demographic profile identifies the social and economic characteristics that have influenced demand for jobs,
retail space and commercial and community services. The Central SLA has also been benchmarked against the
wider City of Greater Bendigo, Victoria and in some cases the City of Ballarat in order to better develop an
understanding of the area compared to other regional locations.

Bendigo Hospital Precinct Structure Plan
Ref: M13038 FINAL DRAFT P a g e 24 | 74 Hill PDA
4.2 AGE DISTRIBUTION AND POPULATION GROWTH
The Estimated Resident Population (ERP) of the City of Greater Bendigo at 2011 was approximately 101,900
persons. This represents growth of over 11,000 persons between 2001 and 2011 at an average growth rate of
1.20% per annum. This rate of growth is comparable to that of the City of Ballarat (1.29% per annum) and slightly
less than Victoria as a whole (1.42% per annum). However, the Central SLA population declined over this period
by around 1,200 persons (refer to the following table) which is unusual given the rate of growth across the wider
City area. This is likely to be as a result of an empty nester trend which sees an older demographic remaining in
larger dwelling stock whilst children move beyond the area once they reach adulthood. It could also be partly
attributable to some residential housing being used and/or converted for business functions.
Table 3 - Estimated Resident Population Change by Area (2001-2011)
Area 2001 2006 2011 Change
2001-2011
Average Annual
Growth 2001-2011
Central SLA 19,204 18,449 17,997 -1,207 -0.65%
City of Greater Bendigo 90,449 96,543 101,868 11,419 1.20%
City of Ballarat 83,599 88,451 95,007 11,408 1.29%
Victoria 4,804,726 5,126,540 5,534,526 729,800 1.42%
Source: ABS ERP Data (Publication 3218.0)
The median age of Central SLA residents increased from 34 years to 37 years between 2001 and 2011. This
trend was common across the wider City (35 to 38 years over the period) and throughout Victoria (35 to 37 years
over the period).
Figure 7 - Median Age (2001-2011)
Source: ABS Census Time Series Data (2011)
Projections of population growth have been forecast by Hill PDA for the Central SLA which largely corresponds to
the area of influence of the Bendigo Hospital. The projections have been determined through the following
methodology:
Calibrating .id Consulting forecasts (with a 2006 ABS Census base year) for the .id small areas that
roughly are equivalent to the Central SLA, to the ABS ERP at 2011; and
Forecasting growth from 2011 onwards by applying age cohort growth rates for the equivalent .id small
areas from the .id Consulting forecasts to 2031.

Bendigo Hospital Precinct Structure Plan
Ref: M13038 FINAL DRAFT P a g e 25 | 74 Hill PDA
As can be seen in the following table, the Central SLA has been forecast to grow from approximately 18,000
persons at 2011 to around 21,870 persons at 2031, at an average annual growth rate of approximately 1%. This
rate of growth may be conservative given the Bendigo Hospital redevelopment will significantly expand
employment in the local area and may stimulate demand for dwellings in and around the Hospital Precinct.
However, Hill PDA considers it appropriate given the historic decline in the resident population in the Central SLA
over the period 2001 to 2011.
Currently the 15-29 years age cohort is the most highly concentrated within the Central SLA and this will continue
to be the case at 2031. Growth in the older age cohorts (60-74 and 75+ years) is likely to be considerably
stronger than growth in all other age cohorts and indicates the further ageing of the population in this area.
Indeed the proportion of elderly residents (60+ years) in the Central SLA is forecast to increase from around 23%
at 2011 to 27% at 2031 which may precipitate greater demand for smaller, higher density dwelling types in this
area. Despite this trend, there will still be net additional growth in all other age groups in the area, with significant
growth in the 15-29 (+622 persons between 2011 and 2031) and 30-44 year age groups (+786 persons).
The wider City of Greater Bendigo is estimated to grow to approximately 140,500 persons at 2031. This would
represent an average annual growth rate of around 1.6%, which is significantly higher than that forecast for the
Central SLA. As can be seen in the following table, the SLA would make up just over 10% of the City’s population
growth to 2031.
Table 4 - Estimated Resident Population in the Central SLA (2001 to 2031)
Age Cohort Historic Forecast Change
(2011-2031)
Av. Annual
Change 2001 2006 2011 2016 2021 2026 2031
0-14 3,655 3,346 3,122 3,195 3,405 3,552 3,601 565 0.7%
15-29 4,608 4,171 4,146 4,239 4,498 4,666 4,728 622 0.7%
30-44 3,851 3,595 3,347 3,436 3,739 3,980 4,058 786 1.0%
45-59 3,151 3,333 3,273 3,348 3,482 3,525 3,567 236 0.4%
60-74 2,220 2,274 2,428 2,754 3,105 3,295 3,388 870 1.7%
75+ 1,720 1,729 1,680 1,842 2,067 2,344 2,525 917 2.1%
Total 19,204 18,449 17,997 18,815 20,297 21,362 21,868 3,871 1.0%
City of Greater Bendigo
90,449 96,543 101,868 111,199 121,374 131,128 140,509 38,641 1.6%
Source: ABS Time Series Data (2011), .id Consulting Population Forecasts and ABS Estimated Resident Population, publication 3218.0

Bendigo Hospital Precinct Structure Plan
Ref: M13038 FINAL DRAFT P a g e 26 | 74 Hill PDA
Figure 8 - Distribution of Population by Age Cohort in the Central SLA (2001 to 2031)
Source: ABS Time Series Data (2011), .id Forecast Population Projections and ABS Estimated Resident Population, publication 3218.0
4.3 HOUSEHOLD AND DWELLING CHARACTERISTICS
At 2011, the Central SLA accommodated 7,640 dwellings compared to around 7,400 dwellings at 2001. This
represents growth of approximately 240 dwellings at an average annual growth rate of just 0.3% (+24 dwellings
per annum). In comparison, over the same period the City of Greater Bendigo experienced an increase of around
6,610 dwellings at an average annual growth rate of 1.8% (around +660 dwellings per annum). This was higher
than that of Victoria (1.6% average annual growth) and was only slightly less than the City of Ballarat (2% average
annual growth).
Lower growth in dwellings in the Central SLA compared to the wider City may be partly due to the fact that the
Central SLA has fewer residential infill development opportunities, with a number of precincts also subject to
heritage preservation controls.
Table 5 - Dwelling Change by Area (2001-2011)
Area 2001 2006 2011 Change
(2001-2011) Av. Annual
Change
Greater Bendigo - Central SLA 7,398 7,494 7,643 245 0.3%
Household Size (persons per household) 2.6 2.5 2.4 - -
City of Greater Bendigo 33,029 36,114 39,638 6,609 1.8%
City of Ballarat 30,496 33,165 37,059 6,563 2.0%
Victoria 1,731,343 1,869,387 2,031,227 299,884 1.6% Source: ABS Census Time Series Data (2011)
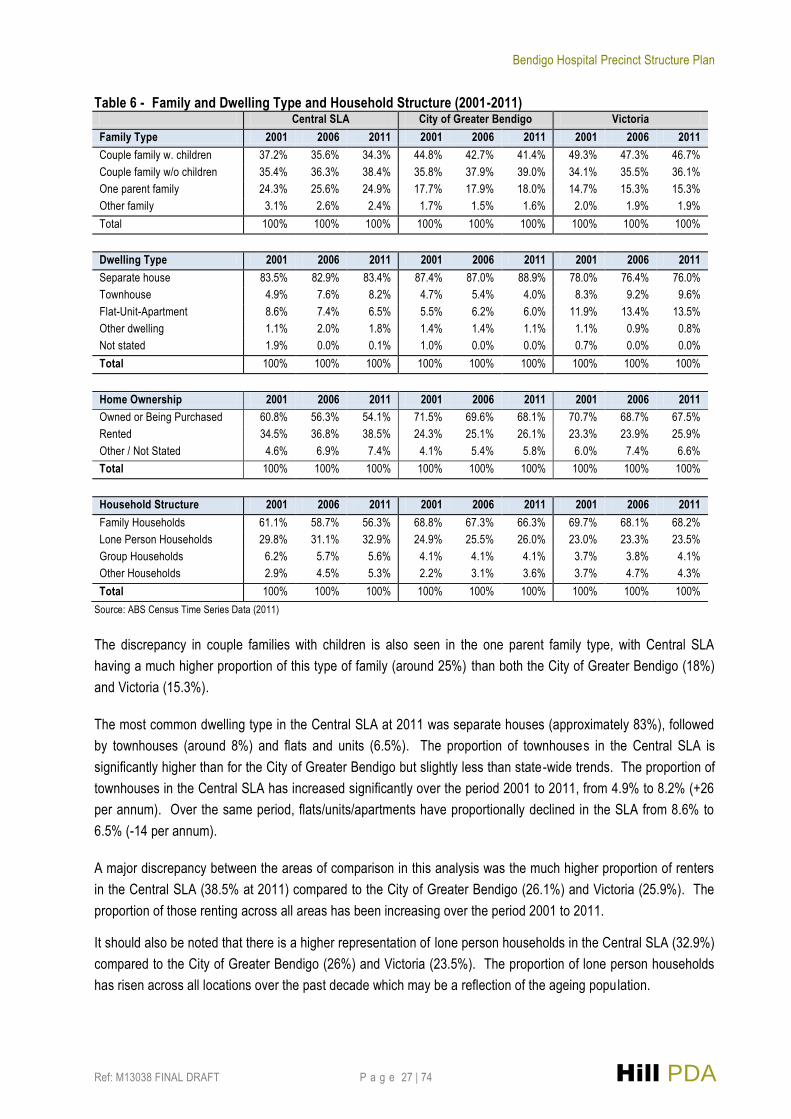
Historic trends in family and dwelling type composition and household structure was also analysed as part of this
Technical Assessment. The following table indicates that the Central SLA has a lower proportion of couple
families with children (34.3%) than both the City of Greater Bendigo (41.4%) and Victoria (46.7%). Across all of
these locations, there has been a decline in this family type since 2001.
Bendigo Hospital Precinct Structure Plan
Ref: M13038 FINAL DRAFT P a g e 27 | 74 Hill PDA
Table 6 - Family and Dwelling Type and Household Structure (2001-2011) Central SLA City of Greater Bendigo Victoria
Family Type 2001 2006 2011 2001 2006 2011 2001 2006 2011
Couple family w. children 37.2% 35.6% 34.3% 44.8% 42.7% 41.4% 49.3% 47.3% 46.7%
Couple family w/o children 35.4% 36.3% 38.4% 35.8% 37.9% 39.0% 34.1% 35.5% 36.1%
One parent family 24.3% 25.6% 24.9% 17.7% 17.9% 18.0% 14.7% 15.3% 15.3%
Other family 3.1% 2.6% 2.4% 1.7% 1.5% 1.6% 2.0% 1.9% 1.9%
Total 100% 100% 100% 100% 100% 100% 100% 100% 100%
Dwelling Type 2001 2006 2011 2001 2006 2011 2001 2006 2011
Separate house 83.5% 82.9% 83.4% 87.4% 87.0% 88.9% 78.0% 76.4% 76.0%
Townhouse 4.9% 7.6% 8.2% 4.7% 5.4% 4.0% 8.3% 9.2% 9.6%
Flat-Unit-Apartment 8.6% 7.4% 6.5% 5.5% 6.2% 6.0% 11.9% 13.4% 13.5%
Other dwelling 1.1% 2.0% 1.8% 1.4% 1.4% 1.1% 1.1% 0.9% 0.8%
Not stated 1.9% 0.0% 0.1% 1.0% 0.0% 0.0% 0.7% 0.0% 0.0%
Total 100% 100% 100% 100% 100% 100% 100% 100% 100%
Home Ownership 2001 2006 2011 2001 2006 2011 2001 2006 2011
Owned or Being Purchased 60.8% 56.3% 54.1% 71.5% 69.6% 68.1% 70.7% 68.7% 67.5%
Rented 34.5% 36.8% 38.5% 24.3% 25.1% 26.1% 23.3% 23.9% 25.9%
Other / Not Stated 4.6% 6.9% 7.4% 4.1% 5.4% 5.8% 6.0% 7.4% 6.6%
Total 100% 100% 100% 100% 100% 100% 100% 100% 100%
Household Structure 2001 2006 2011 2001 2006 2011 2001 2006 2011
Family Households 61.1% 58.7% 56.3% 68.8% 67.3% 66.3% 69.7% 68.1% 68.2%
Lone Person Households 29.8% 31.1% 32.9% 24.9% 25.5% 26.0% 23.0% 23.3% 23.5%
Group Households 6.2% 5.7% 5.6% 4.1% 4.1% 4.1% 3.7% 3.8% 4.1%
Other Households 2.9% 4.5% 5.3% 2.2% 3.1% 3.6% 3.7% 4.7% 4.3%
Total 100% 100% 100% 100% 100% 100% 100% 100% 100%
Source: ABS Census Time Series Data (2011)
The discrepancy in couple families with children is also seen in the one parent family type, with Central SLA
having a much higher proportion of this type of family (around 25%) than both the City of Greater Bendigo (18%)
and Victoria (15.3%).
The most common dwelling type in the Central SLA at 2011 was separate houses (approximately 83%), followed
by townhouses (around 8%) and flats and units (6.5%). The proportion of townhouses in the Central SLA is
significantly higher than for the City of Greater Bendigo but slightly less than state-wide trends. The proportion of
townhouses in the Central SLA has increased significantly over the period 2001 to 2011, from 4.9% to 8.2% (+26
per annum). Over the same period, flats/units/apartments have proportionally declined in the SLA from 8.6% to
6.5% (-14 per annum).
A major discrepancy between the areas of comparison in this analysis was the much higher proportion of renters
in the Central SLA (38.5% at 2011) compared to the City of Greater Bendigo (26.1%) and Victoria (25.9%). The
proportion of those renting across all areas has been increasing over the period 2001 to 2011.
It should also be noted that there is a higher representation of lone person households in the Central SLA (32.9%)
compared to the City of Greater Bendigo (26%) and Victoria (23.5%). The proportion of lone person households
has risen across all locations over the past decade which may be a reflection of the ageing population.

Bendigo Hospital Precinct Structure Plan
Ref: M13038 FINAL DRAFT P a g e 28 | 74 Hill PDA
Comparatively, Central SLA also has a significantly lower proportion of family households compared to the two
other areas.
The Central SLA had a lower median weekly household income compared to both the City of Greater Bendigo and
Victoria at 2011. The rate of growth in median weekly household incomes between 2001 and 2011 was
consistent across all locations.
Figure 9 - Median Weekly Household Income (2001 to 2011)
Source: ABS Census Time Series Data (2011)
4.4 EMPLOYMENT AND WORKFORCE PROFILE
4.4.1 RESIDENT WORKFORCE BY OCCUPATION
The characteristics of a resident workforce are an important factor in defining a region’s employment strengths
and weaknesses. It is important to note that the resident workforce (or labour force) in many cases will travel
outside of the local government boundary to work.
At 2011 there were approximately 7,740 working residents in the Central SLA. The most common occupations of
residents were professionals (21%), technicians and trade workers (15%) and labourers (13%). There was a
similar occupational breakdown for the City of Greater Bendigo and Victoria, however both had a higher
concentration of clerical and administrative workers. The proportion of professional workers has been steadily
increasing over the period 2001 to 2011 across all locations.
4.4.2 RESIDENT WORKFORCE BY INDUSTRY
At 2011, health care and social assistance was easily the largest employing industry for residents within the
Central SLA (17.5% of all working residents). Other significant employing industries for residents in the SLA
included retail trade (12.5%) and manufacturing (10%).
Not only is health care and social assistance the largest employer of residents in the SLA, it has also been one of
the fastest growing industries of employment (+31% between 2001 and 2011). This growth was only outstripped
by mining, electricity, gas, water and waste services and construction.

Bendigo Hospital Precinct Structure Plan
Ref: M13038 FINAL DRAFT P a g e 29 | 74 Hill PDA
By comparison, the number of working residents in the following industries has declined: information, media and
telecommunication services (-56% between 2001 and 2011), wholesale trade (-36%), agriculture, forestry and
fishing (-30%), and manufacturing (-21%). Manufacturing has also experienced the greatest decline in number of
working residents over the period (-205). The total number of working residents in the SLA grew by 515 (or around
7%) over the period 2001 and 2011.
Table 7 - Central SLA Industry of Employment (2001-2011)
Industry of Employment 2001 2006 2011 Change
2001-2011 Proportional
Change 2001-2011
Agriculture, forestry and fishing 135 105 95 -40.0 -30%
Mining 19 86 67 48.0 253%*
Manufacturing 977 891 772 -205.0 -21%
Electricity, gas, water and waste services 66 77 102 36.0 55%
Construction 482 579 696 214.0 44%
Wholesale trade 302 238 194 -108.0 -36%
Retail trade 977 971 967 -10.0 -1%
Accommodation and food services 540 579 569 29.0 5%
Transport, postal and warehousing 196 212 255 59.0 30%
Information media and telecommunications 245 232 108 -137.0 -56%
Financial and insurance services 196 259 266 70.0 36%
Rental, hiring and real estate services 66 61 78 12.0 18%
Professional, scientific and technical services 287 267 313 26.0 9%
Administrative and support services 239 210 252 13.0 5%
Public administration and safety 373 470 458 85.0 23%
Education and training 531 606 665 134.0 25%
Health care and social assistance 1,040 1,162 1,358 318.0 31%
Arts and recreation services 107 87 100 -7.0 -7%
Other services 317 262 282 - 35.0 -11%
Inadequately described/Not stated 128 165 141 13.0 10%
Total 7,223 7,519 7,738 515 7%
* It is noted that since the 2011 Census, Unity Mine at Henty has gone into sleeper arrangement and closure and this would have impacted on mining employment figures since that time.
Source: ABS Census Time Series Data (2011)
4.4.3 JOB CONTAINMENT AND HEALTH CARE WORKER TRENDS
Journey to work data as compiled by the ABS18 uses employment counts for specific locations to analyse industry
trends and methods of travel to work. The results indicate the City provides a total of 37,915 jobs, whilst
accommodating 45,749 resident workers at 2011. Hence the City is a net exporter of workers with 7,834
residents leaving the City for employment. Mount Alexander and Melbourne LGAs were the most common
destinations for employment for working Bendigo residents.
The journey to work data also indicates where those that work in the City of Greater Bendigo live. The analysis
shows that approximately 7.4% of workers (2,820 persons) reside beyond the City, most commonly in the
surrounding LGAs of Mount Alexander, Loddon and Macedon Ranges.19 Of those that work in Bendigo but live
beyond the City, 20% or 567 are employed in the health care and social assistance sector. This is around 9% of
all jobs in this sector in the City of Greater Bendigo.
19 City of Greater Bendigo Community Profile, .id Consulting (2013)

Bendigo Hospital Precinct Structure Plan
Ref: M13038 FINAL DRAFT P a g e 30 | 74 Hill PDA
The following table identifies where those that work in the health care and social assistance sector in the City of
Greater Bendigo reside.
Table 8 - City of Greater Bendigo: Health Care & Social Assistance Workers (2011)
Place of Usual Residence (LGA) No. Workers Proportion of Total
Greater Bendigo 5,914 90.8%
Mount Alexander 218 3.3%
Loddon 75 1.2%
Campaspe 44 0.7%
Macedon Ranges 34 0.5%
Boroondara 21 0.3%
Other 205 3.1%
Total Workers 6,511 100%
*Count of employed persons aged 15 years and over (excludes overseas visitors). Source: ABS, Journey to work, REMPLAN Copy, (2011)
The analysis indicates that residents of Mount Alexander LGA fill the greatest number of Health Care and Social
Assistance jobs in the City of Greater Bendigo (excluding residents of the City of Greater Bendigo).
Other surrounding LGAs including Loddon and Campaspe also had a significant number of residents working in
the health care and social assistance sector within the City of Greater Bendigo. Interestingly, the inner urban
Melbourne LGA of Boroondara had the 6 th highest number of residents working in health care and social
assistance in Bendigo. This indicates that health care facilities in Bendigo, including the Bendigo Hospital, attract
workers from a wide regional base that includes some parts of Melbourne.
4.4.4 UNEMPLOYMENT
Unemployment within the Greater Bendigo – Central SLA declined from 11.4% to 6.8% over the 2001 to 2011
period. The 2011 unemployment rate is higher than that found in the City of Greater Bendigo (5.3%) and Victoria
(5.4%).

Bendigo Hospital Precinct Structure Plan
Ref: M13038 FINAL DRAFT P a g e 31 | 74 Hill PDA
5. RESIDENTIAL AND ACCOMMODATION MARKET This Chapter examines supply and demand for residential dwellings in the City of Greater Bendigo based on an
examination of Council’s 2004 Residential Development Strategy (RDS)20, as well as through discussions with
local agents and developers. As part of the continuing monitoring and assessment process, the RDS is currently
undergoing a review which has incorporated a Land Audit (2011) and Land Supply and Demand Assessment
(2013) which have also informed this Chapter.
This Chapter also examines the different residential product types and markets prevalent in Bendigo including
reference to the short-term accommodation and student housing markets, which may also influence the potential
for residential development around the Bendigo Hospital.
5.1 RESIDENTIAL DWELLING DEVELOPMENT TRENDS
5.1.1 DWELLING APPROVALS IN THE CITY OF GREATER BENDIGO
Historically detached residential dwellings have predominated throughout the City of Greater Bendigo. The Land
Supply and Demand Assessment (2013) found that the vast majority of the 5,676 dwelling approvals that had
occurred between 2006 and 2012 and which had moved through to the construction phase (around 92%) had
been for detached dwellings. The remainder (around 8%) has been for medium density dwellings such as
townhouses and flats/units/apartments.21
Figure 10 - Residential Building Approvals by Dwelling Type (1996-2012)
Source: ABS Catalogue Number 8731.0 and Profile id (2013)
20 Bendigo Residential Development Strategy, Parsons Brinckerhoff (2004)
21 Bendigo Residential Development Strategy Review: Land Supply and Demand Assessment, City of Greater Bendigo (2013)

Bendigo Hospital Precinct Structure Plan
Ref: M13038 FINAL DRAFT P a g e 32 | 74 Hill PDA
To further note, minor lot construction (projects yielding less than 10 lots) accounted for 39% of all residential
development activity over the period, with major lot construction (projects yielding greater than 10 lots) accounting
for 49%. The following figure highlights lot construction by area in the City of Greater Bendigo.
Figure 11 - Average Residential Lots Constructed by Small Area Per Annum (2006-2012)
Source: Residential Development Strategy Review: Land Supply and Demand Assessment (2013)
Average residential lot construction in areas around the Hospital Precinct varied, with Golden Square having the
greatest quantum in the City (over 700 lots per annum), whilst Bendigo was toward the lower end of lot
construction during this period (around 150 lots per annum).
5.1.2 DEVELOPMENT TRENDS IN THE STUDY AREA AND SURROUNDS
The Study Area of the Bendigo Hospital Structure Plan is within a nominated core development area of the RDS.
The RDS forecast 950 additional dwellings (to accommodate 1,500 persons) in the core development areas of
Bendigo from 2004 to 2031. The Land Audit (2011) identified that just 16% of growth nominated for the core
development area had been completed since 2004.22
22 Bendigo Residential Development Strategy Review: Land Audit, City of Greater Bendigo (2011)
Bendigo Hospital Precinct Structure Plan
Ref: M13038 FINAL DRAFT P a g e 33 | 74 Hill PDA
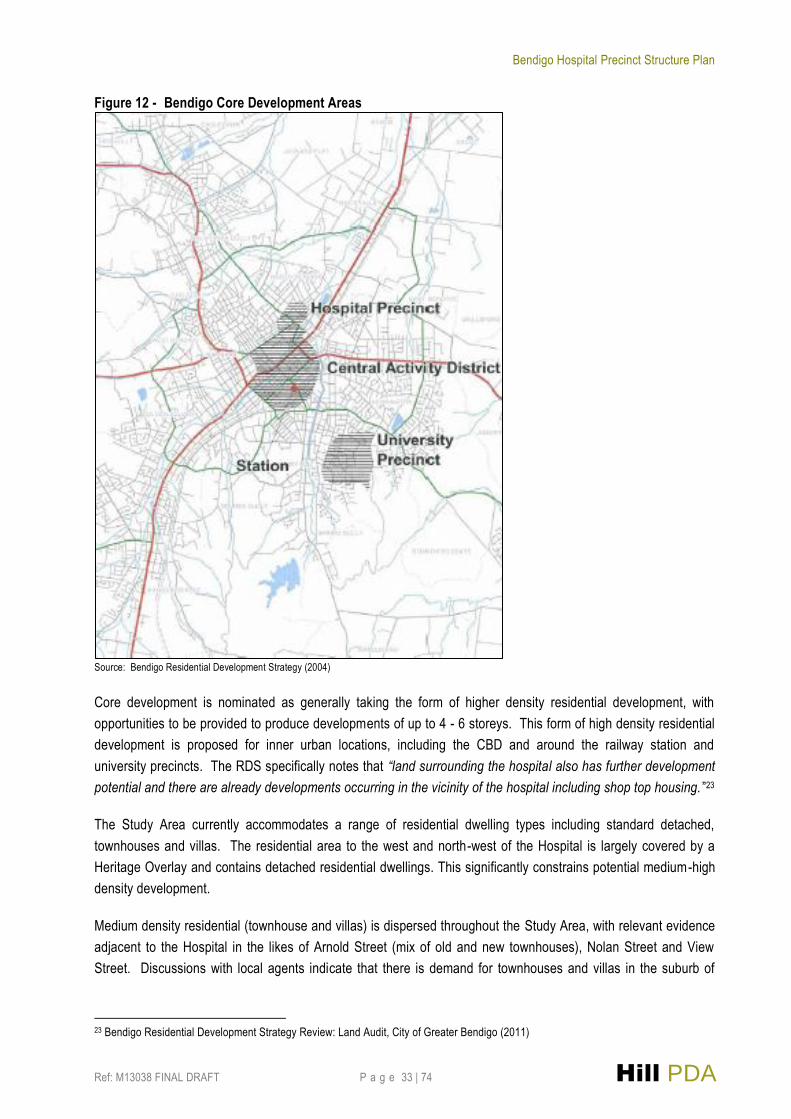
Figure 12 - Bendigo Core Development Areas
Source: Bendigo Residential Development Strategy (2004)
Core development is nominated as generally taking the form of higher density residential development, with
opportunities to be provided to produce developments of up to 4 - 6 storeys. This form of high density residential
development is proposed for inner urban locations, including the CBD and around the railway station and
university precincts. The RDS specifically notes that “land surrounding the hospital also has further development
potential and there are already developments occurring in the vicinity of the hospital including shop top housing. ”23
The Study Area currently accommodates a range of residential dwelling types including standard detached,
townhouses and villas. The residential area to the west and north-west of the Hospital is largely covered by a
Heritage Overlay and contains detached residential dwellings. This significantly constrains potential medium-high
density development.
Medium density residential (townhouse and villas) is dispersed throughout the Study Area, with relevant evidence
adjacent to the Hospital in the likes of Arnold Street (mix of old and new townhouses), Nolan Street and View
Street. Discussions with local agents indicate that there is demand for townhouses and villas in the suburb of
23 Bendigo Residential Development Strategy Review: Land Audit, City of Greater Bendigo (2011)

Bendigo Hospital Precinct Structure Plan
Ref: M13038 FINAL DRAFT P a g e 34 | 74 Hill PDA
Bendigo which has been reflected in many local developers purchasing older dilapidated houses on large blocks
for 2-3 lot subdivisions. The 2011 Audit Report and 2013 Land Supply and Demand Assessment indicated that
more than 30% of the annual net lots created in the City since 2004 have been ‘minor infill’ lots (less than 4 lot
subdivisions) which is reported to be creating improved efficiencies for services, infrastructure and land use. This
trend is likely to continue over the long-term as the population ages and elderly residents seek to move to smaller
dwellings which are close to services and community activity.
Figure 13 - Recent Townhouse Development in the Study Area
83-87 Arnold Street
232 View Street Bendigo
Source: Hill PDA and Cordell Connect (2013)
There are no examples of higher density residential development (e.g. 4-6 level apartment buildings) in the Study
Area. There is a development application for the construction of a 5 storey apartment building comprising 18
apartments and a small office component at 71-75 Bridge Street approximately 500 meters south-east from the
Bendigo Hospital campus. However, it is understood that the development has been put on hold.
Other significant proposals include:
Approval has been granted for a 4 storey apartment building comprising 12 units at 23 Wills Street
approximately 2.5km south of the Bendigo Hospital Precinct and 1km from the Study Area border. The
building also comprises a retail and office component.
In addition to the above, applications for the subdivision of lots have become increasingly common in the Study
Area with approximately 25 having been assessed by Council from 2012 onwards. The following figure shows
where applications for all subdivision has occurred in the Study Area.

Bendigo Hospital Precinct Structure Plan
Ref: M13038 FINAL DRAFT P a g e 35 | 74 Hill PDA
Figure 14 - Vacant and Existing and Proposed Subdivided Lots in the Study Area
Source: City of Greater Bendigo and Hill PDA (2013)
Despite a lack of construction, there have been an increasing number of higher density development proposals in
the suburb of Bendigo, which suggests developer interest in less traditional dwelling forms including shop-top
apartments (particularly in the CBD and high amenity areas) and multi-unit developments. Consultation sessions
held during the Structure Plan process noted:
Demand and acceptance for higher density dwelling forms were slowly but steadily increasing in and
around central Bendigo with dwelling demand largely being driven by those seeking a more urban
lifestyle;
There was concern that high density residential would have a negative impact on traffic, amenity and the
streetscape of the local area around the Hospital, with multi-level development also potentially restricting
valuable view lines (particularly for those dwellings north of the Hospital); and
The need for planning to guide how further development of established residential sites around the
Hospital can occur. Small scale medium density is suitable in the short-term (perhaps as units at the
back of larger lots) with higher density over the longer-term. It was also noted however that this form of
development can lead to poor urban amenity and design outcomes.
Bendigo Hospital Precinct Structure Plan
Ref: M13038 FINAL DRAFT P a g e 36 | 74 Hill PDA
Potential areas for higher density residential development were identified during the Structure Plan consultation
sessions, including:
Barnard Street which has potential for high density mixed use development given its ability to overlook
Rosalind Park;
The triangular area between Barnard Street and Bridge Street;
Land between Bayne and Nolan Streets which are not subject to heritage constraints and there have
been a number of recent development applications in this area;
Larger blocks on Flood Street which could be suitable for residential infill.
Hill PDA research also indicates that there is substantial investment in aged care facilities within the City of
Greater Bendigo. A 120 bed facility in Golden Square was completed in 2011, approximately 4km south-west of
Bendigo and an additional 3 aged care facilities have projected completion dates between mid-2013 and late
2014. These projects comprise a total of 460 aged care units24. Proposed aged care developments in the City of
Greater Bendigo are provided in the following table.
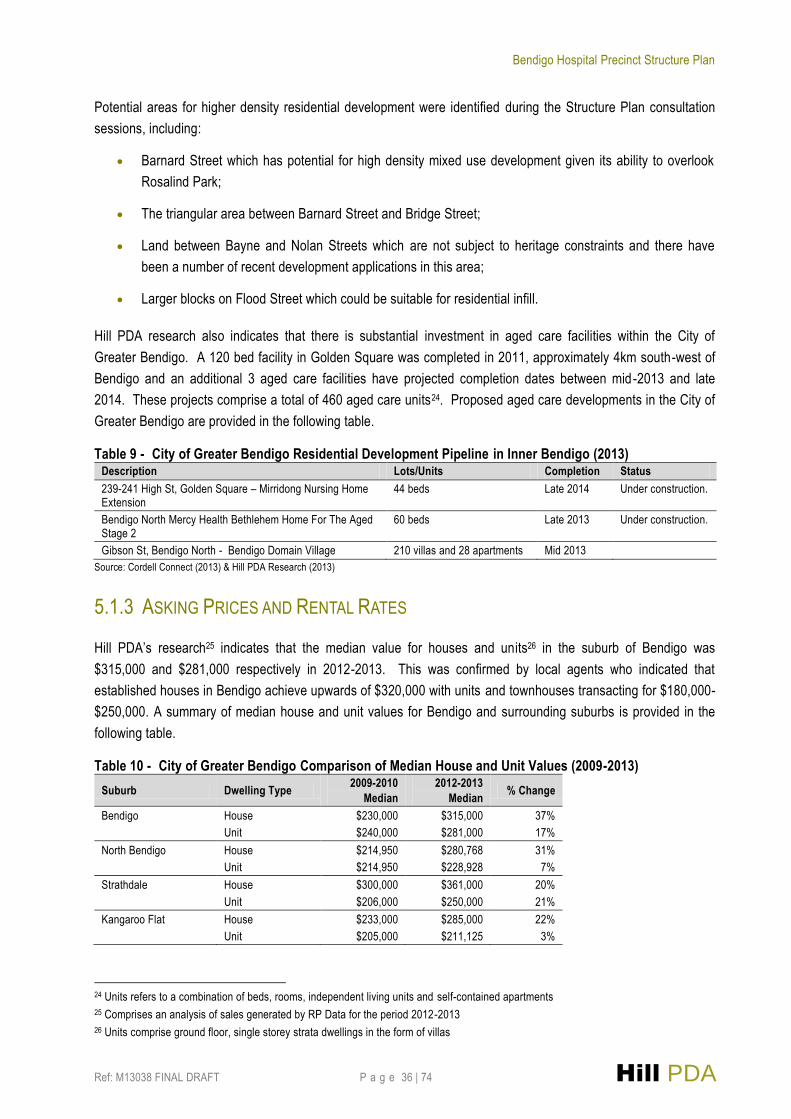
Table 9 - City of Greater Bendigo Residential Development Pipeline in Inner Bendigo (2013) Description Lots/Units Completion Status
239-241 High St, Golden Square – Mirridong Nursing Home Extension
44 beds Late 2014 Under construction.
Bendigo North Mercy Health Bethlehem Home For The Aged Stage 2
60 beds Late 2013 Under construction.
Gibson St, Bendigo North - Bendigo Domain Village 210 villas and 28 apartments Mid 2013
Source: Cordell Connect (2013) & Hill PDA Research (2013)
5.1.3 ASKING PRICES AND RENTAL RATES
Hill PDA’s research25 indicates that the median value for houses and units26 in the suburb of Bendigo was
$315,000 and $281,000 respectively in 2012-2013. This was confirmed by local agents who indicated that
established houses in Bendigo achieve upwards of $320,000 with units and townhouses transacting for $180,000-
$250,000. A summary of median house and unit values for Bendigo and surrounding suburbs is provided in the
following table.
Table 10 - City of Greater Bendigo Comparison of Median House and Unit Values (2009-2013)
Suburb Dwelling Type 2009-2010
Median
2012-2013
Median % Change
Bendigo House $230,000 $315,000 37%
Unit $240,000 $281,000 17%
North Bendigo House $214,950 $280,768 31%
Unit $214,950 $228,928 7%
Strathdale House $300,000 $361,000 20%
Unit $206,000 $250,000 21%
Kangaroo Flat House $233,000 $285,000 22%
Unit $205,000 $211,125 3%
24 Units refers to a combination of beds, rooms, independent living units and self-contained apartments
25 Comprises an analysis of sales generated by RP Data for the period 2012-2013
26 Units comprise ground floor, single storey strata dwellings in the form of villas
Bendigo Hospital Precinct Structure Plan
Ref: M13038 FINAL DRAFT P a g e 37 | 74 Hill PDA
Suburb Dwelling Type 2009-2010
Median
2012-2013
Median % Change
Jackass Flat House $247,125 $371,000 50%
Unit $208,625 $230,000 10%
Marong House $219,000 $312,500 43%
Strathfieldsaye House $315,000 $360,000 14%
Ballarat House $227,000 $316,000 39%
Unit $220,500 $256,000 16%
Source: RP Data (2013) & Hill PDA Research (2013)
Hill PDA’s research indicates that over the 4 years from 2009 to 2013, Bendigo experienced positive residential
house price growth, with houses experiencing 37% and units experiencing 17% growth27. This trend is in-line with
the findings of the Land Audit which found house prices had more than doubled in all parts of Bendigo over the
previous decade. Given the redevelopment of Bendigo Hospital, agents also anticipate that there will be stronger
growth in property values and rental rates in the future.
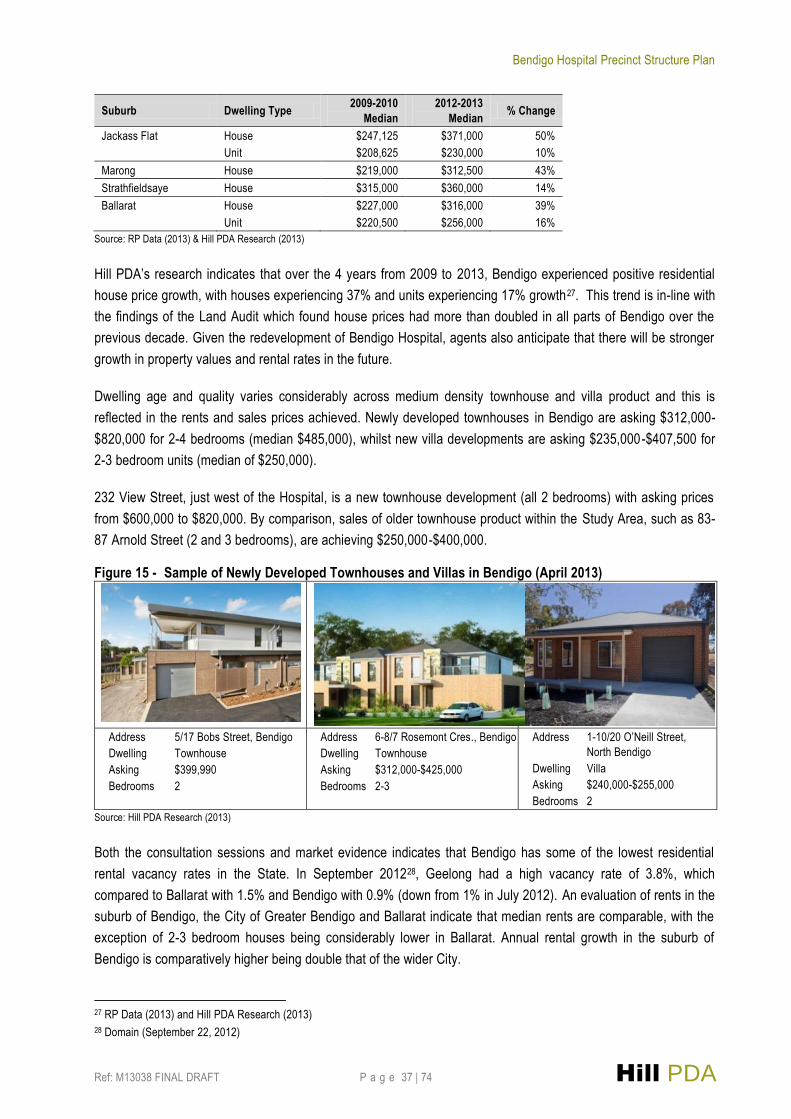
Dwelling age and quality varies considerably across medium density townhouse and villa product and this is
reflected in the rents and sales prices achieved. Newly developed townhouses in Bendigo are asking $312,000-
$820,000 for 2-4 bedrooms (median $485,000), whilst new villa developments are asking $235,000-$407,500 for
2-3 bedroom units (median of $250,000).
232 View Street, just west of the Hospital, is a new townhouse development (all 2 bedrooms) with asking prices
from $600,000 to $820,000. By comparison, sales of older townhouse product within the Study Area, such as 83-
87 Arnold Street (2 and 3 bedrooms), are achieving $250,000-$400,000.
Figure 15 - Sample of Newly Developed Townhouses and Villas in Bendigo (April 2013)
Address 5/17 Bobs Street, Bendigo
Dwelling Townhouse
Asking $399,990
Bedrooms 2
Address 6-8/7 Rosemont Cres., Bendigo
Dwelling Townhouse
Asking $312,000-$425,000
Bedrooms 2-3
Address 1-10/20 O’Neill Street,
North Bendigo
Dwelling Villa
Asking $240,000-$255,000
Bedrooms 2
Source: Hill PDA Research (2013)
Both the consultation sessions and market evidence indicates that Bendigo has some of the lowest residential
rental vacancy rates in the State. In September 201228, Geelong had a high vacancy rate of 3.8%, which
compared to Ballarat with 1.5% and Bendigo with 0.9% (down from 1% in July 2012). An evaluation of rents in the
suburb of Bendigo, the City of Greater Bendigo and Ballarat indicate that median rents are comparable, with the
exception of 2-3 bedroom houses being considerably lower in Ballarat. Annual rental growth in the suburb of
Bendigo is comparatively higher being double that of the wider City.
27 RP Data (2013) and Hill PDA Research (2013)
28 Domain (September 22, 2012)

Bendigo Hospital Precinct Structure Plan
Ref: M13038 FINAL DRAFT P a g e 38 | 74 Hill PDA
Table 11 - City of Greater Bendigo Residential Rental Comparison (September Qtr 2013)
Area
1br Unit 2br Unit 2br House 3br House
Median Annual Change
Median Annual Change
Median Annual Change
Median Annual Change
City of Greater Bendigo $160 6.70% $230 2.20% $240 0.00% $290 3.60%
Bendigo Suburb $165 10.00% $220 4.80% $260 4.00% $290 7.40%
Ballarat Suburb $155 10.70% $220 0.00% $235 2.20% $265 1.90%
Source: Department of Human Services, Rental Report (September Quarter 2012)
Even without construction having commenced at the Hospital, there is increasing pressure on residential supply
and strong latent demand for housing in Bendigo. The lack of adequate stock in the market is increasing rental
values. Unless there is a significant upswing in the supply of housing in Bendigo, rents and sales prices will
increase further which could place rental pressure on some residential markets such as students and key workers
(e.g. nurses). This was confirmed through discussions with local agents who indicated that the market is notably
stronger in 2013, with a continual need for housing stock evidenced by faster housing turn over and stronger
investor interest.
5.1.4 FORECAST RESIDENTIAL DWELLINGS
As part of this Technical Assessment, Hill PDA has reviewed residential dwelling forecasts prepared by both .id
Consulting (2011) and Victoria in Future (VIF 2012). Both projections estimated the City of Greater Bendigo
accommodated around 44,000 private dwellings in 2011. This is as compared to the ABS Census which indicated
the City accommodated 39,638 dwellings.
The City of Greater Bendigo is forecast to accommodate between 61,000 and 63,000 dwellings by 2031. This
represents growth of 1.61% to 1.80% or an additional 841 to 947 dwellings per annum. This is in line with
historical growth patterns which have indicated the City has achieved around 946 dwelling approvals per annum
since 200629.
Given the above projections are for the broader City, Hill PDA prepared dwelling forecasts for the Central SLA
which encompasses the Study Area. Forecasts have been prepared based on ABS 2011 Census data with the
application of residential growth rates provided by .id Consulting for comparison small areas (including Bendigo,
Golden Square, North Bendigo-California Gully and Long Gully-West Bendigo-Ironbark).
Table 12 - Forecast Residential Dwelling Change to 2031 Comparison Area Central SLA City of Greater Bendigo
Source: Hill PDA .id Consulting VIF
2011 7,643 43,926 44,045
2016 8,073 48,182 48,323
2021 8,775 52,631 53,146
2026 9,247 56,781 58,107
2031 9,495 60,742 62,977
Growth 2011-2031 1,844 15,180 17,221
Av. Annual Growth 1.1% 1.6% 1.8%
Source: .id Consulting Dwelling Projections (2011), Victoria In Future Dwelling Projections (2012)
and Hill PDA (2013)
29 Bendigo Residential Development Strategy Review: Land Supply and Demand Assessment, City of Greater Bendigo (2013)
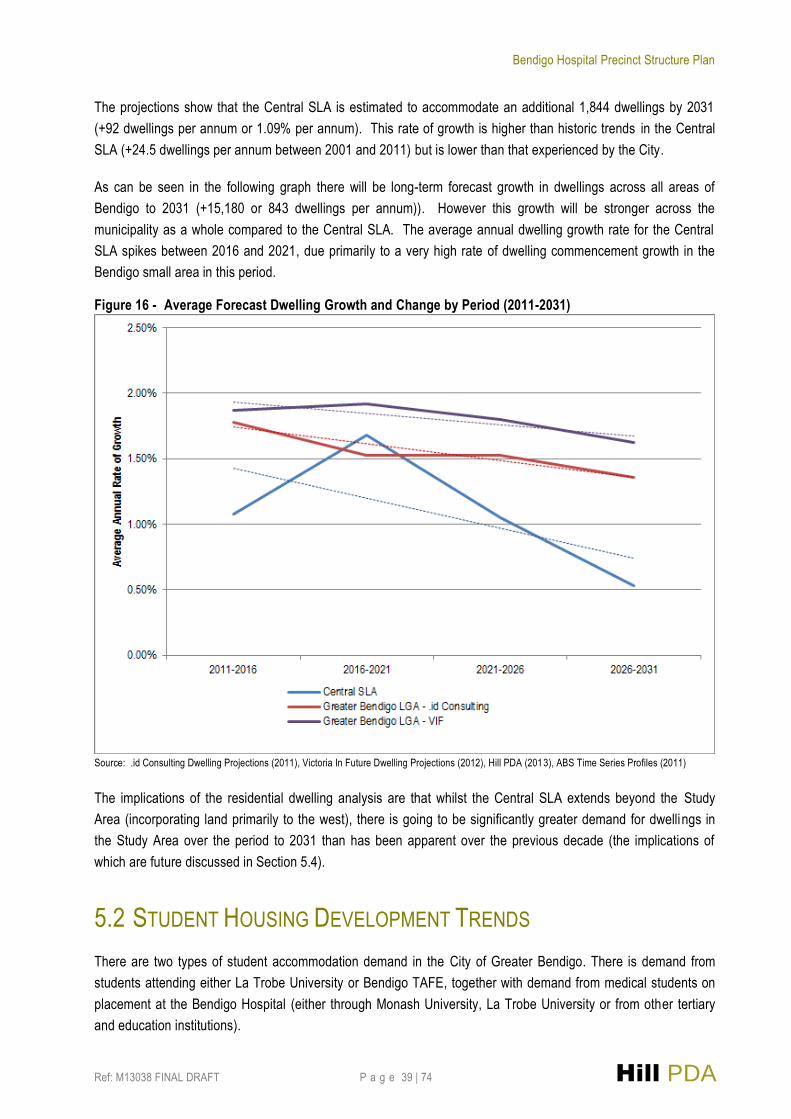
Bendigo Hospital Precinct Structure Plan
Ref: M13038 FINAL DRAFT P a g e 39 | 74 Hill PDA
The projections show that the Central SLA is estimated to accommodate an additional 1,844 dwellings by 2031
(+92 dwellings per annum or 1.09% per annum). This rate of growth is higher than historic trends in the Central
SLA (+24.5 dwellings per annum between 2001 and 2011) but is lower than that experienced by the City.
As can be seen in the following graph there will be long-term forecast growth in dwellings across all areas of
Bendigo to 2031 (+15,180 or 843 dwellings per annum)). However this growth will be stronger across the
municipality as a whole compared to the Central SLA. The average annual dwelling growth rate for the Central
SLA spikes between 2016 and 2021, due primarily to a very high rate of dwelling commencement growth in the
Bendigo small area in this period.
Figure 16 - Average Forecast Dwelling Growth and Change by Period (2011-2031)
Source: .id Consulting Dwelling Projections (2011), Victoria In Future Dwelling Projections (2012), Hill PDA (2013), ABS Time Series Profiles (2011)
The implications of the residential dwelling analysis are that whilst the Central SLA extends beyond the Study
Area (incorporating land primarily to the west), there is going to be significantly greater demand for dwellings in
the Study Area over the period to 2031 than has been apparent over the previous decade (the implications of
which are future discussed in Section 5.4).
5.2 STUDENT HOUSING DEVELOPMENT TRENDS
There are two types of student accommodation demand in the City of Greater Bendigo. There is demand from
students attending either La Trobe University or Bendigo TAFE, together with demand from medical students on
placement at the Bendigo Hospital (either through Monash University, La Trobe University or from other tertiary
and education institutions).

Bendigo Hospital Precinct Structure Plan
Ref: M13038 FINAL DRAFT P a g e 40 | 74 Hill PDA
Over 500 students can be accommodated on-campus at La Trobe Bendigo in a range of terraces, villas and
apartments including:
Hillside Apartments - new in 2012, Hillside has the capacity to accommodate 200 students with 60 beds
guaranteed to students of the La Trobe Rural Health School. Hillside comprises 6 three-storey
residences configured in 12 bedroom units.
Order House – mainly catering for mature-age students and accommodates 24 self-catered single rooms.
Terraces – 168 self-catered rooms for a mix of international, interstate, rural and metropolitan students.
Units – 108 self-catered rooms for predominately undergraduate students.
Villas – 28 furnished villas accommodating 112 rooms for second, third year and postgraduate students.
Off-campus accommodation is also provided by way of share housing, private boarding, private rentals, short -term
accommodation (e.g. whilst on placement), and student hostels.
It is anticipated that the new La Trobe Rural Health School will significantly increase demand for student
accommodation given its recent expansion. The redeveloped School will be able to provide for up to 750
additional students. Some of these students are likely to reside at the La Trobe Flora Hill campus, however there
will be many more that are likely to seek accommodation in close proximity to the School and surrounds.
This increase in demand will put pressure on rental housing, particularly privately rented group housing for
university students (e.g. 3 bedroom houses) in close proximity of the Hospital. With already increasing residential
rents in Bendigo, unless additional housing is provided within the Study Area, it is likely that this market will locate
outside of the Study Area in more affordable accommodation.
This leads into the further issue of being able to provide affordable short-term accommodation for students on
medical placement. Rural and regional placements provide medical students with a period of training or work,
which according to the Australian Medical Association is generally less than 12 months in duration and can be
anything from two weeks to three months. Those that take a placement are able to gain clinical experience in
community-based settings that are not as readily available in the city teaching hospital environment.
In recognition of the fact that many medical students who take up rural and regional placements continue to
maintain their usual place of residence, universities and many health districts often provide and/or subsidise
accommodation whilst on placement to ease the cost of living. In some instances the cost of accommodation is
waived altogether. The extent of the subsidy depends on individual placement agreements, individual agreements
between hospitals and universities, and whether the medical student or professional has received any previous
grants or is part of any relocation scheme. In some cases, this subsidy is still not a big enough incentive to
encourage a rural/regional placement. Of particular note:
Bendigo Health currently provides allied health students with accommodation in the Pethard building
within the Hospital Precinct (at a rate of $15/night or $70/week)30.
30 Information for Students Commencing Placement at Bendigo Health, Allied Health, Bendigo Health (2012)

Bendigo Hospital Precinct Structure Plan
Ref: M13038 FINAL DRAFT P a g e 41 | 74 Hill PDA
Students from the University of Melbourne are integrated into the Monash University Regional Clinical
School and study alongside Monash University students whilst in Bendigo. For students from Monash
and the University of Melbourne, fully subsidised accommodation is provided at either Lister House
(corner of Wattle and Rowan Street’s just west of the Study Area boundary) or in one of Monash’s rental
properties all of which are located within walking distance of the School and Hospital.
If accommodation cannot be provided through Bendigo Health or the University, students on placement must
arrange their own accommodation. This places the students in direct competition with the likes of visiting medical
specialists, business visitors and general tourists for short-term and temporary accommodation in Bendigo.
5.3 SHORT-TERM ACCOMMODATION DEVELOPMENT TRENDS
There are few accommodation providers within the Study Area itself. However, there are significant clusters of
accommodation just beyond this area including south of Bridge Street, south of Lake Weeroona and particularly
along View Street between Barnard Street and Midland Highway.
Short-term accommodation (e.g. hotels and motels) is spread throughout the Study Area itself as indicated in the
following map.
Figure 17 - Location of Accommodation Providers in Bendigo (2013)
Source: Bendigo Tourism (www.bendigotourism.com)
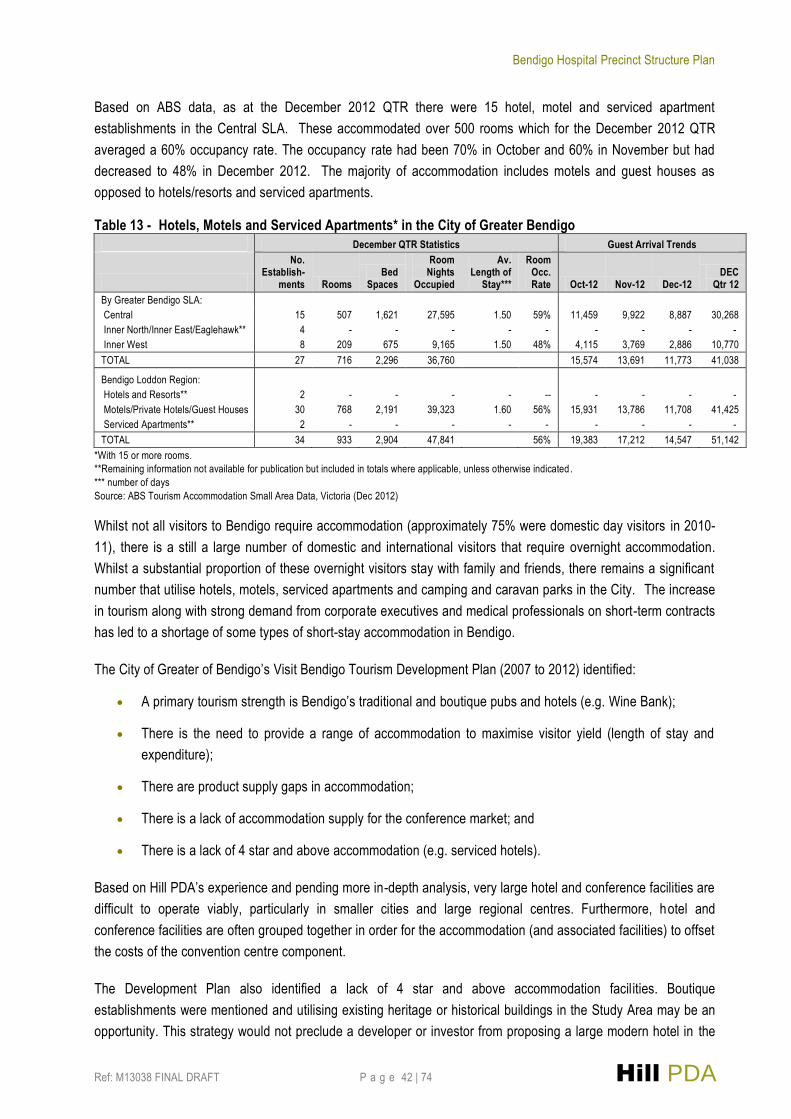
Bendigo Hospital Precinct Structure Plan
Ref: M13038 FINAL DRAFT P a g e 42 | 74 Hill PDA
Based on ABS data, as at the December 2012 QTR there were 15 hotel, motel and serviced apartment
establishments in the Central SLA. These accommodated over 500 rooms which for the December 2012 QTR
averaged a 60% occupancy rate. The occupancy rate had been 70% in October and 60% in November but had
decreased to 48% in December 2012. The majority of accommodation includes motels and guest houses as
opposed to hotels/resorts and serviced apartments.
Table 13 - Hotels, Motels and Serviced Apartments* in the City of Greater Bendigo
December QTR Statistics Guest Arrival Trends
No. Establish-
ments Rooms Bed
Spaces
Room Nights
Occupied
Av. Length of
Stay***
Room Occ. Rate Oct-12 Nov-12 Dec-12
DEC Qtr 12
By Greater Bendigo SLA:
Central 15 507 1,621 27,595 1.50 59% 11,459 9,922 8,887 30,268
Inner North/Inner East/Eaglehawk** 4 - - - - - - - - -
Inner West 8 209 675 9,165 1.50 48% 4,115 3,769 2,886 10,770
TOTAL 27 716 2,296 36,760 15,574 13,691 11,773 41,038
Bendigo Loddon Region:
Hotels and Resorts** 2 - - - - -- - - - -
Motels/Private Hotels/Guest Houses 30 768 2,191 39,323 1.60 56% 15,931 13,786 11,708 41,425
Serviced Apartments** 2 - - - - - - - - -
TOTAL 34 933 2,904 47,841 56% 19,383 17,212 14,547 51,142
*With 15 or more rooms.
**Remaining information not available for publication but included in totals where applicable, unless otherwise indicated.
*** number of days
Source: ABS Tourism Accommodation Small Area Data, Victoria (Dec 2012)
Whilst not all visitors to Bendigo require accommodation (approximately 75% were domestic day visitors in 2010-
11), there is a still a large number of domestic and international visitors that require overnight accommodation.
Whilst a substantial proportion of these overnight visitors stay with family and friends, there remains a significant
number that utilise hotels, motels, serviced apartments and camping and caravan parks in the City. The increase
in tourism along with strong demand from corporate executives and medical professionals on short-term contracts
has led to a shortage of some types of short-stay accommodation in Bendigo.
The City of Greater of Bendigo’s Visit Bendigo Tourism Development Plan (2007 to 2012) identified:
A primary tourism strength is Bendigo’s traditional and boutique pubs and hotels (e.g. Wine Bank);
There is the need to provide a range of accommodation to maximise visitor yield (length of stay and
expenditure);
There are product supply gaps in accommodation;
There is a lack of accommodation supply for the conference market; and
There is a lack of 4 star and above accommodation (e.g. serviced hotels).
Based on Hill PDA’s experience and pending more in-depth analysis, very large hotel and conference facilities are
difficult to operate viably, particularly in smaller cities and large regional centres. Furthermore, hotel and
conference facilities are often grouped together in order for the accommodation (and associated facilities) to offset
the costs of the convention centre component.
The Development Plan also identified a lack of 4 star and above accommodation facilities. Boutique
establishments were mentioned and utilising existing heritage or historical buildings in the Study Area may be an
opportunity. This strategy would not preclude a developer or investor from proposing a large modern hotel in the

Bendigo Hospital Precinct Structure Plan
Ref: M13038 FINAL DRAFT P a g e 43 | 74 Hill PDA
Study Area. Furthermore, identifying a potential site for such a development is appropriate, however preserving a
site within the Study Area for the sole purpose of a new hotel at the expense of other uses is not advised.
Serviced apartments are popular with corporations, particularly if the stay is for a longer duration as it eliminates
the service charges associated with a hotel. Main operators in Bendigo are Quest. Quest is generally rated in the
4 star category, which is also a mandate for many corporations.
The last short-term accommodation development completed in Bendigo was the Quest Serviced Apartment at 228
McCrae Street (south of the Study Area) which comprises 39 serviced apartments and a conference centre. This
development likely satisfies some of the strong demand for serviced executive accommodation which was
highlighted at the consultation sessions.
Whilst there has not been any development since the Quest serviced apartments, a local developer has acquired
the old advertising building on 96-98 Pall Mall Street and proposes to construct a 5-star, 20 suite hotel. The site
at 202 Hargreaves Street has also been acquired with plans to build a 40 suite hotel. Details of both projects are
unconfirmed.
5.4 IMPLICATIONS
The Bendigo Hospital redevelopment proposes 128 serviced apartments on-campus which will be open to
patients, families and visiting physicians. Bendigo Health is also developing apartments at 10 Atkins Street and 2
Hunt Street in Bendigo North which will comprise 120 self-contained apartments including 96 single bedroom and
24 double bedroom apartments, which are intended to cater to medical staff. The accommodation is expected to
cover 90% of doctors on rotation, however it is expected that Bendigo Health will still be renting around 15
residential units for doctor’s with families and children31. Bendigo Heath currently own a number of properties that
they rent back to staff and they also have some student accommodation, however demand often outstrips supply.
Construction of the new Hospital is anticipated to be complete in 2016 and will generate more than 770
construction industry and supply chain jobs, with at least 300 jobs maintained for a minimum of three years during
the peak construction period of the Hospital32. These workers will have a significant impact on demand for short-
stay accommodation in Bendigo given they are expected to travel in from elsewhere for the duration of the project.
This increased level of demand is likely to lead to exacerbation of existing shortages in short -stay accommodation
in Bendigo. It may also lead to longer-term housing demand from workers and their families that decide to stay in
Bendigo following the completion of the project in 2016.
It is also likely that this short-term accommodation demand from construction workers will be replaced by demand
from new workers and health professionals who will work at the Hospital in the medium to longer term.
The estimates of increased staff within the Bendigo Hospital Precinct does not take into account potential growth
in allied health professionals located off campus, but within the Study Area, leveraging off the Hospital
31 David Walker, Executive Director, New Bendigo Hospital Project, Buildings & Infrastructure (May 2013)
32 www.newbendigohospital.org.au 31.05.2013
Bendigo Hospital Precinct Structure Plan
Ref: M13038 FINAL DRAFT P a g e 44 | 74 Hill PDA
redevelopment. These health professionals will require both commercial space in which to operate as well as
residences to live.
There are other consequences from the Hospital redevelopment which are also likely to increase demand in the
Study Area for a range of residential accommodation needs. The La Trobe University Rural Health School
opened up their expanded campus within the Hospital Precinct in March 2013 with capacity for an additional 750
student places annually33. These additional students will also require accommodation which will not be able to be
fully met by the University and Hospital.
Whilst the Study Area may accommodate only a portion of the additional 1,844 dwellings forecast in the Central
SLA to 2031, the process of accommodating these dwellings may result in the creation of more med ium density
housing stock given the lack of vacant sites and heritage constraints. There is likely to be demand for more
medium density housing over the long-term as the population in the Study Area and surrounds ages and the
elderly seek to move into smaller dwellings that are located close to services, shops and community infrastructure.
Heritage overlays are the primary constraint to residential development in the Bendigo Hospital Structure Plan
Study Area. They limit the ability to develop medium density residential activity given the need to protect and
conserve characteristics which significantly contribute to the significance of heritage places and buildings. As
such, permits are required for almost all building activity, with substantial alterations to existing development in
these areas strictly monitored.
Over and above heritage constraints, there are three main limitations to higher density residential development in
Bendigo including:
Existing residential lot patterns;
The availability of residential land on the fringe (i.e. greenfield release areas); and
Changes to Victorian planning zones.
One of the significant threats to the success of higher density residential developments in the Study Area will be
residential lot subdivisions on the fringe of Bendigo, which are not only affordable but are still within relative
proximity (5-10 minute drive) of Bendigo CBD.
Within the 2004 RDS, the Bendigo urban fringe (including growth areas in Huntly, Jackass Flat, Strathfieldsaye
and Maiden Gully North East) is highlighted as having significant dwelling growth potential compared to the core
development areas, which includes the area around the Hospital Precinct. These new development areas are
likely to be more cost effective to develop than the core development areas, providing for a more affordable
housing product.
Local agents indicated house and land packages within 5km of Bendigo achieve $280,000-$320,000. Hill PDA’s
examination of this market indicates that the suburbs of Eaglehawk, Strathdale, Junortoun, Epsom, Quarry Hill
and Jackass Flat all provide house and land packages between $287,000-$335,000 for 3-4 bedroom homes. By
comparison, new townhouses in the Study Area are asking upwards of $300,000 and can be as much as
$800,000.
33 http://www.bendigoweekly.com/news/health-care-has-a-training-boost (accessed 22.05.2013)

Bendigo Hospital Precinct Structure Plan
Ref: M13038 FINAL DRAFT P a g e 45 | 74 Hill PDA
In comparison to fringe areas, Bendigo has a finite supply of large sites within close proximity of the CBD and/or
within the Study Area. Furthermore, there is a predominance of small lots and highly fragmented ownership, both
of which contribute to costly amalgamation.
However, there are some underutilised sites or areas with large lots in and around the Study Area which would be
capable of amalgamation and redevelopment. This includes a large vacant block on the corner of Arnold and
Bridge Streets, as well as the northern half the block bounded by Smith, Dooley, Thunder and Stewart Streets.
Underutilised sites tend to include large blocks with minimal site building coverage. There are many examples of
this within the Study Area, particularly on Residential 1 Zone (RZ1) land bounded by Arnold Street, Smith Street,
Nolan Street and Barney Street immediately north-east of the Hospital Precinct. This area and other areas to the
south-east within the Study Area have already experienced some subdivision of larger lots.
Furthermore, the changes to the Victorian Planning system, including the reform of zones may act as a potential
constraint to residential development in the Study Area. Three new residential zones will come into effect on 1
July, 2013, including the Neighbourhood Residential Zone (NRZ), the General Residential Zone (GRZ) and the
Residential Growth Zone (RGZ).
In essence the NRZ will significantly restrict development with a maximum of two dwellings allowed on a lot, the
GRZ will allow some variation in residential development but will have a 9 metre height limit (except where
specified differently in a schedule to the zone) and the RGZ will promote medium and high density development.
The application of these new residential zones to the Study Area will either constrain or promote opportunities for
residential development in the Study Area to a significant degree.
Bendigo Hospital Precinct Structure Plan
Ref: M13038 FINAL DRAFT P a g e 46 | 74 Hill PDA
6. RETAIL AND COMMERCIAL MARKET This Chapter examines the market for retail and commercial accommodation in the City of Greater Bendigo based
on a review of Council’s Commercial Land Strategy (2005) and an assessment of demand for shopfront
floorspace based on resident, worker and visitor expenditure.
6.1 RETAIL AND COMMERCIAL DEVELOPMENT TRENDS
Over the past three decades significant changes have occurred in the retail industry such as the introduction of
new technologies, the ageing of the population, increased female participation in the workplace and changing
consumer preferences. As a result of changing lifestyle trends and retail formats, shoppers are increasingly
spending more on entertainment, technology and leisure related goods compared to traditional grocery and
clothing offers. Shoppers are also seeking a broader range of activities, with centres that provide both retail and
entertainment options including eating out, wine bars, cinemas and video game parlours increasingly popular.
Accordingly some of the key retail trends influencing the City of Greater Bendigo include:
The growing importance of convenience retailing including not only geographic proximity to the home but
the convenience of one stop shopping all times of the day or night which has resulted in the extension of
operating hours.
The development of larger (i.e. 4,000sqm+) supermarkets to include a wider range of food and non-food
items in addition to the emergence of smaller discount supermarkets (800 - 1,500sqm) such as ALDI.
Increasingly supermarkets are becoming the core or anchor for successful modern activity centres.
The development of out-of-town centres which are often characterised by bulky goods retailing and other
activities that require larger floor areas and lower rent structures than those found in traditional centres,
with the exception of Bendigo Marketplace, which located at the southern fringe of the Bendigo CBD.
The growing number of specialty store chains and franchises and the importance of their location close to
major anchors in centres.
The growing size and diversification of major centres and their expansion to include entertainment,
accommodation (hotel/serviced apartments) and lifestyle focuses including eat streets and street theatre
(busker and public performances).
The growing popularity of internet shopping which presently accounts for approximately 5% of total retail
sales.
The activity centre network within the City of Greater Bendigo has historically been dominated by the Bendigo
CBD, with retail, commercial, entertainment, community and administrative service functions highly concentrated
within this area. The primacy of the Bendigo CBD is maintained through the objectives of the Greater Bendigo
Planning Scheme which encourages the retention of the CBD as the primary retail and commercial centre in the
wider City. The Scheme is underpinned by the recommendations and findings from the City of Greater Bendigo
Commercial Land Strategy (CLS) (2005). It should be noted that the southern part of the Study Area for the
Bendigo Hospital Structure Plan extends to the northern fringe of the CBD.
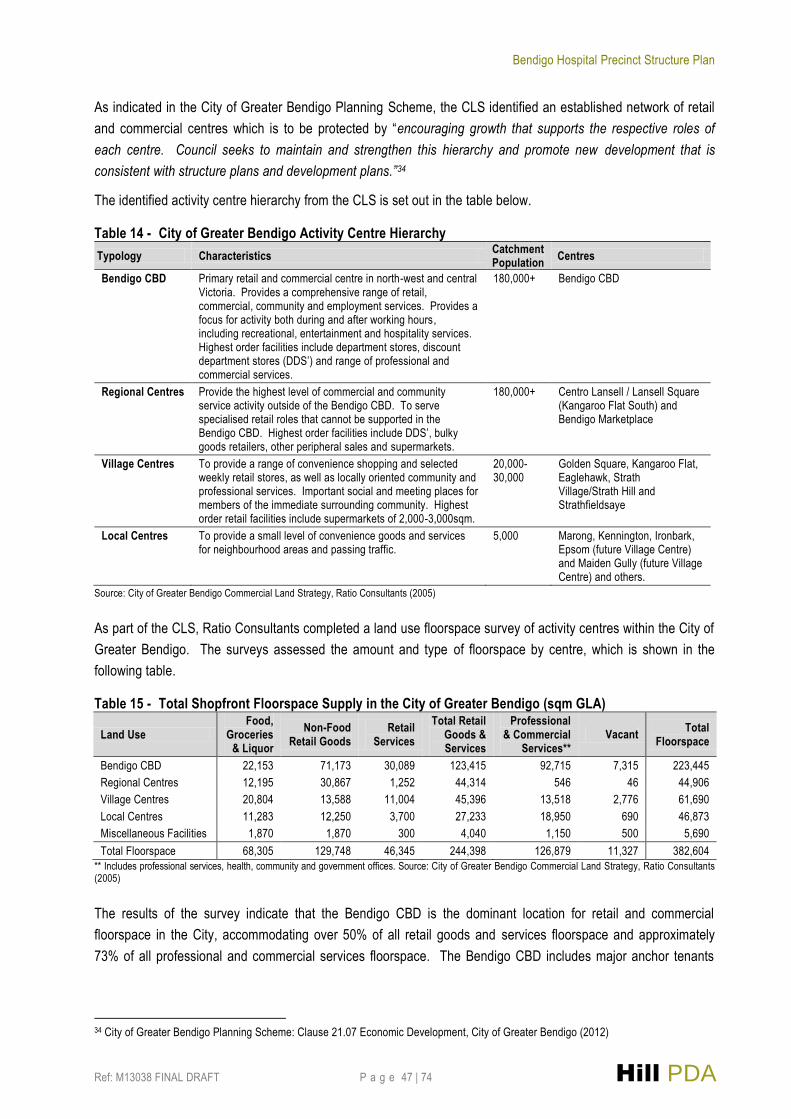
Bendigo Hospital Precinct Structure Plan
Ref: M13038 FINAL DRAFT P a g e 47 | 74 Hill PDA
As indicated in the City of Greater Bendigo Planning Scheme, the CLS identified an established network of retail
and commercial centres which is to be protected by “encouraging growth that supports the respective roles of
each centre. Council seeks to maintain and strengthen this hierarchy and promote new development that is
consistent with structure plans and development plans.”34
The identified activity centre hierarchy from the CLS is set out in the table below.
Table 14 - City of Greater Bendigo Activity Centre Hierarchy
Typology Characteristics Catchment Population
Centres
Bendigo CBD Primary retail and commercial centre in north-west and central Victoria. Provides a comprehensive range of retail, commercial, community and employment services. Provides a focus for activity both during and after working hours, including recreational, entertainment and hospitality services. Highest order facilities include department stores, discount department stores (DDS’) and range of professional and commercial services.
180,000+ Bendigo CBD
Regional Centres Provide the highest level of commercial and community service activity outside of the Bendigo CBD. To serve specialised retail roles that cannot be supported in the Bendigo CBD. Highest order facilities include DDS’, bulky goods retailers, other peripheral sales and supermarkets.
180,000+ Centro Lansell / Lansell Square (Kangaroo Flat South) and Bendigo Marketplace
Village Centres To provide a range of convenience shopping and selected weekly retail stores, as well as locally oriented community and professional services. Important social and meeting places for members of the immediate surrounding community. Highest order retail facilities include supermarkets of 2,000-3,000sqm.
20,000-30,000
Golden Square, Kangaroo Flat, Eaglehawk, Strath Village/Strath Hill and Strathfieldsaye
Local Centres To provide a small level of convenience goods and services for neighbourhood areas and passing traffic.
5,000 Marong, Kennington, Ironbark, Epsom (future Village Centre) and Maiden Gully (future Village Centre) and others.
Source: City of Greater Bendigo Commercial Land Strategy, Ratio Consultants (2005)
As part of the CLS, Ratio Consultants completed a land use floorspace survey of activity centres within the City of
Greater Bendigo. The surveys assessed the amount and type of floorspace by centre, which is shown in the
following table.
Table 15 - Total Shopfront Floorspace Supply in the City of Greater Bendigo (sqm GLA)
Land Use Food,
Groceries & Liquor
Non-Food Retail Goods
Retail Services
Total Retail Goods & Services
Professional & Commercial
Services** Vacant
Total Floorspace
Bendigo CBD 22,153 71,173 30,089 123,415 92,715 7,315 223,445
Regional Centres 12,195 30,867 1,252 44,314 546 46 44,906
Village Centres 20,804 13,588 11,004 45,396 13,518 2,776 61,690
Local Centres 11,283 12,250 3,700 27,233 18,950 690 46,873
Miscellaneous Facilities 1,870 1,870 300 4,040 1,150 500 5,690
Total Floorspace 68,305 129,748 46,345 244,398 126,879 11,327 382,604
** Includes professional services, health, community and government offices. Source: City of Greater Bendigo Commercial Land Strategy, Ratio Consultants (2005)
The results of the survey indicate that the Bendigo CBD is the dominant location for retail and commercial
floorspace in the City, accommodating over 50% of all retail goods and services floorspace and approximately
73% of all professional and commercial services floorspace. The Bendigo CBD includes major anchor tenants
34 City of Greater Bendigo Planning Scheme: Clause 21.07 Economic Development, City of Greater Bendigo (2012)

Bendigo Hospital Precinct Structure Plan
Ref: M13038 FINAL DRAFT P a g e 48 | 74 Hill PDA
including a Myer department store, Target, Coles supermarket, Officeworks and the headquarters of the Bendigo
and Adelaide Bank.
The CLS noted that the development and expansion of the Regional Centres at Lansell Square and Bendigo
Marketplace had detrimentally impacted the trading performance of the Bendigo CBD but despite this, vacancies
in the CBD were still low at around 3.3% at the time of the survey in late 2004. Anecdotal evidence from the
consultation sessions confirms the CLS statement on performance with the suggestion that the area around
Hargreaves Mall and the northern fringe of the CBD is fairly static and has lacked vibrancy and patronage since
the development of Bendigo Marketplace.
The primary location for commercial (including medical suite) and retail floorspace development in the Bendigo
Hospital Structure Plan Study Area beyond the Hospital itself is Bridge Street, extending in a north-easterly
direction from the northern fringe of the CBD. The strip has a number of different land uses including commercial
office, medical suites, retail and residential.
Bridge Street has evolved through the years from a largely bulky goods retail destination to accommodating a
wider variety of commercial and retail uses including more health related services and retail in response to the
proximity of the Bendigo Hospital. Coliban Water is a major tenant along the strip, occupying a large site at 37-45
Bridge Street and there are smaller tenancies that provide professional and health services. During the
community consultation sessions, Bridge Street was nominated as a growth and opportunity area for commercial
and retail development by attendees, particularly in the form of further allied health services and retail health
provision. These industries have become more prevalent over the past few years.
In addition to the existing retail provision at the Hospital and Bridge Street, there are also some isolated retail
stores and services within the Study Area including Debbie’s Deli on the corner of Nolan Street and Uley Street
and the View Street Grocer, located just beyond the Study Area.
The most recent and substantial office developments which have occurred in Bendigo within close proximity to the
Bendigo Hospital Structure Plan Study Area are the State Trustee car park and commercial office development on
Edward Street (completed in 2012) and the Bendigo Centre (Bendigo and Adelaide Bank Complex). There have
also been smaller office developments at 3 storey office development on 10-16 Forest Street, Bendigo.
There has also been some anecdotal evidence of a trend towards allied health providers operating out of former
residential dwellings in and around the Hospital Precinct.
At 2005, there was approximately 382,000sqm of retail and commercial floorspace in the City of Greater Bendigo.
Since the completion of the CLS in 2005 there has been significant development of retail and commercial
floorspace. Hill PDA is aware of a number of significant completed retail and commercial developments from the
period 2005 to 2013 including:
Extensions to Bendigo Marketplace;
The Bendigo Centre (Bendigo Bank complex);
1st Choice Liquor on Williamson Street;
Rocklea Homemaker Centre development;

Bendigo Hospital Precinct Structure Plan
Ref: M13038 FINAL DRAFT P a g e 49 | 74 Hill PDA
ALDI supermarkets at Strath Hill, Eaglehawk and the Kangaroo Flat Village Centre;
Epsom shopping centre;
IGA supermarket at Maiden Gully.
It is estimated these developments comprise around 30,000sqm of retail floorspace in total.
It is understood there are two main development proposals for retail and commercial floorspace which could add
to floorspace supply within the City, including an expansion to the Coles and Woolworths supermarkets at Lansell
Square to accommodate an additional 2,900sqm which is expected to be completed by mid-2014. There is also a
proposal for the development of a Village Centre at Kennington. The Village Centre would include the
development of a Maxi Supermarket, large variety store, 21 specialty stores, trade supplies, a 200 seat food court
and a plant nursery with a total retail component of almost 6,500sqm. It is understood that this proposal has been
refused by Council and is subsequently to be heard at VCAT.
Excluding that which will form part of the redeveloped Bendigo Hospital, there are no significant proposals for the
development of retail space in or around the Study Area. It is understood that the Bendigo Hospital redevelopment
will include around 1,500sqm of retail floorspace inclusive of a 500sqm general store/small supermarket plus
cafeteria and food court space.
Research indicates that there are currently no proposals for the development of additional standalone office
buildings in the Study Area, and to a greater extent, Bendigo. There is some provision of office space proposed
as a component of other mixed use developments, such as the Wills Street residential development and the
Kennington Village Centre.
The Wills Street residential development proposes a component of office space on the 2nd floor. Given that the
development comprises a 4 storey building consisting of 12 apartments it can be assumed that the provision of
office floorspace within this development will not be significant.
As indicated in the retail section, the Kennington Village development is intended to comprise 700sqm of office
space along with the retail floorspace component (6,460sqm).
There have been a number of cancelled and deferred proposals for office space in Bendigo, but none that are
located in the Study Area. The most recent deferred proposal was for the construction of office space on 108-114
High Street, Bendigo. This development sought to construct the development of a two storey dwelling comprising
a small component of retail, and approximately 500sqm of office space. The project was planned for completion in
mid-2014 but has since been deferred during the development approval stages.
The established City of Greater Bendigo Activity Centre Hierarchy set out in the Bendigo CLS nominates a
preferred delineation between higher order and local centres. Given the proximity of the Study Area to the
Bendigo CBD - the most important centre in the hierarchy on scale and retail activity composition, this hiera rchy
constrains certain types of retail development from occurring.
The range of permissible uses in the City of Greater Bendigo planning zones also limits retail development in the
Study Area. Bridge Street, which is nominated as an area to accommodate retail and commercial development in
this report is currently under a Business 4 Zone (B4Z). The B4Z allows for only restricted retail premises (bulky
goods) as a permissible use. Other retail activity is prohibited (including all shop uses) or requires a planning

Bendigo Hospital Precinct Structure Plan
Ref: M13038 FINAL DRAFT P a g e 50 | 74 Hill PDA
permit (convenience shop). There will be more scope for retail development once the reformed planning zones
are introduced by the Victorian Government on July 1.
As part of the reformed zones, the B4Z will become part of the Commercial 2 Zone (C2Z). The C2Z will allow a
broader range of uses than was previously allowed in the B4Z. The major changes will be that there will be no
permit requirement for food and drink retail premises (under 100sqm) office and trade supplies stores. Small
supermarkets (under 1,800sqm) will be a permit applicable use and there can be up to 500sqm of adjacent shop
retail uses in the new C2Z in areas beyond metropolitan Melbourne.
Therefore, whilst food and drink premises will become permissible and restricted retail development will remain as
an accepted use under the C2Z, shop use will still largely be restricted along Bridge Street.
6.2 RETAIL MARKET
6.2.1 SHOPFRONT FLOORSPACE DEMAND BASED ON EXPENDITURE GROWTH
In order to determine demand for shopfront floorspace in the Bendigo CBD and surrounds, Hill PDA has
undertaken retail expenditure modelling for the City of Greater Bendigo as a whole given that the CBD is primarily
responsible for the extent of the Main Trade Area (MTA) of the wider City. In doing so, Hill PDA has reviewed
and updated the retail demand assessment undertaken by Ratio Consultants in the 2005 CLS.
In undertaking this task, Hill PDA:
Identified three main sources of retail expenditure - from residents in the MTA, workers and visitors
(tourists). The CLS identified retail expenditure from residents and additional likely spend from beyond
the MTA.
Quantified expenditure from residents based on 2009 Marketinfo data escalated to 2013 dollars.
Analysed the number of working residents compared to number of jobs in the City of Greater Bendigo in
order to understand the impact of retail spend in Bendigo (given workers spend around 20% to 25% of
total personal expenditure close to their place of work).
Quantified visitor spend based on the number of tourists to the Bendigo Loddon Region and their
spending habits.
Combined expenditure from residents, workers and visitors and applied target turnover rates (or industry
benchmarks) to captured turnover. This resulted in forecasts of retail floorspace demand (sqm GLA) in
five year intervals to 2031.
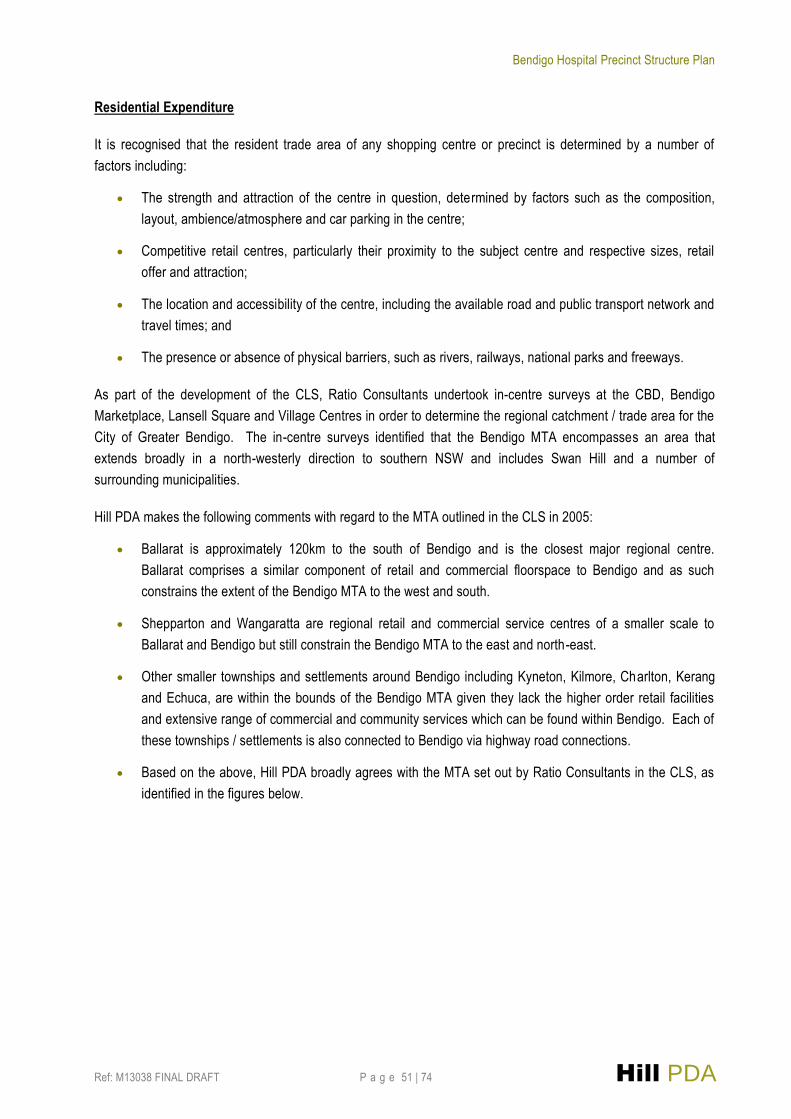
Bendigo Hospital Precinct Structure Plan
Ref: M13038 FINAL DRAFT P a g e 51 | 74 Hill PDA
Residential Expenditure
It is recognised that the resident trade area of any shopping centre or precinct is determined by a number of
factors including:
The strength and attraction of the centre in question, determined by factors such as the composition,
layout, ambience/atmosphere and car parking in the centre;
Competitive retail centres, particularly their proximity to the subject centre and respective sizes, retail
offer and attraction;
The location and accessibility of the centre, including the available road and public transport network and
travel times; and
The presence or absence of physical barriers, such as rivers, railways, national parks and freeways.
As part of the development of the CLS, Ratio Consultants undertook in-centre surveys at the CBD, Bendigo
Marketplace, Lansell Square and Village Centres in order to determine the regional catchment / trade area for the
City of Greater Bendigo. The in-centre surveys identified that the Bendigo MTA encompasses an area that
extends broadly in a north-westerly direction to southern NSW and includes Swan Hill and a number of
surrounding municipalities.
Hill PDA makes the following comments with regard to the MTA outlined in the CLS in 2005:
Ballarat is approximately 120km to the south of Bendigo and is the closest major regional centre.
Ballarat comprises a similar component of retail and commercial floorspace to Bendigo and as such
constrains the extent of the Bendigo MTA to the west and south.
Shepparton and Wangaratta are regional retail and commercial service centres of a smaller scale to
Ballarat and Bendigo but still constrain the Bendigo MTA to the east and north-east.
Other smaller townships and settlements around Bendigo including Kyneton, Kilmore, Charlton, Kerang
and Echuca, are within the bounds of the Bendigo MTA given they lack the higher order retail facilities
and extensive range of commercial and community services which can be found within Bendigo. Each of
these townships / settlements is also connected to Bendigo via highway road connections.
Based on the above, Hill PDA broadly agrees with the MTA set out by Ratio Consultants in the CLS, as
identified in the figures below.
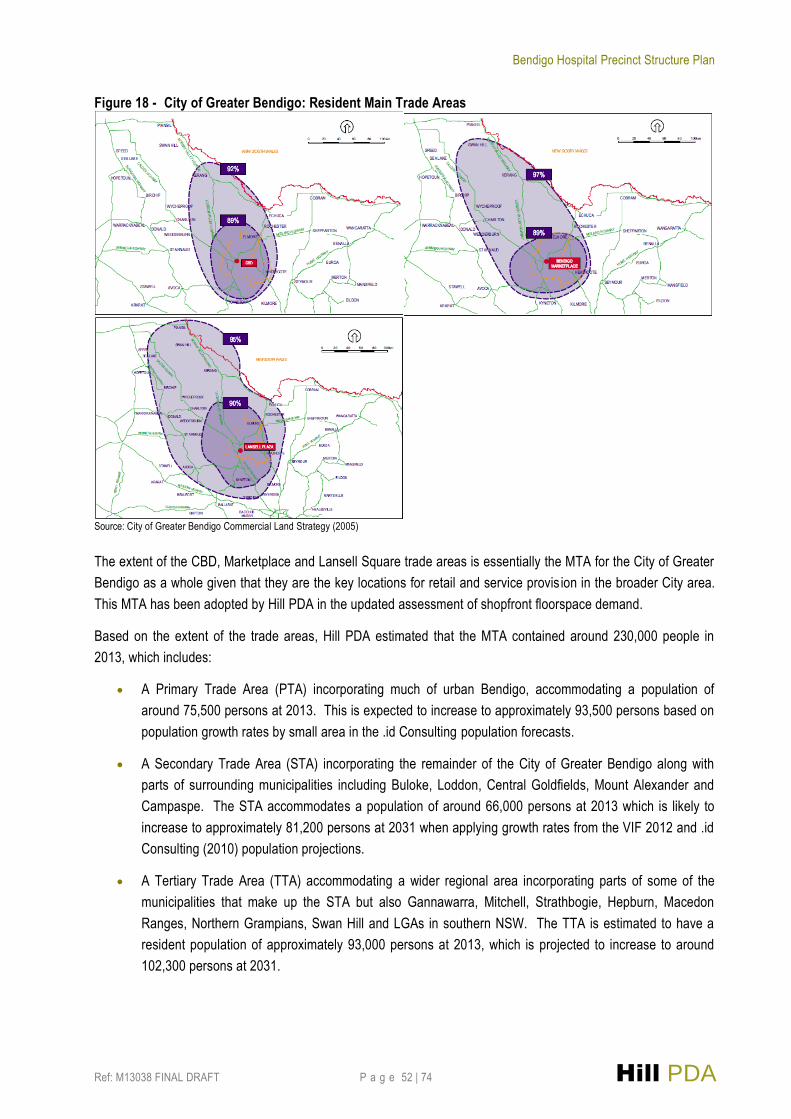
Bendigo Hospital Precinct Structure Plan
Ref: M13038 FINAL DRAFT P a g e 52 | 74 Hill PDA
Figure 18 - City of Greater Bendigo: Resident Main Trade Areas
Source: City of Greater Bendigo Commercial Land Strategy (2005)
The extent of the CBD, Marketplace and Lansell Square trade areas is essentially the MTA for the City of Greater
Bendigo as a whole given that they are the key locations for retail and service provis ion in the broader City area.
This MTA has been adopted by Hill PDA in the updated assessment of shopfront floorspace demand.
Based on the extent of the trade areas, Hill PDA estimated that the MTA contained around 230,000 people in
2013, which includes:
A Primary Trade Area (PTA) incorporating much of urban Bendigo, accommodating a population of
around 75,500 persons at 2013. This is expected to increase to approximately 93,500 persons based on
population growth rates by small area in the .id Consulting population forecasts.
A Secondary Trade Area (STA) incorporating the remainder of the City of Greater Bendigo along with
parts of surrounding municipalities including Buloke, Loddon, Central Goldfields, Mount Alexander and
Campaspe. The STA accommodates a population of around 66,000 persons at 2013 which is likely to
increase to approximately 81,200 persons at 2031 when applying growth rates from the VIF 2012 and .id
Consulting (2010) population projections.
A Tertiary Trade Area (TTA) accommodating a wider regional area incorporating parts of some of the
municipalities that make up the STA but also Gannawarra, Mitchell, Strathbogie, Hepburn, Macedon
Ranges, Northern Grampians, Swan Hill and LGAs in southern NSW. The TTA is estimated to have a
resident population of approximately 93,000 persons at 2013, which is projected to increase to around
102,300 persons at 2031.
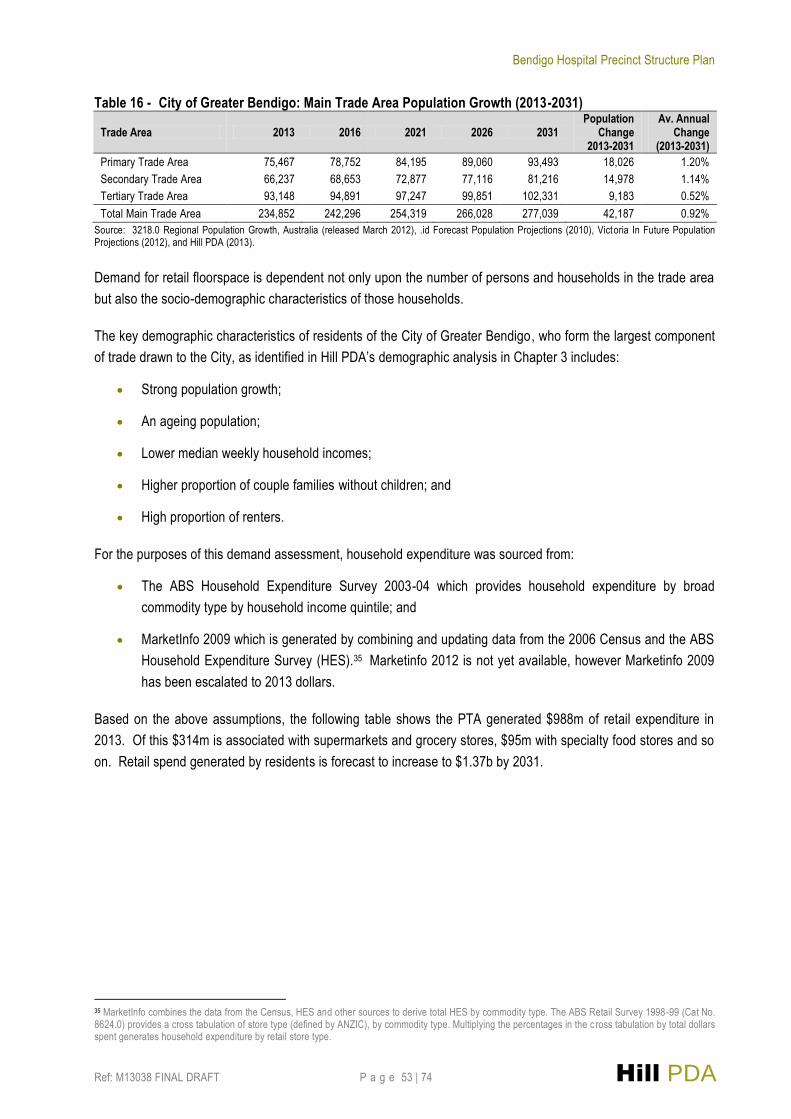
Bendigo Hospital Precinct Structure Plan
Ref: M13038 FINAL DRAFT P a g e 53 | 74 Hill PDA
Table 16 - City of Greater Bendigo: Main Trade Area Population Growth (2013-2031)
Trade Area 2013 2016 2021 2026 2031 Population
Change 2013-2031
Av. Annual Change
(2013-2031)
Primary Trade Area 75,467 78,752 84,195 89,060 93,493 18,026 1.20%
Secondary Trade Area 66,237 68,653 72,877 77,116 81,216 14,978 1.14%
Tertiary Trade Area 93,148 94,891 97,247 99,851 102,331 9,183 0.52%
Total Main Trade Area 234,852 242,296 254,319 266,028 277,039 42,187 0.92%
Source: 3218.0 Regional Population Growth, Australia (released March 2012), .id Forecast Population Projections (2010), Victoria In Future Population Projections (2012), and Hill PDA (2013).
Demand for retail floorspace is dependent not only upon the number of persons and households in the trade area
but also the socio-demographic characteristics of those households.
The key demographic characteristics of residents of the City of Greater Bendigo, who form the largest component
of trade drawn to the City, as identified in Hill PDA’s demographic analysis in Chapter 3 includes:
Strong population growth;
An ageing population;
Lower median weekly household incomes;
Higher proportion of couple families without children; and
High proportion of renters.
For the purposes of this demand assessment, household expenditure was sourced from:
The ABS Household Expenditure Survey 2003-04 which provides household expenditure by broad
commodity type by household income quintile; and
MarketInfo 2009 which is generated by combining and updating data from the 2006 Census and the ABS
Household Expenditure Survey (HES).35 Marketinfo 2012 is not yet available, however Marketinfo 2009
has been escalated to 2013 dollars.
Based on the above assumptions, the following table shows the PTA generated $988m of retail expenditure in
2013. Of this $314m is associated with supermarkets and grocery stores, $95m with specialty food stores and so
on. Retail spend generated by residents is forecast to increase to $1.37b by 2031.
35 MarketInfo combines the data from the Census, HES and other sources to derive total HES by commodity type. The ABS Retail Survey 1998-99 (Cat No. 8624.0) provides a cross tabulation of store type (defined by ANZIC), by commodity type. Multiplying the percentages in the c ross tabulation by total dollars spent generates household expenditure by retail store type.

Bendigo Hospital Precinct Structure Plan
Ref: M13038 FINAL DRAFT P a g e 54 | 74 Hill PDA
Table 17 - City of Greater Bendigo Primary Trade Area Resident Expenditure to 2031 ($m) Retail Store Type 2013 2016 2021 2026 2031
Supermarkets & Grocery Stores 313.8 340.5 368.9 398.8 430.7
Specialty Food Stores 94.6 102.7 111.2 120.3 129.9
Fast-Food Stores 47.2 51.2 55.4 60.0 64.7
Restaurants, Hotels and Clubs* 55.0 59.6 68.0 76.6 85.7
Department Stores 90.5 98.2 106.4 115.0 124.2
Clothing Stores 55.2 59.8 64.8 70.1 75.7
Bulky Goods Stores 153.0 166.1 179.9 194.5 210.0
Other Personal & Household Goods 155.5 168.8 182.8 197.7 213.5
Selected Personal Services** 22.9 24.8 26.9 29.1 31.4
Total Retailing 987.7 1,071.7 1,164.3 1,262.1 1,365.8
* Turnover relating only to consumption of food and liquor (excludes all other types of revenue such as accommodation, gaming and gambling). ** Selected Personal Services includes hair and beauty, laundry, clothing hire and alterations, shoe repair, optical dispensing, photo processing and hire of videos. Note: growth of 1.3% per capita per annum in real retail spend was assumed consistent with the historic trend since 1986 (sourced from ABS Retai l Sales). Source: Hill PDA estimates using data sourced from ABS Household Expenditure Survey (2003-04) and Marketinfo (2009).
The following table shows that the STA generated $862m of retail expenditure in 2013. Of this $278m is
associated with supermarkets and grocery stores, $84m with specialty food stores and so on. Retail spend
generated by residents is forecast to increase to $1.18b by 2031.
Table 18 - City of Greater Bendigo Secondary Trade Area Resident Expenditure to 2031 ($m)
Retail Store Type 2013 2016 2021 2026 2031
Supermarkets & Grocery Stores 278.4 300.0 324.0 349.9 377.6
Specialty Food Stores 84.3 90.8 98.1 105.9 114.3
Fast-Food Stores 39.7 42.8 46.3 50.0 53.9
Restaurants, Hotels and Clubs* 46.3 49.9 56.6 64.0 72.0
Department Stores 78.1 84.2 91.0 98.2 106.0
Clothing Stores 46.6 50.3 54.3 58.6 63.3
Bulky Goods Stores 133.6 144.1 155.6 168.0 181.3
Other Personal & Household Goods 135.5 146.0 157.7 170.3 183.8
Selected Personal Services** 19.5 21.1 22.7 24.6 26.5
Total Retailing 862.1 929.3 1,006.3 1,089.4 1,178.7
* Turnover relating only to consumption of food and liquor (excludes all other types of revenue such as accommodation, gaming and gambling). ** Selected Personal Services includes hair and beauty, laundry, clothing hire and alterations, shoe repair, optical dispensing, photo processing and hire of videos. Note: growth of 1.3% per capita per annum in real retail spend was assumed consistent with the historic trend since 1986 (sourced from ABS Retail Sales). Source: Hill PDA estimates using data sourced from ABS Household Expenditure Survey (2003-04) and Marketinfo (2009).
Retail spend per capita in the City of Greater Bendigo (which encompasses the PTA and part of the STA) was
$13,265 in 2013. This level of retail expenditure per capita is similar to other major competing regional centres
including Ballarat and Shepparton.
Table 19 - Retail Spend Per Capita Comparison (2013)
LGA Population* Total Retail
Expenditure ($m) Per Capita Retail
Spend
Greater Bendigo 105,600 $ 1,400.8 $ 13,265
Ballarat 100,917 $ 1,343.7 $ 13,315
Shepparton 65,392 $ 841.8 $ 12,873
* Not an updated ERP figure as presented in Chapter 3
Source: Marketinfo (2009)
The following table shows that the TTA generated $1.3b of retail expenditure in 2013. Of this $424m is
associated with supermarkets and grocery stores, $130m with specialty food stores and so on. Retail spend
generated by residents is forecast to increase to $1.72b by 2031.

Bendigo Hospital Precinct Structure Plan
Ref: M13038 FINAL DRAFT P a g e 55 | 74 Hill PDA
Table 20 - City of Greater Bendigo Tertiary Trade Area Resident Expenditure to 2031 ($m)
Retail Store Type 2013 2016 2021 2026 2031
Supermarkets & Grocery Stores 423.8 448.3 481.0 516.3 554.1
Specialty Food Stores 130.2 137.7 147.7 158.6 170.2
Fast-Food Stores 65.5 69.2 74.3 79.7 85.5
Restaurants, Hotels and Clubs* 75.6 79.9 87.1 95.1 103.7
Department Stores 116.0 122.8 131.7 141.4 151.8
Clothing Stores 69.5 73.6 78.9 84.7 90.9
Bulky Goods Stores 194.3 205.6 220.6 236.9 254.2
Other Personal & Household Goods 202.5 214.2 229.8 246.7 264.8
Selected Personal Services** 30.5 32.3 34.6 37.2 39.9
Total Retailing 1,308.0 1,383.5 1,485.8 1,596.7 1,715.2
* Turnover relating only to consumption of food and liquor (excludes all other types of revenue such as accommodation, gaming and gambling). ** Selected Personal Services includes hair and beauty, laundry, clothing hire and alterations, shoe repair, optical dispensing, photo processing and hire of videos. Note: growth of 1.3% per capita per annum in real retail spend was assumed consistent with the historic trend since 1986 (sourced from ABS Retail Sales). Source: Hill PDA estimates using data sourced from ABS Household Expenditure Survey (2003-04) and Marketinfo (2009).
The analysis indicates that residents in the City of Greater Bendigo MTA currently generate approximately $3.16b
of retail spend. The largest proportion of this expenditure is in supermarkets and grocery stores (approximately
$1.01b or around 31%). MTA expenditure is forecast to increase to around $4.30b by 2031. This is an increase
of $1.10b in spend over the period.
It should be noted however, that not all of the expenditure generated by the MTA will be captured by retail
provision in the City of Greater Bendigo, with a significant portion (particularly in the STA and TTA) to be captured
by competing centres including Ballarat, Melbourne and local supermarket based centres. As a result, Hill PDA
has assumed a range of capture rates given:
Bendigo is likely to retain the vast majority of supermarket and grocery expenditure in the PTA and
capture a substantial portion in the STA given the extensive quantum of supermarket floorspace in the
City. Supermarket and grocery spend drawn to Bendigo from the TTA would be very minor.
Bendigo accommodates a department store and a number of Discount Department Stores (DDS). The
next closest department and discount department store provision is in Ballarat which also accommodates
a Myer and multiple DDSs. It is therefore likely that Bendigo would retain the majority of department
store spend notwithstanding the loss of some trade to Ballarat and Melbourne.
It is generally acknowledged that as much as 20-25% of personal expenditure can be spent close to
employee’s place of work and hence there is likely to be some expenditure that escapes Bendigo to
Melbourne and other regional centres given that the City is a net exporter of jobs. However, this is
expected to be negligible given likely employment growth as part of the Hospital redevelopment.
There is likely to be some “tourism-out” expenditure (i.e. when residents travel beyond the MTA for
vacations). This is likely to be minor and may equate to no more than 5% of total expenditure –
equivalent to around 2 – 3 weeks per annum for the average household.
Based on the above assumptions, Hill PDA adopted the following capture rates. Note, the capture rates below
are intended to be targets for Bendigo. The capture rates may not completely represent the current situation, but
rather they are aspirational targets that take account of the intended role and function of Bendigo as a key
regional service centre, the current retail mix in Bendigo, the population of the MTA, and the relative disposable
incomes of residents in the MTA.

Bendigo Hospital Precinct Structure Plan
Ref: M13038 FINAL DRAFT P a g e 56 | 74 Hill PDA
Table 21 - City of Greater Bendigo Assumed Capture Rates (2013-2031)
Retail Store Type PTA STA TTA
Supermarkets & Grocery Stores 90% 50% 2%
Specialty Food Stores 90% 50% 5%
Fast-Food Stores 90% 45% 5%
Restaurants, Hotels and Clubs 65% 35% 10%
Department Stores 75% 50% 15%
Clothing Stores 85% 60% 15%
Bulky Goods Stores 85% 60% 15%
Other Personal & Household Goods 85% 60% 15%
Selected Personal Services 90% 60% 10%
Proportion of Total Retail Spend 85% 53% 9%
Source: Hill PDA (2013)
Based on the above capture rates the proportion of resident retail spend retained by the City of Greater Bendigo
is shown in the following table.
Table 22 - Capture of MTA Resident Retail Spend by the City of Greater Bendigo to 2031 ($m)
Retail Store Type 2013 2016 2021 2026 2031
Supermarkets & Grocery Stores 430.1 465.4 503.6 544.2 587.5
Specialty Food Stores 133.8 144.7 156.5 169.1 182.5
Fast-Food Stores 63.6 68.8 74.4 80.4 86.8
Restaurants, Hotels and Clubs* 59.5 64.2 72.7 81.7 91.2
Department Stores 124.3 134.2 145.0 156.6 168.9
Clothing Stores 85.3 92.1 99.5 107.5 116.0
Bulky Goods Stores 239.3 258.5 279.4 301.7 325.5
Other Personal & Household Goods 243.9 263.2 284.5 307.2 331.4
Selected Personal Services** 35.4 38.2 41.3 44.6 48.2
Total Retailing 1,415.3 1,529.2 1,657.0 1,793.1 1,938.0
* Turnover relating only to consumption of food and liquor (excludes all other types of revenue such as accommodation, gaming and gambling). ** Selected Personal Services includes hair and beauty, laundry, clothing hire and alterations, shoe repair, optical dispensing, photo processing and hire of videos. Note: growth of 1.3% per capita per annum in real retail spend was assumed consistent with the historic trend since 1986 (sourced from ABS Retail Sales). Source: Hill PDA estimates using data sourced from ABS Household Expenditure Survey (2003-04) and Marketinfo (2009).
The analysis indicates that retail provision within the City of Greater Bendigo has the ability to capture $1.42b of
household retail sales in 2013, equivalent to around 45% of total available expenditure. By 2031 captured retail
expenditure is forecast to increase to $1.94b or an increase of $523m over the period.
Worker Expenditure
Workers on average spend around $2,500 - $3,000 every year on retail goods and services close to their place of
work, representing around 20-25% of total personal expenditure. However, this amount can vary considerably
depending upon the range and availability of retail outlets.
Based on journey to work data obtained from the .id Consulting Community Profile (based on 2011 ABS Census
data), the City of Greater Bendigo is a net exporter of jobs, accommodating over 7,000 more working residents
than jobs in the City. As such, no additional worker expenditure has been assumed to be drawn to retail centres
within the City of Greater Bendigo in this analysis.

Bendigo Hospital Precinct Structure Plan
Ref: M13038 FINAL DRAFT P a g e 57 | 74 Hill PDA
Visitor Expenditure
The National Visitor Survey conducted by Tourism Research Australia (TRA) provides information on visitor
characteristics in LGAs outside capital city regions along with broader tourist information by state and region. The
most recent visitor data produced by TRA for the Bendigo Loddon Region shows that based on three or four year
averages to June 2011, the municipality was experiencing around 2.7 million visitors per annum.36 Of these,
almost 75% were domestic day visitors. The TRA estimated that visitors to the Bendigo Loddon Region
generated around $376m in tourism spend per annum over the same period as identified in the table below.
Table 23 - Bendigo Loddon Region Tourism and Visitor Data* (2011)
Visitor Type
Visitors Per
Annum
Average Spend
per Trip ($)
Total Tourist Spend
Per Annum ($m)
Domestic Overnight 666,000 254 169.2
Domestic Day 2,020,000 98 197.0
International 17,000 543 9.2
Total Visitors 2,703,000 Na 376.6
* Based on 3 or 4 year averages to June 2011. Source: Regional Tourism Profile for Bendigo Loddon 2010/11, Tourism Research Australia (2011)
The Bendigo Visitor Profile and Satisfaction Project (VPS) was completed as part of the Destination Visitor Survey
Program (DVS) by TRA. The Profile and Survey identifies tourism expenditure by commodity type. The following
table indicates the Bendigo Loddon Region captured $198m of domestic day and $169m of domestic overnight
expenditure in 2011.
Table 24 - Bendigo Loddon Region Tourism Expenditure by Type (2010/11)
Expenditure Type Domestic Day Domestic Overnight and International
$m Proportion $m Proportion
Accommodation - - 52.4 31%
Food and Drink 73.3 37% 52.4 31%
Fuel 35.6 18% 20.3 12%
Shopping 63.4 32% 25.4 15%
Tours and Packages 19.8 10% 15.2 9%
Other 5.9 3% 3.4 2%
Total Visitor Expenditure 198.0 100% 169.1 100%
Source: Regional Tourism Profile for Bendigo Loddon 2010/11, Tourism Research Australia (2011)
The following table applies the proportions of spend by type to visitor spend generated in the Bendigo Loddon
Region in 2012. Expenditure was increased between 2011 and 2013 using the following growth assumptions:
Overnight visitor expenditure to grow at 2.4% per annum;37
Daytrip visitor expenditure at 5.2% per annum;38
Domestic daytrip visitors at 1% per annum;39
Domestic visitors nights at 0.7% per annum;40 and
International visitor nights at 3.6% per annum.41
36 Regional Tourism Profile for Bendigo Loddon 2010/11, Tourism Research Australia (2011) 37 Domestic Tourism Expenditure in Victoria, Tourism Victoria (2012) 38 Ibid 39 Forecast Visitation for Victoria, Tourism Victoria (2012) 40 Forecast Visitation for Victoria, Tourism Victoria (2012) 41 Forecast Visitation for Victoria, Tourism Victoria (2012)
Bendigo Hospital Precinct Structure Plan
Ref: M13038 FINAL DRAFT P a g e 58 | 74 Hill PDA
Table 25 - Bendigo Loddon Tourism Expenditure in 2013 ($m)
Expenditure Type Domestic Day Domestic Overnight International Total
Accommodation - 55.3 3.1 58.4
Food & Drink 81.7 55.3 3.1 140.1
Fuel 39.7 21.4 1.2 62.3
Shopping 70.6 26.8 1.5 98.9
Packages 22.1 16.1 0.2 38.3
Other 6.6 3.6 0.9 11.1
Total 220.7 178.3 10.0 409.1
Source: Regional Tourism Profiles 2010/11, Tourism Research Australia, Bendigo Visitor Profile and Survey, TRA (2012), Tourism Victoria (2012) and Hill PDA (2013)
The results show food and drink, shopping and other expenditure make up almost 60% of total tourism
expenditure in the Bendigo Loddon Region, equivalent to $250m. Assuming 7% of food and drink expenditure is
dedicated to on-license premises, expenditure available to retail land uses within the Bendigo Loddon Region is
estimated to be $240m in 2013. It has been assumed that the City of Greater Bendigo would capture 85% of total
tourism expenditure in the Bendigo Loddon Region given the much greater range and extent of tourism sights and
opportunities in the City compared to the surrounding Loddon area. Total tourism spend available to the City of
Greater Bendigo is therefore $204m at 2013.
Given that forecasting tourists into the future is difficult, Hill PDA has used the identified growth rates from the
Tourism Victoria data for regional Victoria to project growth in retail spend. It should be noted however that
daytrip visitor expenditure has been trended down over the period to 2031 for a more conservative and realistic
estimate and to better reflect likely spend patterns. Hill PDA has made a high level estimate of tourism spend by
retail store type as shown in the following table.
Table 26 - Capture of Tourism Retail Spend by the City of Greater Bendigo to 2031 ($m) Retail Store Type Proportion of Spend 2013 2016 2021 2026 2031
Supermarkets & Grocery Stores 15% 30.6 33.7 38.4 42.6 46.1
Specialty Food Stores 10% 20.4 22.5 25.6 28.4 30.7
Fast-Food Stores 25% 51.1 56.1 64.0 70.9 76.8
Restaurants, Hotels and Clubs* 15% 30.6 33.7 38.4 42.6 46.1
Department Stores 5% 10.2 11.2 12.8 14.2 15.4
Clothing 10% 20.4 22.5 25.6 28.4 30.7
Bulky Goods 0% 0.0 0.0 0.0 0.0 0.0
Other Goods and Household Goods 15% 30.6 33.7 38.4 42.6 46.1
Selected Personal Services** 5% 10.2 11.2 12.8 14.2 15.4
Total Retailing 100% 204.2 224.5 256.2 283.7 307.2
* Turnover relating only to consumption of food and liquor (excludes all other types of revenue such as accommodation, gaming and gambling).
** Selected Personal Services includes hair and beauty, laundry, clothing hire and alterations, shoe repair, optical dispensing, photo processing and hire of videos.
The results indicate that the City of Greater Bendigo could capture approximately $204m of tourism retail spend in
2013, which is likely to increase to approximately $307m by 2031.

Bendigo Hospital Precinct Structure Plan
Ref: M13038 FINAL DRAFT P a g e 59 | 74 Hill PDA
Total Retail Expenditure
Combining expenditure from residents, workers and tourists, the City of Greater Bendigo could conservatively
capture approximately $1.62b of retail expenditure in 2013, increasing to $2.25b by 2031.
Table 27 - Total Forecast Retail Expenditure in the City of Greater Bendigo to 2031 ($m) Retail Store Type 2013 2016 2021 2026 2031
Supermarkets & Grocery Stores 460.8 499.1 542.0 586.8 633.6
Specialty Food Stores 154.2 167.2 182.1 197.5 213.3
Fast-Food Stores 114.6 124.9 138.5 151.4 163.6
Restaurants, Hotels and Clubs 90.1 97.9 111.1 124.3 137.3
Department Stores 134.5 145.4 157.8 170.8 184.3
Clothing Stores 105.7 114.5 125.1 135.9 146.7
Bulky Goods Stores 239.3 258.5 279.4 301.7 325.5
Other Personal & Household Goods 274.5 296.9 322.9 349.8 377.5
Selected Personal Services 45.6 49.4 54.1 58.8 63.5
Total Retailing 1,619.5 1,753.8 1,913.1 2,076.8 2,245.2
Source: Hill PDA 2013
Demand for Shopfront Floorspace
Demand for retail floorspace is forecast by applying target turnover rates (or industry benchmarks) to captured
spend. In doing so, the table below forecasts demand for retail floorspace (sqm GLA) to 2031.
Table 28 - Demand for Retail Floorspace in the City of Greater Bendigo to 2031 (sqm GLA)
Retail Store Type
Target Turnover
Rate* ($/sqm)
2013 2016 2021 2026 2031 Growth
2013-2031
Supermarkets & Grocery Stores 9,500 48,501 52,537 57,054 61,765 66,690 18,190
Specialty Food Stores 7,500 20,565 22,287 24,286 26,333 28,434 7,870
Fast-Food Stores 7,500 15,286 16,658 18,463 20,181 21,813 6,527
Restaurants, Hotels and Clubs 4,500 20,028 21,749 24,691 27,616 30,516 10,488
Department Stores 4,000 33,635 36,349 39,455 42,692 46,067 12,433
Clothing Stores 5,000 21,142 22,906 25,029 27,171 29,334 8,192
Bulky Goods Stores 3,500 68,385 73,845 79,822 86,198 92,995 24,609
Other Personal & Household Goods 4,500 61,000 65,974 71,760 77,729 83,892 22,891
Selected Personal Services 3,500 13,027 14,128 15,468 16,808 18,152 5,125
Total Retailing 301,569 326,435 356,028 386,493 417,894 116,325
Change +24,866 +29,593 +30,465 +31,401
* Various sources including Urbis Retail Averages, ABS Retail Survey 1998-99 escalated at CPI to $2013, Shopping Centre News, Hill PDA and various consultancy studies. Source: Hill PDA 2013
The table above indicates the MTA demands approximately 301,600sqm (GLA) of retail floorspace in 2013,
increasing to around 418,000sqm (GLA) by 2031. Further to demand for retail is demand for shopfront space
occupied by non-retail commercial uses. There are different types of commercial space such as:
Non-retail in shopfront space which includes activities such as travel agents, banks, doctors suites and
so on. These tend to make up around 5 – 7% of retail shopfront floorspace in a retail centre; and
Non-shopfront commercial spaces that encompass stand-alone commercial buildings and shop-top
commercial offices above shopfront retail.

Bendigo Hospital Precinct Structure Plan
Ref: M13038 FINAL DRAFT P a g e 60 | 74 Hill PDA
As a general rule, an additional 5-10% of specialty stores should be provided to accommodate these uses with a
further 3-4% of specialty stores assumed to be vacant at any one time. Based on these assumptions, this would
increase shopfront floorspace demand in the City to 317,440sqm (GLA) in 2013 increasing to 439,890sqm
(GLA) in 2031. This would result in anticipated growth in shopfront floorspace of around 122,450sqm over the
2013 to 2031 period.
The 2005 CLS identified 244,400sqm of existing shopfront retail floorspace in the City of Greater Bendigo and
identified a requirement for an additional 36,630sqm of shopfront floorspace over the period 2004 to 2011 and a
further 45,090sqm over the period 2011 to 2021. This is slightly less than the current Hill PDA projections
identified in the Hill PDA 2013 projections.
An important objective of any retail assessment is to achieve the right level of shopfront retail and commercial
floorspace. An undersupply of floorspace creates the following issues:
It reduces the range and availability of shopping opportunities and commercial services for customers
and can lead to considerable escape expenditure to other centres as customers seek greater quantity,
quality and convenience.
It can lead to longer travel times for shopping and increased car use; and
It results in increased congestion, parking difficulties and loss of convenience.
Correspondingly, oversupply of shopfront retail and commercial floorspace results in:
High vacancies, low rents and neglect of retail centres;
Inefficient use of land and other resources; and
An uninviting appearance and ambience due to a lack of customers.
Given identified supply at 2005 and the extent of retail development which has occurred in the interim period
(2005-2013), there does not appear to be a significant under or oversupply of retail floorspace within the City of
Greater Bendigo in 2013. Whilst it should be noted that a more detailed examination will take place once the
precise details of completed retail developments between 2005 and 2013 are known, putting forecast growth in
floorspace into perspective:
Assuming that there is currently around 317,000sqm of retail floorspace within the City of Greater
Bendigo, additional demand over the period of approximately 122,000sqm of retail floorspace represents
growth of almost 40% between 2013 and 2031.
122,000sqm of retail goods and services demand between 2013 and 2031 is equivalent to an additional 2
Lansell Square Regional Centres and 2-3 Village Centres. That is not to say however that all retail
floorspace demand should go solely to the Regional and Village Centres.
Approximately 18,000sqm of supermarket and grocery store demand is roughly equivalent to the
development of around 4-5 full-line supermarkets.
Given that full-line discount department stores (DDS’) are typically around 8,000sqm, the City of Greater
Bendigo could accommodate another DDS over the period to 2031 given identified demand.
The majority of the 5,100sqm of additional retail services floorspace demand is likely to be located in
those areas which are experiencing the greatest population increases, particularly Greenfield growth
areas like Strathfieldsaye, Maiden Gully and Huntly.

Bendigo Hospital Precinct Structure Plan
Ref: M13038 FINAL DRAFT P a g e 61 | 74 Hill PDA
Allocation of Floorspace
The CLS recommended a retail floorspace allocation system which was subsequently incorporated into the
Greater Bendigo Planning Scheme (Clause 21.07). The allocation of retail and commercial floorspace demand
recommended by the CLS from 2004 to 2021 can be seen in the table below.
Table 29 - Distribution of Floorspace Demand in the City of Greater Bendigo to 2004-2021 (sqm GLA)
Activity Centre Retail Goods /
Services Bulky Goods Office
Total Floorspace
Bendigo CBD (including Marketplace) 23,520 14,000 24,900 62,420
Kangaroo Flat South Regional Centre* 7,330 12,870 1,500 21,700
Village Centres 15,660 2,340 3,600 21,600
Local Centres 6,000 0 0 6,000
Total Retail and Commercial Floorspace 52,510 29,210 30,000 111,720
* Lansell Square
Source: Greater Bendigo Planning Scheme, City of Greater Bendigo (2012)
As shown in the previous table, the Bendigo CBD was designated to absorb the majority (approximately 56%) of
retail and commercial floorspace demand over the period 2005 to 2021 with a view to maintaining its primacy in
the City and wider region.
Applying the proportions of shopfront floorspace demand designated in the CLS to Hill PDA’s updated 2013
projections, the CBD could be expected to accommodate an additional 56,220sqm of shopfront floorspace from
2013 to 2031. This would include 26,320sqm (GLA) of shopfront floorspace between 2013 and 2021 and a further
29,990sqm from 2021 to 2031 (refer to the following table). The Kangaroo Flat South Regional Centre (including
Lansell Square) would be designated to absorb a further 26,160sqm of shopfront floorspace over the period, with
the Village Centres absorbing around 26,970sqm and the Local Centres accommodating 8,990sqm of shopfront
floorspace.
Table 30 - Distribution of Floorspace Demand in the City of Greater Bendigo to 2031 (sqm GLA) Activity Centre 2013 – 2021 2021-2031 Total Floorspace
Bendigo CBD (including Marketplace) 26,319 29,900 56,219
Kangaroo Flat South Regional Centre* 14,170 16,097 30,267
Village Centres 12,627 14,344 26,971
Local Centres 4,209 4,781 8,990
Total Retailing 57,325 65,123 122,447
* Includes Lansell Square
Source: Hill PDA (2013)
Given the quantum of retail floorspace designated for the CBD and the wider regional retail and services role that
it plays, potential retail development around the Hospital Precinct should be purely complementary and seek to
service the convenience needs of local workers and residents.
There are a range of retail facilities which would be suitable for development in the local area which would not
threaten the existing retail hierarchy and balance between floorspace supply and demand. These types of
facilities include cafes, take-away food outlets, gift shops, florists and perhaps a small convenience grocery store
should local demand warrant it. Discretionary retail activities (such as clothing and bulky goods stores) and
should be confined to proximate higher order centres such as the CBD or Eaglehawk.
As identified in the consultation sessions, the success of retail facilities around the Hospital Precinct will depend
on the overall amenity, quality of the retail offer and ability to capture local worker and resident expenditure. In
Bendigo Hospital Precinct Structure Plan
Ref: M13038 FINAL DRAFT P a g e 62 | 74 Hill PDA
particular, the consultation sessions highlighted the community’s desire for a greater range of quality cafes in the
local area. It was noted by some that that there are not as many located around the Bendigo Hospital precinct
compared to the distribution around the Geelong and Ballarat Hospitals.
6.2.2 RETAIL AND BULKY GOODS MARKET INDICATORS
According to an analysis of 18 retail transactions that occurred in Bendigo from 2010 onwards, the value of retail
space varies greatly depending on location, fit out and size. Retail space with a high standard fit out in central
Bendigo, or those located in retail strips such as Hargreaves Street can achieve capital values of up to
$5,608/sqm, however those located on the fringes of the Bendigo CBD achieve rents as low as $1,131/sqm.
Generally, retail space in Bendigo transacts for around $2,451/sqm, with sizes varying between 37-860sqm, and
larger spaces generally located on the outskirts of Bendigo’s CBD.
The consultation sessions identified that some parts of the City have extremely low rent (as indicated above) but
highlighted that this may be a competitive advantage for Bendigo with smaller, niche businesses able to set up
and operate to create to a diverse, interesting retail mix. Further information from the consultation sessions
indicated that typically land and buildings in Bendigo are tightly held with few transactions occurring. There are
several trusts which own a significant amount of retail and commercial buildings in the City. A significant retail
transaction occurred in early 2011 and comprised the sale of the Target building between King and Wills Street in
Bendigo. The building transacted for $14.2m ($3,821/sqm) and comprises a total of 3,726sqm.
The areas around Lucan Street and Bridge Street (in close proximity to the Hospital Precinct) were identified as
being in relatively high demand for retail and commercial development in the consultation sessions. Also as part
of the consultation workshop sessions, the potential for a 2-3 storey mixed use development on Barnard Street
overlooking Rosalind Park was also identified, however there may be heritage constraints in the area.
Hill PDA examined 16 retail spaces for lease42 in Bendigo with the analysis indicating that retail space is available
for $148-$553/sqm with a median rental of $291/sqm. Tenancies range from 19-257sqm with the median being
106.5sqm. An examination and comparison of 17 retail spaces for lease in Ballarat indicated that retail space is
more affordable in Ballarat, with space available for $111-$347/sqm.
There have been 3 recent transactions for bulky goods space and such sales indicate capital values of $1,003-
$1,931/sqm. The location of bulky goods space is not necessarily found on the outskirts of the CBD, with 202
Hargreaves Street located parallel with Pall Mall in the Bendigo CBD. A 960sqm bulky goods tenancy was
available for lease in April 2013 south of Pall Mall Street at 214 Hargraves Street. The asking rent was $104/sqm.
42 Leases on real commercial analysed at April 2013

Bendigo Hospital Precinct Structure Plan
Ref: M13038 FINAL DRAFT P a g e 63 | 74 Hill PDA
Figure 19 - Examples of Bendigo Retail and Bulky Goods Sales Transactions
Address 54 Edwards Street, Bendigo
Retail Type Bulky Goods
Sale Price $250,000
Sale Date December 2010
Size 221sqm
$/sqm $1,131/sqm
Address 40 Mitchell Street, Bendigo
Retail Type Shop
Sale Price $487,000
Sale Date December 2011
Size 209sqm
$/sqm $2,330/sqm
Address Shop, 10 Centreway Arcade, Bendigo
Retail Type Shop
Sale Price $122,000
Sale Date October 2011
Size 37sqm
$/sqm $3,297/sqm
Address 285 Hargreaves Street, Bendigo
Retail Type Shop
Sale Price $1,520,000
Sale Date May 2010
Size 271
$/sqm $5,608/sqm
Source: Google Mapping (2013), RP Data (2013) & Hill PDA Research (2013)
6.3 COMMERCIAL MARKET
Discussions with local agents have indicated that the office market in Bendigo is outperforming the retail, bulky
goods and industrial sectors, with rents and capital values rising at a steady rate. Significant recent commercial
office developments within the CBD and surrounds include:
41 Edward Street, Bendigo, completed in 2012 - this car park and office development is located
approximately 2km from the Hospital Precinct which now houses the State Trustee Bendigo office.
The Bendigo Centre - this 6 storey complex was completed in 2008 and now houses the headquarters of
the Bendigo and Adelaide Bank.
74 Queen Street, Bendigo - located approximately 2km south-west of the Study Area and completed in
2005, this 4 storey development was leased on a 15 year contract to the Victorian Government.
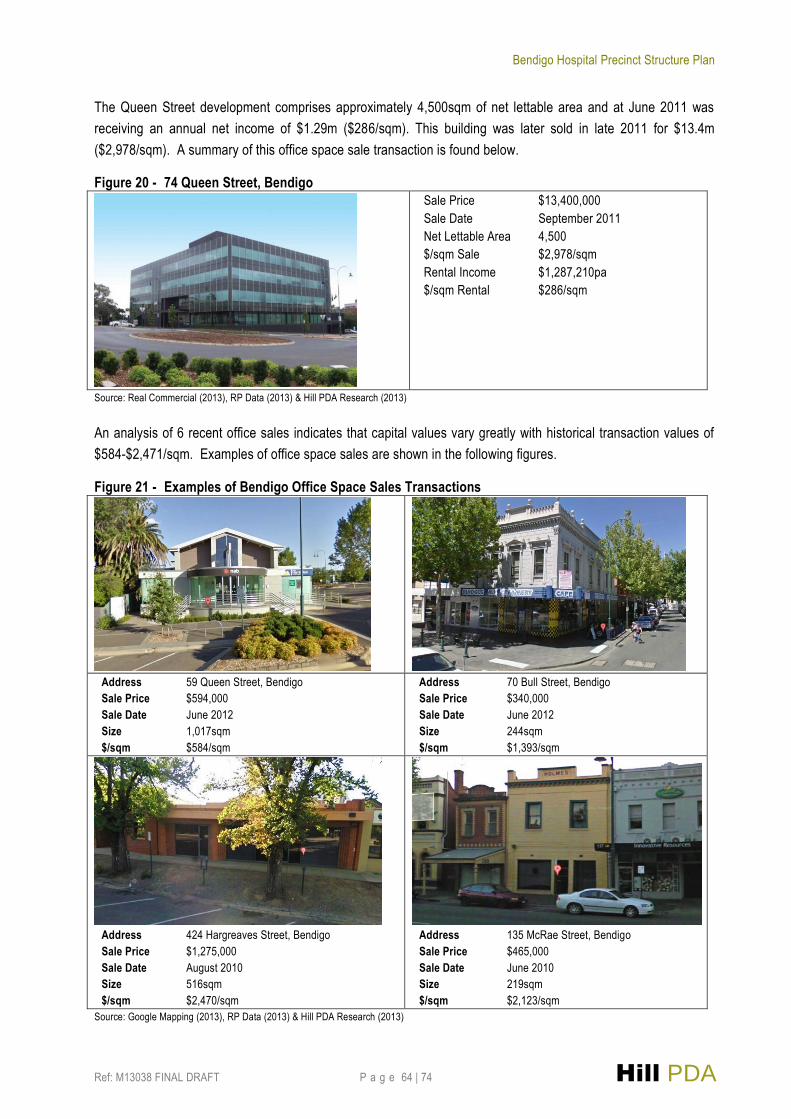
Bendigo Hospital Precinct Structure Plan
Ref: M13038 FINAL DRAFT P a g e 64 | 74 Hill PDA
The Queen Street development comprises approximately 4,500sqm of net lettable area and at June 2011 was
receiving an annual net income of $1.29m ($286/sqm). This building was later sold in late 2011 for $13.4m
($2,978/sqm). A summary of this office space sale transaction is found below.
Figure 20 - 74 Queen Street, Bendigo
Sale Price $13,400,000
Sale Date September 2011
Net Lettable Area 4,500
$/sqm Sale $2,978/sqm
Rental Income $1,287,210pa
$/sqm Rental $286/sqm
Source: Real Commercial (2013), RP Data (2013) & Hill PDA Research (2013)
An analysis of 6 recent office sales indicates that capital values vary greatly with historical transaction values of
$584-$2,471/sqm. Examples of office space sales are shown in the following figures.
Figure 21 - Examples of Bendigo Office Space Sales Transactions
Address 59 Queen Street, Bendigo
Sale Price $594,000
Sale Date June 2012
Size 1,017sqm
$/sqm $584/sqm
Address 70 Bull Street, Bendigo
Sale Price $340,000
Sale Date June 2012
Size 244sqm
$/sqm $1,393/sqm
Address 424 Hargreaves Street, Bendigo
Sale Price $1,275,000
Sale Date August 2010
Size 516sqm
$/sqm $2,470/sqm
Address 135 McRae Street, Bendigo
Sale Price $465,000
Sale Date June 2010
Size 219sqm
$/sqm $2,123/sqm
Source: Google Mapping (2013), RP Data (2013) & Hill PDA Research (2013)

Bendigo Hospital Precinct Structure Plan
Ref: M13038 FINAL DRAFT P a g e 65 | 74 Hill PDA
To gain a further understanding of the current rental market for office space, Hill PDA also investigated properties
for lease in Bendigo43. 15 available office spaces in Bendigo were analysed, with investigations indicating that
office space in Bendigo leases for between $113-$364/sqm with sizes ranging between 22-530sqm. This is in line
with the rents being achieved for 74 Queen Street, Bendigo ($286/sqm). For the sake of comparison, office space
in Ballarat was investigated, with an analysis of 16 available office spaces in Ballarat indicating cheaper rents,
with leases available for $93-$347/sqm and with smaller sizes of 21-494sqm.
Given that the office market in Bendigo generally comprises small businesses with budgetary constraints, agents
indicated that properties with higher rentals are generally absorbed by Government departments. It was indicated
that older office spaces that require re-fitting or refurbishment are generally absorbed by the smaller business and
firms. These latter spaces lease for around $200/sqm. These low rents mean that landlords are disinclined to
invest in refurbishment and new development.
It was indicated that the provision of office space is in short supply in Bendigo and there are affordability issues,
however this view was not reflected in the consultation sessions with some attendees indicating that they believed
there to be an oversupply of commercial floorspace in the City (despite not be reflected in market rents). It was
indicated that the costs of acquiring land for office space in areas of higher demand is costly and unfeasible given
market chargeable rents.
Hill PDA’s examination of transactions from 2010 onwards indicates that there have been 2 recent sales for
medical suites in Bendigo (at April 2013). Investigation of these sales indicates that both comprised converted
homes with a medical suite component (sold for $715-$1,134/sqm) and both were around 575sqm. This type of
accommodation brings its own issues including increased traffic movements and increased visitor parking in
residential streets which were also identified as key resident concerns in the consultation sessions.
However it was also highlighted in the sessions that despite heritage constraints, there is an opportunity to further
utilise heritage buildings in the area surrounding the Hospital Precinct for medical suites, as has occurred around
the Ballarat Base Hospital. It was noted that often the scale of allied health service providers was such that
converted dwellings were of a desirable size. In particular, professional medical suites were nominated around
Mundy Street in the CBD or in business zones as part of the consultation sessions.
At the time of investigation44, 3 medical suites were available for lease in the Leading Healthcare Medical Centre,
located at 84 Mollison Street, Bendigo. Available suite sizes ranged from 104-370sqm with rents capped at
$375/sqm regardless of size. It was indicated by the leasing agent that the Leading Healthcare Medical Centre
comprises approximately 2,000sqm of lettable floorspace. The agent also indicated that the 3 available medical
suites are expected to be absorbed within 6 months.
Agents are generally of the opinion that the redevelopment of the Hospital may mean that additional demand for
medical office suites may be accommodated on the Hospital Precinct through increased provision of consulting
suites. Anecdotal evidence (from consultation sessions) also indicates that there is already an increased number
of enquiries for medical suites and doctors’ offices in Bendigo, in anticipation of the Hospital redevelopment.
43 April 2013
44 April 2013

Bendigo Hospital Precinct Structure Plan
Ref: M13038 FINAL DRAFT P a g e 66 | 74 Hill PDA
6.4 IMPLICATIONS
Demand from existing and future workers, visitors, patients and local residents will generate opportunities for the
development of greater retail goods and services provision in the Study Area. Opportunities should particularly be
focused on Bridge Street which is capable of accommodating food and beverage and bulky goods retailing.
Beyond Bridge Street, retail activity should be of a limited scale and may include the likes of cafes and
restaurants, retail services (such as dry cleaning and Laundromats) and convenience retailing (convenience store,
newsagent, pharmacy etc).
Future opportunities for commercial activity will largely comprise allied health and medical suite development.
This form of development is also suitable for Bridge Street given the existing mix of commercial medical suites
located on the street. There may also be some opportunity for the conversion of former residential dwellings to
suites and offices for allied health and medical practitioners in other parts of the Study Area.
There will be some constraints to retail and commercial development in the Study Area however, including
existing planning policy and the new Victorian planning zones being introduced on July 1 2013.
The established City of Greater Bendigo Activity Centre Hierarachy set out in the Bendigo CLS nominates a
preferred delineation between higher order and local centres. The Bendigo CBD is the highest order activity
centre in the City of Greater Bendigo with policy dictating that its primacy be protected and maintained over the
long-term. Given the proximity of the Study Area to the Bendigo CBD, the scale and type of some retail
development is constrained, particularly those higher order discretionary retail uses.
The range of permissible uses in the City of Greater Bendigo planning zones also limits retail development in the
Study Area. Bridge Street, which is nominated as an area to accommodate retail and commercial development in
this report is currently under a Business 4 Zone (B4Z). The B4Z allows for only restricted retail premises (bulky
goods) as a permissible use. Other retail activity is prohibited (including all shop uses) or requires a planning
permit (convenience shop).
There will be more scope for retail development once the reformed planning zones are introduced by the Victorian
Government on July 1. As part of the reformed zones, the B4Z will become part of the Commercial 2 Zone (C2Z).
The C2Z will allow a broader range of uses than was previously allowed in the B4Z. The major changes will be
that there will be no permit requirement for food and drink retail premises (under 100sqm) office and trade
supplies stores. Small supermarkets (under 1,800sqm) will be a permit applicable use and there can be up to
500sqm of adjacent shop retail uses in the new C2Z, however this only applies to land within metropolitan
Melbourne.
Therefore, whilst food and drink premises will become permissible and restricted retail development will remain as
an accepted use under the C2Z, shop use will be restricted along Bridge Street.

Bendigo Hospital Precinct Structure Plan
Ref: M13038 DRAFT P a g e 67 | 74 Hill PDA
7. IMPLICATIONS FOR THE STUDY AREA This Chapter summarises the main outcomes and implications for the Study Area from the demographic,
residential, retail and commercial analysis within this Technical Assessment.
Table 31 - Issues and Opportunities for the Study Area
Topic Strength, Challenge or Opportunity Response
Population and
Dwelling Growth
Population in the Central SLA (the area of influence
of the Hospital and Study Area) is anticipated to
grow by around 200 new residents per annum to
2031. Despite relatively low historic dwelling
growth, forecasts are predicting much stronger
demand over the period to 2031 with an average of
+92 new dwellings required annually throughout this
period.
Given that there are few vacant residential sites
within the Study Area, new residents will need to be
accommodated through increased densities and infill
development.
Housing Diversity and
Choice
Historic population decline in the Central SLA is
likely to be attributed to the increasing
predominance of empty nester households;
particular given there have been few additional
dwellings since 2001. The increasing conversion of
residential dwellings to commercial suites would
further contribute to this trend.
Housing mix and choice are essential. The provision
of medium density townhouses, terraces and
apartments are likely to meet the needs of existing
and forecast residents - particularly for university
students and those looking to downsize but remain
within their local community (e.g. retirees and the
elderly).
Evidence suggests:
A significant decline in households with
children;
An increasing proportion of couples without
children and lone person households;
Increasing median age and decreasing
household sizes.
Young people (15 – 29 year olds) are the most
highly represented age group in the Central SLA
and will continue to be so through to 2031. Many of
these are likely to be students associated with La
Trobe and Monash universities. However, to 2031
the population growth in the area is expected to be
more highly concentrated in the elderly age cohorts
(60+ years).
Housing Supply The proportion of rental properties in the Central
SLA has increased which can be attributed to an
increasing number of: university students, new
workers, and visiting professionals – particularly
given growth in construction, education and
training, and health care and social assistance
workers. This is only going to increase with the
Hospital redevelopment and expansion.
There is a need to increase housing supply in or
close to the Study Area in order to meet the needs of
short-term (i.e. construction) and new permanent
workers and university students who would prefer to
live close to their place of work or study.
Housing demand in the Central SLA is largely
driven by investors, empty nesters, and by those
who are attracted by Bendigo’s inner city lifestyle.
These markets prefer dwellings within Bendigo CBD
and the Study Area and are unlikely to be attracted to
the residential growth areas. This market will look
elsewhere (including outside of Bendigo) if
appropriate residential product is not available.
Housing Affordability Increasing rental demand from students, workers
and visiting professionals has placed upward
pressure on rents (increasing rental values) and led
Consider more affordable residential product types,
so students, key workers and other groups are not
out-priced of the inner Bendigo market.
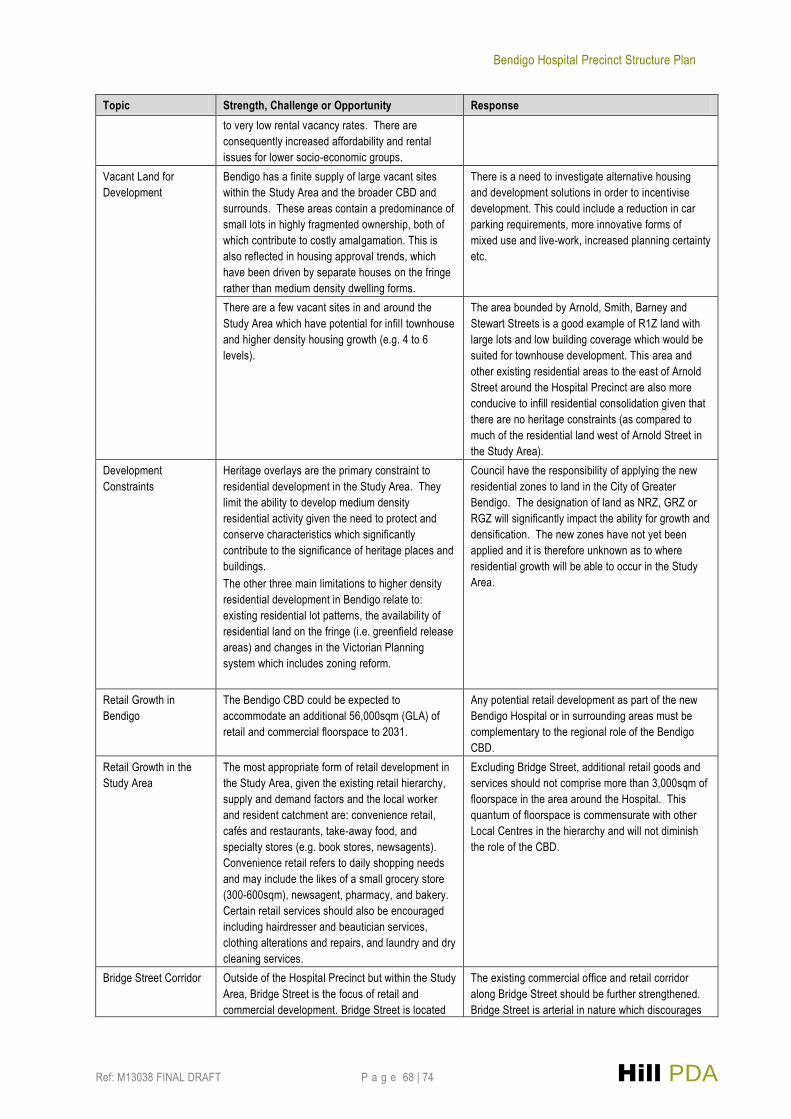
Bendigo Hospital Precinct Structure Plan
Ref: M13038 FINAL DRAFT P a g e 68 | 74 Hill PDA
Topic Strength, Challenge or Opportunity Response
to very low rental vacancy rates. There are
consequently increased affordability and rental
issues for lower socio-economic groups.
Vacant Land for
Development
Bendigo has a finite supply of large vacant sites
within the Study Area and the broader CBD and
surrounds. These areas contain a predominance of
small lots in highly fragmented ownership, both of
which contribute to costly amalgamation. This is
also reflected in housing approval trends, which
have been driven by separate houses on the fringe
rather than medium density dwelling forms.
There is a need to investigate alternative housing
and development solutions in order to incentivise
development. This could include a reduction in car
parking requirements, more innovative forms of
mixed use and live-work, increased planning certainty
etc.
There are a few vacant sites in and around the
Study Area which have potential for infill townhouse
and higher density housing growth (e.g. 4 to 6
levels).
The area bounded by Arnold, Smith, Barney and
Stewart Streets is a good example of R1Z land with
large lots and low building coverage which would be
suited for townhouse development. This area and
other existing residential areas to the east of Arnold
Street around the Hospital Precinct are also more
conducive to infill residential consolidation given that
there are no heritage constraints (as compared to
much of the residential land west of Arnold Street in
the Study Area).
Development
Constraints
Heritage overlays are the primary constraint to
residential development in the Study Area. They
limit the ability to develop medium density
residential activity given the need to protect and
conserve characteristics which significantly
contribute to the significance of heritage places and
buildings.
The other three main limitations to higher density
residential development in Bendigo relate to:
existing residential lot patterns, the availability of
residential land on the fringe (i.e. greenfield release
areas) and changes in the Victorian Planning
system which includes zoning reform.
Council have the responsibility of applying the new
residential zones to land in the City of Greater
Bendigo. The designation of land as NRZ, GRZ or
RGZ will significantly impact the ability for growth and
densification. The new zones have not yet been
applied and it is therefore unknown as to where
residential growth will be able to occur in the Study
Area.
Retail Growth in
Bendigo
The Bendigo CBD could be expected to
accommodate an additional 56,000sqm (GLA) of
retail and commercial floorspace to 2031.
Any potential retail development as part of the new
Bendigo Hospital or in surrounding areas must be
complementary to the regional role of the Bendigo
CBD.
Retail Growth in the
Study Area
The most appropriate form of retail development in
the Study Area, given the existing retail hierarchy,
supply and demand factors and the local worker
and resident catchment are: convenience retail,
cafés and restaurants, take-away food, and
specialty stores (e.g. book stores, newsagents).
Convenience retail refers to daily shopping needs
and may include the likes of a small grocery store
(300-600sqm), newsagent, pharmacy, and bakery.
Certain retail services should also be encouraged
including hairdresser and beautician services,
clothing alterations and repairs, and laundry and dry
cleaning services.
Excluding Bridge Street, additional retail goods and
services should not comprise more than 3,000sqm of
floorspace in the area around the Hospital. This
quantum of floorspace is commensurate with other
Local Centres in the hierarchy and will not diminish
the role of the CBD.
Bridge Street Corridor Outside of the Hospital Precinct but within the Study
Area, Bridge Street is the focus of retail and
commercial development. Bridge Street is located
The existing commercial office and retail corridor
along Bridge Street should be further strengthened.
Bridge Street is arterial in nature which discourages
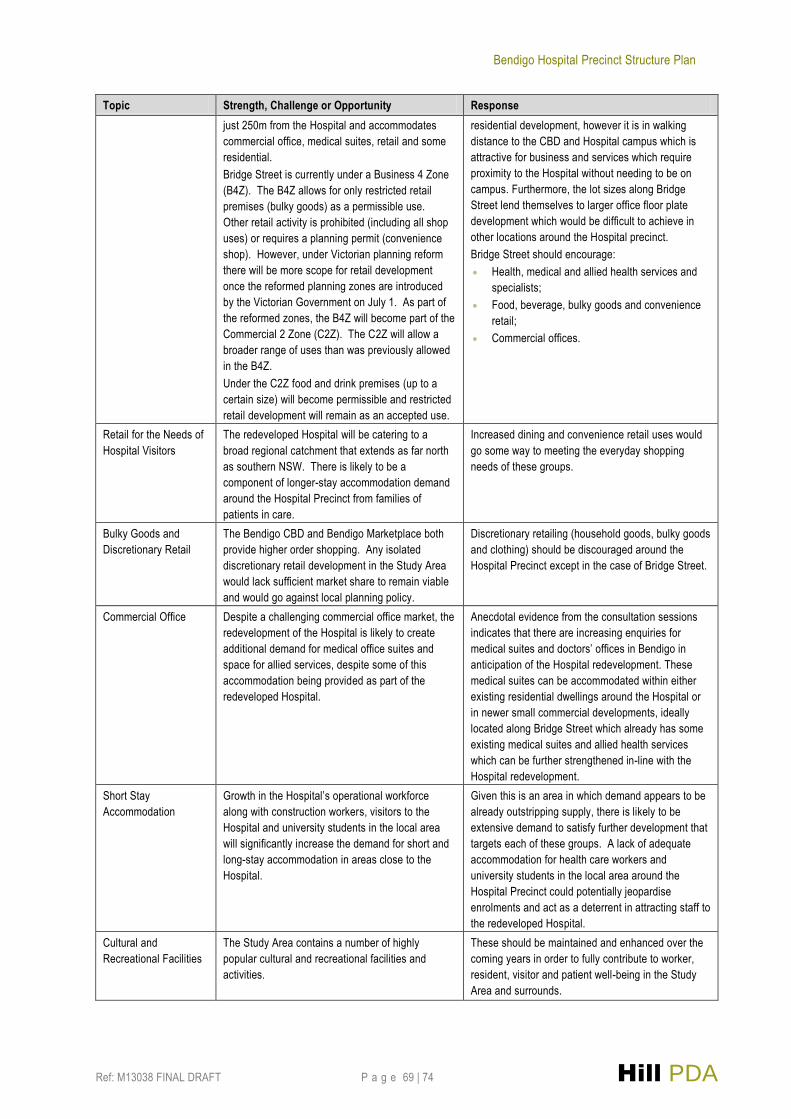
Bendigo Hospital Precinct Structure Plan
Ref: M13038 FINAL DRAFT P a g e 69 | 74 Hill PDA
Topic Strength, Challenge or Opportunity Response
just 250m from the Hospital and accommodates
commercial office, medical suites, retail and some
residential.
Bridge Street is currently under a Business 4 Zone
(B4Z). The B4Z allows for only restricted retail
premises (bulky goods) as a permissible use.
Other retail activity is prohibited (including all shop
uses) or requires a planning permit (convenience
shop). However, under Victorian planning reform
there will be more scope for retail development
once the reformed planning zones are introduced
by the Victorian Government on July 1. As part of
the reformed zones, the B4Z will become part of the
Commercial 2 Zone (C2Z). The C2Z will allow a
broader range of uses than was previously allowed
in the B4Z.
Under the C2Z food and drink premises (up to a
certain size) will become permissible and restricted
retail development will remain as an accepted use.
residential development, however it is in walking
distance to the CBD and Hospital campus which is
attractive for business and services which require
proximity to the Hospital without needing to be on
campus. Furthermore, the lot sizes along Bridge
Street lend themselves to larger office floor plate
development which would be difficult to achieve in
other locations around the Hospital precinct.
Bridge Street should encourage:
Health, medical and allied health services and
specialists;
Food, beverage, bulky goods and convenience
retail;
Commercial offices.
Retail for the Needs of
Hospital Visitors
The redeveloped Hospital will be catering to a
broad regional catchment that extends as far north
as southern NSW. There is likely to be a
component of longer-stay accommodation demand
around the Hospital Precinct from families of
patients in care.
Increased dining and convenience retail uses would
go some way to meeting the everyday shopping
needs of these groups.
Bulky Goods and
Discretionary Retail
The Bendigo CBD and Bendigo Marketplace both
provide higher order shopping. Any isolated
discretionary retail development in the Study Area
would lack sufficient market share to remain viable
and would go against local planning policy.
Discretionary retailing (household goods, bulky goods
and clothing) should be discouraged around the
Hospital Precinct except in the case of Bridge Street.
Commercial Office Despite a challenging commercial office market, the
redevelopment of the Hospital is likely to create
additional demand for medical office suites and
space for allied services, despite some of this
accommodation being provided as part of the
redeveloped Hospital.
Anecdotal evidence from the consultation sessions
indicates that there are increasing enquiries for
medical suites and doctors’ offices in Bendigo in
anticipation of the Hospital redevelopment. These
medical suites can be accommodated within either
existing residential dwellings around the Hospital or
in newer small commercial developments, ideally
located along Bridge Street which already has some
existing medical suites and allied health services
which can be further strengthened in-line with the
Hospital redevelopment.
Short Stay
Accommodation
Growth in the Hospital’s operational workforce
along with construction workers, visitors to the
Hospital and university students in the local area
will significantly increase the demand for short and
long-stay accommodation in areas close to the
Hospital.
Given this is an area in which demand appears to be
already outstripping supply, there is likely to be
extensive demand to satisfy further development that
targets each of these groups. A lack of adequate
accommodation for health care workers and
university students in the local area around the
Hospital Precinct could potentially jeopardise
enrolments and act as a deterrent in attracting staff to
the redeveloped Hospital.
Cultural and
Recreational Facilities
The Study Area contains a number of highly
popular cultural and recreational facilities and
activities.
These should be maintained and enhanced over the
coming years in order to fully contribute to worker,
resident, visitor and patient well-being in the Study
Area and surrounds.
Bendigo Hospital Precinct Structure Plan
Ref: M13038 FINAL DRAFT P a g e 70 | 74 Hill PDA
DISCLAIMER
1. This report is for the confidential use only of the party to whom it is addressed ("Client") for the specific
purposes to which it refers and has been based on, and takes into account, the Client’s specific
instructions. It is not intended to be relied on by any third party who, subject to paragraph 4, must make
their own enquiries in relation to the issues with which this report deals.
2. Hill PDA makes no representations as to the appropriateness, accuracy or completeness of this report
for the purpose of any party other than the Client ("Recipient"). Hill PDA disclaims all liability to any
Recipient for any loss, error or other consequence which may arise as a result of the Recipient acting,
relying upon or using the whole or part of this report's contents.
3. This report must not be disclosed to any Recipient or reproduced in whole or in part, for any purpose
not directly connected to the project for which Hill PDA was engaged to prepare the report, without the
prior written approval of Hill PDA. In the event that a Recipient wishes to rely upon this report, the
Recipient must inform Hill PDA who may, in its sole discretion and on specified terms, provide its
consent.
4. This report and its attached appendices are based on estimates, assumptions and information provided
by the Client or sourced and referenced from external sources by Hill PDA. While we endeavour to
check these estimates, assumptions and information, no warranty is given in relation to their reliability,
feasibility, accuracy or reasonableness. Hill PDA presents these estimates and assumptions as a basis
for the Client’s interpretation and analysis. With respect to forecasts, Hill PDA does not present them
as results that will actually be achieved. Hill PDA relies upon the interpretation of the Client to judge for
itself the likelihood of whether these projections can be achieved or not.
5. Due care has been taken to prepare the attached financial models from available information at the
time of writing, however no responsibility can be or is accepted for errors or inaccuracies that may have
occurred either with the programming or the resultant financial projections and their assumptions.
6. This report does not constitute a valuation of any property or interest in property. In preparing this
report Hill PDA has relied upon information concerning the subject property and/or proposed
development provided by the Client and Hill PDA has not independently verified this information except
where noted in this report.
7. In relation to any valuation which is undertaken for a Managed Investment Scheme (as defined by the
Managed Investments Act 1998) or for any lender that is subject to the provisions of the Managed
Investments Act, the following clause applies:
8. This valuation is prepared on the assumption that the lender or addressee as referred to in this
valuation report (and no other) may rely on the valuation for mortgage finance purposes and the lender
has complied with its own lending guidelines as well as prudent finance industry lending practices, and
has considered all prudent aspects of credit risk for any potential borrower, including the borrower’s
ability to service and repay any mortgage loan. Further, the valuation is prepared on the assumption
that the lender is providing mortgage financing at a conservative and prudent loan to value ratio.
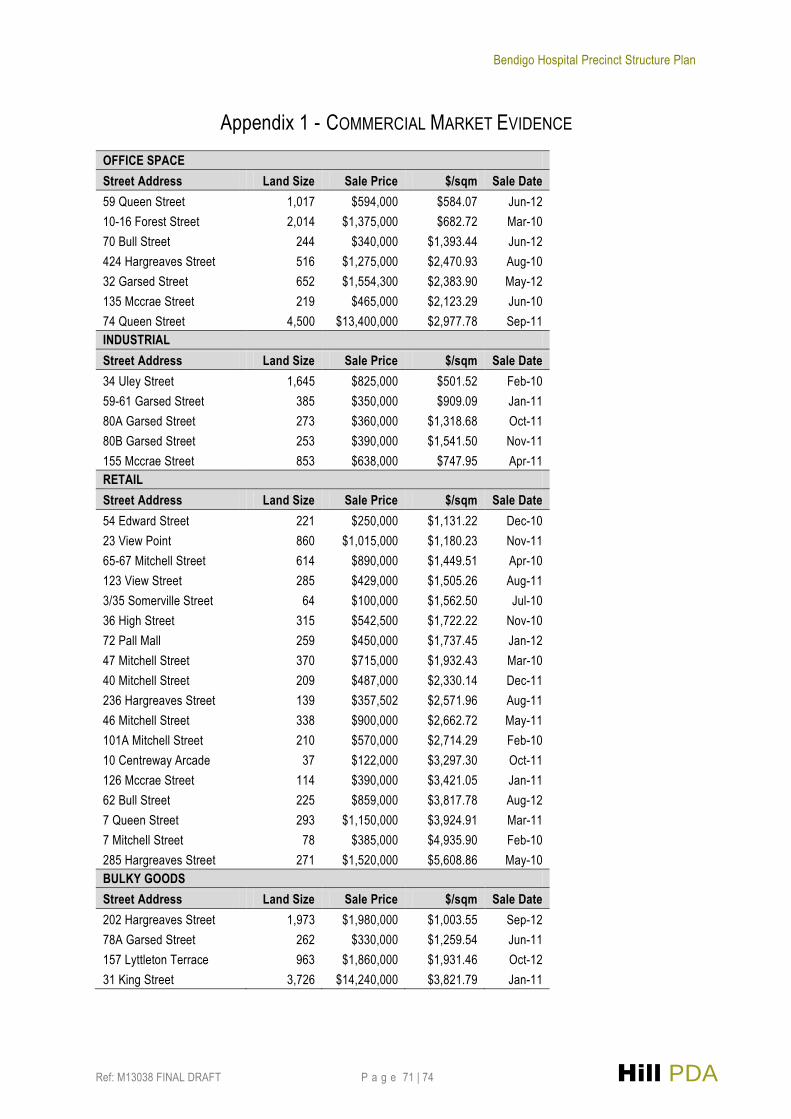
Bendigo Hospital Precinct Structure Plan
Ref: M13038 FINAL DRAFT P a g e 71 | 74 Hill PDA
Appendix 1 - COMMERCIAL MARKET EVIDENCE
OFFICE SPACE
Street Address Land Size Sale Price $/sqm Sale Date
59 Queen Street 1,017 $594,000 $584.07 Jun-12
10-16 Forest Street 2,014 $1,375,000 $682.72 Mar-10
70 Bull Street 244 $340,000 $1,393.44 Jun-12
424 Hargreaves Street 516 $1,275,000 $2,470.93 Aug-10
32 Garsed Street 652 $1,554,300 $2,383.90 May-12
135 Mccrae Street 219 $465,000 $2,123.29 Jun-10
74 Queen Street 4,500 $13,400,000 $2,977.78 Sep-11
INDUSTRIAL
Street Address Land Size Sale Price $/sqm Sale Date
34 Uley Street 1,645 $825,000 $501.52 Feb-10
59-61 Garsed Street 385 $350,000 $909.09 Jan-11
80A Garsed Street 273 $360,000 $1,318.68 Oct-11
80B Garsed Street 253 $390,000 $1,541.50 Nov-11
155 Mccrae Street 853 $638,000 $747.95 Apr-11
RETAIL
Street Address Land Size Sale Price $/sqm Sale Date
54 Edward Street 221 $250,000 $1,131.22 Dec-10
23 View Point 860 $1,015,000 $1,180.23 Nov-11
65-67 Mitchell Street 614 $890,000 $1,449.51 Apr-10
123 View Street 285 $429,000 $1,505.26 Aug-11
3/35 Somerville Street 64 $100,000 $1,562.50 Jul-10
36 High Street 315 $542,500 $1,722.22 Nov-10
72 Pall Mall 259 $450,000 $1,737.45 Jan-12
47 Mitchell Street 370 $715,000 $1,932.43 Mar-10
40 Mitchell Street 209 $487,000 $2,330.14 Dec-11
236 Hargreaves Street 139 $357,502 $2,571.96 Aug-11
46 Mitchell Street 338 $900,000 $2,662.72 May-11
101A Mitchell Street 210 $570,000 $2,714.29 Feb-10
10 Centreway Arcade 37 $122,000 $3,297.30 Oct-11
126 Mccrae Street 114 $390,000 $3,421.05 Jan-11
62 Bull Street 225 $859,000 $3,817.78 Aug-12
7 Queen Street 293 $1,150,000 $3,924.91 Mar-11
7 Mitchell Street 78 $385,000 $4,935.90 Feb-10
285 Hargreaves Street 271 $1,520,000 $5,608.86 May-10
BULKY GOODS
Street Address Land Size Sale Price $/sqm Sale Date
202 Hargreaves Street 1,973 $1,980,000 $1,003.55 Sep-12
78A Garsed Street 262 $330,000 $1,259.54 Jun-11
157 Lyttleton Terrace 963 $1,860,000 $1,931.46 Oct-12
31 King Street 3,726 $14,240,000 $3,821.79 Jan-11

Bendigo Hospital Precinct Structure Plan
Ref: M13038 FINAL DRAFT P a g e 72 | 74 Hill PDA

Bendigo Hospital Precinct Structure Plan
Ref: M13038 FINAL DRAFT P a g e 73 | 74 Hill PDA
HOTEL/MOTEL
Street Address Land Size Sale Price $/sqm Sale Date
300 Napier Street 939 $1,875,000 $1,996.81 Jun-11
2A Queen Street 810 $1,850,000 $2,283.95 Sep-10
26 Forest Street 1,134 $2,810,000 $2,477.95 Nov-11
94 Mitchell Street 574 $1,200,000 $2,090.59 Oct-10
MEDICAL SUITES
Street Address Land Size Sale Price $/sqm Sale Date
147 Arnold Street 573 $410,000 $715.53 Dec-11
47 Myrtle Street 573 $650,000 $1,134.38 May-11
Source: RP Data (2013) & Hill PDA Research (2013)

Bendigo Hospital Precinct Structure Plan
Ref: M13038 FINAL DRAFT P a g e 74 | 74 Hill PDA
Appendix 2 - RESIDENTIAL MARKET EVIDENCE
The following table summarises residential development proposals in Bendigo.
Description & Address Lots/Units Expected
Completion
Status
Forest Park Estate Residential Subdivision
244 Edwards Road, Bendigo
1,200 lots Late 2030 Rezoning Application Awaiting Approval From Minister Of Planning
Viewpoint Huntly Estate Subdivision
4-14 Staley St, California Gully
700 lots Late 2019 Early Planning
Evergreen Waters Estate Subdivision
646 McIvor Hwy, Junortoun
365 lots Early 2015 Subdivision Approval Engineering Drawings In Progress
Imagine Strathfieldsaye Estate
582-586 Napier St, White Hills
300 lots Late 2015 Early Planning
Apsley Street Residential Subdivision
41-47 Victoria St, Ironbark
120 lots Late 2014 Subdivision Application Submitted
Burgoyne Street Residential Subdivision
42-50 View St, Bendigo
87 lots Mid 2013 Subdivision Approval
Weeks Road Subdivision
Holmes Rd, Bendigo
172 lots Late 2014 Subdivision Approval
Dukes Lane Residential Subdivision
Victa Rd, Bendigo
167 lots Early 2014 Subdivision Application Submitted
Ballina Mores Pty Ltd Residential Subdivision
164 Barkly St, Bendigo
77 lots Late 2013 Subdivision Approval Further Information Currently Unavailable
Source: CordellConnect (2013) & Hill PDA Research (2013)
.