july 1991 doc. ieee p802.11/91-68 1 bruce...
TRANSCRIPT
July 1991 Doc. IEEE P802.11/91-68
AN ENGINEER'S SUMMARY of an ISM BAND WIRELESS LAN
Bruce Tuch NCR Corporation
Utrecht the Netherlands
1
The following article is submitted to the IEEE 802.11 committee to be used as reference material. It is not the intention of the author to propose this as a standard. The design trade/offs and the measurements discussed can be useful in facilitating further discussions and contributions, leading to the our future 802.11 protocol layer.
July 1991 Doc. IEEE P802.11/91-68
AN ENGINEER'S SUMMARY of an ISM BAND WIRELESS LAN
2
Bruce Tuch NCR Corporation
Utrecht the Netherlands
Invited Paper
Abstract- Activity in the field or wireless voice communications bas been enormous in the last years, as bas been shown by the evolution or cordless telephones. cellular systems Bnd the various Personal Communications Standard activities. Until recently High Speed Data Communications Cordless Local Area Networks (CLANS) have not been getting much attention both in marketing and research. This paper discusses the design philosophy in the development of WaveLAN, the first higb speed ISM band CLAN on the market. The technical trade olTs, and standard LAN Benchmark tests are presented.
I. INTRODUCTION
The best word to describe the computer industry is CHANGE. The amount and the rate of change is enormous with enough momentum to keep the race on. Various needs are coming at a cross road: High speed information transfer. powerful portable computers, dynamic office and retail infrastructures and, helped by the Cordless Phone, the end user expectations of cordless care free operation. ClAN development has been hampered by the relatively large, when compared with voice, spectral requirements and lack of fundamental research to define and overcome perceived channel impairmems using consumer oriented technology. Without a possible spectral allocation the risk for no return on investment for private research and development is quite high. a typical Catch 22 situation. The aUocation of the ISM band using Spread Spectrum technology, by the FederaJ Communication Commission (FCC) in 1985. has led the way for practical research and development activities with an end product as goal. In Chapter IT the technical requirements which infiuence Spectrum, IAN Protocol and security are discussed. In chapter lIT the Processing Gain/Data Rate trade off is discussed and the channel models used during the product development are shown. Chapter IV covers the radio architecture. technology and implementation issues. A SNR Outage prediction used to estimate link reliability, due to external noise, is given in chapter V. In chapter Yl the Simulation and Measurements of the radio in a multipath channel is covered. Standard Benchmark tests results, which measure lAN performance, are given in Chapter VII.
II. REQUIREMENTS of a ClAN
Wireless based data communication systems have been low speed, bandwidth allocation driven products. Since this is a IAN it must "feel" like one, cordless or not. An important
axiom in WaveIAN product development has been: Except for the benefits of cordless operation, the end user should observe the least possible difference with standard instaUed wired based IAN products.
A. The Spectrum
To facilitate high speed data communications, in the Mega bits/s range, the ISM Spread Spectrum band is used. It is noted that Spread Spectrum Modulation is a FCC requirement, stimulating research for commercial applications in these bands. Protocol based Spread-Spectrum systems using Code Division Multiple Access (COMA) techniques have been investigated for use with PBX connection oriented applications. Combination of voice statistics together with COMA has been proposed which predicts spectrally efficient system performance and is under field trial [26]. Data communications is fundamentally different than voice in its statistical properties. There is no user defmed pause time which can be used to maximize the system capacity. Also the basic structure of connection oriented fixed bandwidth/user system is different than a shared bandwidth data packet communication network, in which per user throughput is a function of total system load. COMA systems with dynamic fates as a function of totid ClAN load can be envisioned, but the complexity evolved using switched or programmable correlators. compared wilh more conventional structured time domain multiplex approaches, does not seem promising. Since lhe cost consequence for a COMA implementation is not negligible and the lack of "real time" voice statistics in IAN communications, COMA as a protocol technique has not been chosen. The Spread-Spectrum Modulation method and medium access protocol are two separate entities.
B. The Protocol Choice
The most abundant lAN ba.sed systems used today are IEEE 802 based standards or variants which conform to the ISO four layer communication model. The IEEE 802 committee has a charter to support 1 - 20 Mbit/s data rates on the physical medium. Data rates from 1 Mbit/s up to 16 Mbit/s using various wiring structures are available: Shielded and Unshielded twisted pair, coaxiaJ cable and glass fiber. The physical layer "raw" transmission speed is only one of the parameters which characterize different IAN protocols. Further comparison leads one to a more in depth throughput and delay characteristics assessment, with each protocol having its own set of advantages and disadvantages, depending upon

July 1991
the system's load and configuration. In keeping in stride wi.th our development axiom, an already accepted IEEE 802 standard should be used if possible. This is quite important from an end-user marketing perspective when introducing new technology. An advantage in having a standard interface "at the lowest level possible" is in various software development activities; applications already available for existing LAN equipment can easily be adapted, quickening the development cycle. Token Bus, a detenninistic token passing scheme, seemed a good candidate for a radio physical layer and the IEEE 802.4L Token Bus working group was investigating this matter. It eventually became apparent tbat due to the unique properties of the radio physical layer; not as reliable as cable based systems with asymmetric channel characteristics, that the Token Bus Protocol, in whicb a significant portion of the state machine is dedicated to "Token Management", could become unstable or have large delays due to token recovery mechanisms in the radio medium. Also bandwidth sharing, due to adjacent ClAN usage with electromagnetic overlap, must be solved by having isolated physical channels. 'This can be implemented [15] with the usual spectrum "break up" into multiple channels. Due to the nature of three dimensional indoor propagation the amount of frequencies needed is strongly dependant on various topological considerations. It is not clear at this point what reuse frequency set is needed and most likely, due to tbe variation of user topologies and requirements, never will be. Therefore the protocol must not ''break down" due to co-frequency adjacent ClAN interference but take on bandwidtb sharing responsibility. Another standard protocol is 802.3 Carrier Sense Multiple Access/Collision Deted: (CSMA/CD) wb.ich has the largest installed base in the IAN market. Due to the large dynamic range of the radio medium, bandwidth efficient collision detection is technica.l1y difficult. Various mechanisms exist for coUision detection implementations but the cost in bandwidth does not seem to outweigh the benefits of overall throughput in normal loading conditions. Therefore Carrier Sense Multiple Access/CoUision Avoidance (CSMA/CA) is closest to an IEEE Standard, which, due to its random access nature, is robust with respect to protocol level bandwidth sharing and radio channel charaaeristics. Standard activity within the IEEE 802 comminee for a new Wireless Media Physical Layer Protocol, 802.11, is now under way.
C. Security
Transmission of data via radio signals gives the perception of lack of privacy .of commu.nication due to the "open media". The design of any ClAN must address this issue. WavelAN has three leve.1s of security:
a. Network Identification (NWID).
In each data package a NWID identifying separate CLAN systems. Only data with the proper NWID is accepted for upper level software transport. Besides giving a first level of security, this optimizes the bandwidth sharing facility of the CSMA protocol.
Doc. IEEE P802.11/91-68 3
b. Spread Spectrum Modulation.
While not a "military" implementation, it does give a eavesdropping threshold. Another WavelAN board or equivalent Spread Spectrum Demodulator is needed, not just a amateur radio scanner hooked up to a modem.
c. National Bureau of Standards Data Encryption Standard (NBS-DES).
A DES VLSI option is implemented which gives a very high "standard level" of security.
m. TIIE PHYSICAL LAYER
A. Processing Gain and Data Rate in the ISM Band.
Within the FCC reguJations either Frequency Hopping (FH) or Direct Sequence Spread Spectrum Modulations can be implemented. While Frequency Hopping systems have some interesting diversity and multipath characteristics (29), due to the FCC regulated bandwidth limitation, FH systems are data rate limited to low kB/sec rates.
Note: The moduiaJion bandwidth has been recently increased [rom 25 kHz to 500 kHz which would allow data rateS up to 250kbil/s.
Attention therefore is focused on Direct Sequence Spread Spectrum. Three bands are available for unlicensed used under part 15 rules and regulations [21]:
902 - 928 MHz 2400 - 2483.5 MHz 5725 - 5850 MHz
First out product development has concentrated on the 902 - 928 MHz band due to the implementation cost trade offs.
1. How much Bandwidth Spreading?
Since the spread spectrum modulation is not used as an access technique (COMA) the trade offs involved are data rate, a robust connection in the presence of interference and the irreducible outage due to multipath intersymbol interference. In military Spread Spectrum systems the Processing Gain, which is a measure of system robustness to jamming and eave.';dropping by the "enemy" is of vital importance. Various techniques have been developed to allow large Processing Gains (greater than 25 dB) with minimum receiver code acquisition times [3],[8),[31}. It is vital to realize that the characteristics of an "enemy" and the constraints put upon a system which must deal with this attack are quite different for a commercial communication system. In military systems one must assume that the "jammer" will try to constantly hit the system under attack. This is quite different than, for example, a ISM band interference signal which is quite comfortable staying just where it is. The larger the Processing gain of a Spread Spectrum system the higher the COSt and sped:raI inefficiency. In some cases larger Processing Gain can degrade interference immunity with respect to other conventional

July 1991
frequency assignment techniques. Considering the fact that Spread Spectrum is not used as a protocol method nor is it the optimal "robust" modulation technique using a given bandwidth, one could question why use this at all? The fLrst fact is that in the ISM band a minimum processing gain of 10 dB is a requirement. For a fIXed transmit power the power density (wansfHz) decreases in proportion with the Processing Gain. While other techniques of power reduction and spectrum management are possible, this is not the focus of the Part 15 rules and regulations. (Spread Spectrum does not requite a standard "spectrum management protocol" and therefore overlay with already existing systems is possible). In terms of maximizing data ratc, without Spread Spectrum modulation in the indoor unequalized channel, data rates on the order 300 Kbps can be supported [1],(7]. Due to inherent Spread Spectrum path resolution properties a 2 Mbitfs data rare is achieved witlrin a 11 MHz Spread Spectrum bandwidth. In summary, a Processing Gain is used which takes into account the trade oCfs in data rate, robust performance, cost and legal considerations.
B. The Channel Model
1. Channel Echo and MUltipath
Recently a wealth of information concerning indoor propagation characteristics has become available. Initial sructies have shown wide variation in the delay spread parameter, ranging from 30 ns to 250 ns (9)-[11), [28] depending upon the environment, measurement dynamic range and threshold levels. Correlation Bandwidth measurements performed by NCR [34) of a typical office showed large correLation bandwidths (.5 correLation @ 12 MHz) which support the time domain low delay spread measurement data. For modem testing, an Air Channel Simulator (ACE) was developed. This is a data acquisition unit, which takes a RF modulated signal (within 904 MHz - 926 MHz) down converts into I and Q components, stores this in digital form and process this with a programmable impulse response using a time invariant discrete channel model (35), [19]:
l h(T) = E PjOO(T-Tj)oexp(jai)
i=1 Where: Ti the ith path delay.
(1)
Pi the ith path gain, with a Rayleigh distributed probability density function.
L the number of paths.
ai the ith path phase, with a uniform pdf within (0,21').
The pdf of the path power gain, ai = Pi', is found with a change variables (25J giving:
(2)
In which the total channel power gain is normalized to unity: E[E ai] = 1.
Doc. IEEE P802.11/91-68 4
Subsequently the impulse response convolved I and Q signals are either upconverted for transmission (hardware modem testing) or further demodulated using the proposed receiver's processing algorithms.
2. Large Scale Power Variation
The channel model of equation (1) gives the microscopic, with respect to distances on the order of wavelengths, properties of the channel. The macroscopic large scale signal variation, on the order of meters between rooms and different areas, is not taken into account. The macroscopic power variation has been successfully modeled [2J as a log-normal distributed random variable. U(r), with pdf:
Where: r the Transmit to Receiver distance
m(r) is the mean power, nolOolog(r) + constant, as a function of distance.
The parameters most often found in the literature are the attenuation exponent, n, and the standard deviation, u. Another parameter that has been found useful in the characterization of different environments [16) is a two exponent cross over point. For ctistances "close to" the antenna, in a Line of Sight path (LOS), the attenuation has been found to be close to free space, n=-2, value. At distances in which significant "clutter" oCCU.T'S an increase in the attenuation exponent is found. Modeling in such a way decreases the standard deviation about the best fit regression lines. Characterization of attenuation of indoor environments is still being done by various researchers [201, [30] with great promise of coupling known building topologies with accurate attenuation predictions.
P.-p ,",In w\ 0 .... Plete ..
: : : : :: ~ i :
: : '! :
:: : I ! J" : ; :
: : : : t ~." :! .
, ! , i: , .
Il 18
r 3 111
D labnce Pletan
y = 5 dB/div Figure 1. Power variation WIt 1 meter with 8.5 m cross point.

July 1991
C. Polarization Diversity
A known technique to mitigate Rayleigh fading is the use of spacial diversity. Large Cross Polarization Coupling in the indoor channel has been reported [6]. Therefore the use of Polarization Diversity .is an attractive method in limiting antenna size. Measurements have been done to detennine the correlation between the receiver signal power between horizontal and vertically polarized receiver antennas.
1. Measurement Set-Up and Procedure
The vertical dipole transmit antenna, located 1 meter above the ground, radiates a Continuous Wave (CW), signal. For reception, vertical and horizontal polarized dipoles (RX System) are fIXed (crossing each other) on an arm which is mounted on a rotating post. Each antenna is connected via a DPSf RF PIN switch to a Spectrum Analyzer. The PIN SwitCh, Rotating post and Spectrum Analyzer is under Personal Computer controL The RX System is placed a set distance away from the transmitter which defmes a cell location. During one measurement run the post is stepped through 35 positions, each separated from each other by 1/4 wavelength. During each step the received signal power is measured on the vertical and then, via the PIN Switch, horizontal antenn.a. Also the received power from both antennas is measured twice, with the same deJay between measurements th.at occurs wh.en antennas are switched. Three such measurements are done per cell, with 1 meter distance between the previous RX System position. In this way 135 measurement points are obtained per cell location. The calibrated transmit power, taking into account all cable loss, is 8 dBm.
2. Results
A typical office building h.as been measured (Cross over 8.5 m, n= -3.6, a"'" 3.7 dB). Without a Line of Sight (LOS) path between TX and RX System a large Cross Coupling has been found with a large variation between receiver sights. Also the Correlation Coefficient, between vertical and horizontal polarized antenn.as received power levels, was found to be < .13 in aU locations. Correlation of measurements using the same antenna, due to the channel coherence lime (people walking in the office and unwanted movement of the TX or RX system) is greater than .85. An example correlation plot, between Horizontial and Vertical switched antennas, is shown in Figure 2. In this measurement the average cell power for Horizontial and Vertical antennas is -46.8 dBm and -49.8 dBm respectively giving 3 dB Cross Polariztion Coupling. This was found to be quite common showing, as was found in [61, that at a significant amount of locations, the received signal power is due to reflections which rotate the transmit polarization. Also the Cumulative Distnbutions show excellent Rayleigh Fading Characteristics (without LOS) for both horizontal and vertical polarizations. even with negative Cross Correlation Coupling and a vertically polarized receive antenna, as shown in Figure 3.
Doc. IEEE P802.11/91-68 5
Figure 2. Horizontal vs Vertical Correlation with Cross Correlation Coupling of + 3 dB (TX/RX distance of 28 m).
Figure 3. Cumulative Distribution of Vertical Antenna, with respect to cell average power, in a location with -3.7 dB Cross Polarization Coupling (TX/RX distance of 37 meters).
D. Network Topology
Due to the nature of the radio medium, the least number of radio links that achieves total network connectivity will give the best network performance. IAN Operating Systems Novell being dominant market choice, operate using a central server architecture. Therefore a centralized network topology is implemented by default. While this is a preferred form of operation, it is not required and the implementation of the radio does not prohibit peer to peer configurations. A typical indoor office is shown in Figure 4 with the Mean Power Gain given in Figure 1 (the data in the corridor and conference room has been omitted in this curve). The signal power attenuations, with respect to one meter from the ClAN Server, are underlined, dB. The office is homogeneous, composed of plastic "soft" partitions 1.5 meters tall except for the entrance and conference room. These are floor to ceiling reinforced concrete walls which gives a Significant 25 dB jump

July 1991
in attenuation from the adjacent cubicle. Also wave guiding of the signal down the corridor is present which has been found in similar topologies [301. (20]. Benchmark LAN testing has been done with Personnel Computers distributed throughout such an environment.
IV. TECHNOLOGY and 11iE RADIO ARCHITECTURE
The parameters of the radio modem are listed in Table I and are further clarified in the following discussion.
TABLE I: Radio Parameters
Frequency:
Bandwidth:
Modulation: (Information)
Chip Modulation: (pre filtered)
Data Rate:
915 14Hz
1114Hz (peak to null)
OQPSK
PSK
2 Mb/B
Chip Rate: 11 Mchipsls (Chip period, Tc ~ 90.9 ns)
Sensitivity: -72 dBm (Including 18 dB Man-Made Noise Factor)
Output Power +24 dBm
Antenna Gains (RX/TX) 2 dB
Doc. IEEE P802.11/91-68
I ~ ""
-ISo
.~ ..
• l2. ®
I) ... ,,<.r
!.Q !.L • •
.~
4 '''' .. ~, -
• !l
• :~ -
• n.
.:&...cl.& 'w."l I (W\
~ .... ® l!
Figure 4. Typical Office Configuration.
6
t. icn

July 1991 Doc. IEEE P802.11/91-68 7
I rnog( tenT> Nediun
Irn0lU.l Cos<2 .. fct)
Data Source
Data Differential SynOol Phase Nappi ng Encoder
Local Osc. fc
.. /2 Phase
Power Driver
Figure 5. Transmission Block Diagram
A. Modulation/Demodulation
Using complex notation the transmit signal is represented by [27]:
S(t) = RE[U(t)0exp(j2rlct») (4)
Where:
G
U(t) : t In.g(t-nT) n : -G
Is the low pass complex envelope of the signal.
T the symbol period of the transmitted information.
g(t) "Spread Spectrum" modulating pulse.
In Infonnation Vector, exp(jen), with four phase states: £{ '1/4, ..,/4, 3'f/4, -3 .. /4 }.
Equation (4) is composed of two components. One containing the infonnarjon, descnbed by the complex vector In, the other wlti.ch determines the spread spectrum characteristics of the signal. described by the real Spread Spectrum modulating waveform g(t-nT).
1. DQPSK Infonnation Modulation
In order to simplify the receiver design differential phase modulation has been implemented. In this way no absolute phase reference is needed for demodulation. In this case the absolute transmitted symbol phase is a function of the previou.s symbol phase state as follows:
Where:
en en-l
en ... den + 9n-l (5)
the differential symbol phase shift. with Gray phase to dibit encoding.
the transmitted symbol phase.
the previous symbol (T delayed) transmitted symbol phase.
A known drawback of differential phase modulation is the sensitivity to receiver carrier frequency offset. Cost effective crystals are readily available with accuracies from 50 ppm to 25 ppm. With a 915 MHz carrier this translates into a maximum received frequency offset of 92 kHz. A 1 Mbaud signaling, after differential dt:tection, gives an unacceptable phase error between symbols of 33 degrees. Therefore a phase compensation technique has been implemented in which this constant offset is adjusted within the preamble of the data frame. The maximum tolerable frequency offset is now a function of the frequency ambiguity function of the post detected spread spectrum signal [3]:
Where:
A(df) = I Sin( .. df0T)/'fdfoT II (6)
A( df) gives frequency offset signal's power ratio, with respect to zero frequency offset, at the output detector.
df the offset between carrier frequencies.
T the symbol time (1 p.s for 1 Mbaud).
July 1991
Substitution of f :: 92 kHz and T = 1 I'S into (6) gives a maximum detected signal power degradation of only .5 dB. This allows cost effective frequency synthesis for applications in all the available ISM bands.
2. Spread Spectrum Modulation
The spectrum determining function in equation (4), g(t-n1), is defIned as:
N g(t) = t Xk.P(t-kTc)
k = 1 Where:
g(t)
p(t)
the spread spectrum sequence.
the "chip" pulse:
TC
A unit pulse is given here as an example. Actually pre-filtered pulses are used improving the spectral characteristics of the transmit signal.
(7)
TC the chip duration such that N integer.
T/Tc is an
Xk the kth chip's coeffIcient E{l,-l}
The correlation properties of the signal are detennined by the real coefficient vector Xk. The Barker sequence is known to have exceUent, bounded by one, odd periodic autocorrelation propenies, imponant for robust multipath reception. An extended list of complex Barker Sequences (38] (unit magnitude and phase angles which are multiples of 6 degrees) has been published. Taking into account the trade-offs (Chap. III SecA) the 11 chip Barker sequence is used: -X = (1 -1 1 1 -1 1 1 1 -1 -1 -1)
It is noted. looking at (7) and (4). that a real barker sequence causes the signal to pass through the origin of the complex plane. The carrier is Phase Shift Keyed, PSK, with the Barker chip code. As will be shown the sideband regeneration, after chip pulse meering. noise floor and power stage efficiency requirements are easily met using this signal structure.
3. The Output Spectrum
Given the scarcity of spectral resources, the efficient use of the spectrum is quite important. The theoretically most spectraUy efficient modulalion pulse shape is the Sin(x)/x, which gives a "brick waU" rectangular frequency transfer function. One common physically realizable pulse which approximates this is the Raised Cosine. An implementation obstacle with this class of pulse shaping is that the transmit signal has a non constant envelope and the need for linear power amplification. Various forms specrraUy efficient constant envelope modulation containing memory, Tame Frequency Modulation as an example, have developed [33]. One requirement is flexibility in the data symbol sequence which is transmitted. Due to the Spread-Spectrum modulation structure, the transmitted Barker
Doc. IEEE P802.11/91-68 8
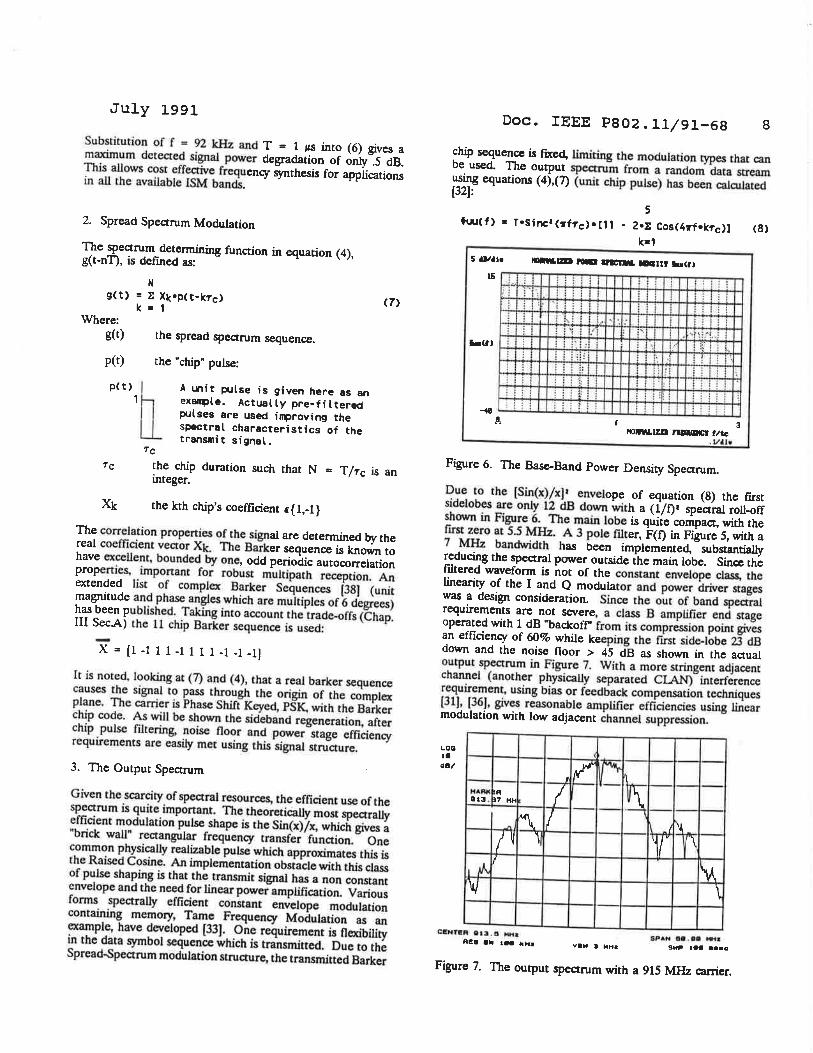
chip sequence is fIXed, limiting the modulation types that can be used. The output spectrum from a random data stream using equations (4),(7) (unit chip pulse) has been calculated [32]:
5 tuu(f) s T.Sincl(Tf~c).[11 - 2.E Cos(4Tf.kTc)]
k=1 5 ..... 1.
-48 : : : : : : : : : : : i : : : :: : .1,
Figure 6. The Base--Band Power Density Spectrum.
(8)
Due to the (Sin(x)/xjl envelope of equation (8) the flIst sidelobes are only 12 dB down with a (1/t)1 spectral roll-off shown in Figure 6. The main lobe is quite compact, with the first zero at 5.5 MHz. A 3 pole filter, F(t) in Figure 5, with a 7 MHz bandwidth has been implemented, substantia1ly reducing the spectral power outside the main lobe. Since the filtered waveform is not of the constant envelope class, the linearity of the I and Q modulator and power driver stages was a design consideration. Since the out of band spectral requirements are not severe, a class B amplifier end stage operated with 1 dB "backoff' from its compression point gives an effIciency of 60% while keeping the fLrst side-lobe 23 dB down and the noise floor > 45 dB as shown in the actual output spectrum in Figure 7. Wilh a more string~nt a~jacent channel (another physically separated CLAN) lnterterence requirement. using bias or feedback compensation techniques (31), (36), gives reasonable amplifier efficienci'7 using linear modulation with low adjacent channel suppresslon.
HAAIC ' R IIl3 . p7 HH
~ ~ 71 II
"" \J
CB'Nr.A 013. . 0 MHa RIE. eM ..... Ha
.1
I II
It/'" C h
I.V\ I-
~ - -111
1\\ \
S PAN e . ...... . !lWP ,.. ".0
Figure 7. The output spectrum with a 915 MHz carrier.
July 1991
4. Spread Spectrum Demodulation
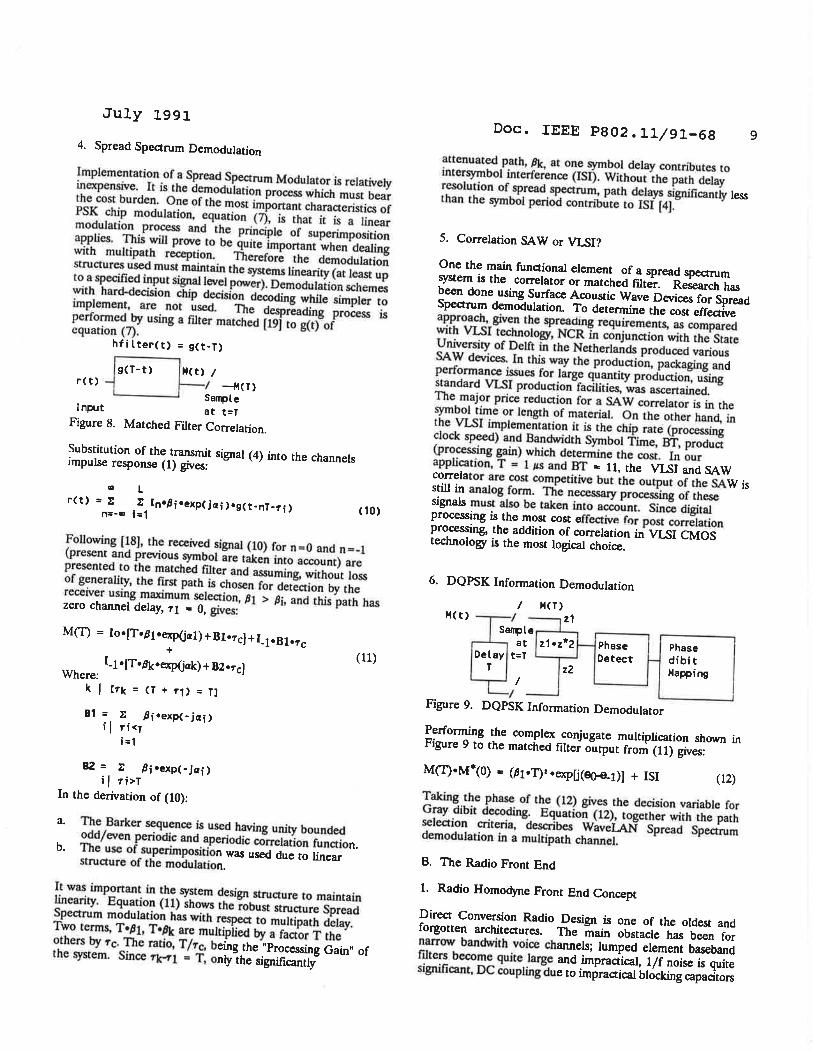
Implementation of a Spread Spectrum Modulator is relatively inexpensive. It is the demOdulation process which must bear the cost burden. One of the most important ch.aracteristics of PSK crnp modulation. equation (7), is that it is a linear modulation process and the principle of superimposition applies. This will prave to be quite important when dealing with multipath reception. Therefore the demodulation structures used must maintain the systems linearity (at least up to a specified input signal level power). Demodulation schemes with hard-decision chip decision decoding while simpler to implement, are not used. The despreading process is performed by using a ruter matched (19) to g(t) of equation (7). hfilter(t) = g(t-T)
Igu-t) IMM«tt» I ret) -l r----' --M(T) L-___ ..... Sa~le
Input at t=T Figure 8. Matched Filter Correlation.
Substitution of the transmit signal (4) into the channels impulse response (1) gives:
CD L ret) = t t Ine~ieexp(jai)eg(t-nT-~i) n=-CD i.1 (10)
Following [18), the received signal (10) for n=O and n=-1 (present and previous symbol are taken into account) are presented to the matched filter and assuming, without loss of generality, the rltSt path is chosen for detection by the receiver using maximum selection, ~1 > Pi, and this path has zero channel delay, 1'1 = 0, gives:
M(T) = loe[T-Meexp(jal)+ B1e1'c]+t1 eBle1'c + (11) l_le[TeP\ceexp(jak) + Ble1'c)
Where: k I [1'k = (T + ~1> = T]
B1 = t ~ieexp(-jai) iI 1'i<T i=1
B2 = t ~ieexp(-jai) il .,.i>T
In the derivation of (10):
a. The Barker sequence is used having unity bounded odd/even periodic and aperiodic correlation function. b. The use of superimposition was used due to linear structure of the modulation.
It was important in the system design structure to maintain linearity. Equation (11) shows the robust structure Spread Spectrum modulation has with respect to multipath delay. Two terms., Tep1, TePk are multiplied by a factor T the others by ~c. The ratio, T lTc, being the "Processing Gain" of the system. Since 'Tk"""l = T, only the significantly
Doc. IEEE P802.11/91-68 9
attenuated path, PIc, at one symbol delay contributes to intersymbol interference (lSI). Without the paUl delay resolution of spread spectrum, path delays significantly less than the symbol period contribute to lSI (4).
5. Correlation SAW or VLSI?
One the main functional element of a spread spectrum system is the correlator or matched filter. Research has been done using Surface Acoustic Wave Devices for Spread Spectrum demodulation. To determine the cost effective approach, given the spreading requirements., as compared with VISI tec.hnology, NCR in conjunction with the State University of Delft in the Netherlands produced various SAW devices. In this way the production, packaging and performance issues for large quantity production, using standard VLSI production facilities, was ascertained. The major price reduction for a SAW correlator is in the symbol time or length of material. On the other hanc\. in the VLSI implementation it is the chip rate (processing clock speed.) and Bandwidth Symbol Time, BT, product (processing gain) which determine the cost. In OUT application. T = 1 I'S and BT = 11, the VLSI and SAW correlator are cost competitive but the output of the SAW is still in analog form. The necessary processing of these signals must also be taken into account. Since digital processing is the most cost effective for post correlation processing, the addition of correlation in VLSI CMOS technology is the most logical choice.
6. DQPSK Information Demodulation
I M(T)
M(t) Ef-JI z1 S~le at z1-z*2
Delay t=T T z2
I /
Phase Detect
Figure 9. DQPSK Information Demodulator
Phase dibit Mapping
Performing the complex conjugate multiplication shown in Figure 9 to the matched ruter output from (11) gives:
Taking the phase of the (12) gives the decision variable for Gray dibit decoding. Equation (12). together with the path selection criteria, describes WavelAN Spread Spectrum demodulation in a multipath channel.
B. The Radio Front End
1. Radio Homodyne Front End Concept
Direct Conversion Radio Design is one of the oldest and forgotten architectures. The main obstacle has been for narrow bandwith voice channels; lumped element baseband mters become quite large and impractical, 11f noise is quite significant, DC coupling due to impractical blocking capacitors

July 1991
are needed and the need for double (I and Q) RF stage downconversion. For wide bandwidth modulations, especially spread-spectrum, in which low frequency content (In our example < 100 kHz) is not significant, the "narrow band problems are no longer present. Also commercial applications of 1 GHz technology, cellular phones, UHF TV, gives a cost effective implementation; compact with relaxed flltering requirements due to lack of an image frequency and a circuit topOlogy for total integration.
2. Diversity
While the path resolution of Spread Spectrum gives "path diversity", with select largest implemented. a significant amount indoor channels (offices with cubicle dividers) have small delay spreads, < 50 ns. Therefore swjtched antenna diversity, as measured in Chap.lII Sec. C, has been implemented using two cross polarized antennas, etched onto a printed circuit board, at the receiver. The selection criteria is based on a post processed signal quality level. Signal quality js a measure of an averaged correlation peak to side lobe ratio. TItis ratio decreases as a function of thermal noise, severe multipath and interference. Here we have an excellent method to "probe" the channel's integrity.
v. DISTANCE vs OUTAGE MODEL
Spread-Spectrum modulation is robust with respect to intersymbol interference. Link Outage within indoor office environments will be due to insufficient Signal to Noise ratio as opposed to the irredUCible multipath delay. The question that is addressed here is: "What can the distance be, in an environment, characterized by its large scale parameters n, a and cross over pOint, between the Terminal and the LAN Server?" From Table I an input power level of -72 dBm is needed in order to achieve 10E-8 BER. For received signals below rhis value the link is not reliable and a "link outage" has occurred.
NOte: The Bit E"or Ratio (BER' parameter dots nOl strongly influence ,IIe outage of tile link, due 10 1M exponential relationship becw~en BER and inpul power leveL Accurate predictions using an on/off channeJ model {29] is r~poned.
The Outage can then be apressed as:
P[pin < -72 dBm]
Where:
the probability of the event [.] the received input power of the signal
From the Power Budget of Table I the transmit power is 24 dBm. Therefore a total radio link gain. LGt, of -96 dB is permissible before outage occurs. The Link Gain is expressed as a sum of random variables:
LG dB = U dB + G1meter dB + t dB (13)
Doc. IEEE P802.11/91-68 10
Where:
U the Large Scale power gain (dB) with respect to one meter, with the pdf of equation (3).
G1meter constant power gain between transmit and receive antennas at one meter. G1meter = 20·Log(4T/lt) dB; @f= 915 MHz (-31.6 dB)
t Small scale power gain (dB) of the spread spectrum demoduJators selected path delay and diversity antenna. The pdf of this variable is a function of the "diversity level" of the system; The number of delay paths, L, and switchllble antennas, A.
The derivation for the probability density functions of LG is given in Appendix 1. Numerical techniques are used to solve for the outage using equation (13):
Outage(r) = P[LG dB < -96 dB] (14)
A. Outage Calculations
The "typical office" configuration of Figure 3 is used to estimate the outage .. The Large Scale parameters derived from measurements of a typical office (not including the corridor):
n = 3.6 a = 3.7 dB Cross over point (n = -2 to n = - 3.6) = 8.5 m
[l~ OUTAGE o
- 1. H------+-----~t+_-----_t / l :.1 - '1 1t-- ----+----f--i------t .,
1. :1 - " H------I----:::..~I:...--+------t . , .;j -9~--------~----~--+----------t :l ( .'
Figure 10. Outage vs Distance in meters [lOX] (L is a parameter).

July 1991
OOtAia
P.
.... •• u.
Figure 11. Outage vs L
From Figure 10, wiUch characterizes a typical office, an Outage of .1 % (1 %) is expected at a Server to Station distance of 50 meters (75 m). In such an environment a one path, L=l, is assumed due to the low delay spread environment [11]. At small Outages, <.1%, a significant improvement is seen with two paths. With greater Outages, increasing the number of paths does not give improvement, as further shown in· Figure 11. There is an optimal number of paths as a function of the minimum outage, t.he larger outage the smaller the optimal number of paths; for an Outage minimum of 1 %, L = 3 is optimum. The reason for an optimal number of paths is due to the selection diYersity implementation. While more paths help mitigate the Rayleigh fading, the average power of each path is less.
VI. SIMUIATION and MEASUREMENTS
Digital 915 MHz Baseband..----,
I I VLSI Ih(t)1 RF
demod
Air Channel Ell'LIlator I---Software---I-'-Hardware-"!
Software Ell'LIlator
Hl.III8n Interface Display
Figure 12. Block Diagram of Receivers simulation Set Up.
The WavelAN modulation structure and some of the practical reasoning behind the various implementation decisions has been discussed. Software simulation for the modem algorithm development and system testing was extensively used. Since the software simulation structure mapped the VLSI processing exactly, VLSI verification and error detection was accomplished. Replacement of the actual VLSI in the software emulation block of Figure 12, does not alter system performance.
A. Channel Perturbations and Decision Region Diagrams
In order to test the spread spectrum's data recovery algOrithmS, test impulse responses are generated from a given power delay profIle < I h( 'r) I > as done in [5]. The sampled value of the delay proflie gives the average power of the
Doc. IEEE P802.11/91-68 11
Rayleigh distributed path's gain. The phase is assumed to have a uniform distribution (0,2'1'].
b
'. 1 • I
.... 1
I i
I .. J i l, ~·· .. ! I ' "
! I i ! I I I • I I . ,
i ! t : ·1 ... 1 . .I. . .!. ... .
i , i ! I ! !
\,1 'I 'I' ': ,,1.'1
i .. ' I' ! I . i I .
"' . ! I . i :. I I I • ,~ .. J . I :. , , : ~l ...... •• • • • ... , ' " ",', . , •• - ' ....
1.&. It n .
45 ns/div Figure 13. (a) Exponential Power Delay Profile, (b) one particular impulse response.
Figure 13(a) shows the exponential profile with rms delay spread 'rrms ; l50 ns. Using this power delay proftle and (he impulse response model of equation (1), impulse responses are generated with a sample shown in Figure 13(b).
Figure 14. Frequency Transfer Function
x= 1 MHz/div y= 10 dB/div
Figure 14 shows [he frequency domain spectTUm of the channels transfer function, I H(jw) ,. Note that significant "frequency selective" fading is present within the pass band of the mOdulated signal of Figure 6. A random data sequence is demodulated, using the receiver structure of Figure 9. In Figure 15 the output of the demodulation process is shown.
July 1991
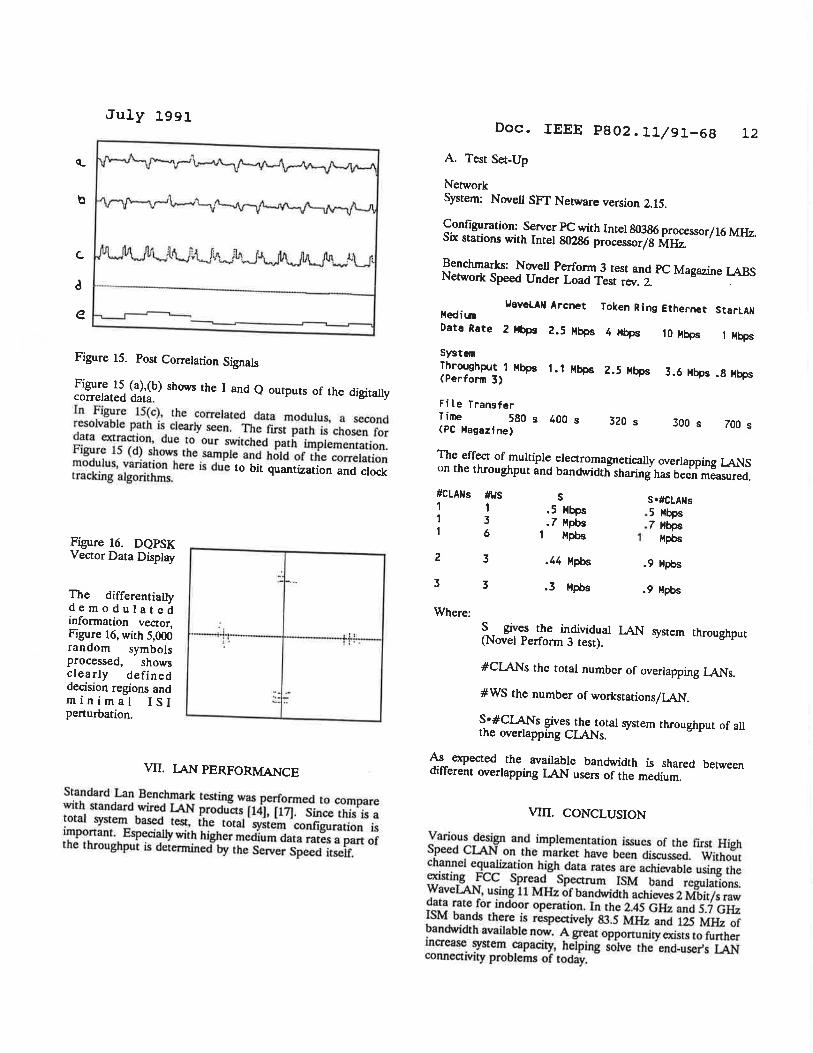
Figure 15. Post Correlation Signals
Figure 15 (a),(b) shows the I and Q outputs of the digitally correlated data. In Figu.re 15(c), the correlated data modulus, a second resolvable path is clearly seen. The ftrst path is chosen for d~ta extraction, due to our switched path implementation. FIgure 15 (d) shows the sample and hold of the correlation modulus, variation here is due to bit quantization and clock lracking aJgorithms.
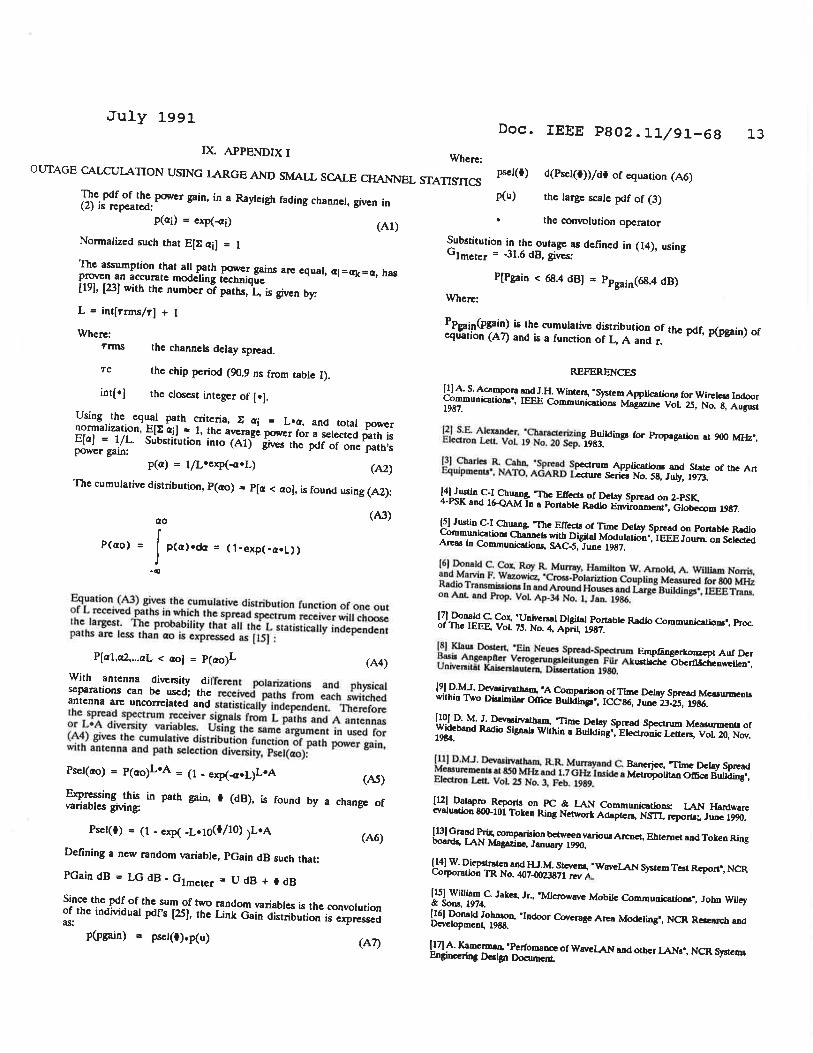
Figure 16. DQPSK Vector Data Display
::'1-- ..
The differentially demodulated infonnation vector, Figure 16, with 5,000 .-~+'.----~:------tp..-. -random symbols processed, shows clearly defined decision regions and minimal lSI perturbation.
:. ;~ _ ..
VIT. LANPERFORMANCE
Standard Lan Benchmark testing was perfonned to compare with standard wired IAN products (14], (17). Since this is a total system based test, the total system configuration is important. Especially with higher medium data rates a part of the throughput is detennined by the Server Speed itseif.
Doc. IEEE P802.11/91-68 12
A. Test Set-Up
Network System: Novell SF!' Netware version 2.15.
Configuration: Server PC with Intel 80386 processor /16 MHz. Six stations with Intel 80286 processor/8 MHz.
Benchmarks: Novell Perfonn 3 test and PC Magazine IABS Network Speed Under Load Test rev. 2. .
WaveLAN Arcnet Token Ring Ethernet StarLAN Mediun Data Rate 2 Mbps 2.5 Mbps 4 Mbps 10 Mbps 1 Mbps
System Throughput 1 Mbps 1.1 Mbps 2.5 Mbps 3.6 Mbps .8 Mbps (Perform 3)
Fi le Transfer Time 580 s 400 s 320 s 300 s 700 s (PC Magazine)
The effect of multiple electromagnetically overlapping LANS on the throughput and bandwidth sharing has been measured.
#CLANs 1 1 1
2
3
Where:
#'015 S So#CLANs 1 .5 Mbps .5 Mbps 3 .7 Mpbs .7 Mbps 6 1 Mpbs 1 Mpbs
3 .44 Mpbs .9 Mpbs
3 .3 Mpbs .9 Mpbs
S gives the individual LAN system throughput (Novel Perfonn 3 test).
#ClANs the total number of overlapping LANs.
#WS the number of workstations/LAN.
S.#ClANs gives the total system throughput of all the overlapping CLANs.
As expected the available bandwidth is shared between different overlapping LAN users of the medium.
VIn. CONCLUSION
Various design and implementation issues of the nrst High Speed CLAN on the market have been discussed. Without channel equalization high data rates are achievable using the existing FCC Spread Spectrum ISM band regulations. WaveLAN, using 11 MHz of bandwidth achieves 2 Mbit/s raw data rate for indoor operation. In the 2.45 GHz and 5.7 GHz ISM bands there is respectively 83.5 MHz and 125 MHz of bandwidth available now. A great opportunity exists to further increase system capacity, helping solve the end-users LAN connectivity problems of today.
July 1991 Doc. IEEE P802.11/91-68 13
IX. APPENDIX I Where: OUTAGE CALCUlATION USING lARGE AND SMALL SCALE CHANNEL STATISTICS
psel(t)
p(u)
d(Psel(t»/dt of equation (A6)
the large scale pdf of (3) The pdf of the power gain. in a Rayleigh fading channel. given in (2) is repeated: p(ai) = exp(oili) (AI)
Normalized such that Ell: ail = 1
The assumption that all path power gains are equal. ai=CIJc=a. has proven an accurate modeling technique [19], [23] with the number of paths. L, is given by:
L = int[Trms/'f] + 1
Where: 'frms the channels delay spread.
'fC the chip period (90.9 ns from table I).
int[e] the closest integer of [e).
Using the equal path criteria. E ai = Lea, and total power normalization, E[E ai] = 1. the average power for a selected path is E[a) = IlL. Substitution into (AI) gives the pdf of one path's power gain:
pea) = I/Leexp(oileL) (A2)
The cumulative distribution. P(ao) .. P[a < ao]. is found using (A2):
ao
P(ao) = J p(a)eda = (1-exp(-aeL» -CI
(AJ)
Equation (AJ) gives the cumulative distribution funclion of one out of L received paths in which the spread speclrum receiver will choose the largest. The probability that all the L statistically independent pathS a.re less than ao is expressed as (15) :
P[al,a2 •... aL < ao] = p(ao)L (A4)
With antenna di~rsity dilTerent polarizations and physical separations can be used; the received paths Crom each switched antenna are uncorrelated and statistically independent. Therefore the spread spectrum receiver signals from L paths and A antennas or LeA di~rsity variables. Using the same argument in used for (A4) gives the cumulative distribution function of path power gain. with antenna and path selection di~rsity. Psel(ao):
(AS)
Expressing this in path gain. t (dB), is found by a change of variables giving:
Psel(t) = (1 - exp( _LelO('/lO) )LeA (A6)
Defining a new random variable. PGain dB such that:
PGain dB = LG dB - Glmeter = U dB + t dB
Since the pdf of the sum of two random variables is the convolution of the individual pdrs [25], the Link Gain distribution is expressed as:
p(pgain) = psel(l)ep(u) (A7)
the convolution operator
Substitution in the outage as defined in (14), using Glmeter = -31.6 dB, gives:
P[pgain < 68.4 dB) = PPgain(68.4 dB)
Where:
PPgain(pgain) is the cumulative distribution of the pdf, p(pgaio) of equation (A7) and is a function of L, A and r.
REFERENCES
(1) A. S. Acampora aDd J.H. Winters, 'System ApplicatioDl for Wirelesa Indoor Communications', IEEE CommunicatioDl Magazine VoL 25, No. 8, AUgll5t 1987.
(21 S.E. Alexander. 'C'lIaraderizing Buildinp for Propaption at 900 MHz', Electron Leu. VoL 19 No. 20 Sep. 1983.
131 Charles R. Cahn. 'Spread Spectrum Applications and State or tbe Art Equlpmenta', NATO. AGARD L.ecture Series No. 58, July. 1973.
[41 Justin C-I Cbuang, PJ'be ElIecIS or Delay Spread on 2-PSK. 4-PSK and 16-QAM In a Portable Radio Environment'. Globecom 1987.
(5) Justin C-I Cbuang. "The ElIecIS or Tune Delay Spread on Portable Radio Communicatlolll Channell with Digital Modulation'. IEEE Jown. on Selected Areas in Communications, SAC-S, June 1987.
16) Donald C. Cox. Roy R. Murray. Hamilton W. Arnold, A. William NorTit. Ilnd Marvin F. Wazowicz, 'Cr05S-Polariztion CoupUng Measured ror 800 MHz Radio Traosmiulons In aDd Around Houses and Large BuJJdings', IEEE Trans. on Ant and Prop. VoL Ap-34 No. 1. Jan. 1986.
(7) Donald C. Cox. 'Universal Digital Portable Radio Communications', PrO<:. of The IEEE, VoL 7S. No.4. April, 1987.
18) K1aua Doden, 'Ein Neucs Spread-Speo.rum Empllingerkonzept Auf Der Basil Angeapfter Veroge.rungsleitungen Fiir Akustilc:he Oberfiichenwellen', Univenitit K.o.iaenla\llem, Dts.ertatioD 1980.
[91 D.W . Devuirvatham, 'A Comparison of Time Delay Spread Meuurmenta within Two Dillimilar OIIioe Buildinp', ICC86, June 23,25, 1986.
(10) D. M. J. Devaairvatbam, "TUlle Delay Spread Spectrum Meaaunnenta of Wideband RadIo Signals Within a BuJJding', Electronic Letters, VoL 20. Nov. 1984.
lUI D.MJ. Devaairvalham, R.R. Murrayand C. Banerjee. "Tune Delay Spread Measurementa aI &sO MHz and 1.7 GHz Inside a Metropolitan omce Bulldins', EledrOn Leu. VoL 25 No.3, Feb. 1989.
[UI Dalapro Reports on PC & IAN Communications: IAN Hardware evaluation 800-101 Token Ring Network Adapters, Nm.. reperta;. June 1990.
(13) Grand Prix, compuialon between various Arcnet, Ehtemet and Token Ring boarda, IAN MagaziDe, January 1990.
(14) W. Diepstraten aDd HJ.M. Stevena, 'WaveIAN System Test Report'. NCR Corporation TR No. 407-0023871 rev A-
(15) William C. Jakes, Jr., 'Microwave Mobile COmmunkatio .. •• Jobn Wiley & Sons, 1974. (16) Donald Johnson, 'Indoor Coverage Area ModeUng·. NCR Research and Development, 1988.
(17) A. Kamerman, 'Pedomanee of WaveIAN and other IANs·, NCR Systems Engineering Design Document.
July 1991
(18) M KlM!bnId, 'Direct-Sequeoce Spread Spec:trum with DPSK Modulation and Divenity (or Indoor, Wirleu CommundaUo .. ', IEEE Trans. Common., voL Com-lS, Feb. 1987.
[191 M Kavebrad and G. E. &deep, 'Design. and Erperimall!al Resulta for a Direct Sequeoce Spread-Spectrum Radio Uains DiJIerentiAl Ptwe-Sbill Keying Modulation for Indoor, WIre\es& Communicatio .. ' ,IEEE !ournal on SeJ. A.ruoI in Communicationa, VoL SAC-S, No.5, JIIJle 1987.
(20) Jean-Fl'IDCOiI LaCortuue and Micbel Lecoun, 'Mealuremetlta and Modeling of Propaption Loues in a bllildins at 900 MHz', IEEE Tran. VehicuJar Tech, VoL 39, No. 2, May 1990.
(21) Michael!. Man:uI, 'ReguJatory PoJic:y Co .. ideratio .. for Radio LocaJ Area NetworQ', IEEE Communic:atio .. MapziDe, CoL 25, No.7, July 1987.
(22) NOY'eIl: IAN EvaluaUon Report, NoveU AdYaDced Netware, 1986.
(23) K. PahJavan, 'Spread Spednun For Wlreleu LocaJ Networb', Proc. IEEE pccc, Febwuy 1987.
[241 K. Pahlavan, 'Wlrelea oommunicatlo .. for olllc:e information networu', IEEE Common. Magazine, June 1985.
(25) A. Papolllia, Probability, Random Variable&, and Stochastic Proc:eues', McGraw Hill, New York, 196.5.
(261 PCN America, lac., 'For Authorization in tbe Erperiman!al Radio Service of a Spread Spectrum Persoll8l Communlc:at.lo.. Network, to Serve the Washington, D.C., MetropoUtan Ana', FCC f"LJe No. 1343-E-PC·90, Janwuy 1990.
(27) J.G. Proakis, Digital Communic:ationa, New York: McGraw-Hill, 1983.
(28) Adel A. M Saleh and Reinaldo A. Valenauela, 'A StatistkaI Model for Indoor MuItipatb Propatation', IEEE Joumal SAC VoL SAC-S No. 2, Feb. 1987.
(29) Adel A. M Saleh and Leooatd J . Cimln~ JR., 'Indoor Radio Commundatlooa Using TUDe-Divitlon Muillple Ac:teSI with Cycli<:aJ Slow Frequeoc.y Hopping and Coding', IEEE 10urnal on Selected A.ruoI in CommunicatloM, VL 7, No. 1, lanwuy 1989.
(301 Soott Y. Seidel and Th~re S. Rappaport, '900 MHz Patb Lou Measurements 8.Ild Prediction Techniques for In-Building Communication System Design', Vehlcular Technology Confereoc:e, St. Louil. MO, May 1991 (Future presentation).
(lll Sirikiat AriyIlVili14kul and rlDg-Ping Uu. 'Characterizing the Errecla of Nonlinear Amplifien on Unear ModUlation {or DigItaJ Portable Radio CommuncialX>oa', IEEE TI1lDS. on Vehlcular Technology, VoL 39, No.4, Novembe.r 1990.
(32) Carl-Erik Sundbers and NUa Rydbeck, '~nt ResuJla on Spectrally ElIedent Constant Envelope DigItaJ ModuaJUon MetbodI', CH14lS-7 /79/0000-0227 IEEE 1979.
(331 Kiwi Smit 'SpectnJ.m of 11 chip Barker Sequeoc:e', NCR Systems Engineering Design Report.
(34) BI1JCe Tuch, 'Radio Propagation Measurement Report', NCR Systems Engineering, 1987.
(lSI George 1.. Turin, 'Introduc1lon 10 Spread-Spectrum Antimultipatb Techniques and Their Application to Urban DigItaJ Radio', Proc. of the IEEE, VoL 68, No.3, Man:b 1980.
(36) Yoshlbiko AkAiwa and Yoellinorl Nagata, 'Hi&hlty Efficient Digital Mobile Communications with a Unear ModuJallon Method', IEEE Journal on Selected Areas in Communiatiolll, Vol SAC S, No. S, JIIJle 1987.
(37) Shen Yuncbun and CP. Tou. 'A Scheme for Further Strengthening Interfenmce Protectio .. of Spread SpednIm CommwUcatlon Sy5!eIlll', IEEE !!MC Symposium 1990, Washington.
(38) Ning Zhang and S.W. Golomb, 'SilIiy-PbaIe Generalized Barker Sequences', IEEE Trans. on Information Theory, VoL lS, No.4, July, 1989.
Doc. IEEE P802.11/91-68 14
Bruce Tum reeeived the BEEE degtee (HoDOIW from the State Univellity of New York at Stony Brook. in J979 and MS. Degm: from The Technical Univenity Eindboven. Holland. in 1983. From 1982 to 1985, he worked on High Frequency Integrated Clrcuit Design (or oommerdai Tuner development at Pbi\ipI Corporation, Component Laboratories (ELCOMA). He joined NCR in 1985 and • Project Leader wilhlo the Wirelea Indoor Network DMsion at NCR 5y11e_ Engineel'ing. Utrecht the Netherlanda. Hia rese4I'dl interest are in IDdoor digIl.aI trantmillion I)'IleIlll and anaJog integration. BI1JCe is a member of Tau Beta Pi.