jul 16 unicredit friday notes
TRANSCRIPT
8/9/2019 JUL 16 UniCredit Friday Notes
http://slidepdf.com/reader/full/jul-16-unicredit-friday-notes 1/32
16 July 2010 Economics & FI/FX Research
Friday Notes
UniCredit Research page 1 See last pages for disclaimer.
Germany: Moderate austerity measures
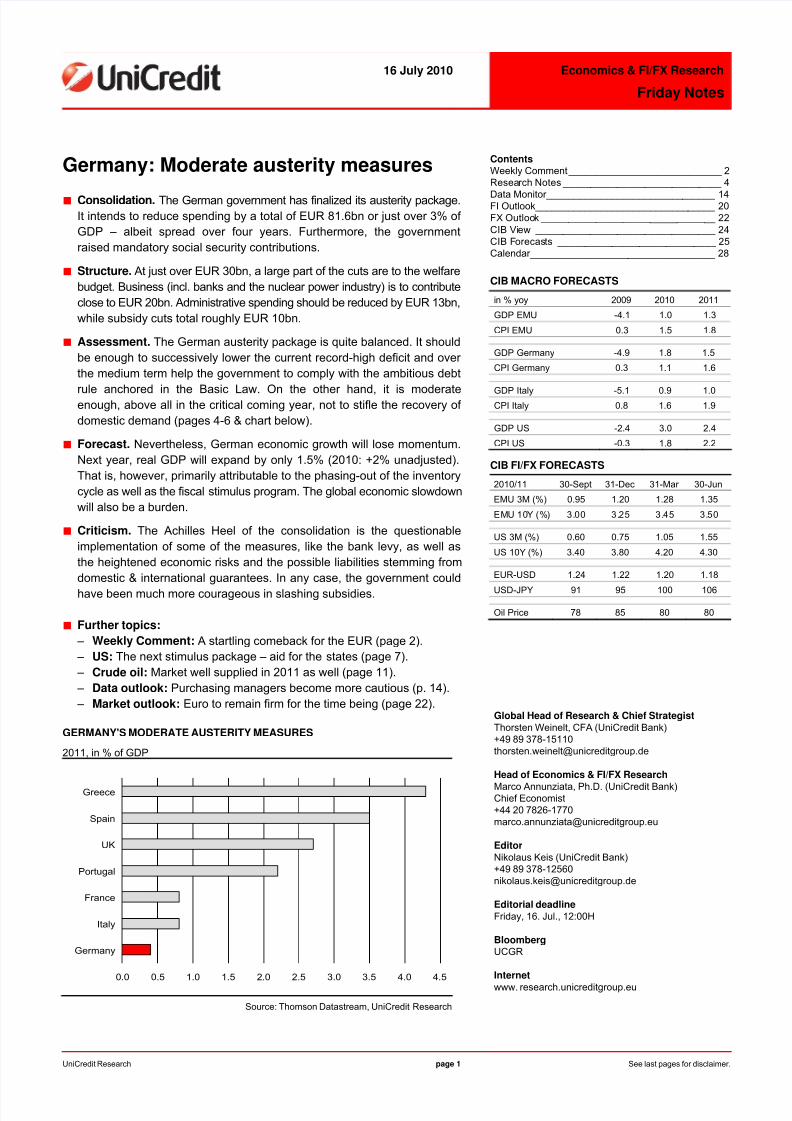
■ Consolidation. The German government has finalized its austerity package.It intends to reduce spending by a total of EUR 81.6bn or just over 3% of GDP – albeit spread over four years. Furthermore, the governmentraised mandatory social security contributions.
■ Structure. At just over EUR 30bn, a large part of the cuts are to the welfarebudget. Business (incl. banks and the nuclear power industry) is to contributeclose to EUR 20bn. Administrative spending should be reduced by EUR 13bn,while subsidy cuts total roughly EUR 10bn.
■ Assessment. The German austerity package is quite balanced. It shouldbe enough to successively lower the current record-high deficit and over the medium term help the government to comply with the ambitious debt
rule anchored in the Basic Law. On the other hand, it is moderateenough, above all in the critical coming year, not to stifle the recovery of domestic demand (pages 4-6 & chart below).
■ Forecast. Nevertheless, German economic growth will lose momentum.Next year, real GDP will expand by only 1.5% (2010: +2% unadjusted).That is, however, primarily attributable to the phasing-out of the inventorycycle as well as the fiscal stimulus program. The global economic slowdownwill also be a burden.
■ Criticism. The Achilles Heel of the consolidation is the questionableimplementation of some of the measures, like the bank levy, as well asthe heightened economic risks and the possible liabilities stemming fromdomestic & international guarantees. In any case, the government couldhave been much more courageous in slashing subsidies.
■ Further topics:
– Weekly Comment: A startling comeback for the EUR (page 2). – US: The next stimulus package – aid for the states (page 7). – Crude oil: Market well supplied in 2011 as well (page 11). – Data outlook: Purchasing managers become more cautious (p. 14). – Market outlook: Euro to remain firm for the time being (page 22).
GERMANY'S MODERATE AUSTERITY MEASURES
2011, in % of GDP
0.0 0.5 1.0 1.5 2.0 2.5 3.0 3.5 4.0 4.5
Germany
Italy
France
Portugal
UK
Spain
Greece
Source: Thomson Datastream, UniCredit Research
ContentsWeekly Comment____________________________ 2Research Notes _____________________________ 4
Data Monitor_______________________________ 14FI Outlook_________________________________ 20FX Outlook ________________________________ 22CIB View _________________________________ 24CIB Forecasts _____________________________ 25Calendar__________________________________ 28
CIB MACRO FORECASTS
in % yoy 2009 2010 2011
GDP EMU -4.1 1.0 1.3
CPI EMU 0.3 1.5 1.8
GDP Germany -4.9 1.8 1.5
CPI Germany 0.3 1.1 1.6
GDP Italy -5.1 0.9 1.0CPI Italy 0.8 1.6 1.9
GDP US -2.4 3.0 2.4
CPI US -0.3 1.8 2.2
CIB FI/FX FORECASTS
2010/11 30-Sept 31-Dec 31-Mar 30-Jun
EMU 3M (%) 0.95 1.20 1.28 1.35
EMU 10Y (%) 3.00 3.25 3.45 3.50
US 3M (%) 0.60 0.75 1.05 1.55
US 10Y (%) 3.40 3.80 4.20 4.30
EUR-USD 1.24 1.22 1.20 1.18
USD-JPY 91 95 100 106
Oil Price 78 85 80 80
Global Head of Research & Chief Strategist
Thorsten Weinelt, CFA (UniCredit Bank)+49 89 [email protected]
Head of Economics & FI/FX Research
Marco Annunziata, Ph.D. (UniCredit Bank)Chief Economist+44 20 [email protected]
Editor
Nikolaus Keis (UniCredit Bank)+49 89 [email protected]
Editorial deadline
Friday, 16. Jul., 12:00H
BloombergUCGR
Internetwww. research.unicreditgroup.eu

8/9/2019 JUL 16 UniCredit Friday Notes
http://slidepdf.com/reader/full/jul-16-unicredit-friday-notes 2/32
16 July 2010 Economics & FI/FX Research
Friday Notes
UniCredit Research page 2 See last pages for disclaimer.
A startling comeback
The EUR has staged a remarkable rebound over the lastmonth, recovering from below 1.20 to the dollar to nearly 1.30.What is driving it? Will it strengthen further, consolidate, or reverse trend? And should its appreciation be welcomed?
The euro’s appreciation against the US dollar this time isprobably a tale of two economies: on the one hand, markets areperhaps starting to believe that, as ECB President Trichetnoted last week, the eurozone should not be underestimated.Trichet pointed out that, while the ECB was not changing itsstaff forecasts (which are very close to ours, cf. the table atthe end of this publication), the incoming data did not in anyway support the pessimistic fears that the region might beabout to plunge back into recession. The ECB forecasts, likeours, suggest a lackluster recovery, but Trichet was veryclear in indicating that risks to this outlook might perhaps beskewed to the upside. Contrast this with the dovish tone of the latest FOMC minutes, where several committee membersexpressed concern that deflation risks might materialize, andsuggested that the Fed should keep open the possibility of stepping up its quantitative easing program. This stands insharp contrast to the attitude of the ECB, which has insistedthat its government bond purchases do not constitute quantitativeeasing as they are fully sterilized, and has allowed its 12-monthliquidity to expire, resulting in a substantial draining of excess
liquidity from the system and an upward move in short-termmarket rates. President Trichet was careful in pointingout that this should not be seen as a sign of change inthe bank’s monetary policy stance, as the ECB continues tooffer unlimited liquidity at shorter maturities; he implicitlyacknowledged, however, that this might represent an earlysign of normalization in financial markets, which the ECBwould be happy to accompany.
The Fed’s deflation concerns are, in my view, exaggerated,even though there is no doubt that the recovery is losingsome momentum in the second half of the year as the push
from fiscal stimulus and the inventory cycle wanes, in linewith our forecasts, and recent data revisions suggest that thefirst half of this year was also weaker than previouslythought. The Fed itself is still forecasting growth of 3-3½%for this year, and even if 2H growth were to be somewhatlower than our forecasts, say in a 2-2½% range, it would stillbe a fairly respectable performance for an advanced economywhich is still licking its wounds after a very serious crisis. Theproblem of course is unemployment, which remains at veryhigh levels, and which will decline only very slowly if GDPgrowth remains weak. Unemployment is currently the major political issue in the US, and unless and until its trend is moredecisively reversed, whether by stronger private confidence or
by another government stimulus program, the Fed cannotafford a more hawkish stance.
Be that as it may, we have a paradoxical situation where,while the recovery is clearly more robust in the US than inthe eurozone, the Fed sounds more dovish whereas the ECB
sounds cautiously more optimistic. Consequently, expectationsof a Fed rate hike are likely to be pushed further into the future,whereas short-term rates in the eurozone begin to edge up.Remember that excess liquidity had pushed short-term ratestowards zero, un-anchoring them from the policy refi rate. If theynow start converging to the refi, we have potentially close to¾ of a percentage point in “stealth” tightening that can occur spontaneously without the need for the ECB to hike.
Moreover, investors are probably starting to get someencouragement from the policy actions taken by Europeanpolicymakers. Here the important role, in my view, is played
not so much by the actions of eurozone institutions, butrather by national governments, where significant steps havebeen taken towards fiscal consolidation and, at least in thecase of Spain, structural reforms. Nothing earth-shattering sofar, but certainly enough to give pause and consider whether at least some eurozone governments might now finally realizethe need for long-overdue reforms.
A particularly encouraging sign in this regard has been therecent recovery in demand at some government bond auctions,notably in the case of Spain, where China’s wealth manager SAFE showed concrete and substantial interest. This is
potentially a very positive sign. In the immediate aftermath of the Greece shock, large Asian investors stepped back in horror from a eurozone sovereign bond market which they nolonger recognized, and tried to come to terms with the needto understand much better the idiosyncrasies of the differentnational markets which for most of the eurozone’s historyhad traded very close to each other. SAFE’s demand for Spanish bonds suggests that perhaps the panic phase isover, and Asian investors have now had time to do their homework and more carefully assess individual countries’risk. And if they find that Spain’s risk is tolerable, then itmight well mean that the risk of a systemic crisis is indeedquite moderate.
Next week, however, we have a crucial reality check with thefirst release of the European stress test results, and preliminaryindications are at best mixed. On the one hand, as I havepointed out in the past, it is extremely encouraging that Spainhas taken the initiative and first announced it was going topublish the results of its stress tests, regardless of what other countries did, and then indicate it would extend the tests tocover the large majority of its banking system. On the other hand, the Committee of European Banking Supervisors(CEBS) has not yet been able to tell us much about theassumptions used in the tests, raising concerns that at least
on the crucial issue of sovereign bonds, individual countriesmight end up using different methodologies or assumptions.
8/9/2019 JUL 16 UniCredit Friday Notes
http://slidepdf.com/reader/full/jul-16-unicredit-friday-notes 3/32
16 July 2010 Economics & FI/FX Research
Friday Notes
UniCredit Research page 3 See last pages for disclaimer.
All we will learn in a week’s time will be the aggregate resultsby country, whereas the results for individual financial institutions,which are the ones investors need to separate the sheep
from the goats, will only follow with a 2-3 week delay. Weshould at least hope that the announcement on the overallresults and on the assumptions used is sufficiently detailedand convincing, or it might undo the good work done so far.
What does this all mean for the euro? I think the upsidepotential at this stage has probably been exhausted, as thefact that the stress test results will be disclosed in tworounds, with the second taking place when the summer holidayperiod is in full swing in Europe, suggests that the chances of a very positive surprise are slim. On the other hand, with USgrowth losing steam and the Fed toying with the idea of a
new wave of quantitative easing, it will take a major negativesurprise in the eurozone to knock EUR-USD back below 1.20and at this point this seems extremely unlikely over the comingfew months – with the greatest risk lying, in my view, in thestress test exercise, which has become a very high stakesgame. The exchange rate therefore seems most likely toremain stable for a while, and this probably suits both theeurozone and the US, neither one of which would welcome asignificant appreciation in this new nervous climate wherecountries suspect each other of engineering competitivedevaluations to pursue export-led growth.
Marco Annunziata, Ph.D. (UniCredit Bank)
44 20 [email protected]
8/9/2019 JUL 16 UniCredit Friday Notes
http://slidepdf.com/reader/full/jul-16-unicredit-friday-notes 4/32
16 July 2010 Economics & FI/FX Research
Friday Notes
UniCredit Research page 4 See last pages for disclaimer.
German budget: Appropriateconsolidation plan
■ In the current year, new public debt will hit a new recordlevel of presumably over EUR 100bn. That should, however,also clearly mark the peak with a deficit ratio of roughly 4½%.
■ The federal government has reached agreement to startthe budget consolidation next year. The results of the austeritydiscussions as well as the agreement to raise social securitycontributions are – together with the economic recovery –to successively lower the deficit.
■ Even though the uncertainties concerning the budget remain
high, the plans appear appropriate: No precipitous deficitreduction that chokes the domestic economy, at the sametime, adequate cuts to comply with the stipulations of thedebt rule.
Consolidation starts next year
When, after the coalition government’s austerity meeting afew weeks ago, Chancellor Merkel extolled to the public thevirtues of an ambitious consolidation package totaling morethan EUR 80bn or more than 3% of GDP, there was initiallyconfusion about the high level of the resolved austeritymeasures. The details of the plans do, however, reveal the
expected and - compared to many other EU countries - moremoderate size of the consolidation package. In contrast tothe cited cumulative amount for the coming four years, thebudget deficit is to be reduced during the current legislativeperiod by a total of "only" EUR 27.6bn (see table).
RESULTS OF THE AUSTERITY MEASURES, IN EUR BN
2011 2012 2013 2014
Subsidy cuts 2.0 2.5 2.5 2.5
Corporate participation 3.3 5.3 5.3 5.3
Welfare adjustments 3.0 7.0 9.4 10.9
Armed forces reform - - 1.0 3.0
Administrative savings 2.3 3.3 3.9 3.9
Other measures 0.6 1.1 1.7 2.0
11.2 19.1 23.7 27.6Total
81.6
Source: Federal Ministry of Finance, UniCredit Global Research
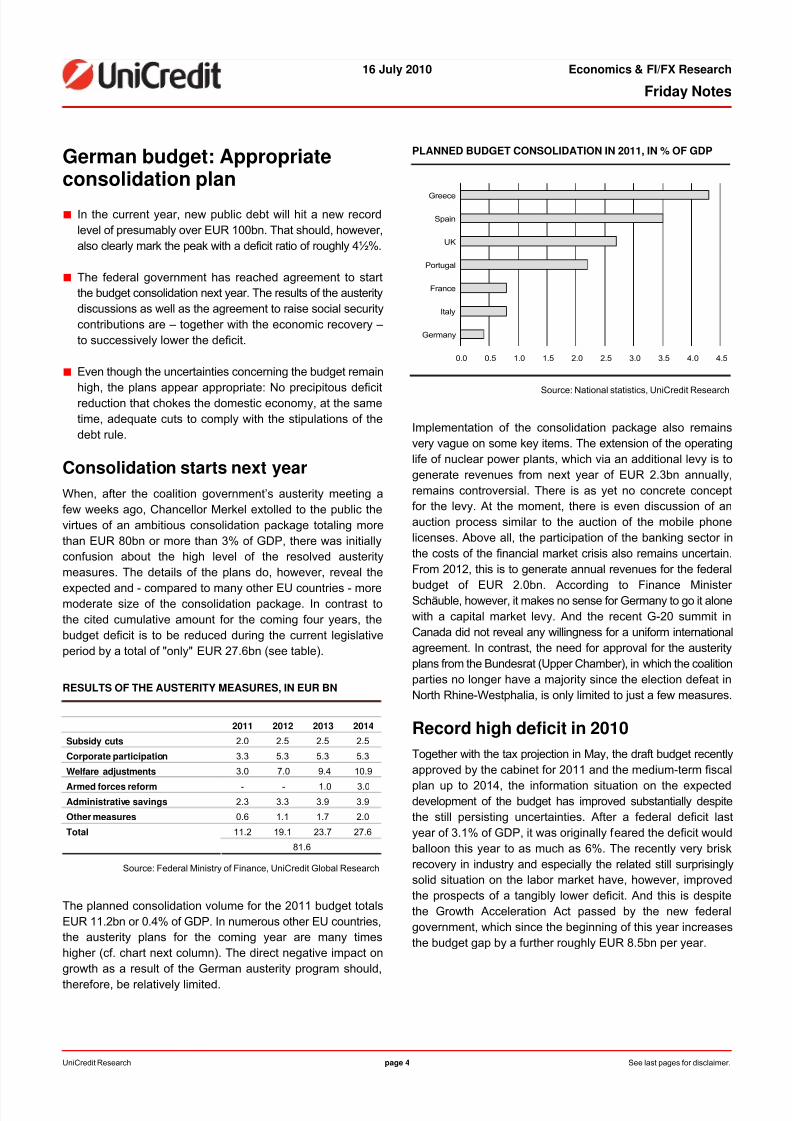
The planned consolidation volume for the 2011 budget totalsEUR 11.2bn or 0.4% of GDP. In numerous other EU countries,the austerity plans for the coming year are many timeshigher (cf. chart next column). The direct negative impact on
growth as a result of the German austerity program should,therefore, be relatively limited.
PLANNED BUDGET CONSOLIDATION IN 2011, IN % OF GDP
0.0 0.5 1.0 1.5 2.0 2.5 3.0 3.5 4.0 4.5
Germany
Italy
France
Portugal
UK
Spain
Greece
Source: National statistics, UniCredit Research
Implementation of the consolidation package also remainsvery vague on some key items. The extension of the operatinglife of nuclear power plants, which via an additional levy is togenerate revenues from next year of EUR 2.3bn annually,remains controversial. There is as yet no concrete conceptfor the levy. At the moment, there is even discussion of anauction process similar to the auction of the mobile phonelicenses. Above all, the participation of the banking sector inthe costs of the financial market crisis also remains uncertain.From 2012, this is to generate annual revenues for the federal
budget of EUR 2.0bn. According to Finance Minister Schäuble, however, it makes no sense for Germany to go it alonewith a capital market levy. And the recent G-20 summit inCanada did not reveal any willingness for a uniform internationalagreement. In contrast, the need for approval for the austerityplans from the Bundesrat (Upper Chamber), in which the coalitionparties no longer have a majority since the election defeat inNorth Rhine-Westphalia, is only limited to just a few measures.
Record high deficit in 2010
Together with the tax projection in May, the draft budget recentlyapproved by the cabinet for 2011 and the medium-term fiscalplan up to 2014, the information situation on the expecteddevelopment of the budget has improved substantially despitethe still persisting uncertainties. After a federal deficit lastyear of 3.1% of GDP, it was originally feared the deficit wouldballoon this year to as much as 6%. The recently very briskrecovery in industry and especially the related still surprisinglysolid situation on the labor market have, however, improvedthe prospects of a tangibly lower deficit. And this is despitethe Growth Acceleration Act passed by the new federalgovernment, which since the beginning of this year increasesthe budget gap by a further roughly EUR 8.5bn per year.
8/9/2019 JUL 16 UniCredit Friday Notes
http://slidepdf.com/reader/full/jul-16-unicredit-friday-notes 5/32
16 July 2010 Economics & FI/FX Research
Friday Notes
UniCredit Research page 5 See last pages for disclaimer.
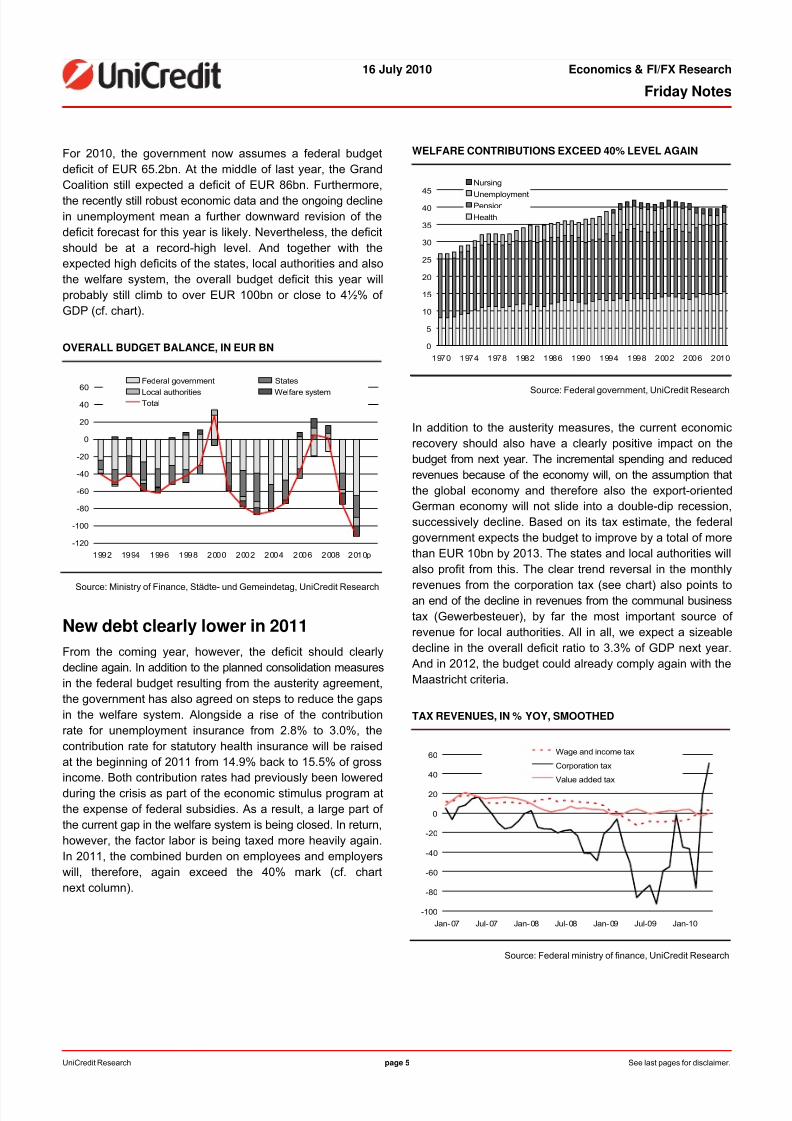
For 2010, the government now assumes a federal budgetdeficit of EUR 65.2bn. At the middle of last year, the GrandCoalition still expected a deficit of EUR 86bn. Furthermore,
the recently still robust economic data and the ongoing declinein unemployment mean a further downward revision of thedeficit forecast for this year is likely. Nevertheless, the deficitshould be at a record-high level. And together with theexpected high deficits of the states, local authorities and alsothe welfare system, the overall budget deficit this year willprobably still climb to over EUR 100bn or close to 4½% of GDP (cf. chart).
OVERALL BUDGET BALANCE, IN EUR BN
-120
-100
-80
-60
-40
-20
0
20
40
60
1992 1994 1996 1998 2000 2002 2004 2006 2008 2010p
Federal government States
Local authorities Welfare system
Total
Source: Ministry of Finance, Städte- und Gemeindetag, UniCredit Research
New debt clearly lower in 2011
From the coming year, however, the deficit should clearlydecline again. In addition to the planned consolidation measuresin the federal budget resulting from the austerity agreement,the government has also agreed on steps to reduce the gapsin the welfare system. Alongside a rise of the contributionrate for unemployment insurance from 2.8% to 3.0%, thecontribution rate for statutory health insurance will be raisedat the beginning of 2011 from 14.9% back to 15.5% of gross
income. Both contribution rates had previously been loweredduring the crisis as part of the economic stimulus program atthe expense of federal subsidies. As a result, a large part of the current gap in the welfare system is being closed. In return,however, the factor labor is being taxed more heavily again.In 2011, the combined burden on employees and employerswill, therefore, again exceed the 40% mark (cf. chartnext column).
WELFARE CONTRIBUTIONS EXCEED 40% LEVEL AGAIN
0
5
10
15
20
25
30
35
40
45
1970 1974 1978 1982 1986 1990 1994 1998 2002 2006 2010
Nursing
UnemploymentPension
Health
Source: Federal government, UniCredit Research
In addition to the austerity measures, the current economicrecovery should also have a clearly positive impact on thebudget from next year. The incremental spending and reducedrevenues because of the economy will, on the assumption thatthe global economy and therefore also the export-orientedGerman economy will not slide into a double-dip recession,successively decline. Based on its tax estimate, the federalgovernment expects the budget to improve by a total of morethan EUR 10bn by 2013. The states and local authorities willalso profit from this. The clear trend reversal in the monthly
revenues from the corporation tax (see chart) also points toan end of the decline in revenues from the communal businesstax (Gewerbesteuer), by far the most important source of revenue for local authorities. All in all, we expect a sizeabledecline in the overall deficit ratio to 3.3% of GDP next year.And in 2012, the budget could already comply again with theMaastricht criteria.
TAX REVENUES, IN % YOY, SMOOTHED
-100
-80
-60
-40
-20
0
20
40
60
Jan-07 Jul-07 Jan-08 Jul-08 Jan-09 Jul-09 Jan-10
Wage and income tax
Corporation tax
Value added tax
Source: Federal ministry of finance, UniCredit Research
8/9/2019 JUL 16 UniCredit Friday Notes
http://slidepdf.com/reader/full/jul-16-unicredit-friday-notes 6/32
16 July 2010 Economics & FI/FX Research
Friday Notes
UniCredit Research page 6 See last pages for disclaimer.
Consolidation plan appropriate
The consolidation path adopted by the federal government
remains fraught with substantial uncertainties with respect to itsability to implement some key measures and with respect tothe economy, and not least because of the existing guaranteesfor the banking system and EMU high-risk countries.Furthermore, a stronger focus on reducing subsidies wouldhave been desirable. The extent of the planned measuresdoes, however, appear appropriate. There is no precipitousreduction of the deficits that could choke off the recovery of the domestic economy, also in the context of substantiallyhigher austerity programs in many neighboring countries. Atthe same time, the measures are almost enough to complywith the stipulations of the debt rule anchored in the Basic
Law, according to which the federal government must limit itsstructural deficit to 0.35% of GDP by 2016.
Alexander Koch, CFA (UniCredit Bank) +49 89 [email protected]

8/9/2019 JUL 16 UniCredit Friday Notes
http://slidepdf.com/reader/full/jul-16-unicredit-friday-notes 7/32
16 July 2010 Economics & FI/FX Research
Friday Notes
UniCredit Research page 7 See last pages for disclaimer.
The next stimulus measure:More aid for the states
■ For most US states, fiscal 2011 started at the beginningof July. It will presumably be even more difficult for themthan in the previous year to adhere to balanced-budget laws.
■ First, state budgets remain under pressure due to the stillhigh unemployment rate, which keeps state tax receiptslow and increases demand for health care and other essential services that states provide.
■ Second, in the past two years it was still possible to partlyclose the budget shortfalls by tapping into state reserves
and through federal aid provided in the American Recoveryand Reinvestment Act. But both sources have now beenvirtually depleted.
■ States have to close a USD 140bn budget gap in the currentfiscal year. Without further aid from Washington, thenecessary cutbacks could shave close to one percentagepoint off GDP growth and eliminate close to one million jobs.
States’ budget plight will continueto deteriorate initially
On 1 July, fiscal 2011 began in 46 of the 50 US states. Andeven though the recession already ended at mid-2009, thestates’ fiscal problems will continue into the next fiscal year and likely beyond. Following previous recessions, state fiscalrecovery lagged behind the economic improvement: While,for example, the recession of the early 90s ended in March 1991,the states reported their largest budget deficits in fiscal 1992.And while the recession in the early part of the current decadeended in November 2001, state fiscal distress persisted intofiscal 2005.1 The main reason for this time lag is that theunemployment rate continued to climb after the recessionended and then remained high for a considerable period of time after that. That hampers the ability of state revenues to
recover strongly, as high unemployment reduces bothincome and consumption tax revenues. At the same time,the higher demand for Medicaid and other essential socialservices increases states’ expenditures. The problem is thatevery state save Vermont has some sort of balanced-budgetlaw. In the last two years, the states were still able to closepart of their shortfall by tapping into state reserves or throughfederal aid to states provided in the American Recovery and
Investment Act (ARRA). Both sources have, however, nowbeen virtually depleted. That means that the need for spendingcuts and/or tax increases is rising further.
1 Additional Federal Fiscal Relief needed to help States address Recession’s
Impact , Center on Budget and Policy Priorities, 1 March 2010.
Accordingly, the Federal Reserve Bank of San Franciscowrote in a current report, "in many respects, fiscal conditions
[of states] are likely to get worse before they get better .”2
Revenues have plummeted
The primary cause of the states’ budgetary plight is plummetingtax revenues. They fell 8¾% between the beginning of 2008and 2009 (cf. chart). The only other decline in state & local taxreceipts reported in the last 60 years occurred in 2001/2002and was a much more moderate 1¾%. When interpreting thedata, it must be borne in mind that it already includes measuresimplemented to ensure a balanced budget – such as taxincreases. Without these steps, the decline in tax revenueswould have been much stronger.
DRAMATIC SLUMP IN TAX REVENUES
State & local authority tax receipts, in % yoy
-10
-5
0
5
10
15
20
I/50 I/55 I/60 I/65 I/70 I/75 I/80 I/85 I/90 I/95 I/00 I/05 I/10
Source: BEA, Thomson Datastream, UniCredit Research
As already mentioned, the expenditures of the state and localauthorities also increase at times of crisis. The most importantitems are rising unemployment benefits and ballooninghealth care (Medicaid) costs for residents who lost their jobs,income, and health insurance. The Center on Budget andPolicy Priorities (CBPP) estimates that in fiscal 2009 and2010 the states had to plug budget shortfalls of USD 110bnand USD 200bn, respectively (cf. chart next page).3 Thenumber for 2010 is equivalent to close to 1½% of US GDP.
2
Gerst, J. and D. Wilson, Fiscal Crises of the States: Causes andConsequences, FRBSF Economic Letter 2010-20 , 28. June 2010.3 Recession Continues to batter State Budgets; State Responses could
slow Recovery , Center on Budget and Policy Priorities, 27 May 2010.
8/9/2019 JUL 16 UniCredit Friday Notes
http://slidepdf.com/reader/full/jul-16-unicredit-friday-notes 8/32
16 July 2010 Economics & FI/FX Research
Friday Notes
UniCredit Research page 8 See last pages for disclaimer.
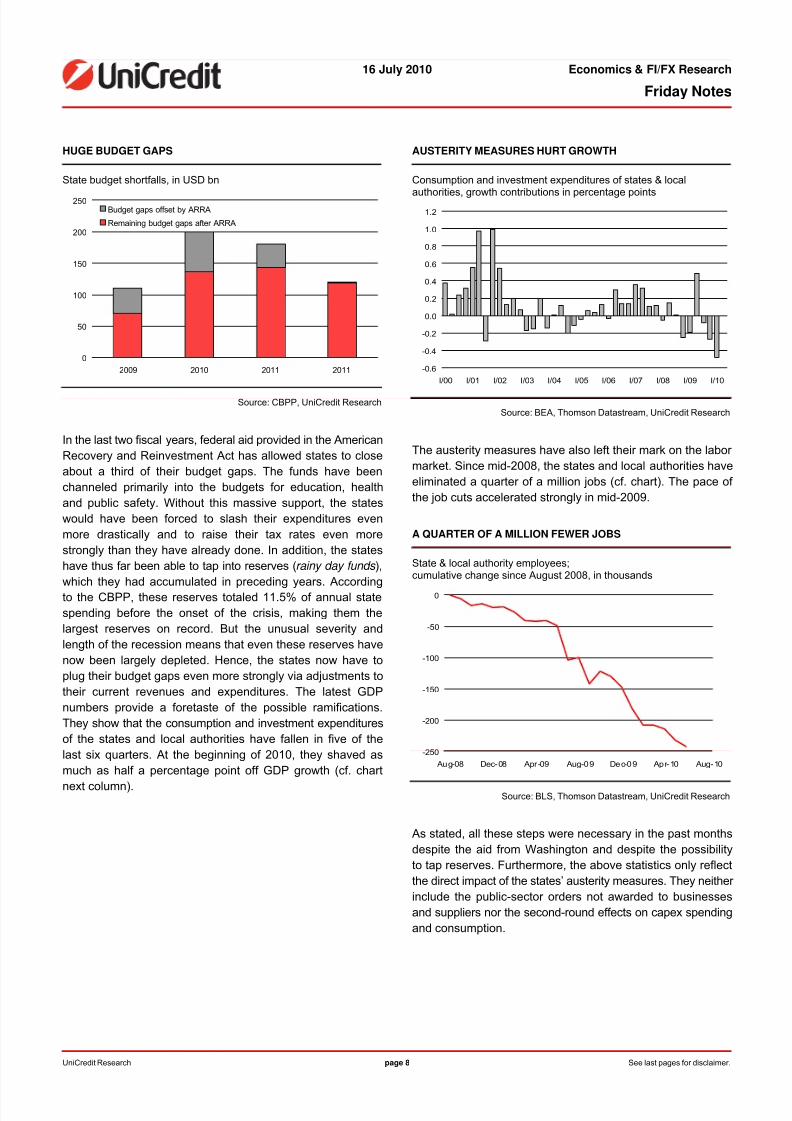
HUGE BUDGET GAPS
State budget shortfalls, in USD bn
0
50
100
150
200
250
2009 2010 2011 2011
Budget gaps offset by ARRA
Remaining budget gaps after ARRA
Source: CBPP, UniCredit Research
In the last two fiscal years, federal aid provided in the AmericanRecovery and Reinvestment Act has allowed states to closeabout a third of their budget gaps. The funds have beenchanneled primarily into the budgets for education, healthand public safety. Without this massive support, the stateswould have been forced to slash their expenditures evenmore drastically and to raise their tax rates even morestrongly than they have already done. In addition, the stateshave thus far been able to tap into reserves (rainy day funds ),
which they had accumulated in preceding years. Accordingto the CBPP, these reserves totaled 11.5% of annual statespending before the onset of the crisis, making them thelargest reserves on record. But the unusual severity andlength of the recession means that even these reserves havenow been largely depleted. Hence, the states now have toplug their budget gaps even more strongly via adjustments totheir current revenues and expenditures. The latest GDPnumbers provide a foretaste of the possible ramifications.They show that the consumption and investment expendituresof the states and local authorities have fallen in five of thelast six quarters. At the beginning of 2010, they shaved asmuch as half a percentage point off GDP growth (cf. chartnext column).
AUSTERITY MEASURES HURT GROWTH
Consumption and investment expenditures of states & local
authorities, growth contributions in percentage points
-0.6
-0.4
-0.2
0.0
0.2
0.4
0.6
0.8
1.0
1.2
I/00 I/01 I/02 I/03 I/04 I/05 I/06 I/07 I/08 I/09 I/10
Source: BEA, Thomson Datastream, UniCredit Research
The austerity measures have also left their mark on the labor market. Since mid-2008, the states and local authorities haveeliminated a quarter of a million jobs (cf. chart). The pace of the job cuts accelerated strongly in mid-2009.
A QUARTER OF A MILLION FEWER JOBS
State & local authority employees;cumulative change since August 2008, in thousands
-250
-200
-150
-100
-50
0
Aug-08 Dec-08 Apr-09 Aug-09 Dec-09 Apr-10 Aug-10
Source: BLS, Thomson Datastream, UniCredit Research
As stated, all these steps were necessary in the past monthsdespite the aid from Washington and despite the possibilityto tap reserves. Furthermore, the above statistics only reflectthe direct impact of the states’ austerity measures. They neither include the public-sector orders not awarded to businessesand suppliers nor the second-round effects on capex spendingand consumption.
8/9/2019 JUL 16 UniCredit Friday Notes
http://slidepdf.com/reader/full/jul-16-unicredit-friday-notes 9/32
16 July 2010 Economics & FI/FX Research
Friday Notes
UniCredit Research page 9 See last pages for disclaimer.
Even more austerity measures needed
The ARRA funding is scheduled to expire at the end of 2010,
i.e. right in the middle of the current fiscal year. Implicitly,however, the states had hoped that at least the payments for the Medicaid program (Federal Medical Assistance Percentages
(FMAP)) would be extended for another six months. Accordingto the Congressional Budget Office, this extension would havesaved the states about USD 16bn.4 30 states had firmlyintegrated these funds into their budget plans, since theHouse had already voted in favor of extending the FMAP,and President Obama included the additional funds in hisbudget. At the end of June, however, the Senate voted againstthis plan! That means the states will have to impose additionalcuts to eliminate the new shortfalls. At least 45 states have
already reduced services since the recession began. Many of them have particular ramifications for vulnerable populations:5
– At least 30 states have implemented cuts that restrictlow-income children’s or families’ eligibility for health careinsurance or reduce their access to health care services.
– At least 25 states are cutting programs for the elderly anddisabled (e.g. medical, rehabilitative or home care services).
– At least 30 states are cutting aid to K-12 schools andvarious education programs.
– At least 41 states have cut assistance to public collegesand universities, resulting in reductions in faculty and
staff, in addition to tuition increases.
At the same time, many states are attempting to boosttheir revenues:
– Since the beginning of the crisis, more than 30 stateshave raised taxes, sometimes quite significantly.Increases have been enacted or are under considerationin personal income, business, sales and excise taxes.
– Furthermore, many states are planning to increase taxeson cigarettes or beverages.
These and further measures are necessary as the states’cumulative budget shortfall (after deducting the ARRA funds)will likely reach USD 140bn in the current fiscal year. That isthe largest gap on record and translates into close to 1% of nominal GDP! According to a rule of thumb used by theCouncil of Economic Advisers, each percentage point of GDP translates into roughly one million public and privatesector jobs.6
4 What States and the Economy lost when the Senate Jobs Bill failed ,
Center on Budget and Policy Priorities, 24 June 2010. 5
An Update on States Budget Cuts , Center on Budget and Policy Priori-ties, 25 May 2010. 6
Romer, C. and J. Bernstein, The Job Impact of the American Recovery and Reinvestment Plan , 9 January 2009.
What cannot be quantified is the impact on the general qualityof life, since the layoffs affect such important positions asteachers, firefighters, police officers, and waste management
personnel. Furthermore, the spending cuts affect primarilythe poor and needy.
The (multi) trillion dollar gap
The analysis thus far does not take into account the problemsof the state-sponsored pension plans. According to estimatesof the highly-respected PEW Center on the States, the statepension funds reported assets of USD 2.35 trillion at mid-2009.This compared with liabilities (promised healthcare and other retirement benefits) totaling USD 3.35 trillion. The states’pension funds, therefore, have a gap of one trillion USD!7
The PEW Center emphasizes that the investment losses duringthe Great Recession account for only a portion of this shortfall.Many states fell behind on their payments even before thecrisis, as they preferred to use the funds to cover currentexpenditures, e.g. for education, health care, public safetyand other critical needs. Professors Robert Novy-Marx andJoshua Rauh estimate that the states’ pension funding gap eventotals more than three trillion USD. They argue that the presentvalue of future liabilities is clearly underestimated, as it iscalculated using an unreasonable discount rate of 8%.8 If instead a risk-free interest rate, like the interest rate onT-Bills or bonds is used, the present value of thealready-promised pension liabilities of the 50 states amounts
to more than 5 trillion USD (cf. chart next page)!
Since the underfunding of pension plans is now becoming moreobvious while at the same time more and more baby-boomersare nearing retirement, the first states were compelled totackle the problem. Ten states have so far raised the retirementage or lowered the benefits for new employees, while tenother states increased the contributions that current and futureemployees make to their own benefit system. Theseincreases are – as David Rosenberg, former Chief Economistof Merrill Lynch emphasizes – a de facto tax hike that willslow the recovery of household spending. If, however, the
states refrained from further contribution increases, theywould have to offset the pension gaps from the currentbudget, which in turn would entail spending cuts elsewhereand/or tax increases. The states are, therefore, in a trickysituation that will probably get worse in the coming years.Ultimately, there will presumably be no alternative but to alsocut the benefits promised to existing employees – even thoughthe constitution of many states currently does not allow sucha step.
7
The Trillion Dollar Gap – Underfunded State Retirement Systems and the Roads to Reform , PEW Center on the States, February 2010.8
Novy-Marx, R. and J.D. Rauh (2009), The Liabilities and Risks of State-Sponsored Pension Plans, Journal of Economic Perspectives , 23(4), 191-210.

8/9/2019 JUL 16 UniCredit Friday Notes
http://slidepdf.com/reader/full/jul-16-unicredit-friday-notes 10/32
16 July 2010 Economics & FI/FX Research
Friday Notes
UniCredit Research page 10 See last pages for disclaimer.
MASSIVE UNDERFUNDING OF STATE PENSION PLANS
State pension funds: Assets and liabilities in USD trillion
0.0
1.0
2.0
3.0
4.0
5.0
6.0
PEW Center on the States Novy-Marx and Rauh (market-based
discount rate)
Assets Liabilities
1.0tr
3.2tr
Source: PEW Center, Novy-Marx and Rauh, UniCredit Research
Hopes pinned on Washington
After making considerable cuts in the past two years, thestates must again plug a USD 140bn budget gap in the currentfiscal year. Without further aid from Washington, the necessarysteps could shave close to one percentage point off GDPgrowth and, in the process, eliminate close to one million jobs.The administration in Washington has stressed repeatedly inrecent weeks and months that the stabilization of the economyand the creation of jobs have absolute priority. Against thisbackdrop, further massive transfers to the states are arguablythe easiest, quickest and most efficient stimulus the federalgovernment can launch. With mid-term congressional electionslooming in November, it probably won’t be easy for theopposition to oppose such a bill, since with an unemploymentrate running at close to 10% most voters will undoubtedlygive preference to the prospect of more jobs over reducingthe federal debt. Furthermore, extending the transfers to thestates does not even have to be labeled a "stimulus". In our basescenario, we therefore assume that further funds will flow tothe states. We even assume that government expendituresas a whole (federal plus states & local authorities) will
increase by ¾% in the current year after ½% in 2010. This is,of course, still substantially less than in the last three years,when public-sector expenditures increased on average bymore than 2%.
The risk for this outlook is, however, clearly skewed to thedownside. First, the recent Senate resolution against extendingunemployment benefits and the FMAP demonstrated that
resistance to the ballooning federal debt is increasing inWashington. Second, the budget problems of the states (ontop of that, there are the problems facing local authorities)could be substantially greater than estimated so far. Spendingcuts and layoffs would then trigger a downward spiral thatwould choke the fragile recovery. Finally, potential bankruptciesof some local authorities could bring further writedowns. Theresulting tensions on financial markets would, in turn, havethe potential to hurt growth via a negative feedback loop.
Dr. Harm Bandholz, CFA (UniCredit Bank) +1 212 [email protected]

8/9/2019 JUL 16 UniCredit Friday Notes
http://slidepdf.com/reader/full/jul-16-unicredit-friday-notes 11/32
16 July 2010 Economics & FI/FX Research
Friday Notes
UniCredit Research page 11 See last pages for disclaimer.
Crude oil market well supplied
■ The International Energy Agency (IEA) indicates that demandfor oil is adequately covered up to and including 2015.Nevertheless, it is not possible to sound the all-clear for the oil market.
■ Demand estimates were raised by 3 mb/d compared tothe previous year. The primary reasons for this are thestrong growth in emerging markets.
■ OPEC’s free production capacity remains very high. It isadequate to offset the decline in the output of exhaustedfields, cover the growth of emerging markets and smoothout short-term delivery disruptions.
■ The report does, however, also reveal three weak spots.First, the production of conventional petroleum from alreadyexhausted fields declines considerably – a heavy burdenfor increasing global crude oil production going forward.
■ Second, the non-OPEC countries can no longer offset thedecline in output from conventional oil fields, therebyincreasing dependence on OPEC. The production increasecomes primarily from the increase in the production of biofuels,NGL and non-conventional petroleum.
■ We are retaining our target price for 2010 of USD 80per barrel, but we are lowering our target price for 2011from USD 90 to USD 80 per barrel (in each case calendar year averages).
Demand for crude oil expected toincrease strongly
Every year at the end of June, the International EnergyAgency (IEA) publishes its MTOMR. It discusses the prospectsfor the petroleum and natural gas market for the next fiveyears. The report is then updated each December. An initial
important finding of the 20110 MTOMR is the again substantiallyhigher growth now projected for petroleum consumption. Upto and including 2014, demand is expected to increase from84.77 mb/d to 90.99 mb/d (cf. chart next column). That is anincrease of roughly 3 mb/d compared to the 2009 MTOMR, whichwas, however, written under the impact of the financial crisis,when the DAX, for example, was still trading at 4,600 points.
IEA CONSUMPTION ESTIMATE REVISED UP BY ALMOST 3 MB/D!
82
84
86
88
90
92
94
2009 2010 2011 2012 2013 2014 2015
m b / d
2009 MTOMR
2010 MTOMR
Source: IEA MTOMR 2010, UniCredit Research
Adequate oil supply up
The second important finding is that global crude oil productioncapacity will be more than adequate to meet the highconsumption growth. In its 2010 MTOMR, the IEA assumesthat the free production capacity will increase from 91.0 mb/din 2009 to 96.5 mb/d in 2015. The bulk of this capacityexpansion comes from OPEC. Here, the crude oil productioncapacity is expected to increase by 1.9 mb/d. On top of that,there is an increase in the NGLs (= Natural Gas Liquids suchas, for example, propane, butane) of 2.6 mb/d. The free
production capacity of the non-OPEC states, in contrast,increases by only 1.0 mb/d. Over the entire period, the freeproduction capacity of OPEC remains relatively high. 5.8 mb/dare expected for 2010. But this already marks the peak. By 2015,it is expected to decline again towards 4 mb/d (cf. chart).
FREE PRODUCTION CAPACITY OF OPEC REMAINS HIGH
5.3
5.85.5
4.4
3.5
4.2
3.6
0
1
2
3
4
5
6
7
2009 2010 2011 2012 2013 2014 2015
m b / d
OPEC spare capacity
Source: IEA MTOMR 2010, UniCredit Research
The scenario does, however, have one important weak spot:
A strong decline in production from old, already exhaustedfields must be permanently replaced.
8/9/2019 JUL 16 UniCredit Friday Notes
http://slidepdf.com/reader/full/jul-16-unicredit-friday-notes 12/32
16 July 2010 Economics & FI/FX Research
Friday Notes
UniCredit Research page 12 See last pages for disclaimer.
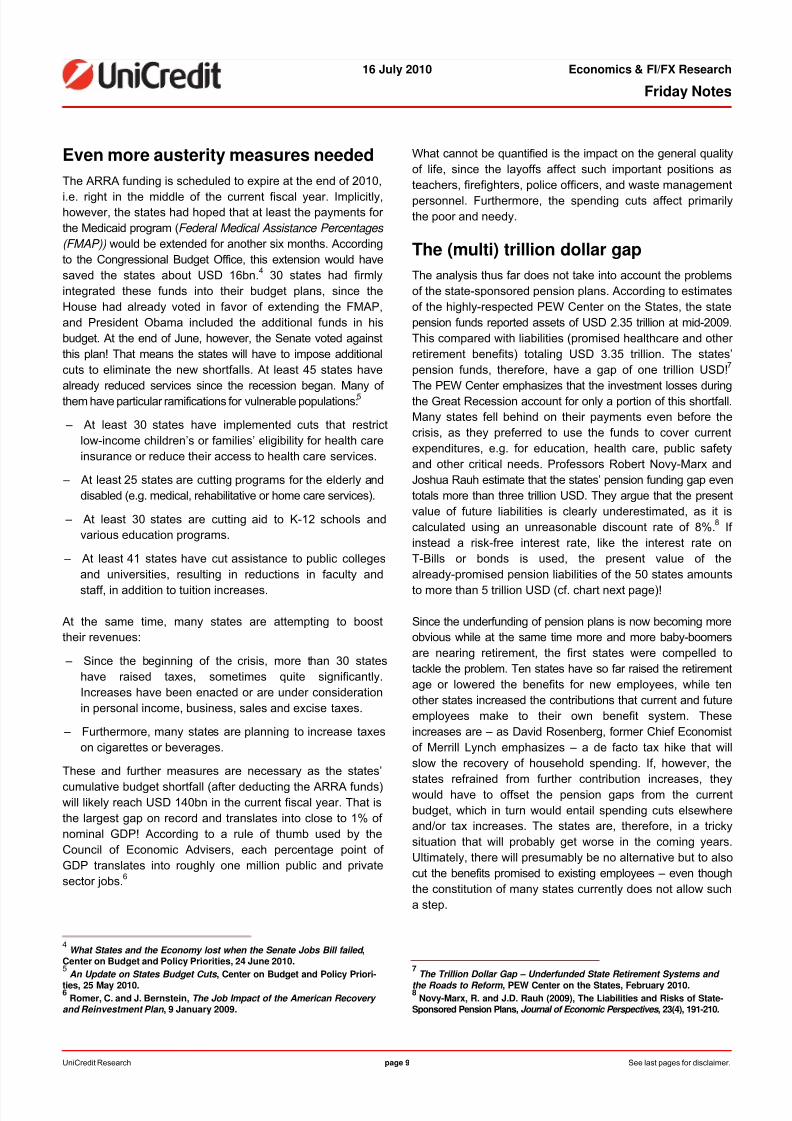
This becomes very visible for non-OPEC countries, wherecapacity expansion is covered almost entirely fromnon-conventional sources.
Decline in production from exhaustedfields is a major strain
Forecasting oil production is very difficult and depends onthree important assumptions. First, naturally, it depends on thedevelopment of already discovered oil fields. That problemscan repeatedly arise here is demonstrated by the Kaschaganoil field, with estimated reserves of 9-16bn barrels one of thelast major discoveries, where the start of production had to bepostponed from 2005 to 2012. Second, the crude oil price isdecisive, since it is only with a high oil price that the development
of more expensive deposits becomes feasible. Third, and goingforward perhaps even more importantly, the IEA must makean assumption of the decline in output from exhausted fields.Depending on the oil field, the decline in production can bebetween -1% and up to -30% (!!) per year in offshore fields.The 2010 MTOMR assumes a decline of 5.1% per year. Inthe 2009 MTOMR, the assumption had still been -5.8%. Theimprovement is, however, attributable solely to the higher oilprice, lower costs and resumed capital spending. This meansa decline in production of the non-OPEC countries of 1.9mb/d and for OPEC of 1.2 mb/d. Offsetting the decline inproduction totaling 3.1 mb/d per year presents the petroleum
industry with an enormous challenge. Above and beyondthat, the production capacity is also to be increased from91.0 mb/d in 2009 to 96.5 mb/d in 2015 to satisfy demandgrowth from emerging markets! The sensitivity of petroleumproduction to the decline in mature fields is enormous. If thedecline in production were only 0.5 percentage points higher per year than estimated, the projected petroleum productionof the non-OPEC states in 2015 would be 1.0 mb/d lower.
Unconventionals must fill the gap
The IEA expects that by 2015 the non-OPEC countries canincrease their crude oil production by roughly 1.0 mb/d. The
2009 MTOMR still expected a decline (!) of 0.4 mb/d. Thenon-OPEC countries do not, however, succeed here via theproduction of conventional petroleum. Quite the contrary:The decline in output from the exhausted oil fields is alreadyso strong that it can no longer be neutralized even by newprojects in the conventional field. By 2015, conventionalpetroleum production will decline by 1.0 mb/d. The main supportfor the increase is production is instead the increase of biofuel production, which in turn can be attributed primarily toUS ethanol production (cf. chart next column).
CHANGE IN NON-OPEC OIL PRODUCTION BY 2015
-1
0.8 0.7
0.4
0.1
-1.2
-1
-0.8
-0.6
-0.4
-0.2
0
0.2
0.4
0.6
0.81
Conventional
crude supply
Biofuels Other
unconventional
sources
NGLs Refinery
processing
gains
m b / d
Non-OPEC: composition of the additional supply up to and including 2015
Source: IEA MTOMR 2010, UniCredit Research
But this increase has its price. Just over 50% of this year’scorn harvest is being used to produce bioethanol. On theother hand, the US wheat acreage has fallen from 28mn hectaresin 1990 to now 19mn hectares. The wheat price has,nevertheless, not increased, because the Eastern Europeancountries were to some extent able to fill this gap by expandingtheir wheat production. The other components are theproduction of NGL, which by 2015 is to increase by 0.4 mb/d,and the production of petroleum from non-conventionalsources, e.g. from deep water. Above all, this part could become
problematic in the coming years. If the Deepwater Horizondisaster in the Gulf of Mexico were to result in delays or eventhe complete abandonment of projects, by 2015 productionmust be expected to decline by between 300 kb/d and 800kb/d. A further problem is that the increase in non-OPEC oilproduction is in the years 2010 and 2011. By 2015, productionis then expected to merely stagnate.
OPEC surplus holds oil price in check
For us, the 2010 MTOMR highlights that the high freeproduction capacity of OPEC will keep the oil price in checkup to the end of 2011 (cf. chart next page). With 5.8 mb/d, itis high enough to offset the decline in production fromexhausted fields, cover the growth of emerging markets, andbalance out short-term delivery disruptions. This applies allthe more since the non-OPEC contributions to global oilproduction will come to market primarily in 2010/2011. Thedecline in production of conventional petroleum in thenon-OPEC countries does, however, remain problematic.This can be offset only by biofuels, NLGs and deepwater oil.All three alternatives are, however, problematic. We arepessimistic primarily when it comes to further deepwater projects.Many believe that the oil catastrophe in the Gulf of Mexicowill do to deepwater oil production what the Chernobyl disaster
did to the nuclear industry. This increases the dependenceon OPEC.
8/9/2019 JUL 16 UniCredit Friday Notes
http://slidepdf.com/reader/full/jul-16-unicredit-friday-notes 13/32
16 July 2010 Economics & FI/FX Research
Friday Notes
UniCredit Research page 13 See last pages for disclaimer.
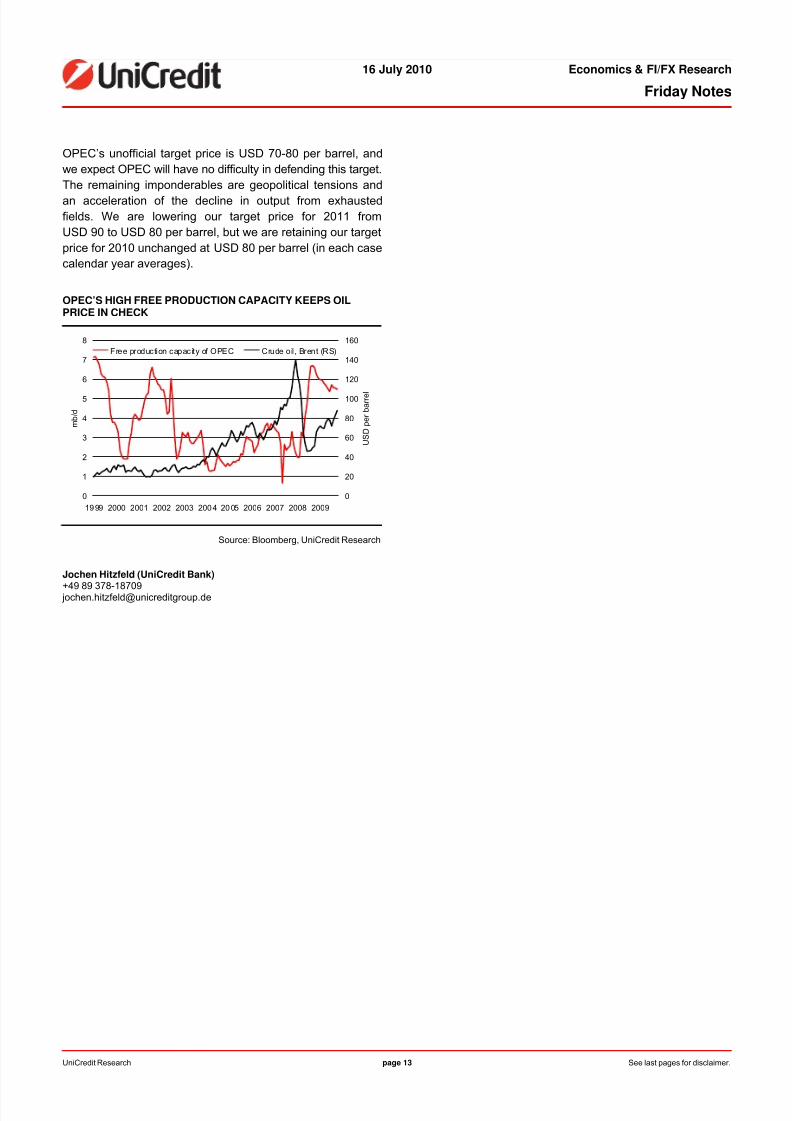
OPEC’s unofficial target price is USD 70-80 per barrel, andwe expect OPEC will have no difficulty in defending this target.The remaining imponderables are geopolitical tensions and
an acceleration of the decline in output from exhaustedfields. We are lowering our target price for 2011 fromUSD 90 to USD 80 per barrel, but we are retaining our targetprice for 2010 unchanged at USD 80 per barrel (in each casecalendar year averages).
OPEC’S HIGH FREE PRODUCTION CAPACITY KEEPS OILPRICE IN CHECK
0
1
2
3
4
5
6
7
8
1999 2000 2001 2002 2003 2004 2005 2006 2007 2008 2009
m b / d
0
20
40
60
80
100
120
140
160
U S D
p e r b a r r e l
Free production capacity of OPEC Crude oil, Brent (RS)
Source: Bloomberg, UniCredit Research
Jochen Hitzfeld (UniCredit Bank)
+49 89 378-18709 [email protected]
8/9/2019 JUL 16 UniCredit Friday Notes
http://slidepdf.com/reader/full/jul-16-unicredit-friday-notes 14/32
16 July 2010 Economics & FI/FX Research
Friday Notes
UniCredit Research page 14 See last pages for disclaimer.
Data Monitor Europe – Preview of the coming week
Thursday, 22 July
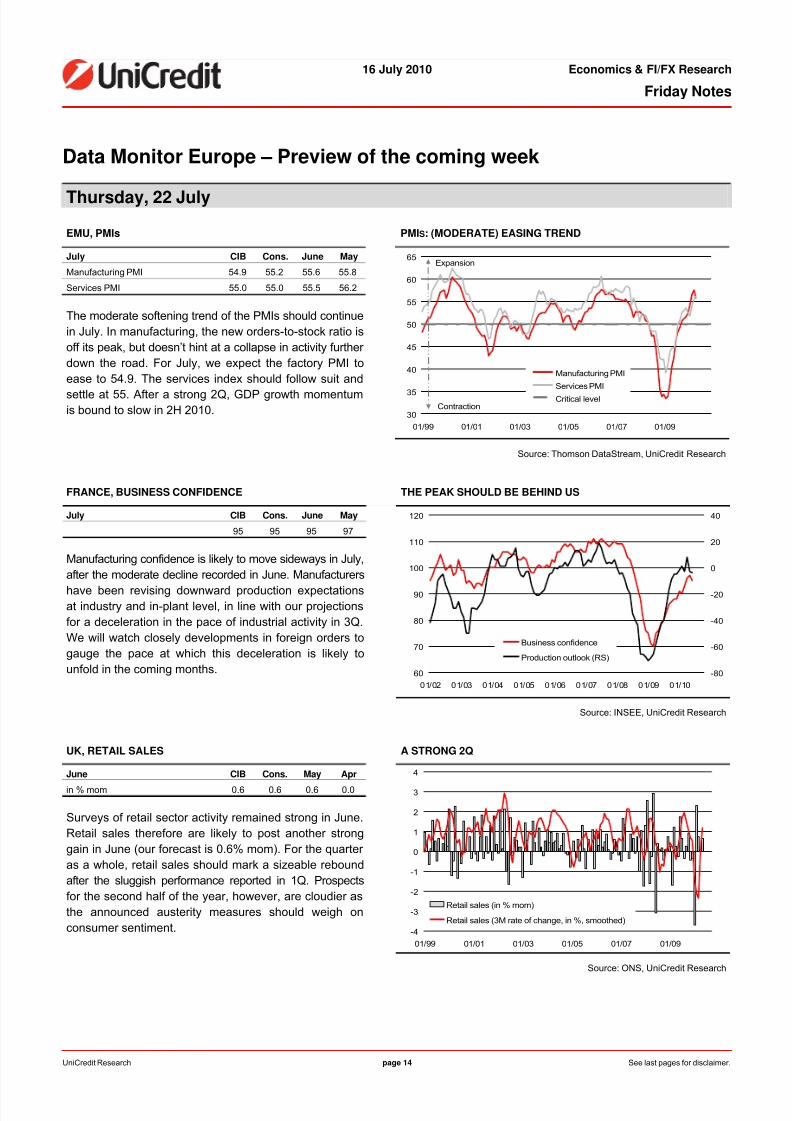
EMU, PMIs PMIS: (MODERATE) EASING TREND
July CIB Cons. June May
Manufacturing PMI 54.9 55.2 55.6 55.8
Services PMI 55.0 55.0 55.5 56.2
30
35
40
45
50
55
60
65
01/99 01/01 01/03 01/05 01/07 01/09
Manufacturing PMI
Services PMICritical level
Contraction
Expansion
The moderate softening trend of the PMIs should continuein July. In manufacturing, the new orders-to-stock ratio isoff its peak, but doesn’t hint at a collapse in activity further down the road. For July, we expect the factory PMI toease to 54.9. The services index should follow suit and
settle at 55. After a strong 2Q, GDP growth momentumis bound to slow in 2H 2010.
Source: Thomson DataStream, UniCredit Research
FRANCE, BUSINESS CONFIDENCE THE PEAK SHOULD BE BEHIND US
July CIB Cons. June May
95 95 95 97
60
70
80
90
100
110
120
01/02 01/03 01/04 01/05 01/06 01/07 01/08 01/09 01/10
-80
-60
-40
-20
0
20
40
Business confidence
Production outlook (RS)
Manufacturing confidence is likely to move sideways in July,after the moderate decline recorded in June. Manufacturers
have been revising downward production expectationsat industry and in-plant level, in line with our projectionsfor a deceleration in the pace of industrial activity in 3Q.We will watch closely developments in foreign orders togauge the pace at which this deceleration is likely tounfold in the coming months.
Source: INSEE, UniCredit Research
UK, RETAIL SALES A STRONG 2Q
June CIB Cons. May Apr
in % mom 0.6 0.6 0.6 0.0
-4
-3
-2
-1
0
1
2
3
4
01/99 01/01 01/03 01/05 01/07 01/09
Retail sales (in % mom)
Retail sales (3M rate of change, in %, smoothed)
Surveys of retail sector activity remained strong in June.Retail sales therefore are likely to post another stronggain in June (our forecast is 0.6% mom). For the quarter as a whole, retail sales should mark a sizeable reboundafter the sluggish performance reported in 1Q. Prospectsfor the second half of the year, however, are cloudier asthe announced austerity measures should weigh onconsumer sentiment.
Source: ONS, UniCredit Research
8/9/2019 JUL 16 UniCredit Friday Notes
http://slidepdf.com/reader/full/jul-16-unicredit-friday-notes 15/32
16 July 2010 Economics & FI/FX Research
Friday Notes
UniCredit Research page 15 See last pages for disclaimer.
Friday, 23 July
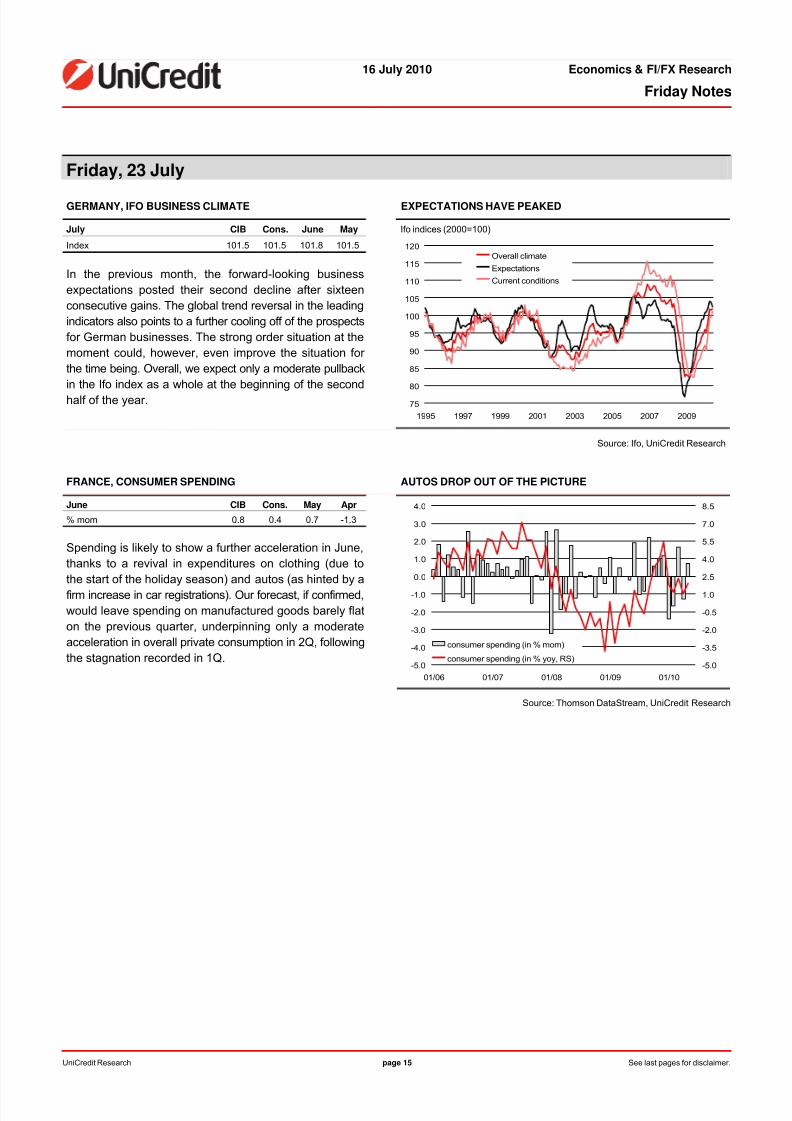
GERMANY, IFO BUSINESS CLIMATE EXPECTATIONS HAVE PEAKED
July CIB Cons. June May Ifo indices (2000=100)
Index 101.5 101.5 101.8 101.5
75
80
85
90
95
100
105
110
115
120
1995 1997 1999 2001 2003 2005 2007 2009
Overall climate
Expectations
Current conditions
In the previous month, the forward-looking businessexpectations posted their second decline after sixteenconsecutive gains. The global trend reversal in the leadingindicators also points to a further cooling off of the prospectsfor German businesses. The strong order situation at themoment could, however, even improve the situation for the time being. Overall, we expect only a moderate pullback
in the Ifo index as a whole at the beginning of the secondhalf of the year.
Source: Ifo, UniCredit Research
FRANCE, CONSUMER SPENDING AUTOS DROP OUT OF THE PICTURE
June CIB Cons. May Apr
% mom 0.8 0.4 0.7 -1.3
Spending is likely to show a further acceleration in June,thanks to a revival in expenditures on clothing (due to
the start of the holiday season) and autos (as hinted by afirm increase in car registrations). Our forecast, if confirmed,would leave spending on manufactured goods barely flaton the previous quarter, underpinning only a moderateacceleration in overall private consumption in 2Q, followingthe stagnation recorded in 1Q.
-5.0
-4.0
-3.0
-2.0
-1.0
0.0
1.0
2.0
3.0
4.0
01/06 01/07 01/08 01/09 01/10
-5.0
-3.5
-2.0
-0.5
1.0
2.5
4.0
5.5
7.0
8.5
consumer spending (in % mom)
consumer spending (in % yoy, RS)
Source: Thomson DataStream, UniCredit Research
8/9/2019 JUL 16 UniCredit Friday Notes
http://slidepdf.com/reader/full/jul-16-unicredit-friday-notes 16/32
16 July 2010 Economics & FI/FX Research
Friday Notes
UniCredit Research page 16 See last pages for disclaimer.
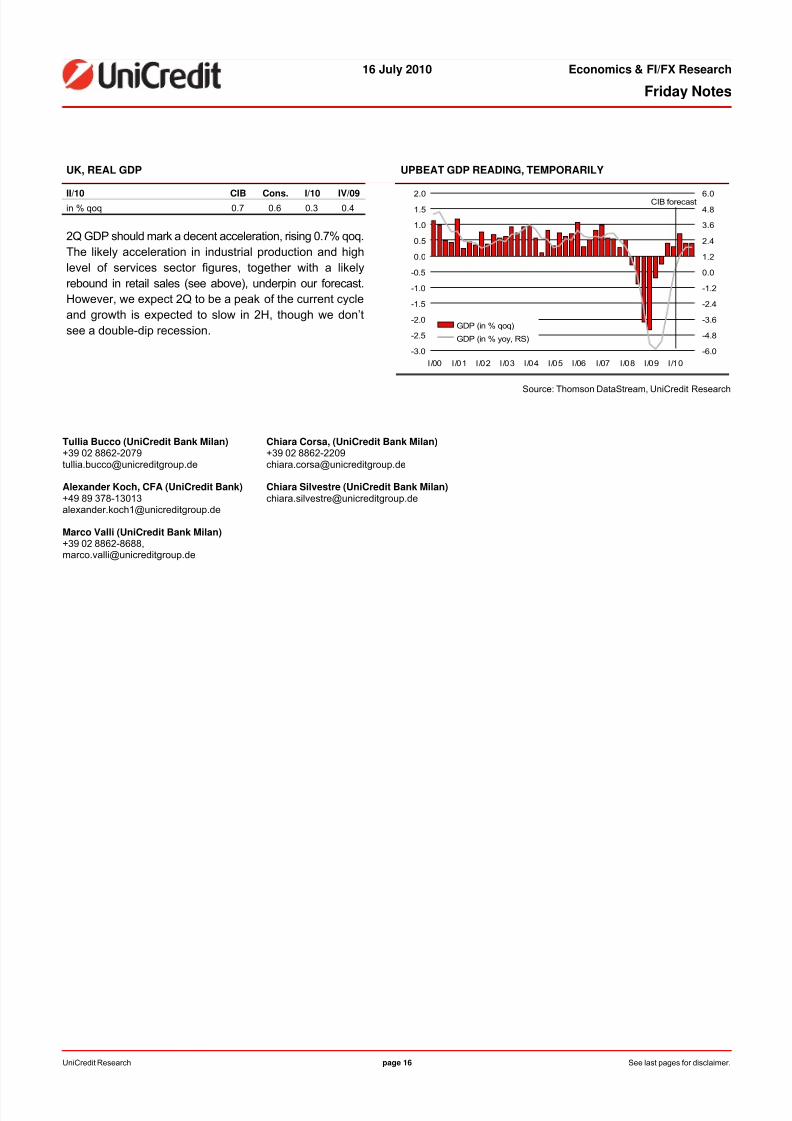
UK, REAL GDP UPBEAT GDP READING, TEMPORARILY
II/10 CIB Cons. I/10 IV/09in % qoq 0.7 0.6 0.3 0.4
2Q GDP should mark a decent acceleration, rising 0.7% qoq.The likely acceleration in industrial production and highlevel of services sector figures, together with a likelyrebound in retail sales (see above), underpin our forecast.However, we expect 2Q to be a peak of the current cycleand growth is expected to slow in 2H, though we don’tsee a double-dip recession.
-3.0
-2.5
-2.0
-1.5
-1.0
-0.5
0.0
0.5
1.0
1.5
2.0
I/00 I/01 I/02 I/03 I/04 I/05 I/06 I/07 I/08 I/09 I/10
-6.0
-4.8
-3.6
-2.4
-1.2
0.0
1.2
2.4
3.6
4.8
6.0
GDP (in % qoq)
GDP (in % yoy, RS)
CIB forecast
Source: Thomson DataStream, UniCredit Research
Tullia Bucco (UniCredit Bank Milan)+39 02 [email protected]
Chiara Corsa, (UniCredit Bank Milan) +39 02 [email protected]
Alexander Koch, CFA (UniCredit Bank) +49 89 [email protected]
Chiara Silvestre (UniCredit Bank Milan)[email protected]
Marco Valli (UniCredit Bank Milan) +39 02 8862-8688,[email protected]
8/9/2019 JUL 16 UniCredit Friday Notes
http://slidepdf.com/reader/full/jul-16-unicredit-friday-notes 17/32
16 July 2010 Economics & FI/FX Research
Friday Notes
UniCredit Research page 17 See last pages for disclaimer.
Data Monitor US - Preview of the coming week
Tuesday, 20 July
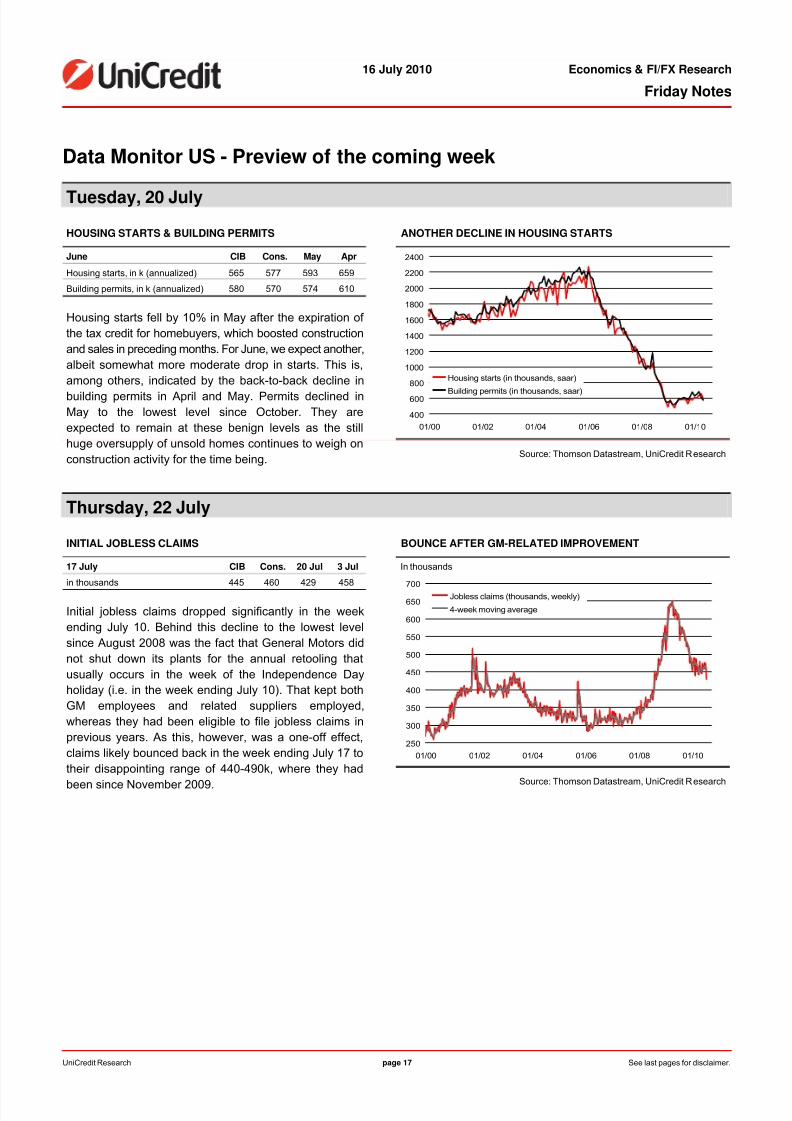
HOUSING STARTS & BUILDING PERMITS ANOTHER DECLINE IN HOUSING STARTS
June CIB Cons. May Apr
Housing starts, in k (annualized) 565 577 593 659
Building permits, in k (annualized) 580 570 574 610
400
600
800
1000
1200
1400
1600
1800
2000
2200
2400
01/00 01/02 01/04 01/06 01/08 01/10
Housing starts (in thousands, saar)
Building permits (in thousands, saar)
Housing starts fell by 10% in May after the expiration of the tax credit for homebuyers, which boosted constructionand sales in preceding months. For June, we expect another,albeit somewhat more moderate drop in starts. This is,among others, indicated by the back-to-back decline inbuilding permits in April and May. Permits declined inMay to the lowest level since October. They areexpected to remain at these benign levels as the stillhuge oversupply of unsold homes continues to weigh onconstruction activity for the time being. Source: Thomson Datastream, UniCredit Research
Thursday, 22 July
INITIAL JOBLESS CLAIMS BOUNCE AFTER GM-RELATED IMPROVEMENT
17 July CIB Cons. 20 Jul 3 Jul In thousands
in thousands 445 460 429 458
250
300
350
400
450
500
550
600
650
700
01/00 01/02 01/04 01/06 01/08 01/10
Jobless claims (thousands, weekly)
4-week moving average
Initial jobless claims dropped significantly in the weekending July 10. Behind this decline to the lowest levelsince August 2008 was the fact that General Motors didnot shut down its plants for the annual retooling thatusually occurs in the week of the Independence Dayholiday (i.e. in the week ending July 10). That kept bothGM employees and related suppliers employed,whereas they had been eligible to file jobless claims inprevious years. As this, however, was a one-off effect,claims likely bounced back in the week ending July 17 totheir disappointing range of 440-490k, where they had
been since November 2009. Source: Thomson Datastream, UniCredit Research
8/9/2019 JUL 16 UniCredit Friday Notes
http://slidepdf.com/reader/full/jul-16-unicredit-friday-notes 18/32
16 July 2010 Economics & FI/FX Research
Friday Notes
UniCredit Research page 18 See last pages for disclaimer.
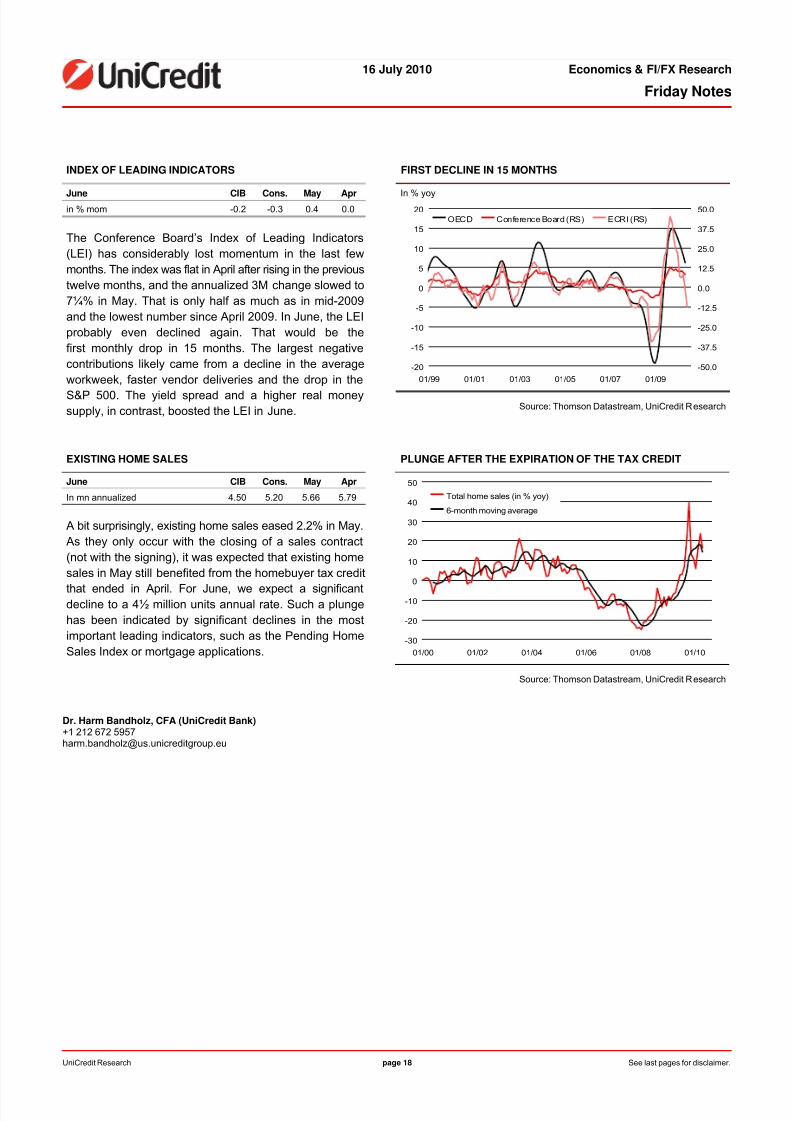
INDEX OF LEADING INDICATORS FIRST DECLINE IN 15 MONTHS
June CIB Cons. May Apr In % yoyin % mom -0.2 -0.3 0.4 0.0
-20
-15
-10
-5
0
5
10
15
20
01/99 01/01 01/03 01/05 01/07 01/09
-50.0
-37.5
-25.0
-12.5
0.0
12.5
25.0
37.5
50.0
OECD Conference Board (RS) ECRI (RS)
The Conference Board’s Index of Leading Indicators(LEI) has considerably lost momentum in the last fewmonths. The index was flat in April after rising in the previoustwelve months, and the annualized 3M change slowed to7¼% in May. That is only half as much as in mid-2009and the lowest number since April 2009. In June, the LEIprobably even declined again. That would be thefirst monthly drop in 15 months. The largest negativecontributions likely came from a decline in the averageworkweek, faster vendor deliveries and the drop in the
S&P 500. The yield spread and a higher real moneysupply, in contrast, boosted the LEI in June. Source: Thomson Datastream, UniCredit Research
EXISTING HOME SALES PLUNGE AFTER THE EXPIRATION OF THE TAX CREDIT
June CIB Cons. May Apr
In mn annualized 4.50 5.20 5.66 5.79
-30
-20
-10
0
10
20
30
40
50
01/00 01/02 01/04 01/06 01/08 01/10
Total home sales (in % yoy)
6-month moving average
A bit surprisingly, existing home sales eased 2.2% in May.As they only occur with the closing of a sales contract(not with the signing), it was expected that existing homesales in May still benefited from the homebuyer tax credit
that ended in April. For June, we expect a significantdecline to a 4½ million units annual rate. Such a plungehas been indicated by significant declines in the mostimportant leading indicators, such as the Pending HomeSales Index or mortgage applications.
Source: Thomson Datastream, UniCredit Research
Dr. Harm Bandholz, CFA (UniCredit Bank)+1 212 672 [email protected]
8/9/2019 JUL 16 UniCredit Friday Notes
http://slidepdf.com/reader/full/jul-16-unicredit-friday-notes 19/32
16 July 2010 Economics & FI/FX Research
Friday Notes
UniCredit Research page 19 See last pages for disclaimer.
US Review
Wary Fed debates further stimulusThe minutes of the June 22/23 FOMC meeting confirmedthat the majority of Fed officials became more worried aboutthe strength of the US recovery. While all participants continuedto forecast a moderate recovery in economic activity, “most
participants revised down slightly their outlook for economic
growth, and about one-half of the participants judged the
balance of risks to growth as having moved to the downside ”(cf. table). This is partly due to the fact that financial marketshave become “less supportive of economic growth, largely
reflecting international spillovers from European fiscal
strains .” In addition, the minutes emphasized that businesses
were still cautious about hiring or investing, given uncertaintiesabout the outlook for the economy, developments in globalfinancial markets and legislative changes. So far, thechanges to the outlook “were viewed as relatively modest
and as not warranting policy accommodation beyond that already
in place . However, members noted that […] the Committee
would need to consider whether further policy stimulus might
become appropriate if the outlook were to worsen appreciably .”In other words, the Fed spent quite some time in its Junemeeting debating a potential expansion of its credit easing policy.
ECONOMIC PROJECTIONS OF THE FEDERAL RESERVE
Central tendency 2010 2011 2012
Real GDP growthApril projection
3.0% - 3.5%3.2% - 3.7%
3.5% - 4.2%3.4% - 4.5%
3.5% - 4.5%3.5% - 4.5%
Unemployment rateApril projection
9.2% - 9.5%9.1% - 9.5%
8.3% - 8.7%8.1% - 8.5%
7.1% - 7.5%6.6% - 7.5%
PCE inflationApril projection
1.0% - 1.1%1.2% - 1.5%
1.1% - 1.6%1.1% - 1.9%
1.0% - 1.7%1.2% - 2.0%
Core PCE inflationApril projection
0.8% - 1.0%0.9% - 1.2%
0.9% - 1.3%1.0% - 1.5%
1.0% - 1.5%1.2% - 1.6%
Source: Federal Reserve, UniCredit Research
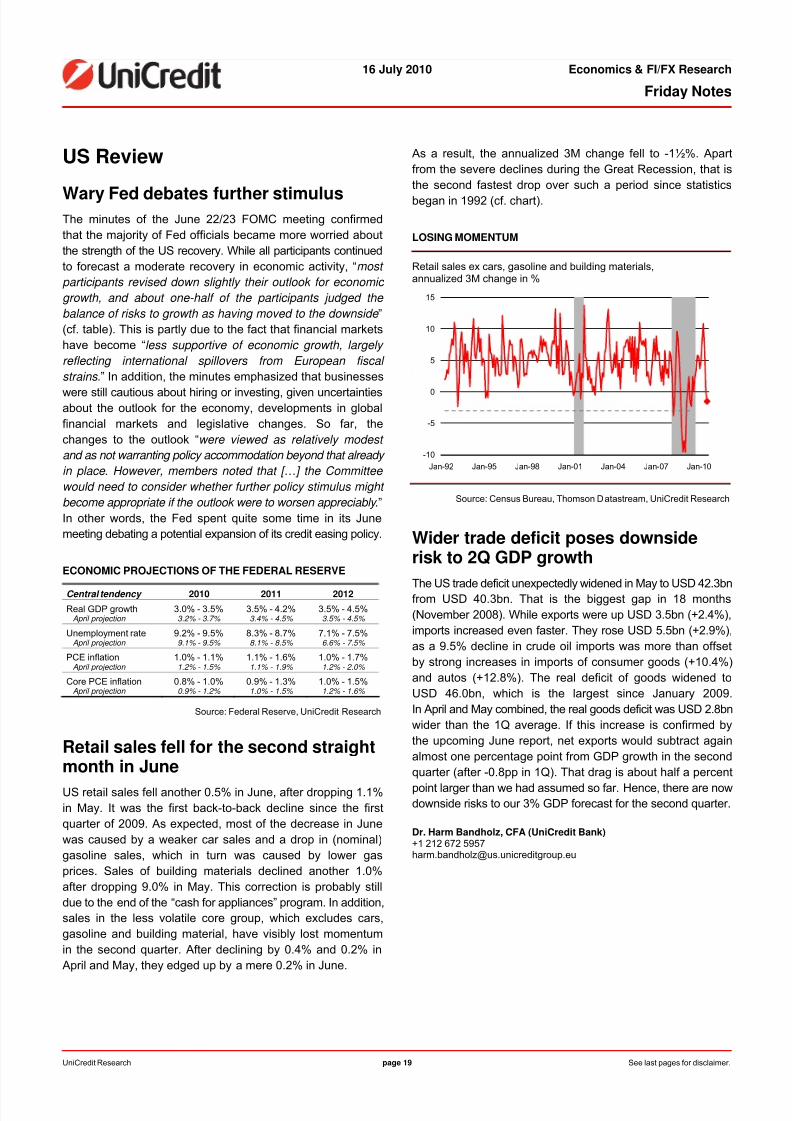
Retail sales fell for the second straightmonth in June
US retail sales fell another 0.5% in June, after dropping 1.1%in May. It was the first back-to-back decline since the firstquarter of 2009. As expected, most of the decrease in Junewas caused by a weaker car sales and a drop in (nominal)gasoline sales, which in turn was caused by lower gasprices. Sales of building materials declined another 1.0%after dropping 9.0% in May. This correction is probably stilldue to the end of the “cash for appliances” program. In addition,sales in the less volatile core group, which excludes cars,gasoline and building material, have visibly lost momentumin the second quarter. After declining by 0.4% and 0.2% inApril and May, they edged up by a mere 0.2% in June.
As a result, the annualized 3M change fell to -1½%. Apartfrom the severe declines during the Great Recession, that isthe second fastest drop over such a period since statistics
began in 1992 (cf. chart).
LOSING MOMENTUM
Retail sales ex cars, gasoline and building materials,annualized 3M change in %
-10
-5
0
5
10
15
Jan-92 Jan-95 Jan-98 Jan-01 Jan-04 Jan-07 Jan-10
Source: Census Bureau, Thomson Datastream, UniCredit Research
Wider trade deficit poses downsiderisk to 2Q GDP growth
The US trade deficit unexpectedly widened in May to USD 42.3bnfrom USD 40.3bn. That is the biggest gap in 18 months(November 2008). While exports were up USD 3.5bn (+2.4%),imports increased even faster. They rose USD 5.5bn (+2.9%),as a 9.5% decline in crude oil imports was more than offsetby strong increases in imports of consumer goods (+10.4%)and autos (+12.8%). The real deficit of goods widened toUSD 46.0bn, which is the largest since January 2009.In April and May combined, the real goods deficit was USD 2.8bnwider than the 1Q average. If this increase is confirmed bythe upcoming June report, net exports would subtract againalmost one percentage point from GDP growth in the secondquarter (after -0.8pp in 1Q). That drag is about half a percentpoint larger than we had assumed so far. Hence, there are nowdownside risks to our 3% GDP forecast for the second quarter.
Dr. Harm Bandholz, CFA (UniCredit Bank) +1 212 672 [email protected]
8/9/2019 JUL 16 UniCredit Friday Notes
http://slidepdf.com/reader/full/jul-16-unicredit-friday-notes 20/32
16 July 2010 Economics & FI/FX Research
Friday Notes
UniCredit Research page 20 See last pages for disclaimer.
Fixed Income Outlook
■ There was hardly any activity on government bond marketsthis week reflecting a wait-and-see attitude ahead of thepublication of the stress tests of European banks next Friday.
■ Core bond market reactions should come under moderatepressure after the release of the stress test and we wouldneutralize the active duration exposure.
Hardly any activity this week
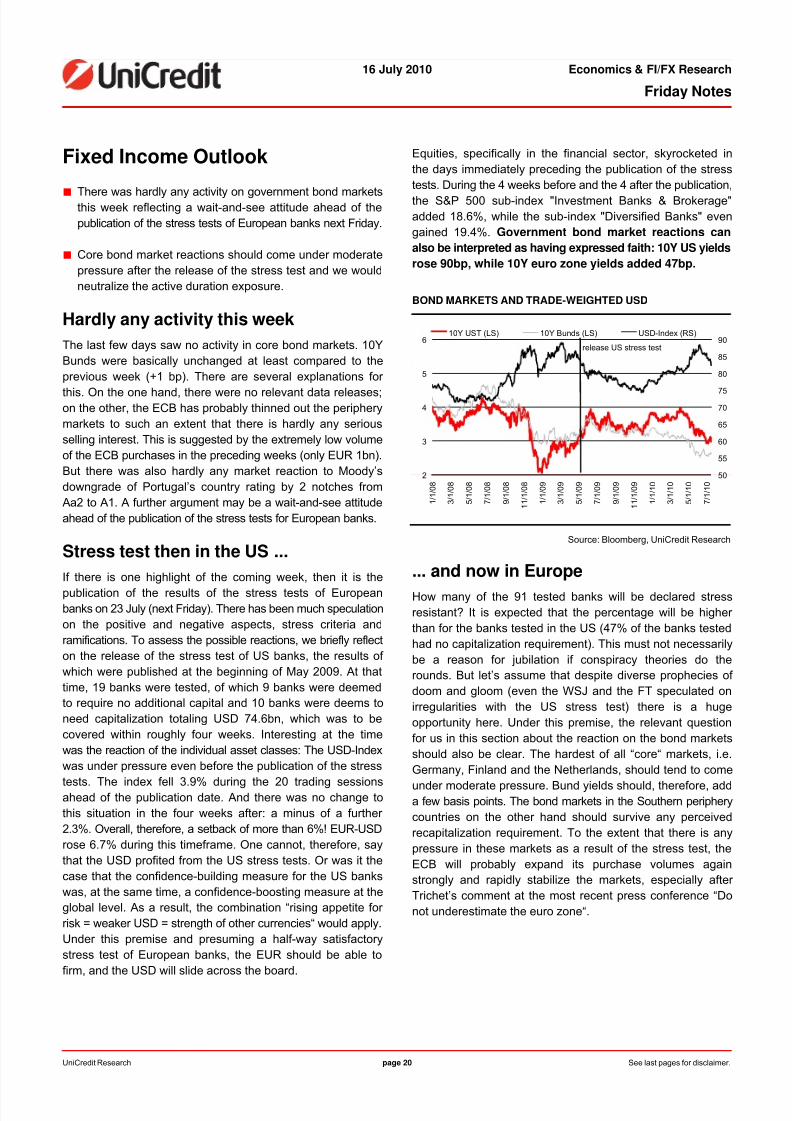
The last few days saw no activity in core bond markets. 10YBunds were basically unchanged at least compared to theprevious week (+1 bp). There are several explanations for
this. On the one hand, there were no relevant data releases;on the other, the ECB has probably thinned out the peripherymarkets to such an extent that there is hardly any seriousselling interest. This is suggested by the extremely low volumeof the ECB purchases in the preceding weeks (only EUR 1bn).But there was also hardly any market reaction to Moody’sdowngrade of Portugal’s country rating by 2 notches fromAa2 to A1. A further argument may be a wait-and-see attitudeahead of the publication of the stress tests for European banks.
Stress test then in the US ...
If there is one highlight of the coming week, then it is thepublication of the results of the stress tests of Europeanbanks on 23 July (next Friday). There has been much speculationon the positive and negative aspects, stress criteria andramifications. To assess the possible reactions, we briefly reflecton the release of the stress test of US banks, the results of which were published at the beginning of May 2009. At thattime, 19 banks were tested, of which 9 banks were deemedto require no additional capital and 10 banks were deems toneed capitalization totaling USD 74.6bn, which was to becovered within roughly four weeks. Interesting at the timewas the reaction of the individual asset classes: The USD-Indexwas under pressure even before the publication of the stress
tests. The index fell 3.9% during the 20 trading sessionsahead of the publication date. And there was no change tothis situation in the four weeks after: a minus of a further 2.3%. Overall, therefore, a setback of more than 6%! EUR-USDrose 6.7% during this timeframe. One cannot, therefore, saythat the USD profited from the US stress tests. Or was it thecase that the confidence-building measure for the US bankswas, at the same time, a confidence-boosting measure at theglobal level. As a result, the combination “rising appetite for risk = weaker USD = strength of other currencies“ would apply.Under this premise and presuming a half-way satisfactorystress test of European banks, the EUR should be able to
firm, and the USD will slide across the board.
Equities, specifically in the financial sector, skyrocketed inthe days immediately preceding the publication of the stresstests. During the 4 weeks before and the 4 after the publication,
the S&P 500 sub-index "Investment Banks & Brokerage"added 18.6%, while the sub-index "Diversified Banks" evengained 19.4%. Government bond market reactions can
also be interpreted as having expressed faith: 10Y US yields
rose 90bp, while 10Y euro zone yields added 47bp.
BOND MARKETS AND TRADE-WEIGHTED USD
2
3
4
5
6
1 / 1 / 0 8
3 / 1 / 0 8
5 / 1 / 0 8
7 / 1 / 0 8
9 / 1 / 0 8
1 1 / 1 / 0 8
1 / 1 / 0 9
3 / 1 / 0 9
5 / 1 / 0 9
7 / 1 / 0 9
9 / 1 / 0 9
1 1 / 1 / 0 9
1 / 1 / 1 0
3 / 1 / 1 0
5 / 1 / 1 0
7 / 1 / 1 0
50
55
60
65
70
75
80
85
9010Y UST (LS) 10Y Bunds (LS) USD-Index (RS)
release US stress test
Source: Bloomberg, UniCredit Research
... and now in Europe
How many of the 91 tested banks will be declared stressresistant? It is expected that the percentage will be higher than for the banks tested in the US (47% of the banks testedhad no capitalization requirement). This must not necessarilybe a reason for jubilation if conspiracy theories do therounds. But let’s assume that despite diverse prophecies of doom and gloom (even the WSJ and the FT speculated onirregularities with the US stress test) there is a hugeopportunity here. Under this premise, the relevant questionfor us in this section about the reaction on the bond marketsshould also be clear. The hardest of all “core“ markets, i.e.Germany, Finland and the Netherlands, should tend to comeunder moderate pressure. Bund yields should, therefore, adda few basis points. The bond markets in the Southern peripherycountries on the other hand should survive any perceivedrecapitalization requirement. To the extent that there is anypressure in these markets as a result of the stress test, theECB will probably expand its purchase volumes againstrongly and rapidly stabilize the markets, especially after Trichet’s comment at the most recent press conference “Donot underestimate the euro zone“.
8/9/2019 JUL 16 UniCredit Friday Notes
http://slidepdf.com/reader/full/jul-16-unicredit-friday-notes 21/32
16 July 2010 Economics & FI/FX Research
Friday Notes
UniCredit Research page 21 See last pages for disclaimer.
Strategy
In the outlook for 3Q10 last week, we recommended a
moderately long duration. This is still our preference lookingto the end of September. For the coming one or two weeks,we would, however, temporarily "immunize" the active duration.
Michael Rottmann (UniCredit Bank)+49 89 378 [email protected]
8/9/2019 JUL 16 UniCredit Friday Notes
http://slidepdf.com/reader/full/jul-16-unicredit-friday-notes 22/32
16 July 2010 Economics & FI/FX Research
Friday Notes
UniCredit Research page 22 See last pages for disclaimer.
Forex Outlook
■ View: The USD might still remain under siege due to Fedspeeches and economic data during the next week.
■ EUR: The EUR is still on a bullish trend, but is in desperateneed of rising equities, while risk of friendly fire from theEU bank stress test is non-negligible.
■ GBP: If risk appetite holds up well, next week’s UK datareleases should again prove rather sterling-positive.
USD to still remain under siege
The corporate earnings season kicked off very well in the US
and the consequent easing of equity volatility contributed aswell to generate stronger risk momentum in FX. Accordingly,the classical defensive currencies, the CHF and the JPY, lostsome ground, before, however, recovering towards the endof the week when markets became more worried about theextent of the USD weakness. Indeed, in the end, it was againmainly the USD which weakened against other FX majors,following downbeat US data and the dovish FOMC minutespublished this week. In Europe, the reduced liquidity needsof the EMU banking sector, as emerged from this week’sECB tender operations, has added to the positive picture andthe market currently is characterized as well by a rather
benevolent assessment of the EU bank stress test.
The positive market sentiment surrounding the stress test isbound to prevail at least until the disclosure of the first resultson a country-by-country basis on July 23. However, as marketchatter already conjectures about which banks have performedin the stress test in a certain manner, notwithstanding thefact that speculation on the details and on the methodologiesapplied are still ongoing, there seems to be some inconsistencyin the current benevolent assessment of the stress test,which could be a potential factor of market uncertainty, once thebank-by-bank results will be published at the beginning of August.
Next week, however, the risk picture should still continue toremain shaped mainly by the full unfolding of the US corporateearnings season, US data releases mainly referring to thehousing market and the Fed’s Bernanke semi-annual testimonyin Congress. A further weakening in the US housing marketcombined with a very cautious outlook on the US economyby Bernanke should again keep the CHF and the JPY on bidand the USD on offer.
EUR-USD: bullish but addicted to risk
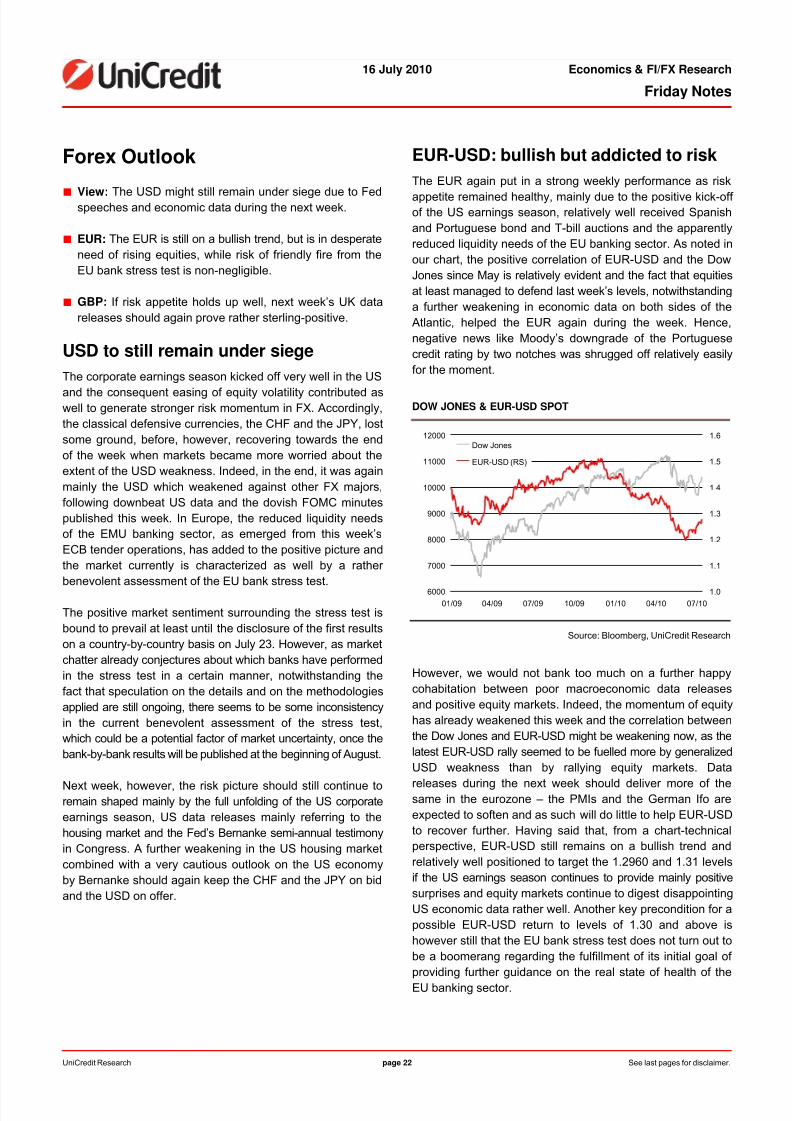
The EUR again put in a strong weekly performance as risk
appetite remained healthy, mainly due to the positive kick-off of the US earnings season, relatively well received Spanishand Portuguese bond and T-bill auctions and the apparentlyreduced liquidity needs of the EU banking sector. As noted inour chart, the positive correlation of EUR-USD and the DowJones since May is relatively evident and the fact that equitiesat least managed to defend last week’s levels, notwithstandinga further weakening in economic data on both sides of theAtlantic, helped the EUR again during the week. Hence,negative news like Moody’s downgrade of the Portuguesecredit rating by two notches was shrugged off relatively easilyfor the moment.
DOW JONES & EUR-USD SPOT
6000
7000
8000
9000
10000
11000
12000
01/09 04/09 07/09 10/09 01/10 04/10 07/10
1.0
1.1
1.2
1.3
1.4
1.5
1.6
Dow Jones
EUR-USD (RS)
Source: Bloomberg, UniCredit Research
However, we would not bank too much on a further happycohabitation between poor macroeconomic data releasesand positive equity markets. Indeed, the momentum of equityhas already weakened this week and the correlation betweenthe Dow Jones and EUR-USD might be weakening now, as thelatest EUR-USD rally seemed to be fuelled more by generalizedUSD weakness than by rallying equity markets. Data
releases during the next week should deliver more of thesame in the eurozone – the PMIs and the German Ifo areexpected to soften and as such will do little to help EUR-USDto recover further. Having said that, from a chart-technicalperspective, EUR-USD still remains on a bullish trend andrelatively well positioned to target the 1.2960 and 1.31 levelsif the US earnings season continues to provide mainly positivesurprises and equity markets continue to digest disappointingUS economic data rather well. Another key precondition for apossible EUR-USD return to levels of 1.30 and above ishowever still that the EU bank stress test does not turn out tobe a boomerang regarding the fulfillment of its initial goal of
providing further guidance on the real state of health of theEU banking sector.
8/9/2019 JUL 16 UniCredit Friday Notes
http://slidepdf.com/reader/full/jul-16-unicredit-friday-notes 23/32
16 July 2010 Economics & FI/FX Research
Friday Notes
UniCredit Research page 23 See last pages for disclaimer.
GBP: firm UK data to help again
Sterling again strengthened amid strong inflation and core
inflation readings, as well as a declining jobless numbers andgood risk appetite. Regarding BoE speakers Miles and Sentance,the market preferred Sentence’s hawkish position on rates,contributing to a GBP-USD rise to 1.54 from 1.5050 at theend of last week, while EUR-GBP range-traded in the 0.83-0.84band as the positive sterling momentum was matched by thesingle currency’s own strength.
Next week, sterling will still be mainly under the influence of UK data and BoE events. The BoE minutes will show howthe monetary policy stance of the MPC’s members couldhave changed following the strong budget cuts inherent to
the June 22 emergency budget. As such, the minutes couldslow down the cable rally if BoE members should have seen seestrong repercussions of the budget cuts on the monetary policystance. On the other hand, the retail sales release and thefirst estimate of 2Q GDP should prove rather sterling-positive.This week’s strong cable rally might represent as well somedanger for a temporary pullback, but we still favor cablehigher in the medium term. The 15D moving average hasnow breached the 60D and the 100D moving averages and abreak above the key resistance level at 1.5525 would sendout another bullish signal and bring the 200D line at 1.56 onthe radar screen.
Dr. Stephan Maier (UniCredit Bank Milan)+39 02 8862 [email protected]
8/9/2019 JUL 16 UniCredit Friday Notes
http://slidepdf.com/reader/full/jul-16-unicredit-friday-notes 24/32
16 July 2010 Economics & FI/FX Research
Friday Notes
UniCredit Research page 24 See last pages for disclaimer.
CIB View – Our Global Picture
Global economy■ The Great Recession has run its course last autumn. Realworldwide GDP growth even accelerated in 4Q09. Andmost economic indicators still point north. It is, however,so far no more than a technical rebound after the precedingeconomic collapse that is already facing the threat of another setback during 2H10 before economic growth shouldre-accelerate in the course of next year.
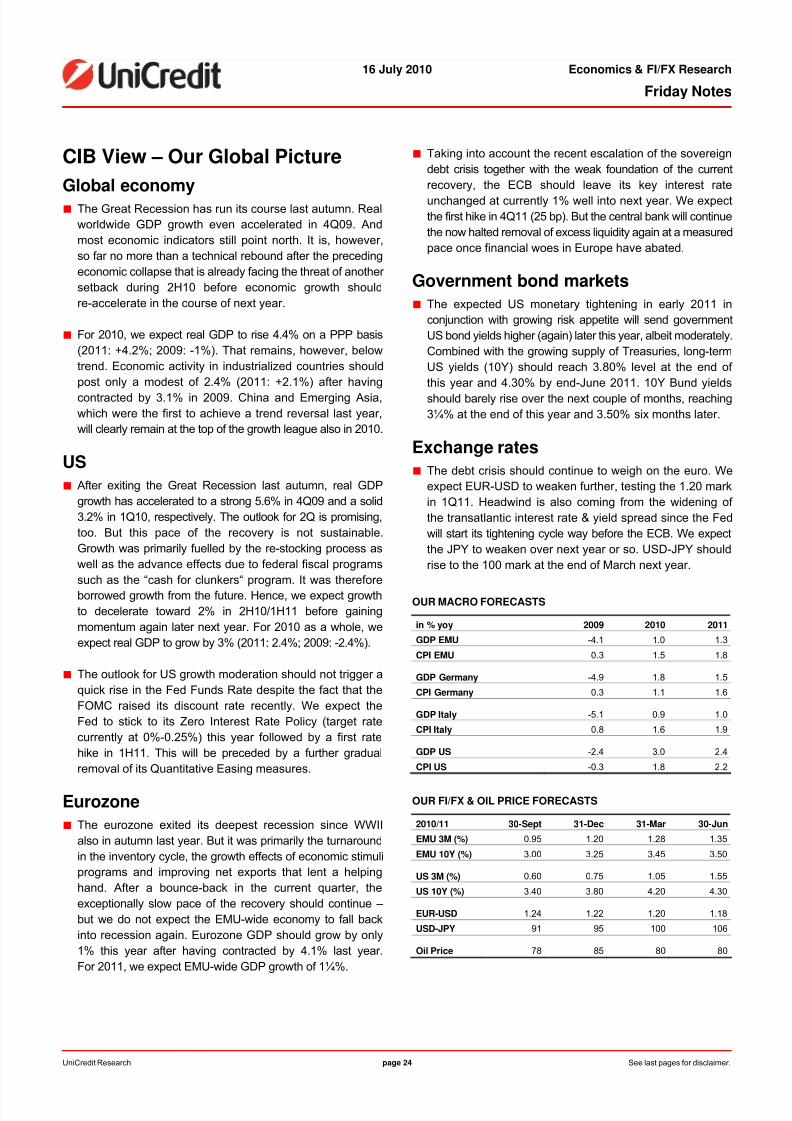
■ For 2010, we expect real GDP to rise 4.4% on a PPP basis(2011: +4.2%; 2009: -1%). That remains, however, belowtrend. Economic activity in industrialized countries shouldpost only a modest of 2.4% (2011: +2.1%) after havingcontracted by 3.1% in 2009. China and Emerging Asia,which were the first to achieve a trend reversal last year,will clearly remain at the top of the growth league also in 2010.
US
■ After exiting the Great Recession last autumn, real GDPgrowth has accelerated to a strong 5.6% in 4Q09 and a solid3.2% in 1Q10, respectively. The outlook for 2Q is promising,too. But this pace of the recovery is not sustainable.Growth was primarily fuelled by the re-stocking process aswell as the advance effects due to federal fiscal programs
such as the “cash for clunkers“ program. It was thereforeborrowed growth from the future. Hence, we expect growthto decelerate toward 2% in 2H10/1H11 before gainingmomentum again later next year. For 2010 as a whole, weexpect real GDP to grow by 3% (2011: 2.4%; 2009: -2.4%).
■ The outlook for US growth moderation should not trigger aquick rise in the Fed Funds Rate despite the fact that theFOMC raised its discount rate recently. We expect theFed to stick to its Zero Interest Rate Policy (target ratecurrently at 0%-0.25%) this year followed by a first ratehike in 1H11. This will be preceded by a further gradualremoval of its Quantitative Easing measures.
Eurozone
■ The eurozone exited its deepest recession since WWIIalso in autumn last year. But it was primarily the turnaroundin the inventory cycle, the growth effects of economic stimuliprograms and improving net exports that lent a helpinghand. After a bounce-back in the current quarter, theexceptionally slow pace of the recovery should continue –but we do not expect the EMU-wide economy to fall backinto recession again. Eurozone GDP should grow by only1% this year after having contracted by 4.1% last year.For 2011, we expect EMU-wide GDP growth of 1¼%.
■ Taking into account the recent escalation of the sovereigndebt crisis together with the weak foundation of the currentrecovery, the ECB should leave its key interest rate
unchanged at currently 1% well into next year. We expectthe first hike in 4Q11 (25 bp). But the central bank will continuethe now halted removal of excess liquidity again at a measuredpace once financial woes in Europe have abated.
Government bond markets
■ The expected US monetary tightening in early 2011 inconjunction with growing risk appetite will send governmentUS bond yields higher (again) later this year, albeit moderately.Combined with the growing supply of Treasuries, long-termUS yields (10Y) should reach 3.80% level at the end of this year and 4.30% by end-June 2011. 10Y Bund yieldsshould barely rise over the next couple of months, reaching3¼% at the end of this year and 3.50% six months later.
Exchange rates
■ The debt crisis should continue to weigh on the euro. Weexpect EUR-USD to weaken further, testing the 1.20 markin 1Q11. Headwind is also coming from the widening of the transatlantic interest rate & yield spread since the Fedwill start its tightening cycle way before the ECB. We expectthe JPY to weaken over next year or so. USD-JPY shouldrise to the 100 mark at the end of March next year.
OUR MACRO FORECASTS
in % yoy 2009 2010 2011
GDP EMU -4.1 1.0 1.3
CPI EMU 0.3 1.5 1.8
GDP Germany -4.9 1.8 1.5
CPI Germany 0.3 1.1 1.6
GDP Italy -5.1 0.9 1.0
CPI Italy 0.8 1.6 1.9
GDP US -2.4 3.0 2.4
CPI US -0.3 1.8 2.2
OUR FI/FX & OIL PRICE FORECASTS
2010/11 30-Sept 31-Dec 31-Mar 30-Jun
EMU 3M (%) 0.95 1.20 1.28 1.35
EMU 10Y (%) 3.00 3.25 3.45 3.50
US 3M (%) 0.60 0.75 1.05 1.55
US 10Y (%) 3.40 3.80 4.20 4.30
EUR-USD 1.24 1.22 1.20 1.18
USD-JPY 91 95 100 106
Oil Price 78 85 80 80
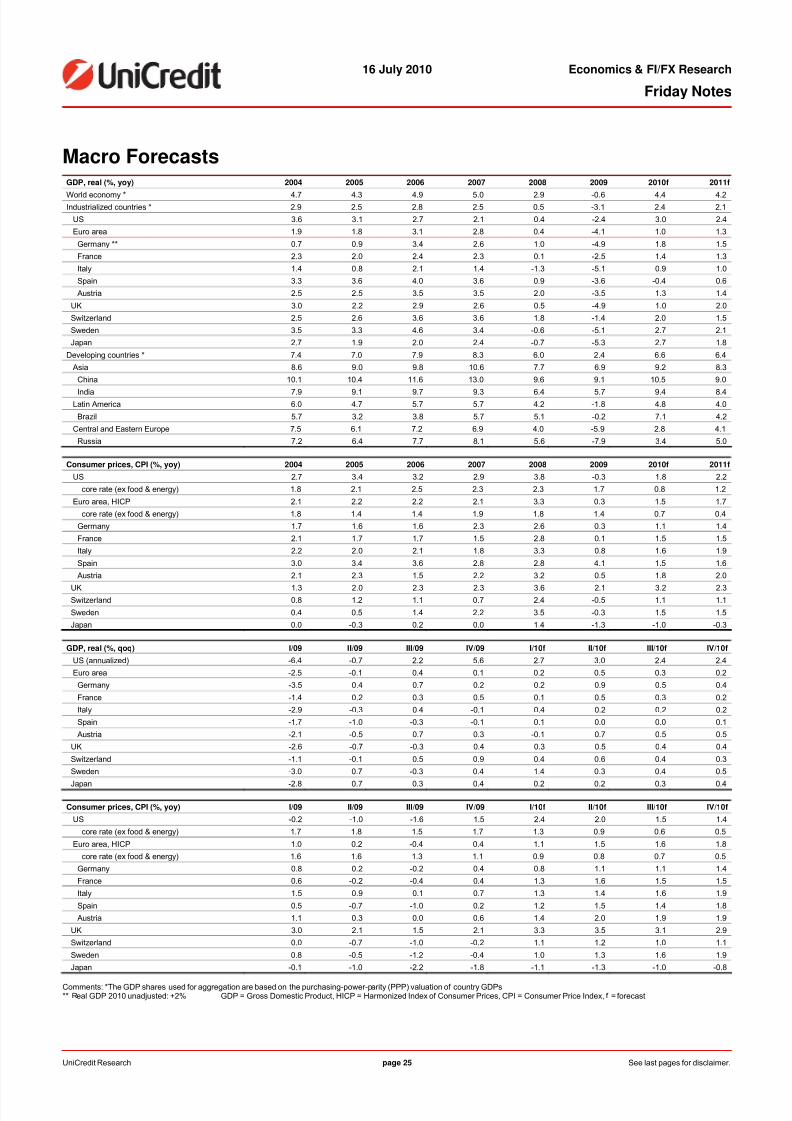
8/9/2019 JUL 16 UniCredit Friday Notes
http://slidepdf.com/reader/full/jul-16-unicredit-friday-notes 25/32
16 July 2010 Economics & FI/FX Research
Friday Notes
UniCredit Research page 25 See last pages for disclaimer.
Macro ForecastsGDP, real (%, yoy) 2004 2005 2006 2007 2008 2009 2010f 2011f
World economy * 4.7 4.3 4.9 5.0 2.9 -0.6 4.4 4.2Industrialized countries * 2.9 2.5 2.8 2.5 0.5 -3.1 2.4 2.1
US 3.6 3.1 2.7 2.1 0.4 -2.4 3.0 2.4
Euro area 1.9 1.8 3.1 2.8 0.4 -4.1 1.0 1.3
Germany ** 0.7 0.9 3.4 2.6 1.0 -4.9 1.8 1.5
France 2.3 2.0 2.4 2.3 0.1 -2.5 1.4 1.3
Italy 1.4 0.8 2.1 1.4 -1.3 -5.1 0.9 1.0
Spain 3.3 3.6 4.0 3.6 0.9 -3.6 -0.4 0.6
Austria 2.5 2.5 3.5 3.5 2.0 -3.5 1.3 1.4
UK 3.0 2.2 2.9 2.6 0.5 -4.9 1.0 2.0
Switzerland 2.5 2.6 3.6 3.6 1.8 -1.4 2.0 1.5
Sweden 3.5 3.3 4.6 3.4 -0.6 -5.1 2.7 2.1
Japan 2.7 1.9 2.0 2.4 -0.7 -5.3 2.7 1.8
Developing countries * 7.4 7.0 7.9 8.3 6.0 2.4 6.6 6.4
Asia 8.6 9.0 9.8 10.6 7.7 6.9 9.2 8.3
China 10.1 10.4 11.6 13.0 9.6 9.1 10.5 9.0
India 7.9 9.1 9.7 9.3 6.4 5.7 9.4 8.4Latin America 6.0 4.7 5.7 5.7 4.2 -1.8 4.8 4.0
Brazil 5.7 3.2 3.8 5.7 5.1 -0.2 7.1 4.2
Central and Eastern Europe 7.5 6.1 7.2 6.9 4.0 -5.9 2.8 4.1
Russia 7.2 6.4 7.7 8.1 5.6 -7.9 3.4 5.0
Consumer prices, CPI (%, yoy) 2004 2005 2006 2007 2008 2009 2010f 2011f
US 2.7 3.4 3.2 2.9 3.8 -0.3 1.8 2.2
core rate (ex food & energy) 1.8 2.1 2.5 2.3 2.3 1.7 0.8 1.2
Euro area, HICP 2.1 2.2 2.2 2.1 3.3 0.3 1.5 1.7
core rate (ex food & energy) 1.8 1.4 1.4 1.9 1.8 1.4 0.7 0.4
Germany 1.7 1.6 1.6 2.3 2.6 0.3 1.1 1.4
France 2.1 1.7 1.7 1.5 2.8 0.1 1.5 1.5
Italy 2.2 2.0 2.1 1.8 3.3 0.8 1.6 1.9
Spain 3.0 3.4 3.6 2.8 2.8 4.1 1.5 1.6
Austria 2.1 2.3 1.5 2.2 3.2 0.5 1.8 2.0
UK 1.3 2.0 2.3 2.3 3.6 2.1 3.2 2.3
Switzerland 0.8 1.2 1.1 0.7 2.4 -0.5 1.1 1.1
Sweden 0.4 0.5 1.4 2.2 3.5 -0.3 1.5 1.5
Japan 0.0 -0.3 0.2 0.0 1.4 -1.3 -1.0 -0.3
GDP, real (%, qoq) I/09 II/09 III/09 IV/09 I/10f II/10f III/10f IV/10f
US (annualized) -6.4 -0.7 2.2 5.6 2.7 3.0 2.4 2.4
Euro area -2.5 -0.1 0.4 0.1 0.2 0.5 0.3 0.2
Germany -3.5 0.4 0.7 0.2 0.2 0.9 0.5 0.4
France -1.4 0.2 0.3 0.5 0.1 0.5 0.3 0.2
Italy -2.9 -0.3 0.4 -0.1 0.4 0.2 0.2 0.2
Spain -1.7 -1.0 -0.3 -0.1 0.1 0.0 0.0 0.1
Austria -2.1 -0.5 0.7 0.3 -0.1 0.7 0.5 0.5
UK -2.6 -0.7 -0.3 0.4 0.3 0.5 0.4 0.4
Switzerland -1.1 -0.1 0.5 0.9 0.4 0.6 0.4 0.3
Sweden -3.0 0.7 -0.3 0.4 1.4 0.3 0.4 0.5
Japan -2.8 0.7 0.3 0.4 0.2 0.2 0.3 0.4
Consumer prices, CPI (%, yoy) I/09 II/09 III/09 IV/09 I/10f II/10f III/10f IV/10f
US -0.2 -1.0 -1.6 1.5 2.4 2.0 1.5 1.4
core rate (ex food & energy) 1.7 1.8 1.5 1.7 1.3 0.9 0.6 0.5
Euro area, HICP 1.0 0.2 -0.4 0.4 1.1 1.5 1.6 1.8
core rate (ex food & energy) 1.6 1.6 1.3 1.1 0.9 0.8 0.7 0.5
Germany 0.8 0.2 -0.2 0.4 0.8 1.1 1.1 1.4
France 0.6 -0.2 -0.4 0.4 1.3 1.6 1.5 1.5
Italy 1.5 0.9 0.1 0.7 1.3 1.4 1.6 1.9
Spain 0.5 -0.7 -1.0 0.2 1.2 1.5 1.4 1.8
Austria 1.1 0.3 0.0 0.6 1.4 2.0 1.9 1.9
UK 3.0 2.1 1.5 2.1 3.3 3.5 3.1 2.9
Switzerland 0.0 -0.7 -1.0 -0.2 1.1 1.2 1.0 1.1
Sweden 0.8 -0.5 -1.2 -0.4 1.0 1.3 1.6 1.9
Japan -0.1 -1.0 -2.2 -1.8 -1.1 -1.3 -1.0 -0.8
Comments: *The GDP shares used for aggregation are based on the purchasing-power-parity (PPP) valuation of country GDPs** Real GDP 2010 unadjusted: +2% GDP = Gross Domestic Product, HICP = Harmonized Index of Consumer Prices, CPI = Consumer Price Index, f = forecast

8/9/2019 JUL 16 UniCredit Friday Notes
http://slidepdf.com/reader/full/jul-16-unicredit-friday-notes 26/32
16 July 2010 Economics & FI/FX Research
Friday Notes
UniCredit Research page 26 See last pages for disclaimer.
Interest & Exchange Rate Forecasts (I)
INTEREST RATE FORECASTS (%, END QUARTER)2010/11 current end-Q3 end-Q4 end-Q1 end-Q2
Eurozone bond market
Refi rate 1.00 1.00 1.00 1.00 1.00
3M Euribor 0.85 0.95 1.20 1.28 1.35
2Y 0.80 0.85 1.05 1.15 1.30
5Y 1.64 1.83 2.10 2.30 2.40
10Y 2.66 3.00 3.25 3.45 3.50
30Y 3.32 3.60 3.80 3.95 4.00
10Y swap spread (in bp) 24 25 25 25 20
US Treasury Market
Fed funds target rate 0.13 0.25 0.25 0.75 1.25
3M USD Libor 0.52 0.60 0.75 1.05 1.55
2Y 0.59 0.85 1.30 2.00 2.40
5Y 1.74 2.11 2.55 3.15 3.45
10Y 2.97 3.40 3.80 4.20 4.30
30Y 3.97 4.25 4.60 4.70 4.75
10Y swap spread (in bp) 1 10 15 20 20
Japan
Target rate 0.10 0.10 0.10 0.10 0.10
3M JPY Libor 0.24 0.30 0.35 0.40 0.40
10Y JGB 1.10 1.40 1.50 1.60 1.65
United Kingdom
Repo rate 0.50 0.50 1.00 1.50 2.00
3M GBP Libor 0.73 0.80 1.10 1.80 2.30
10Y Gilt 3.36 3.80 4.30 4.50 4.70
Switzerland
3M CHF Libor mid target rate 0.25 0.25 0.25 0.50 0.75
3M CHF Libor 0.12 0.10 0.30 0.60 0.85
10Y Swissie 1.43 2.00 2.25 2.45 2.35
EXCHANGE RATE FORECASTS (END QUARTER)
2010/11 current end-Q3 end-Q4 end-Q1 end-Q2
EUR-USD 1.2930 1.24 1.22 1.20 1.18
EUR-JPY 112.63 113 116 120 125
EUR-GBP 0.8383 0.82 0.78 0.75 0.72
EUR-CHF 1.3477 1.29 1.27 1.30 1.33
USD-JPY 87.11 91 95 100 106
GBP-USD 1.5424 1.52 1.57 1.60 1.63
USD-CHF 1.0423 1.04 1.04 1.08 1.13
COMMODITY PRICE FORECASTS
2010/11 current end-Q3 end-Q4 end-Q1 end-Q2
Oil price (Brent, USD/b) 75.95 78 85 80 80
DJ commodity price index 258.86 290 310 310 310
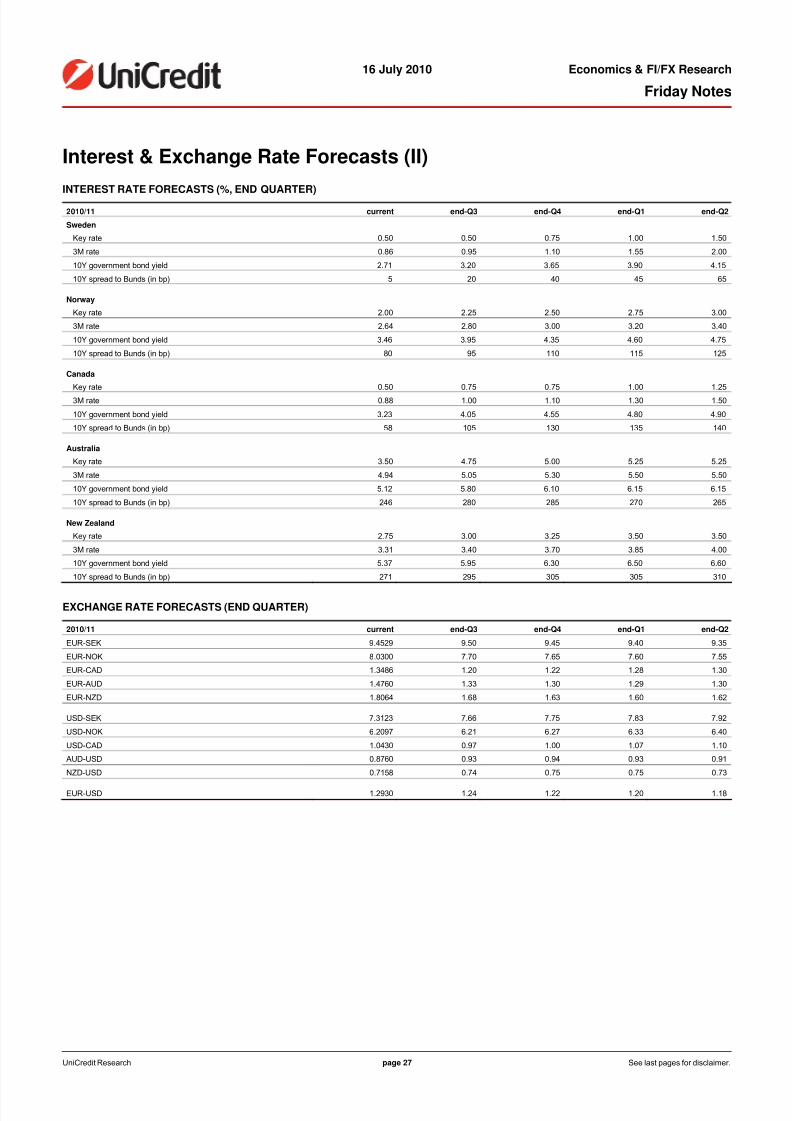
8/9/2019 JUL 16 UniCredit Friday Notes
http://slidepdf.com/reader/full/jul-16-unicredit-friday-notes 27/32
16 July 2010 Economics & FI/FX Research
Friday Notes
UniCredit Research page 27 See last pages for disclaimer.
Interest & Exchange Rate Forecasts (II)
INTEREST RATE FORECASTS (%, END QUARTER)2010/11 current end-Q3 end-Q4 end-Q1 end-Q2
Sweden
Key rate 0.50 0.50 0.75 1.00 1.50
3M rate 0.86 0.95 1.10 1.55 2.00
10Y government bond yield 2.71 3.20 3.65 3.90 4.15
10Y spread to Bunds (in bp) 5 20 40 45 65
Norway
Key rate 2.00 2.25 2.50 2.75 3.00
3M rate 2.64 2.80 3.00 3.20 3.40
10Y government bond yield 3.46 3.95 4.35 4.60 4.75
10Y spread to Bunds (in bp) 80 95 110 115 125
Canada
Key rate 0.50 0.75 0.75 1.00 1.253M rate 0.88 1.00 1.10 1.30 1.50
10Y government bond yield 3.23 4.05 4.55 4.80 4.90
10Y spread to Bunds (in bp) 58 105 130 135 140
Australia
Key rate 3.50 4.75 5.00 5.25 5.25
3M rate 4.94 5.05 5.30 5.50 5.50
10Y government bond yield 5.12 5.80 6.10 6.15 6.15
10Y spread to Bunds (in bp) 246 280 285 270 265
New Zealand
Key rate 2.75 3.00 3.25 3.50 3.50
3M rate 3.31 3.40 3.70 3.85 4.00
10Y government bond yield 5.37 5.95 6.30 6.50 6.60
10Y spread to Bunds (in bp) 271 295 305 305 310
EXCHANGE RATE FORECASTS (END QUARTER)
2010/11 current end-Q3 end-Q4 end-Q1 end-Q2
EUR-SEK 9.4529 9.50 9.45 9.40 9.35
EUR-NOK 8.0300 7.70 7.65 7.60 7.55
EUR-CAD 1.3486 1.20 1.22 1.28 1.30
EUR-AUD 1.4760 1.33 1.30 1.29 1.30
EUR-NZD 1.8064 1.68 1.63 1.60 1.62
USD-SEK 7.3123 7.66 7.75 7.83 7.92
USD-NOK 6.2097 6.21 6.27 6.33 6.40
USD-CAD 1.0430 0.97 1.00 1.07 1.10
AUD-USD 0.8760 0.93 0.94 0.93 0.91
NZD-USD 0.7158 0.74 0.75 0.75 0.73
EUR-USD 1.2930 1.24 1.22 1.20 1.18
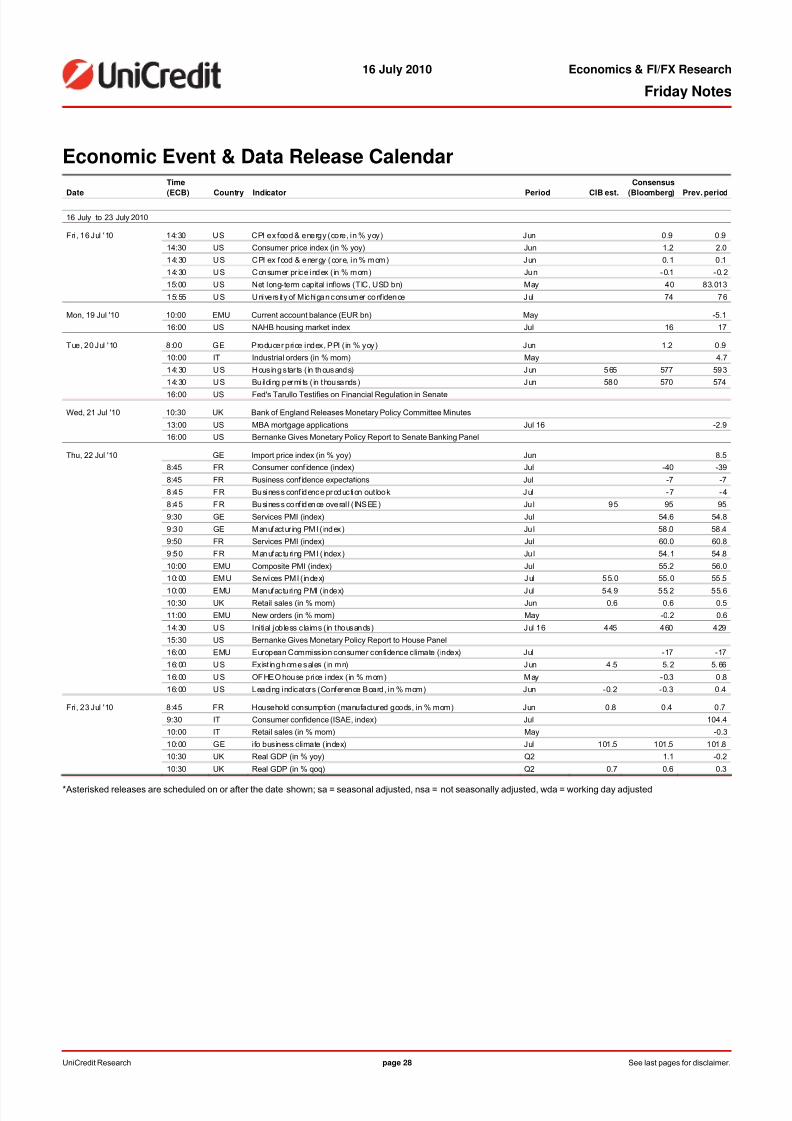
8/9/2019 JUL 16 UniCredit Friday Notes
http://slidepdf.com/reader/full/jul-16-unicredit-friday-notes 28/32
16 July 2010 Economics & FI/FX Research
Friday Notes
UniCredit Research page 28 See last pages for disclaimer.
Economic Event & Data Release CalendarTime Consensus
Date (ECB) Country Indicator Period CIB est. (Bloomberg) Prev. period
16 July to 23 July 2010
Fri, 16 Jul '10 14:30 US CPI ex food & energy (core, in % yoy) Jun 0.9 0.9
14:30 US Consumer price index (in % yoy) Jun 1.2 2.0
14:30 US CPI ex food & energy (core, in % mom) Jun 0.1 0.1
14:30 US Consumer pr ice index ( in % mom) Jun -0.1 -0.2
15:00 US Net long-term capital inflows (TIC, USD bn) May 40 83.013
15:55 US Univers ity of Michigan consumer conf idence Jul 74 76
Mon, 19 Jul '10 10:00 EMU Current account balance (EUR bn) May -5.1
16:00 US NAHB housing market index Jul 16 17
Tue, 20 Jul '10 8:00 GE Producer price index, PPI (in % yoy) Jun 1.2 0.9
10:00 IT Industrial orders (in % mom) May 4.7
14:30 US Housing star ts ( in thousands) Jun 565 577 593
14:30 US Bu ilding permits ( in thousands) Jun 580 570 574
16:00 US Fed's Tarullo Testifies on Financial Regulation in Senate
Wed, 21 Jul '10 10:30 UK Bank of England Releases Monetary Policy Committee Minutes
13:00 US MBA mortgage applications Jul 16 -2.9
16:00 US Bernanke Gives Monetary Policy Report to Senate Banking Panel
Thu, 22 Jul '10 GE Import price index (in % yoy) Jun 8.5
8:45 FR Consumer conf idence (index) Jul -40 -39
8:45 FR Business conf idence expectations Jul -7 -7
8:45 FR Business conf idence production out look Jul -7 -4
8:45 FR Business conf idence overal l ( INSEE) Ju l 95 95 95
9:30 GE Services PMI (index) Jul 54.6 54.8
9:30 GE Manufactur ing PMI ( index) Ju l 58 .0 58.4
9:50 FR Services PMI (index) Jul 60.0 60.8
9:50 FR Manufacturing PMI ( index) Ju l 54.1 54.8
10:00 EMU Composite PMI (index) Jul 55.2 56.0
10:00 EMU Services PMI ( index) Jul 55.0 55.0 55.5
10:00 EMU Manufacturing PMI (index) Jul 54.9 55.2 55.6
10:30 UK Retail sales (in % mom) Jun 0.6 0.6 0.5
11:00 EMU New orders (in % mom) May -0.2 0.6
14:30 US Initial jobless claims (in thousands) Jul 16 445 460 429
15:30 US Bernanke Gives Monetary Policy Report to House Panel
16:00 EMU European Commission consumer confidence climate (index) Jul -17 -17
16:00 US Exist ing home sales ( in mn) Jun 4 .5 5.2 5.66
16:00 US OFHEO house price index ( in % mom) May -0.3 0.8
16:00 US Leading indicators (Conference Board, in % mom) Jun -0.2 -0.3 0.4
Fri, 23 Jul '10 8:45 FR Household consumption (manufactured goods, in % mom) Jun 0.8 0.4 0.7
9:30 IT Consumer confidence (ISAE, index) Jul 104.4
10:00 IT Retail sales (in % mom) May -0.3
10:00 GE ifo business climate (index) Jul 101.5 101.5 101.8
10:30 UK Real GDP (in % yoy) Q2 1.1 -0.2
10:30 UK Real GDP (in % qoq) Q2 0.7 0.6 0.3
*Asterisked releases are scheduled on or after the date shown; sa = seasonal adjusted, nsa = not seasonally adjusted, wda = working day adjusted
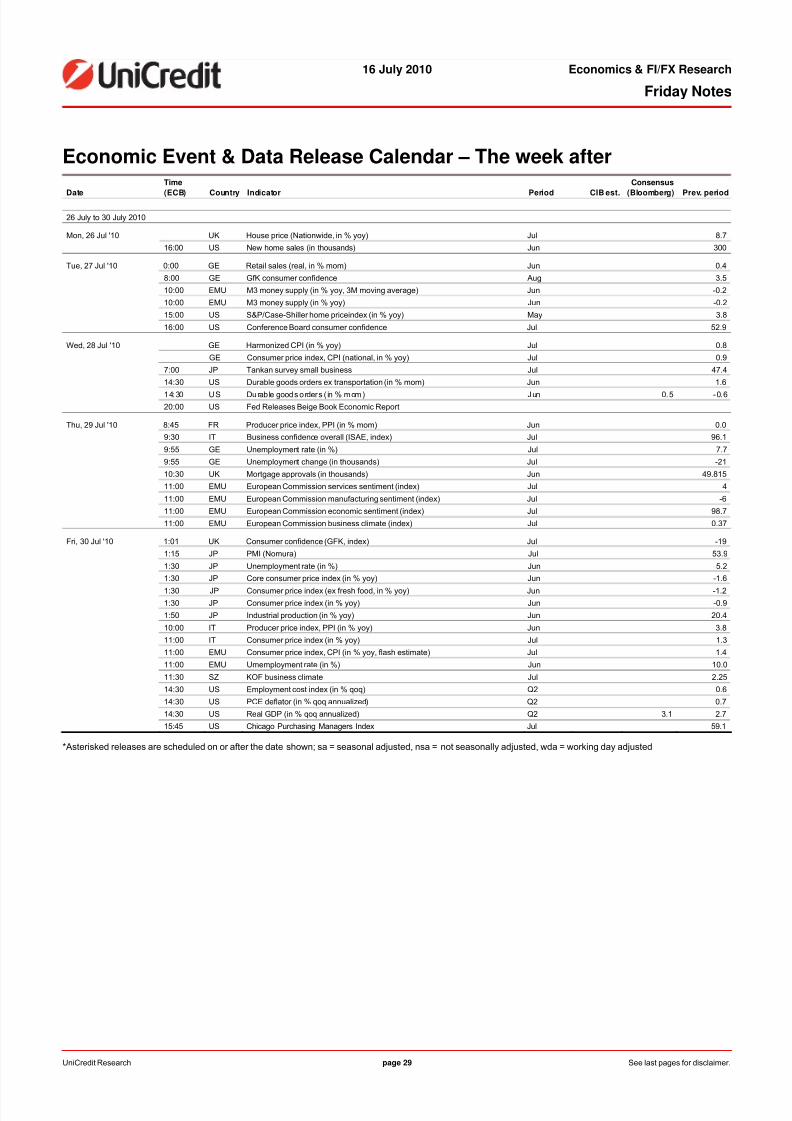
8/9/2019 JUL 16 UniCredit Friday Notes
http://slidepdf.com/reader/full/jul-16-unicredit-friday-notes 29/32
16 July 2010 Economics & FI/FX Research
Friday Notes
UniCredit Research page 29 See last pages for disclaimer.
Economic Event & Data Release Calendar – The week afterTime Consensus
Date (ECB) Country Indicator Period CIB est. (Bloomberg) Prev. period
26 July to 30 July 2010
Mon, 26 Jul '10 UK House price (Nationwide, in % yoy) Jul 8.7
16:00 US New home sales (in thousands) Jun 300
Tue, 27 Jul '10 0:00 GE Retail sales (real, in % mom) Jun 0.4
8:00 GE GfK consumer confidence Aug 3.5
10:00 EMU M3 money supply (in % yoy, 3M moving average) Jun -0.2
10:00 EMU M3 money supply (in % yoy) Jun -0.2
15:00 US S&P/Case-Shiller home priceindex (in % yoy) May 3.8
16:00 US Conference Board consumer confidence Jul 52.9
Wed, 28 Jul '10 GE Harmonized CPI (in % yoy) Jul 0.8
GE Consumer price index, CPI (national, in % yoy) Jul 0.9
7:00 JP Tankan survey small business Jul 47.4
14:30 US Durable goods orders ex transportation (in % mom) Jun 1.6
14:30 US Durab le goods orders ( in % mom) Jun 0.5 -0.6
20:00 US Fed Releases Beige Book Economic Report
Thu, 29 Jul '10 8:45 FR Producer price index, PPI (in % mom) Jun 0.0
9:30 IT Business confidence overall (ISAE, index) Jul 96.1
9:55 GE Unemployment rate (in %) Jul 7.7
9:55 GE Unemployment change (in thousands) Jul -21
10:30 UK Mortgage approvals (in thousands) Jun 49.815
11:00 EMU European Commission services sentiment (index) Jul 4
11:00 EMU European Commission manufacturing sentiment (index) Jul -6
11:00 EMU European Commission economic sentiment (index) Jul 98.7
11:00 EMU European Commission business climate (index) Jul 0.37
Fri, 30 Jul '10 1:01 UK Consumer confidence (GFK, index) Jul -19
1:15 JP PMI (Nomura) Jul 53.9
1:30 JP Unemployment rate (in %) Jun 5.2
1:30 JP Core consumer price index (in % yoy) Jun -1.6
1:30 JP Consumer price index (ex fresh food, in % yoy) Jun -1.2
1:30 JP Consumer price index (in % yoy) Jun -0.9
1:50 JP Industrial production (in % yoy) Jun 20.4
10:00 IT Producer price index, PPI (in % yoy) Jun 3.8
11:00 IT Consumer price index (in % yoy) Jul 1.3
11:00 EMU Consumer price index, CPI (in % yoy, flash estimate) Jul 1.4
11:00 EMU Umemployment rate (in %) Jun 10.0
11:30 SZ KOF business climate Jul 2.25
14:30 US Employment cost index (in % qoq) Q2 0.6
14:30 US PCE deflator (in % qoq annualized) Q2 0.7
14:30 US Real GDP (in % qoq annualized) Q2 3.1 2.7
15:45 US Chicago Purchasing Managers Index Jul 59.1
*Asterisked releases are scheduled on or after the date shown; sa = seasonal adjusted, nsa = not seasonally adjusted, wda = working day adjusted

8/9/2019 JUL 16 UniCredit Friday Notes
http://slidepdf.com/reader/full/jul-16-unicredit-friday-notes 30/32
16 July 2010 Economics & FI/FX Research
Friday Notes
UniCredit Research page 30
Disclaimer
Our recommendations are based on information obtained from, or are based upon public information sources that we consider to be reliable but for the completeness and accu-racy of which we assume no liability. All estimates and opinions included in the report represent the independent judgment of the analysts as of the date of the issue. We reserve the right
to modify the views expressed herein at any time without notice. Moreover, we reserve the right not to update this information or to discontinue it altogether without notice.This analysis is for information purposes only and (i) does not constitute or form part of any offer for sale or subscription of or solicitation of any offer to buy or subscribe for anyfinancial, money market or investment instrument or any security, (ii) is neither intended as such an offer for sale or subscription of or solicitation of an offer to buy or subscribefor any financial, money market or investment instrument or any security nor (iii) as an advertisement thereof. The investment possibilities discussed in this report may not besuitable for certain investors depending on their specific investment objectives and time horizon or in the context of their overall financial situation. The investments discussedmay fluctuate in price or value. Investors may get back less than they invested. Changes in rates of exchange may have an adverse effect on the value of investments. Further-more, past performance is not necessarily indicative of future results. In particular, the risks associated with an investment in the financial, money market or investment instru-ment or security under discussion are not explained in their entirety.
This information is given without any warranty on an "as is" basis and should not be regarded as a substitute for obtaining individual advice. Investors must make their own de-termination of the appropriateness of an investment in any instruments referred to herein based on the merits and risks involved, their own investment strategy and their legal,fiscal and financial position. As this document does not qualify as an investment recommendation or as a direct investment recommendation, neither this document nor any partof it shall form the basis of, or be relied on in connection with or act as an inducement to enter into, any contract or commitment whatsoever. Investors are urged to contact their bank's investment advisor for individual explanations and advice.
Neither UniCredit Bank AG, UniCredit Bank AG London Branch, UniCredit Bank AG Vienna Branch, UniCredit Bank AG Milan Branch, UniCredit Securities, UniCredit MenkulDeğerler A.Ş., UniCredit Bulbank, Zagrebačka banka, UniCredit Bank, Bank Pekao, Yapi Kredi, UniCredit Tiriac Bank, ATFBank nor any of their respective directors, officers or employees nor any other person accepts any liability whatsoever (in negligence or otherwise) for any loss howsoever arising from any use of this document or its contents or oth-erwise arising in connection therewith.
This analysis is being distributed by electronic and ordinary mail to professional investors, who are expected to make their own investment decisions without undue reliance onthis publication, and may not be redistributed, reproduced or published in whole or in part for any purpose.
Responsibility for the content of this publication lies with:
a) UniCredit Bank AG, Am Tucherpark 16, 80538 Munich, Germany, (also responsible for the distribution pursuant to §34b WpHG). The company belongs to UCI Group.Regulatory authority: “BaFin“ – Bundesanstalt für Finanzdienstleistungsaufsicht, Lurgiallee 12, 60439 Frankfurt, Germany.
b) UniCredit Bank AG London Branch, Moor House, 120 London Wall, London EC2Y 5ET, United Kingdom.Regulatory authority: “BaFin“ – Bundesanstalt für Finanzdienstleistungsaufsicht, Lurgiallee 12, 60439 Frankfurt, Germany and subject to limited regulation by the Financial Ser-vices Authority (FSA), 25 The North Colonnade, Canary Wharf, London E14 5HS, United Kingdom. Details about the extent of our regulation by the Financial Services Authorityare available from us on request.
c) UniCredit Bank AG Milan Branch, Via Tommaso Grossi 10, 20121 Milan, Italy, duly authorized by the Bank of Italy to provide investment services.Regulatory authority: “Bank of Italy”, Via Nazionale 91, 00184 Roma, Italy and Bundesanstalt für Finanzdienstleistungsaufsicht, Lurgiallee 12, 60439 Frankfurt, Germany.
d) UniCredit Bank AG Vienna Branch, Julius-Tandler-Platz 3, 1090 Vienna, AustriaRegulatory authority: Finanzmarktaufsichtsbehörde (FMA), Praterstrasse 23, 1020 Vienna, Austria and subject to limited regulation by the “BaFin“ – Bundesanstalt für Finanz-dienstleistungsaufsicht, Lurgiallee 12, 60439 Frankfurt, Germany. Details about the extent of our regulation by the Bundesanstalt für Finanzdienstleistungsaufsicht are availablefrom us on request.
e) UniCredit Securities, Boulevard Ring Office Building, 17/1 Chistoprudni Boulevard, Moscow 101000, RussiaRegulatory authority: Federal Service on Financial Markets, 9 Leninsky prospekt, Moscow 119991, Russia
f) UniCredit Menkul Değerler A.Ş., Büyükdere Cad. No. 195, Büyükdere Plaza Kat. 5, 34394 Levent, Istanbul, TurkeyRegulatory authority: Sermaye Piyasası Kurulu – Capital Markets Board of Turkey, Eskişehir Yolu 8.Km No:156, 06530 Ankara, Turkey
g) UniCredit Bulbank, Sveta Nedelya Sq. 7, BG-1000 Sofia, BulgariaRegulatory authority: Financial Supervision Commission (FSC), 33 Shar Planina str.,1303 Sofia, Bulgariah) Zagrebačka banka, Paromlinska 2, HR-10000 Zagreb, CroatiaRegulatory authority: Croatian Agency for Supervision of Financial Services, Miramarska 24B, 10000 Zagreb, Croatia
i) UniCredit Bank, Na Príkope 858/20, CZ-11121 Prague, Czech RepublicRegulatory authority: CNB Czech National Bank, Na Př íkopě 28, 115 03 Praha 1, Czech Republic
j) Bank Pekao, ul. Grzybowska 53/57, PL-00-950 Warsaw, PolandRegulatory authority: Polish Financial Supervision Authority, Plac Powstańców Warszawy 1, 00-950 Warsaw, Poland
k) UniCredit Bank, Prechistenskaya emb. 9, RF-19034 Moscow, RussiaRegulatory authority: Federal Service on Financial Markets, 9 Leninsky prospekt, Moscow 119991, Russia
l) UniCredit Bank, Šancova 1/A, SK-813 33 Bratislava, SlovakiaRegulatory authority: National Bank of Slovakia, Stefanikovo nam. 10/19, 967 01 Kremnica, Slovakia
m) Yapi Kredi, Yapi Kredi Plaza D Blok, Levent, TR-80620 Istanbul, TurkeyRegulatory authority: Sermaye Piyasası Kurulu – Capital Markets Board of Turkey, Eskişehir Yolu 8.Km No:156, 06530 Ankara, Turkey
n) UniCredit Tiriac Bank, Ghetarilor Street 23-25, RO-014106 Bucharest 1,RomaniaRegulatory authority: CNVM, Romanian National Securities Commission, Foişorului street, no.2, sector 3, Bucharest, Romania
o) ATFBank, 100 Furmanov Str., KZ-050000 Almaty, KazakhstanAgency of the Republic of Kazakhstan on the state regulation and supervision of financial market and financial organisations, 050000, Almaty, 67 Aiteke Bi str., Kazakhstan
POTENTIAL CONFLICTS OF INTEREST
UniCredit Bank AG acts as a Specialist or Primary Dealer in government bonds issued by the Italian, Portuguese and Greek Treasury. Main tasks of the Specialist are to partici-pate with continuity and efficiency to the governments' securities auctions, to contribute to the efficiency of the secondary market through market making activity and quoting re-quirements and to contribute to the management of public debt and to the debt issuance policy choices, also through advisory and research activities.
ANALYST DECLARATION
The author’s remuneration has not been, and will not be, geared to the recommendations or views expressed in this study, neither directly nor indirectly.
ORGANIZATIONAL AND ADMINISTRATIVE ARRANGEMENTS TO AVOID AND PREVENT CONFLICTS OF INTEREST
To prevent or remedy conflicts of interest, UniCredit Bank AG, UniCredit Bank AG London Branch, UniCredit Bank AG Vienna Branch, UniCredit Bank AG Milan Branch,UniCredit Securities, UniCredit Menkul Değerler A.Ş., UniCredit Bulbank, Zagrebačka banka, UniCredit Bank, Bank Pekao, Yapi Kredi, UniCredit Tiriac Bank, ATFBank have es-tablished the organizational arrangements required from a legal and supervisory aspect, adherence to which is monitored by its compliance department. Conflicts of interest aris-ing are managed by legal and physical and non-physical barriers (collectively referred to as “Chinese Walls”) designed to restrict the flow of information between onearea/department of UniCredit Bank AG, UniCredit Bank AG London Branch, UniCredit Bank AG Vienna Branch, UniCredit Bank AG Milan Branch, UniCredit Securities, UniCreditMenkul Değerler A.Ş., UniCredit Bulbank, Zagrebačka banka, UniCredit Bank, Bank Pekao, Yapi Kredi, UniCredit Tiriac Bank, ATFBank and another. In particular, InvestmentBanking units, including corporate finance, capital market activities, financial advisory and other capital raising activities, are segregated by physical and non-physical boundariesfrom Markets Units, as well as the research department. In the case of equities execution by UniCredit Bank AG Milan Branch, other than as a matter of client facilitation or deltahedging of OTC and listed derivative positions, there is no proprietary trading. Disclosure of publicly available conflicts of interest and other material interests is made in the re-search. Analysts are supervised and managed on a day-to-day basis by line managers who do not have responsibility for Investment Banking activities, including corporate fi-nance activities, or other activities other than the sale of securities to clients.

8/9/2019 JUL 16 UniCredit Friday Notes
http://slidepdf.com/reader/full/jul-16-unicredit-friday-notes 31/32
16 July 2010 Economics & FI/FX Research
Friday Notes
UniCredit Research page 31
ADDITIONAL REQUIRED DISCLOSURES UNDER THE LAWS AND REGULATIONS OF JURISDICTIONS INDICATED
Notice to Austrian investorsThis document does not constitute or form part of any offer for sale or subscription of or solicitation of any offer to buy or subscribe for any securities and neither this documentnor any part of it shall form the basis of, or be relied on in connection with or act as an inducement to enter into, any contract or commitment whatsoever.
This document is confidential and is being supplied to you solely for your information and may not be reproduced, redistributed or passed on to any other person or published, inwhole or part, for any purpose.
Notice to Czech investorsThis report is intended for clients of UniCredit Bank AG, UniCredit Bank AG London Branch, UniCredit Bank AG Vienna Branch, UniCredit Bank AG Milan Branch, UniCredit Se-curities, UniCredit Menkul Değerler A.Ş., UniCredit Bulbank, Zagrebačka banka, UniCredit Bank, Bank Pekao, Yapi Kredi, UniCredit Tiriac Bank, ATFBank in the Czech Republicand may not be used or relied upon by any other person for any purpose.
Notice to Italian investorsThis document is not for distribution to retail clients as defined in article 26, paragraph 1(e) of Regulation n. 16190 approved by CONSOB on October 29, 2007.In the case of a short note, we invite the investors to read the related company report that can be found on UniCredit Research website www.research.unicreditgroup.eu.
Notice to Russian investorsAs far as we are aware, not all of the financial instruments referred to in this analysis have been registered under the federal law of the Russian Federation “On the SecuritiesMarket” dated April 22, 1996, as amended, and are not being offered, sold, delivered or advertised in the Russian Federation.
Notice to Turkish investorsInvestment information, comments and recommendations stated herein are not within the scope of investment advisory activities. Investment advisory services are provided inaccordance with a contract of engagement on investment advisory services concluded with brokerage houses, portfolio management companies, non-deposit banks and the cli-ents. Comments and recommendations stated herein rely on the individual opinions of the ones providing these comments and recommendations. These opinions may not suityour financial status, risk and return preferences. For this reason, to make an investment decision by relying solely on the information stated here may not result in consequencesthat meet your expectations.
Notice to Investors in Japan
This document does not constitute or form part of any offer for sale or subscription for or solicitation of any offer to buy or subscribe for any securities and neither this documentnor any part of it shall form the basis of, or be relied on in connection with or act as an inducement to enter into, any contract or commitment whatsoever.
Notice to UK investorsThis communication is directed only at clients of UniCredit Bank AG, UniCredit Bank AG London Branch, UniCredit Bank AG Vienna Branch, UniCredit Bank AG Milan Branch,UniCredit Securities, UniCredit Menkul Değerler A.Ş., UniCredit Bulbank, Zagrebačka banka, UniCredit Bank, Bank Pekao, Yapi Kredi, UniCredit Tiriac Bank, ATFBank in theCzech Republic who (i) have professional experience in matters relating to investments or (ii) are persons falling within Article 49(2)(a) to (d) (“high net worth companies, unin-corporated associations, etc.”) of the United Kingdom Financial Services and Markets Act 2000 (Financial Promotion) Order 2005 or (iii) to whom it may otherwise lawfully becommunicated (all such persons together being referred to as “relevant persons”). This communication must not be acted on or relied on by persons who are not relevant per-sons. Any investment or investment activity to which this communication relates is available only to relevant persons and will be engaged in only with relevant persons.
Notice to U.S. investorsThis report is being furnished to U.S. recipients in reliance on Rule 15a-6 ("Rule 15a-6") under the U.S. Securities Exchange Act of 1934, as amended. Each U.S. recipient of thisreport represents and agrees, by virtue of its acceptance thereof, that it is such a "major U.S. institutional investor" (as such term is defined in Rule 15a-6) and that it understandsthe risks involved in executing transactions in such securities. Any U.S. recipient of this report that wishes to discuss or receive additional information regarding any security or issuer mentioned herein, or engage in any transaction to purchase or sell or solicit or offer the purchase or sale of such securities, should contact a registered representative of UniCredit Capital Markets, Inc. (“UCI Capital Markets”).Any transaction by U.S. persons (other than a registered U.S. broker-dealer or bank acting in a broker-dealer capacity) must be effected with or through UCI Capital Markets.The securities referred to in this report may not be registered under the U.S. Securities Act of 1933, as amended, and the issuer of such securities may not be subject to U.S. re-porting and/or other requirements. Available information regarding the issuers of such securities may be limited, and such issuers may not be subject to the same auditing andreporting standards as U.S. issuers.
The information contained in this report is intended solely for certain "major U.S. institutional investors" and may not be used or relied upon by any other person for any purpose.Such information is provided for informational purposes only and does not constitute a solicitation to buy or an offer to sell any securities under the Securities Act of 1933, asamended, or under any other U.S. federal or state securities laws, rules or regulations. The investment opportunities discussed in this report may be unsuitable for certain inves-tors depending on their specific investment objectives, risk tolerance and financial position. In jurisdictions where UCI Capital Markets is not registered or licensed to trade in se-curities, commodities or other financial products, transactions may be executed only in accordance with applicable law and legislation, which may vary from jurisdiction to jurisdic-tion and which may require that a transaction be made in accordance with applicable exemptions from registration or licensing requirements.The information in this publication is based on carefully selected sources believed to be reliable, but UCI Capital Markets does not make any representation with respect to itscompleteness or accuracy. All opinions expressed herein reflect the author’s judgment at the original time of publication, without regard to the date on which you may receivesuch information, and are subject to change without notice.UCI Capital Markets may have issued other reports that are inconsistent with, and reach different conclusions from, the information presented in this report. These publicationsreflect the different assumptions, views and analytical methods of the analysts who prepared them. Past performance should not be taken as an indication or guarantee of futureperformance, and no representation or warranty, express or implied, is provided in relation to future performance.UCI Capital Markets and any company affiliated with it may, with respect to any securities discussed herein: (a) take a long or short position and buy or sell such securities; (b)act as investment and/or commercial bankers for issuers of such securities; (c) act as market makers for such securities; (d) serve on the board of any issuer of such securities;and (e) act as paid consultant or advisor to any issuer.The information contained herein may include forward-looking statements within the meaning of U.S. federal securities laws that are subject to risks and uncertainties. Factorsthat could cause a company’s actual results and financial condition to differ from expectations include, without limitation: political uncertainty, changes in general economic condi-tions that adversely affect the level of demand for the company’s products or services, changes in foreign exchange markets, changes in international and domestic financialmarkets and in the competitive environment, and other factors relating to the foregoing. All forward-looking statements contained in this report are qualified in their entirety by thiscautionary statement
This document may not be distributed in Canada or Australia..
8/9/2019 JUL 16 UniCredit Friday Notes
http://slidepdf.com/reader/full/jul-16-unicredit-friday-notes 32/32
16 July 2010 Economics & FI/FX Research
Friday Notes
UniCredit Research*Thorsten Weinelt, CFAGlobal Head of Research & Chief Strategist
+49 89 [email protected]
Dr. Ingo HeimigHead of Research Operations
+49 89 [email protected]
Economics & FI/FX Research
Marco Annunziata, Ph.D., Chief Economist+44 20 [email protected]
Economics & Commodity Research
Global Economics
Dr. Davide Stroppa, Global Economist+39 02 [email protected]
European Economics
Andreas Rees, Chief German Economist+49 89 [email protected]
Marco Valli, Chief Italian Economist+39 02 [email protected]
Stefan Bruckbauer, Chief Austrian Economist+43 50505 [email protected]
Tullia Bucco+39 02 [email protected]
Chiara Corsa+39 02 [email protected]
Dr. Loredana Federico+39 02 [email protected]
Alexander Koch, CFA+49 89 [email protected]
Chiara [email protected]
US Economics
Dr. Harm Bandholz, CFA+1 212 672 [email protected]
Commodity Research
Jochen Hitzfeld+49 89 378-18709
Nikolaus Keis+49 89 378-12560
EEMEA Economics & FI/FX Strategy
Gyula Toth, Head of EEMEA FI/FX Strategy+43 50505 823-62, [email protected]
Cevdet Akcay, Ph.D., Chief Economist, Turkey+90 212 319-8430, [email protected]
Matteo Ferrazzi, Economist, EEMEA
+39 02 8862-8600, [email protected] Gourov, Economist, EEMEA+43 50505 823-64, [email protected]
Hans Holzhacker, Chief Economist, Kazakhstan+7 727 244-1463, [email protected]
Marcin Mrowiec, Chief Economist, Poland+48 22 656-0678, [email protected]
Vladimir Osakovsky, Ph.D., Head of Strategy and Research, Russia+7 495 258-7258 ext.7558, [email protected]
Rozália Pál, Ph.D., Chief Economist, Romania+40 21 203-2376, [email protected]
Kristofor Pavlov, Chief Economist, Bulgaria+359 2 9269-390, [email protected]
Goran Šaravanja, Chief Economist, Croatia+385 1 6006-678, [email protected]
Pavel Sobisek, Chief Economist, Czech Republic+420 2 211-12504, [email protected]
Jan Toth, Chief Economist, Slovakia+421 2 4950-2267, [email protected]
Global FI/FX Strategy
Michael Rottmann, Head+49 89 378-15121, [email protected]
Dr. Luca Cazzulani, Deputy Head, FI Strategy+39 02 8862-0640, [email protected]
Chiara Cremonesi, FI Strategy+44 20 7826-1771, [email protected]
Dr. Stephan Maier, FX Strategy+39 02 8862-8604, [email protected]
Armin Mekelburg, FX Strategy+49 89 378-14307, [email protected]
Roberto Mialich, FX Strategy+39 02 8862-0658, [email protected]
Kornelius Purps, FI Strategy+49 89 378-12753, [email protected]
Herbert Stocker, Technical Analysis+49 89 378-14305, [email protected]
Publication Address
UniCredit ResearchCorporate & Investment BankingUniCredit Bank AGArabellastrasse 12D-81925 MunichTel. +49 89 378-18927 - Fax +49 89 378-18352
BloombergUCGR
Internetwww.research.unicreditgroup.eu
*UniCredit Research is the joint research department of UniCredit Bank AG (UniCredit Bank), UniCredit CAIB Group (UniCredit CAIB), UniCredit Securities (UniCredit Securities),UniCredit Menkul Değerler A.Ş. (UniCredit Menkul), UniCredit Bulbank, Zagrebačka banka, UniCredit Bank, Bank Pekao, Yapi Kredi, UniCredit Tiriac Bank and ATFBank.