jsw energy ltd buy - choicereports.choiceindia.com/reports/fur150120160553371.pdfinitiating coverage...
TRANSCRIPT

JSW Energy Ltd. Stability in merchant power rates and hydro assets integration to drive earnings
INITIATING COVERAGE
BUY
Relative Capital Market Strength
JSW Energy Ltd. (JSWEL) (a part of USD 11bn JSW Group), is an integrated power company having presence across the industry value chain (including lignite mining, power generation, power transmission & trading and power plant equipment manufacturing).
Investment Rationale: (Page: 8-10)
• Reducing power deficit not to impact merchant power rates in the near future
• Favorable tariff order expected for the Barmer power plant
• Acquisition of hydro asset to be earning assertive
• Improving sales-mix with higher proportion of PPAs
• Focus on inorganic growth to facilitate capacity expansion
Risk and Concerns: (Page: 13)
• Unfavorable tariff finalization for the Barmer power plant
• Lower than expected benefits from hydel power plant
• Continuous decline in power spot prices
• Inability to sign PPA
• Unexpected rise in international coal price and depreciation of INR against USD
Valuation: (Page: 14)
• At CMP of Rs. 77.6, JSWEL’s share is trading at TTM P/E multiple of 9.0x
• Additionally, JSWEL is trading at a P/BVPS multiple of 1.4x
• The recent correction in the stock price is a good entry point
• Recent correction is not justified given the positive outlook on merchant power rate and presence in the key power deficit market such as South India
• Based on SOTP valuation methodology, we arrive at a target price of Rs. 99.7 per share, translating into an upside potential of 37.2%.
• Thus we recommend a “BUY” rating on the stock.
Rajnath Yadav | Board line: +91 22 6707 9999; Ext. 912 | [email protected] 1
Jan. 15, 2016
Rating Matrix
CMP (Rs.) 72.7
Rating Buy
Target price (Rs.) 99.7
Target period 18 months
Upside potential 37.2%
52 week H/L (Rs.) 126.4 / 59.5
Face value (Rs.) 10
Category Large Cap
Sector Electric Utilities
Shareholding Pattern as on 30th Sept. 2015
Particulars Sep-15 Jun-15 Mar-15 Dec-14
Promoters 75.0% 75.0% 75.0% 75.0%
FIIs 8.8% 8.5% 7.2% 6.6%
DIIs 5.5% 5.8% 6.3% 6.5%
Non institutions 10.7% 10.8% 11.5% 11.9%
Consolidated Financial Snapshot (Rs. bn)
Projections FY12 FY13 FY14 FY15 FY16E FY17E
Revenue 61.3 89.3 87.1 93.8 100.1 117.2
EBITDA 14.6 27.9 32.5 36.2 42.3 57.6
Adjusted PAT 3.3 11.0 11.3 13.8 18.0 28.3
EBITDA (%) 23.8% 31.3% 37.3% 38.6% 42.2% 49.1%
PAT (%) 5.4% 12.3% 13.0% 14.8% 18.0% 24.2%
EPS 2.0 6.7 6.9 8.4 11.0 17.3
BVPS 35.1 38.1 40.4 46.2 55.9 70.7
RoNW (%) 5.8% 17.6% 17.1% 18.3% 19.7% 24.5%
RoCE (%) 6.3% 13.4% 15.3% 17.6% 13.8% 18.4%
P/E 6.6 4.2
P / BVPS 1.3 1.0
EV/EBIDTA 5.9 4.0
55
65
75
85
95
105
115
125
13
-Jan
-15
13
-Feb
-15
13
-Mar
-15
13
-Ap
r-1
5
13
-May
-15
13
-Ju
n-1
5
13
-Ju
l-1
5
13
-Au
g-1
5
13
-Sep
-15
13
-Oct
-15
13
-No
v-1
5
13
-Dec
-15
13
-Jan
-16
JSW Energy Ltd. Sensex

INITIATING COVERAGE
2
Company Introduction:
JSW Energy Ltd. (JSWEL) (a part of USD 11bn JSW Group), is an integrated power company having presence across the industry value chain (including lignite mining, power generation, power transmission & trading and power plant equipment manufacturing).
Source: Choice Broking Research
BUY
Presence across the Power Value Chain
Power Sector Value Chain
Mining
Power Generation
Power Trading
Power Transmissi
on
Power Plant
Equipment Manufactu
ring
Rajasthan (Lignite): Kapurdi and Jalipa mines with a reserves of 441mn
tonnes
Power generation capacity of 4,440MW
Engaged in power trading since 2006. in FY15,
handled trading volume of around 8.95bn units
JV with MSETCL: Two operational transmission
line of 400KV capacity each
JV with Toshiba Corp.: Involved into
manufacturing of super critical steam turbines and
generators
Mining: Barmer Lignite Mining Co. Ltd. (BLMCL) is a joint venture (JV) between Raj West Power Ltd. (RWPL; a 100% subsidiary of JSWEL) and Rajasthan State Mines and Minerals Ltd., with the latter having 51% stake. BLMCL has two mines Kapurdi and Jalipa, which are responsible to source lignite to RWPL. Kapurdi mine (with a mining capacity of 7mn tonnes) is currently operational, while Jalipa (with a mining capacity of 6mn tonnes) mine is under development. Power Generation: From commencing in 2000, with a generation capacity of 260MW at Vijayanagar, Karnataka, JSWEL has ramped up its generation capacity to 4,440MW (as on 31st Dec. 2015) through various organic and inorganic expansions. The company has power plants in Karnataka, Maharashtra, Rajasthan and Himachal Pradesh. During Q2 FY16, JSWEL completed its 100% acquisition of Himachal Baspa Power Co. Ltd., comprising of 300MW Baspa II and 100MW Karcham Wangtoo hydroelectric projects for a consideration of Rs. 92,750mn from JPVL. Currently, the company generates 70.7% of the power from conventional sources (coal (46.4%)and lignite (24.3)), while the rest, 29.3% from non-conventional sources (hydro).
Jan. 15, 2016
JSW Energy Ltd.

INITIATING COVERAGE
3
Company Introduction (Contd…):
BUY
Power Trading: Established in 2006, JSW Power Trading Co. Ltd. (JPTCL; 100% subsidiary of JSWEL) is one of the leading power trading companies in India. JPTCL possesses a category “I” license, which is the highest power trading license issued by Central Electricity Regulatory Commission to trade power across India. In FY15, the company traded around 8.95bn units thereby generating revenue of Rs. 44,047.8mn and a PAT of Rs. 111.7mn. Power Transmission: JSWEL is engaged into power transmission business through its wholly owned subsidiary, Jaigad PowerTransco Ltd. (JPTL), which in turn is a JV with Maharashtra State Electricity Transmission Co. Ltd. (MSETCL) with the latter having a 26% stake. The company evacuates power from its Ratnagiri power plant and is also proposed to facilitate power transmission in the Western Maharashtra. The transmission system of JPTL comprises of two 400KV lines with a power evacuation capacity of about 2,500-3,000MW. The network is presently operating at 40%-50% operating capacity. Power Plant Equipment Manufacturing: JSWEL in a JV with Toshiba Corporation (75% stake in JV) manufactures power plant equipment such as supercritical steam turbines and generators. The company has secured few orders from NTPC Ltd. for the supply of 800MW and 660MW supercritical steam turbines and generators. Operating Business Model: JSWEL is engaged in power generation and sales in the domestic market. The company has one operational segment, namely “Generation and Sales of Power”. Initially, the company started as a 100% merchant power producer, however, over the years, it has diversified its power offtake profile by signing various long term and short term PPA with its consumers. In the long run, JSWEL is targeting to have a PPA for its 80% of its capacity.
Source: Choice Broking Research
Operational Power Generation Capacity (as on 31st Dec. 2015)
Diversified Fuel Source
Source: Choice Broking Research
Power Plant Capacity (MW)
Vijayanagar I 260
Vijayanagar II 600
JSW (Ratnagiri) Energy Ltd. 1,200
Raj West Power Ltd. 1,080
Himachal Baspa Power Co. Ltd. 1,300
Total 4,440
46.4%
24.3%
29.3%
Thermal Coal Lignite Hydro
Jan. 15, 2016
JSW Energy Ltd.

INITIATING COVERAGE
4
Power Sector Overview: Infrastructure is one of the key drivers of the Indian Economy and thus it is given a high priority during the formulation of the policies. Investment in infrastructure is directly correlated to the national GDP, as sectors involved in the infrastructure industry are roads, power telecom, railway, ports, airports etc. As the Indian economy is anticipated to grow at higher rate, the government is expecting huge investments in these sectors. The government is focusing on providing affordable, 24x7 power to all households by 2019. For the 12th five year plan the government has increased the investment in infrastructure to Rs. 51.5tn, representing an increase of 2.6 times in comparison to the 11th plan. Power sector is the major contributor towards total infrastructure spending, followed by roads, telecommunication and railways sector in 11th plan.
BUY
Source: Choice Broking Research
Indian Infrastructure Outlay in 12th Five Year Plan: Rs. 51.5tn
35.9%
17.9% 17.1%
8.9%
3.1% 1.4%
15.7%
Electricity Roads TelecommunicationsRailways Ports AirportsOthers
Earlier the sector was dominated by few central and state utilities; however, since the last decade many private players have ventured and increased their market share and competition. The power developers have large capacity expansion plans for the future. The rate of capacity addition has risen from ~4GW during 1992-2002 to ~9GW during 2002-12. Taking into consideration the governments focus, it is expected that the sector will sustain the capacity addition in the 12th and 13th plan. During the 12th plan period, the capacity addition is estimated at 75.7GW, of which around 61GW capacity has been added till 31st Mar. 2015, which is around 69% of the target envisaged for the 12th Plan. Major Impediments and Opportunities for the Development of Power Sector Coal Demand Supply Equation in India: At the end of 11th five year plan, coal based power plant formed 56.5% of the national power generation capacity. To meet the supply-demand mismatch, power companies have resorted to coal imports in the past. Below is the national coal demand-supply position in India.
National Coal Demand-Supply Position
Coal Supply and Demand (mn tonnes) FY08 FY09 FY10 FY11 FY12 FY13 FY14 FY15E FY16E Coal India 375.3 400.7 415.9 424.3 432.5 465.0 471.5 520.0 570.0 SCCL 42.0 44.4 49.4 50.1 51.4 52.1 47.9 55.5 55.5 Others 37.1 43.9 49.3 49.6 51.3 50.6 51.6 68.3 50.0 Total Domestic Supply 454.4 489.0 514.5 524.1 535.2 567.6 571.0 643.8 675.5 Coal Imports 49.8 59.0 83.4 132.2 160.9 145.8 168.5 200.0 160.0 Total Domestic Demand 504.2 548.0 597.9 656.3 696.0 713.4 739.5 843.8 835.5
Source: Choice Broking Research
Jan. 15, 2016
JSW Energy Ltd.

INITIATING COVERAGE
5
Sector Overview (Contd…)
To address the fuel constraints face by the power developer, the government has e-auctioned 29 coal mines in two phases. Moreover, the government has enhanced the coal availability in India by addressing the production bottleneck faced by the coal miners in India. The government is aggressively focusing on achieving the coal production target of 1.5bn tonnes by 2020.
The coal ministry is undertaking certain steps such as expediting contract mining, faster regulatory clearance & land acquisition, improving infrastructure at coalfields, modernization of mines etc. to reduce the coal import by increase the coal production coupled with the expansion in the evacuation capacity. The initiatives of the government has started showing results, as for the nine month ended Dec. 2015, the largest coal producer Coal India Ltd. has reported a coal production and sales growth rate of around 9%-10% each, thereby improving the coal stock position at the power plants to 26 days as compared to 7-10 days coal stock on Dec. 2014. Domestic coal availability is further expected to improve going forward on account of more new mines opening up and higher availability of railways wagons for coal transport.
The government has planned a power capacity addition of 75.7GW in 12th five year plan over FY13-17. Major part of the expansion is expected to come from 62.6GW addition of coal based thermal power plant. By FY17, India’s national coal demand is expected to touch around 980mn tonnes, of which demand from power sector is expected to be around 700mn tonnes. With indigenous coal availability projected at around 800mn tonnes, the power companies will continue to depend on the imports.
International Coal Price Movement: In the past owing to huge demand from China & India and stagnant domestic coal production, international coal prices were at elevated levels, thereby putting pressure on India’s trade balance. However, due to the soft landing of the Chinese economy coupled with environmental concerns related to burning of coal, there is an international pressure on the usage of thermal coal. As a result, international coal prices have corrected and are currently hovering at decade low levels. Coal demand from China (which was the major consumer of coal) has declined leading to a net supply position in the international market. Another major consumer, India, which is targeting to expanding its domestic coal production by 2020, is also putting a negative pressure on the international coal price. Thus, considering low demand from the key consuming countries like China and India, we predict, the international coal prices are likely to remain subdued over the next few years.
BUY
Indonesian and South African Coal Reference Price
Source: Choice Broking Research
40
60
80
100
120
140
Jan
-09
Jun
-09
No
v-0
9
Ap
r-1
0
Sep
-10
Feb
-11
Jul-
11
De
c-1
1
May
-12
Oct
-12
Mar
-13
Au
g-1
3
Jan
-14
Jun
-14
No
v-1
4
Ap
r-1
5
Sep
-15
Melawan Coal Price (USD per Tonne )
South African Coal Price (USD per Tonne )
Jan. 15, 2016
JSW Energy Ltd.

INITIATING COVERAGE
6
Sector Overview (Contd…)
BUY
Insufficient Power Transmission Capacity: Transmission plays a vital role in the power sector value chain. The country is divided into five transmission regions i.e. eastern, western, northern, southern and north-eastern region. All the regions except southern region are synchronized and operate as a single grid. In the 11th five year plan, the generation capacity increased by around 50%, while transmission capacity increased by ~30%. As a result, despite having a generation capacity of 268GW, the country still faces a base load power deficit of 3%-5%. In order to meet the power deficit, the government has planned a massive investment of around Rs. 1.8tn for the 12th five year plan, which will enhance the transmission capacity to 3,30,593 circuit KMs. Similarly, for the 13th plan, it has estimated a total fund requirement of Rs. 2.6tn to expand the network by 62,800 circuit KMs. Seamless connectivity among the regional grid is likely to lower the energy deficit and subsequently the energy spot market rates.
Indonesian and South African Coal Reference Price
Source: Choice Broking Research
86 105 132
200
268 319
419
117 152
198
257
331 365
428
50
150
250
350
450
8th Plan 9th Plan 10thPlan
11thPlan
12thPlan till
Date
12thPlan
Target
13thPlan
Target
Installed Power Generation Capacity (GW)
Transmission Line Network (000 Circuit KMs)
Poor Financial Position of Discoms and UDAY Scheme: Power Distribution is the weakest link in the power value chain. Major players involved in power distribution are the state electricity boards (SEBs). After selling the power at a cost lower than the procurement price, these SEBs have an accumulated losses of Rs. 3.8 lakh crore and an outstanding debt of Rs. 4.3 lakh crore (as on 31st Mar. 2015). Consequently, these financially distressed SEBs are not able to supply power at an affordable rate and alternatively opted for load shedding in many parts of the country, thereby affecting the growth prospects of the nation. To improve and revive the SEBs performance, the government has come up with a scheme named “Ujwal Discom Assurance Yojna” (UDAY), by which it will ensure that affordable power is accessible to everyone. Since the launch of this scheme, around 15 states have joined the scheme to make it successful. If successfully implemented across the nation, it will clear the dues from the SEBs, thereby lowering the interest cost for the SEBs and ease the pressure on the cash flows on the power generators. However, there are concerns such as higher fiscal deficit of the states and the central government, higher interest expenses and little room for capex by the states.
Jan. 15, 2016
JSW Energy Ltd.

INITIATING COVERAGE
7
Sector Overview (Contd…)
Power Deficit to Increase in Medium Term: Over FY10-15, the base load power demand grew by 5.2% CAGR to 1,069bn units in FY15 from 831bn units in FY10. During the same period, power supply increased by 6.7% CAGR to 1,031bn units in FY15 from 747bn units in FY10. In the initial period, the power demand growth was restricted mainly due to insufficient power transmission capacity, poor financial position of state electricity boards (SEBs) and slow pace in capacity addition. However, the power demand picked up in later years on account of higher power capacity addition. This has led to an improvement in the base energy deficit to 3.6% in FY15 from 10.1% in FY10, as significant capacity addition have led to a supply growth outpacing demand growth. With poor demand of power especially from SEBs, the sector has reported a deficit of 2.3% for Arp.-Nov. 2015 period as compared to 4% in the same period last year. However, with the implementation of UDAY Scheme, expansion & strengthening of transmission network and revival in the economy, power demand is likely to increase, thereby increasing the power deficit.
BUY
* Provisional Upto 30th Nov. 2015; Source: Choice Broking Research
India’s Power Supply Position
FY10 FY11 FY12 FY13 FY14 FY15 FY16 *
Base Load Demand (bn Units) 830.6 861.6 937.2 995.6 1,002.3 1,068.9 748.7
Base Load Supply (bn Units) 746.6 788.4 857.9 908.7 959.8 1,030.8 731.4
Base Load Deficit (bn Units) (84.0) (73.2) (79.3) (86.9) (42.4) (38.1) (17.2)
Base Load Deficit (%) -10.1% -8.5% -8.5% -8.7% -4.2% -3.6% -2.3%
Peak Load Demand (bn Units) 119.2 122.3 130.0 135.5 135.9 148.2 153.4
Peak Load Supply (bn Units) 104.0 110.3 116.2 123.3 129.8 141.2 148.5
Peak Load Deficit (bn Units) (15.2) (12.0) (13.8) (12.2) (6.1) (7.0) (4.9)
Peak Load Deficit (%) -12.7% -9.8% -10.6% -9.0% -4.5% -4.7% -3.2%
Below are the key critical requirements for future growth of the sector: • Improvement in the power transmission network and capacity expansion
• Reduction in the transmission and distribution losses
• Improving the financial health of SEBs
• Enhancing the fuel security
• Fast approvals in the regulatory requirements such as environmental clearance, forest clearance, water availability etc.
• Land availability and ease in land acquisition process
Jan. 15, 2016
JSW Energy Ltd.
INITIATING COVERAGE
8
Investment Rationale:
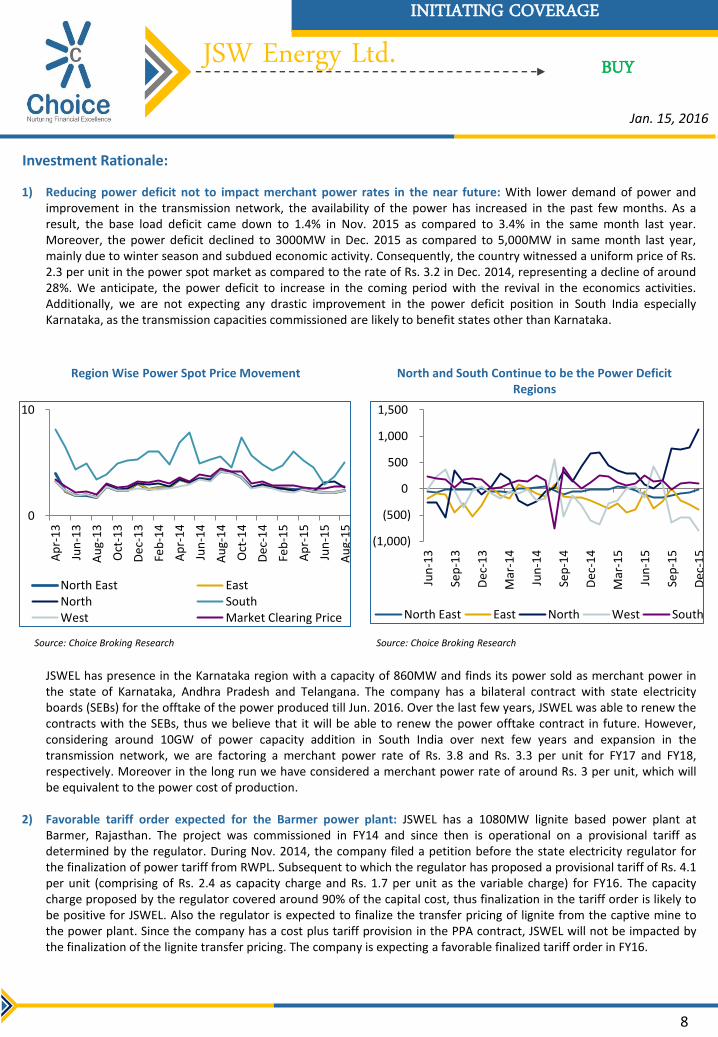
1) Reducing power deficit not to impact merchant power rates in the near future: With lower demand of power and improvement in the transmission network, the availability of the power has increased in the past few months. As a result, the base load deficit came down to 1.4% in Nov. 2015 as compared to 3.4% in the same month last year. Moreover, the power deficit declined to 3000MW in Dec. 2015 as compared to 5,000MW in same month last year, mainly due to winter season and subdued economic activity. Consequently, the country witnessed a uniform price of Rs. 2.3 per unit in the power spot market as compared to the rate of Rs. 3.2 in Dec. 2014, representing a decline of around 28%. We anticipate, the power deficit to increase in the coming period with the revival in the economics activities. Additionally, we are not expecting any drastic improvement in the power deficit position in South India especially Karnataka, as the transmission capacities commissioned are likely to benefit states other than Karnataka.
BUY
JSWEL has presence in the Karnataka region with a capacity of 860MW and finds its power sold as merchant power in the state of Karnataka, Andhra Pradesh and Telangana. The company has a bilateral contract with state electricity boards (SEBs) for the offtake of the power produced till Jun. 2016. Over the last few years, JSWEL was able to renew the contracts with the SEBs, thus we believe that it will be able to renew the power offtake contract in future. However, considering around 10GW of power capacity addition in South India over next few years and expansion in the transmission network, we are factoring a merchant power rate of Rs. 3.8 and Rs. 3.3 per unit for FY17 and FY18, respectively. Moreover in the long run we have considered a merchant power rate of around Rs. 3 per unit, which will be equivalent to the power cost of production.
2) Favorable tariff order expected for the Barmer power plant: JSWEL has a 1080MW lignite based power plant at
Barmer, Rajasthan. The project was commissioned in FY14 and since then is operational on a provisional tariff as determined by the regulator. During Nov. 2014, the company filed a petition before the state electricity regulator for the finalization of power tariff from RWPL. Subsequent to which the regulator has proposed a provisional tariff of Rs. 4.1 per unit (comprising of Rs. 2.4 as capacity charge and Rs. 1.7 per unit as the variable charge) for FY16. The capacity charge proposed by the regulator covered around 90% of the capital cost, thus finalization in the tariff order is likely to be positive for JSWEL. Also the regulator is expected to finalize the transfer pricing of lignite from the captive mine to the power plant. Since the company has a cost plus tariff provision in the PPA contract, JSWEL will not be impacted by the finalization of the lignite transfer pricing. The company is expecting a favorable finalized tariff order in FY16.
Source: Choice Broking Research
Region Wise Power Spot Price Movement North and South Continue to be the Power Deficit Regions
Source: Choice Broking Research
0
10
Ap
r-1
3
Jun
-13
Au
g-1
3
Oct
-13
De
c-1
3
Feb
-14
Ap
r-1
4
Jun
-14
Au
g-1
4
Oct
-14
De
c-1
4
Feb
-15
Ap
r-1
5
Jun
-15
Au
g-1
5
North East EastNorth SouthWest Market Clearing Price
(1,000)
(500)
0
500
1,000
1,500
Jun
-13
Sep
-13
De
c-1
3
Mar
-14
Jun
-14
Sep
-14
De
c-1
4
Mar
-15
Jun
-15
Sep
-15
De
c-1
5
North East East North West South
Jan. 15, 2016
JSW Energy Ltd.

INITIATING COVERAGE
9
Investment Rationale (Contd…)
BUY
3) Acquisition of hydro asset to be earning assertive: In Sept. 2015, the company has completed the acquisition of hydro assets from JPVL for a consideration of Rs. 92,750mn. The asset is likely to add Rs. 2,273.6mn and Rs. 14,899.6mn to the top-line in H2 FY16 and FY17, respectively. Moreover, it is likely to have an EBITDA and PAT margin of around 80% and 16%, respectively. Thus, on consolidated basis, EBITDA margin of JSWEL is likely to expand by 360bps and 689bps in FY16E and FY17E, respectively. During the same period, PAT margins is likely to expand by 327bps and 615bps, respectively.
Acquisition of Hydro Assets to be Earning Assertive
Source: Choice Broking Research
41.0% 42.2%
19.4% 18.4%
44.1% 49.1%
22.4% 24.8%
15%
20%
25%
30%
35%
40%
45%
50%
EBITDA MarginPre Acquisition
(%)
EBITDA MarginPost Acquisition
(%)
PAT Margin PreAcquisition (%)
PAT Margin PostAcquisition (%)
FY16E FY17E
4) Improving sales-mix with higher proportion of PPAs: Historically, JSWEL’s sales-mix was in the favour of merchant power business with a contribution of 71.2% to the total units sold. Thus the volatility in the merchant power rates has intermittently disturbed the performance of the company.
Initially, the entire Vijayanagar facility (i.e. 860MW) and partial capacity of Ratnagiri facility (i.e. 300MW out of 1,200MW) was for merchant power business, however, in the recent years, JSWEL has increased the PPA portion from 300MW to 727MW at Ratnagiri. Moreover, the company has a 100% PPA for its Rajasthan facility (1,080MW), taking total capacity under PPA to 1,853MW. As a result, the proportion of PPA in the sales mix has increased to 55.5% in FY15. JSWEL has recently acquired hydro power assets of capacity 1,300MW, of which 1,000MW is tied up under the PPA. Consequently, the contribution of PPA in the sales-mix further increased to 60.4%, providing a sense of stability in cash flow generation, which bode well for the company. JSWEL is further exploring the possibilities of converting the residual merchant capacities to PPA capacities.
Jan. 15, 2016
JSW Energy Ltd.

INITIATING COVERAGE
10
Investment Rationale (Contd…)
5) Focus on inorganic growth to facilitate capacity expansion: JSWEL has around 8,630MW of power projects under implementation and development, with a plan to have a capacity of more than 10,000MW by 2025. Currently, the company is only working on 240MW Kutehr hydro project in the district of Chanba, Himachal Pradesh. However, it is focusing on an inorganic expansion route with the acquisition of quality stressed assets of other power companies. Recently JSWEL has acquired hydro assets at relatively low valuations (of Rs. 71mn per MW as compared to its replacement cost of Rs. 80mn per MW). Similar acquisitions going forward are likely to be positive for the company. Presently JSWEL is evaluating the proposals of acquiring the 500MW Bina Thermal Power plant from Jaiprakash Power Ventures Ltd. for a consideration of around Rs. 30,000-35,000mn. This acquisition is likely to improve the sales-mix of the company, as the targeted asset has a PPA for 65% of its capacity. Moreover, the proposed deal is fairly valued, considering that it is an operational project with PPA and fuel security. JSWEL has also entered into an agreement to purchase a majority stake in the power arm of Monnet Ispat & Energy Ltd., which has a capacity of 1,050MW.
BUY
Source: Choice Broking Research Source: Choice Broking Research
Capacity Breakup between PPA and Merchant Power Business
Power Sales-mix Under PPA and Merchant Power
1,853
2,853
1,287
1,587
1,000
1,500
2,000
2,500
3,000
FY15 FY16E
Capacity Under PPA Business (MW)Capacity Under Merchant Power Business (MW)
33.3% 34.9%
47.1% 49.1%
55.5% 57.6%
60.5%
66.7% 65.1%
52.9% 50.9%
44.5% 42.4%
39.5%
30%
40%
50%
60%
70%
FY11 FY12 FY13 FY14 FY15 FY16E FY17E
Long Term PPA (mn units) Merchant Sales (mn units)
Jan. 15, 2016
JSW Energy Ltd.

INITIATING COVERAGE
11
Recent Quarterly and Annual Financial Performance:
Recent Quarter Analysis: During Q2 FY16, on account of lower power demand JSWEL reported over 3 percent pts Y-o-Y decline in thermal PLF level to 83.7% and 3.4% Y-o-Y fall in average realization. Consequently, net generation from the thermal power plants declined by 5% Y-o-Y to 4,972mn units. During this period, the company completed the acquisition of 1.3GW hydro projects taking the total operational capacity to 4,440MW. On the back of incremental generation from the hydro assets, JSWEL reported a 7.7% Y-o-Y increase in combined net generation (including thermal and hydro units). On a consolidated basis (power and other businesses), the company reported a 12.4% Y-o-Y increase in total operating income to Rs. 25,314.3mn, which sequentially, increased by 20.1%, mainly due to improvement in the power demand, which was partially offset by fall in the average realization.
Total operating expenditure increased at a rate lower than the top-line growth, mainly due to lower fuel cost, which declined by 12.5% Y-o-Y. As a result, EBITDA increased by 17.2% Y-o-Y with a 160bps expansion in the EBITDA margin to 39.4%. Depreciation and finance charge increased by 11.1% Y-o-Y and 21.6%, respectively, mainly due the integration of hydro assets. During the quarter, JSWEL reported an exceptional gain of Rs. 1,500mn arising from compensation received from JPVL in relation to the acquisition of hydro assets, thereby resulting to a 47.9% Y-o-Y increase in profit before tax. Lower tax incidence (down by 420bps Y-o-Y) led to a 54.4% Y-o-Y increase in reported PAT. Excluding the exceptional item, adjusted PAT declined by 3.1% Y-o-Y with a 217bps contraction in the margin to 13.5%.
BUY
Source: Choice Broking Research Source: Choice Broking Research
Quarterly Operational Performance Quarterly Financial Performance
Recent Annual Result Analysis: In FY15, the company reported increased availability of lignite from BLMCL for its RWPL power plant, thereby leading to an improvement in the PLF level to 86% from 68% in FY14 and net generation of 6.6bn units (as against 3.7bn units in FY14). Net generation from Vijayanagar and Ratnagiri plants reported a modest growth of 2%-3%. On consolidation basis, JSWEL reported 19% increase in net electricity generation, whereas average realization declined by 8.4% to Rs. 4.2 per unit. Consequently, total operating revenue increased by 7.8% to Rs. 93,801.6mn. On account of higher power generation, fuel cost increased by 13.1%, leading to a 5.6% increase in operating expenditure. Consolidated EBITDA increased by 11.4% with 128bps expansion in EBITDA margin. With the revision in the life of assets, depreciation expenses declined by 2.5%, while due to repayment of debts, interest charge declined by 5.7%. Accordingly, adjusted PAT increased by 78.8% with around 570bps expansion in margin to 14.4%.
5.2 5.4
4.7 4.5
5.6 87.0% 86.0%
79.0%
75.0%
83.0%
4.1 4.3 4.4 4.2
4.0 3.5
4.0
4.5
5.0
5.5
6.0
70%
75%
80%
85%
90%
Q2 FY15 Q3 FY15 Q4 FY15 Q1 FY16 Q2 FY16
Net Generation (bn units)Average Deemed PLF (%)Average Realization (Rs. per Unit)
22.5
23.8
21.9
21.1
25.3 37.8%
40.9% 40.7% 38.8%
39.4%
15.7% 16.0%
14.9% 13.2% 13.5%
10%
15%
20%
25%
30%
35%
40%
45%
21
22
23
24
25
26
Q2 FY15 Q3 FY15 Q4 FY15 Q1 FY16 Q2 FY16
Total Operating Income (Rs. bn)EBITDA Margin (%)PAT Margin (%)
Jan. 15, 2016
JSW Energy Ltd.

INITIATING COVERAGE
12
Quarterly and Financial Performance (Contd…)
BUY
Source: Choice Broking Research Source: Choice Broking Research
Annual Operating Performance Annual Financial Performance
Expectations for FY16E and FY17E: JSWEL is forecasted to report an 11.8% CAGR growth in top-line over FY15-17E to Rs. 117,202.8mn, mainly due to the consolidation of hydro assets and stable merchant power rates. FY17 will be the full year integration of the hydro assets and is likely to generate a revenue of Rs. 2,873.6mn and Rs. 14,899.6mn in FY16 and FY17, respectively. On the back of lower fuel expenses, operating expenses is anticipated to report a modest increase, resulting to an expansion in EBITDA margin by 360bps and 680bps in FY16 and FY17, respectively. Integration of hydro assets will lead to a higher depreciation and finance charge. After taking into consideration tax incidence of 20%, we arrive at a PAT of Rs. 18,035.8mn and Rs. 28,329.3mn in FY16 and FY17, respectively. PAT margin is expected to expand in line with operating margin.
18.8 17.1 20.3 22.2
28.8
89.0%
76.0%
84.0%
70.0%
83.1%
0
10
20
30
40
65%
70%
75%
80%
85%
90%
FY13 FY14 FY15 FY16E FY17E
Net Generation (bn units)
Average Deemed PLF (%)
89.3
87.1
93.8
100.1
117.2
31.3%
37.3% 38.6% 42.2%
49.1%
12.3% 13.0%
14.8%
18.0%
24.2%
10%
20%
30%
40%
50%
85
90
95
100
105
110
115
120
FY13 FY14 FY15 FY16E FY17E
Total Operating Income (Rs. bn)EBITDA Margin (%)PAT Margin (%)
Jan. 15, 2016
JSW Energy Ltd.

INITIATING COVERAGE
13
BUY
Risk and Concerns: • Unfavorable tariff finalization for the Barmer power plant: The Rajasthan state electricity regulator is expected to
finalize the tariff order for the 1,080MW Barmer power plant. The provisional capacity charge proposed by the regulator, covers around 90% of the capital cost, thus finalization in the tariff order is likely to be positive for JSWEL. For earnings estimates, we have considered a provisional tariff of Rs. 4.06 per unit. Thus, a lower tariff as compared to the provisional rate or any unfavorable ruling from the regulator will affect the earnings and will be negative for the company.
• Lower than expected benefits from hydel power plant: Acquisition of the hydel power plant is likely to be earning assertive for JSWEL, as it will increase the profitability. We are anticipating a significant improvement in the profitability in FY16 and FY17. Moreover, it will also improve the power sales-mix with comparatively lesser reliance on the merchant power sales. Lower than expected benefits from the acquisition will adversely affect the profitability of the company.
• Continuous decline in power spot prices: With easing power deficit situation in the country, the spot price in the power exchanges have declined from Rs. 3.2 per unit in Dec. 2014 to Rs. 2.3 per unit in Dec. 2015. Further decline in the spot price is likely to put pressure on the merchant power rates. With continuing power deficit position in South India, we have factored a merchant power rate of Rs. 3.8 and Rs. 3.3 per unit for FY17 and FY18, respectively. Thus lower than expected merchant power rate is likely to affect the business of the company.
• Inability to sign PPA: In order to have a sustainable business with certainty in the cash flow, JSWEL is looking to increase the business contribution from the PPA sales. The company is planning to enter into a PPA with the SEBs, but with power spot rates are lower than PPA rates, SEBs too are not interested in signing PPA. The country witnessed a uniform power price of Rs. 2.3 per unit in the spot market as compared to Rs. 3.2 per unit in Dec. 2014, representing a decline of around 28%. Thus prolonged weakness in the PPA market is likely to be negative for the company.
• Unexpected rise in international coal price and depreciation of INR against USD: International coal prices have corrected from its lifetime high in FY12. Since then JSWEL, (of which 46.4% of the total capacity is based on imported coal) is reporting lower cost towards fuel cost. Fuel cost as a percent of total operating income declined from 59.6% in FY12 to 49.9% in FY15. Moreover, during H1 FY16, it declined to an average 44.3% as compared to 50.1% in H1 FY16. On account of poor demand from key consuming countries like China and India, we are anticipating a subdued price outlook. The full benefit of decline in fuel cost was not absorbed by the importers domestically, as the Indian Rupee depreciated against USD during the period. Thus unexpected movement in the international coal prices and unfavorable USD-INR currency rate will largely impact the profitability of the company.
Jan. 15, 2016
JSW Energy Ltd.

INITIATING COVERAGE
14
Peer Group Valuation
Above selected peers are the major players in the power industry in India. JSWEL is the fourth largest private power generator in India with a capacity of 4,440MW. The company is the most efficient power player with better profitability and return ratios. Power deficit is expected to increase with the revival in the economy and increase in power demand. Thus JSWEL is expected to benefit from its presence in merchant power market. With strong liquidity profile, the company is planning for an inorganic expansion by acquiring stressed power assets at a fair valuation.
Despite having better profitability and balance sheet strength, JSWEL is available at discount to its peers. Going forward, we are anticipating expansion in the profitability margins and return ratio, which will assist in narrowing the valuation gap between the company and its peers.
Source: Choice Broking Research; Ace Equity
Source: Choice Broking Research; Ace Equity
Source: Choice Broking Research
Valuation:
Based on the operating assumption mentioned below, we estimate JSWEL’s total operating income to grow at 11.8% CAGR over FY15-17 to Rs. 117,202.8mn, while PAT to grow at 43.1% CAGR over the same period to Rs. 28,329.3mn. At CMP of Rs. 72.7, the company’s share is trading at TTM P/E multiple of 9.0x. Additionally, JSWEL is trading at a P/BVPS multiple of 1.4x.
The recent correction in the stock price is not justified given the positive outlook on merchant power rate and presence in the key power deficit market such as South India. Based on SOTP valuation methodology, we arrive at a target price of Rs. 99.7 per share, translating into an upside potential of 37.2%. Thus we recommend a “BUY” rating on the stock.
BUY
Key Operating Assumptions
Assumptions CY15E CY16E
Generation Capacity (MW 4,440 4,440
Net Generation (mn units) 22,158.4 28,762.4
Average Deemed PLF (%) 70.0% 83.1%
Sales of Power (mn units) 22,078.4 28,762.4
Long Term PPA (mn units) 12,712.7 17,398.3
Merchant Sales (mn units) 9,365.7 11,364.1
Tax Rate (%) 20% 20%
SOTP Valuation Methodology Value (Rs. mn)Value per
Share (Rs.)
Vijayanagar and Ratnagiri DCF 69,542.4 42.4
Raj West Power Ltd. DCF 51,366.3 31.3
Himachal Baspa Power Co. Ltd. DCF 10,911.8 6.7
Barmer Lignite Mining Co. Ltd. 1 x Investment 9,197.3 5.6
JSW Power Trading Co. Ltd. 1 x Investment Value 1,577.6 1.0
JSW Energy (Kutehr) Ltd. 1 x Investment 2,450.0 1.5
Toshiba JSW Power Systems Pvt. Ltd. 1 x Investment 1,002.3 0.6
Cas & Cash Equivalent Actuals 17,375.7 10.6
Total Value 99.7
Jan. 15, 2016
JSW Energy Ltd.
1M 3M 6M 12M
JSW Energy Ltd. 72.7 119,136.3 11.8% -4.0% -13.6% -19.0% 4,531 92,089.8 40.0% 14.4%
The Tata Power Co. Ltd. 61.8 167,010.9 8.5% -4.1% -6.4% -16.3% 8,699 354,956.0 22.3% 2.4%
Adani Power Ltd. 29.5 86,460.5 25.8% 13.8% 15.4% -29.5% 10,480 218,052.6 28.4% -2.3%
NTPC Ltd. 136.6 1,126,330.4 9.4% 14.2% 11.8% 3.4% 45,548 727,105.1 23.1% 15.2%
Reliance Power Ltd. 51.1 143,201.7 21.4% 22.4% 30.9% -4.2% 5,945 88,067.9 41.9% 13.9%
CESC Ltd. 452.6 59,995.3 -4.9% -15.5% -12.1% -31.8% 2,384 60,830.0 25.8% 11.5%
CompaniesCMP
(Rs.)
MCAP
(Rs.mn)
Stock Return (%) Installed Power Generation
Capacity (MW)
LTM Revenue
(Rs. mn)
LTM EBIDTA
Margin (%)
LTM PAT
Margin (%)
JSW Energy Ltd. 10 8.1 51.0 2.3 1.7 15.8% 12.1% 9.0 1.4 7.1 57.5 26.3
The Tata Power Co. Ltd. 1 3.1 64.7 1.3 2.1 4.8% 10.9% 19.8 1.0 6.5 59.3 19.2
Adani Power Ltd. 10 (1.7) 17.7 0.0 9.3 -9.6% 11.0% (17.3) 1.7 9.1 53.8 8.3
NTPC Ltd. 10 13.4 105.2 2.5 0.9 12.7% 6.8% 10.2 1.3 11.0 40.5 24.7
Reliance Power Ltd. 10 4.4 76.0 0.0 1.5 5.7% 5.4% 11.7 0.7 11.9 73.7 24.1
CESC Ltd. 10 53.0 634.4 9.0 0.5 8.3% 7.7% 8.5 0.7 5.6 36.6 25.2
CompaniesFV
(Rs.)
EPS
(Rs.)
BVPS
(Rs.)
DPS
(Rs.)
Debt Equity
Ratio (x)
RoE
(%)
RoCE
(%)
P / E
(x)
P / B
(x)
EV / EBITDA
(x)
EV / MW
(Rs. mn)
MCAP / MW
(Rs. mn)

INITIATING COVERAGE
15
Standalone Financial Statement
Source: Choice Broking Research
Source: Choice Broking Research
BUY
Consolidated Profit and Loss Statement Particulars (Rs. mn) FY12 FY13 FY14 FY15 FY16E FY17E Total Operating Income 61,267.7 89,343.0 87,054.2 93,801.6 100,097.6 117,202.8 Fuel Cost (36,541.1) (42,959.2) (41,373.5) (46,811.3) (42,923.5) (46,777.6) Purchase of Power (3,582.6) (11,482.1) (8,409.5) (2,247.7) (7,019.9) (4,000.0) Employee Benefits Expense (904.7) (1,267.6) (1,334.2) (1,469.2) (1,662.5) (1,874.6) Increase / Decrease in Banked Energy / Inventory 26.8 25.6 1,883.5 (1,920.6) 0.0 0.0 Other Expenses (5,708.9) (5,727.8) (5,306.5) (5,118.7) (6,224.9) (6,986.4) EBITDA 14,557.2 27,931.9 32,514.0 36,234.1 42,266.8 57,564.2 Depreciation and Amortization Expense (5,033.5) (6,615.3) (8,099.5) (7,897.6) (8,679.1) (10,405.7) EBIT 9,523.7 21,316.6 24,414.5 28,336.5 33,587.7 47,158.4 Finance Costs (7,172.4) (9,627.9) (12,059.4) (11,374.6) (12,080.0) (14,465.5) Other Income 1,386.8 2,134.3 2,022.1 2,301.1 2,619.1 2,761.3 Exceptional Items (Net) (1,612.7) (1,965.9) (3,776.9) (342.3) 1,500.0 0.0 PBT 2,125.4 11,857.1 10,600.3 18,920.7 25,626.7 35,454.3 Tax Expenses (419.2) (2,733.1) (2,836.0) (5,149.9) (5,207.9) (6,205.0) Adjusted PAT 3,313.1 11,002.4 11,324.3 13,837.4 18,035.8 28,329.3
Consolidated Balance Sheet Particulars FY12 FY13 FY14 FY15 FY16E FY17E Share Capital 16,400.5 16,400.5 16,400.5 16,400.5 16,400.5 16,400.5 Reserves and Surplus 40,600.2 45,637.1 49,311.2 58,779.7 74,558.2 98,642.3 Minority Interest 500.2 452.3 503.2 547.1 695.7 815.7 Long Term Borrowings 87,172.4 88,526.7 89,323.2 80,623.5 143,019.4 137,298.6 Deferred Tax Liabilities 1,291.6 1,524.2 1,932.9 2,929.7 2,561.1 2,998.7 Other Long Term Liabilities 14.0 18.6 18.6 140.0 140.0 140.0 Long Term Provisions 286.4 305.7 309.3 337.7 455.7 533.6 Short Term Borrowings 5,710.1 6,467.6 2,076.9 1,482.2 4,915.1 0.0 Trade Payables 25,288.7 25,678.4 16,405.1 16,393.3 21,708.7 22,662.6 Other Current Liabilities 14,262.2 14,872.1 12,268.5 12,550.7 14,720.7 17,236.3 Short Term Provisions 1,461.7 3,897.8 3,894.5 4,015.6 4,022.8 4,710.3 Total Liabilities 192,988.0 203,781.0 192,443.9 194,200.0 283,197.9 301,438.6
Fixed Assets 146,152.0 148,740.8 142,386.9 136,346.0 219,120.5 216,271.1 Goodwill on Consolidation 294.1 279.9 106.0 96.6 96.6 96.6 Non Current Investments 2,870.8 2,714.2 2,535.0 2,327.2 2,327.2 3,813.8 Long Term Loans and Advances 13,067.9 13,992.2 13,820.6 17,638.7 17,638.7 28,279.1 Other Non Current Assets 490.7 676.9 992.2 1,334.1 1,334.1 1,334.1 Current Investments 2,100.2 6,835.6 6,341.9 13,861.2 13,861.2 18,624.9 Inventories 7,658.4 4,414.7 4,157.7 5,482.6 5,192.5 6,175.9 Trade Receivables 10,639.8 18,487.4 11,976.3 11,722.9 15,664.4 16,370.9 Cash and Bank Balances 6,685.7 3,989.8 5,674.5 3,514.5 4,915.1 5,755.0 Short Term Loans and Advances 1,816.1 2,239.7 2,047.9 1,478.0 1,478.0 2,879.4 Other Current Assets 1,212.3 1,409.8 2,404.9 398.2 1,569.7 1,837.9 Total Assets 192,988.0 203,781.0 192,443.9 194,200.0 283,197.9 301,438.6
Jan. 15, 2016
JSW Energy Ltd.

INITIATING COVERAGE
16
Standalone Financial Statement (Contd…)
Source: Choice Broking Research
Source: Choice Broking Research
BUY
Consolidated Cash Flow Statement Particulars FY12 FY13 FY14 FY15 FY16E FY17E Profit Before Tax 2,125.4 11,857.1 10,600.3 18,920.7 25,626.7 35,454.3 Depreciation / Amortization 5,033.5 6,615.3 8,099.5 7,897.6 8,679.1 10,405.7 Finance Costs 7,172.4 9,627.9 12,059.4 11,374.6 12,080.0 14,465.5 Change in Working Capital 6,322.9 (6,874.0) (4,893.5) 1,321.8 2,419.2 2,714.3 Others 458.4 (1,353.3) (586.5) (1,097.3) (4,853.5) (3,561.3) Tax Expenses (825.8) (2,626.8) (2,588.0) (4,488.9) (5,207.9) (6,205.0) Cash Flow From Operations Activities 20,286.8 17,246.2 22,691.2 33,928.5 38,743.7 53,273.4
Purchase of Fixed Assets (18,832.5) (9,782.5) (4,940.1) (6,772.3) (91,453.6) (7,556.4) Change in Investments (475.5) (1,195.7) (618.6) 1,058.7 0.0 (6,250.3) Change in Loans & Advances 0.0 0.0 0.0 0.0 0.0 (12,041.7) Others 1,106.3 1,537.1 1,933.6 1,506.0 4,119.1 2,761.3 Cash Flow from Investing Activities (18,201.7) (9,441.1) (3,625.1) (4,207.6) (87,334.5) (23,087.0)
Borrowings (Net) 3,570.6 3,818.6 (2,701.1) (8,123.5) 65,828.8 (10,635.8) Finance Costs (7,172.4) (9,627.9) (12,059.4) (11,374.6) (12,080.0) (14,465.5) Dividend Paid (Includes Tax on Dividend) (1,906.2) (953.0) (3,837.6) (3,820.3) (3,757.4) (4,245.2) Others (23.8) (81.8) 7.6 46.2 0.0 0.0 Cash Flow from Financing Activities (5,531.8) (6,844.1) (18,590.5) (23,272.2) 49,991.3 (29,346.5)
Net Cash Flow (3,446.7) 961.0 475.6 6,448.7 1,400.6 839.9 Opening Balance of Cash & Cash Balance 12,202.2 8,755.5 9,716.5 10,192.1 3,514.5 4,915.1 Closing Balance of Cash & Cash Balance 8,755.5 9,716.5 10,192.1 16,640.8 4,915.1 5,755.0
Consolidated Financial Ratios FY12 FY13 FY14 FY15 FY16E FY17E
Profitability & Return Ratios EBITDA Margin (%) 23.8% 31.3% 37.3% 38.6% 42.2% 49.1% PAT Margin (%) 5.4% 12.3% 13.0% 14.8% 18.0% 24.2% RoNW (%) 5.8% 17.6% 17.1% 18.3% 19.7% 24.5% RoCE (%) 6.3% 13.4% 15.3% 17.6% 13.8% 18.4%
Working Capital & Liquidity Ratios Current Ratio (X) 0.7 0.7 0.8 0.6 0.7 0.7 Quick Ratio (X) 0.5 0.6 0.6 0.5 0.5 0.6 Interest Coverage Ratio 1.3 2.2 2.0 2.5 2.8 3.3
Turnover & Leverage Ratios Fixed Asset Turnover (X) 0.4 0.6 0.6 0.7 0.5 0.5 Total Asset Turnover (X) 0.3 0.4 0.5 0.5 0.4 0.4 Debt Equity Ratio (X) 1.6 1.5 1.4 1.1 1.6 1.2 Dividend Pay Out Ratio 0.6 0.1 0.3 0.3 0.2 0.1
Valuation Ratios DPS (Rs.) 1.2 0.6 2.3 2.3 2.3 2.6 BVPS (Rs.) 35.1 38.1 40.4 46.2 55.9 70.7 EPS (Rs. Cr) 2.0 6.7 6.9 8.4 11.0 17.3 P / E (X) 36.0 10.8 10.5 8.6 6.6 4.2 P / BVPS (X) 2.1 1.9 1.8 1.6 1.3 1.0 EV / EBITDA (X) 14.0 7.3 6.1 5.1 5.9 4.0
Jan. 15, 2016
JSW Energy Ltd.