jsia.netjsia.net/3_activity/koryu/english/proceedingsofaic2018.pdfasia impact assessment conference...
TRANSCRIPT

AIC2018The 12th Asia Impact assessment Conference in Shizuoka
“Green Region and Impact Assessment”
IAIA-JapanCity of Shizuoka

Photo:Mt.Fuji-The Heart of Japan. The View from Nihondaira.Provided by Shizuoka City
Steering Committee:Akira TANAKA Sang-Don LEEWei LI

AIC2018The 12th Asia Impact assessment Conference in Shizuoka
“Green Region and Impact Assessment”
IAIA-JapanCity of Shizuoka

Access Map to University of Shizuoka, Japan
N
Registration Desk
Main Gate
N
ⅰ

Floor Map
N
N
ⅱ

Asia Impact Assessment Conference 2018
Welcome to Mt. Fuji Country, Shizuoka, Japan
Akira Tanaka, Dr., MLA
Chairperson of Executive Committee of AIC2018
Professor, School of Environment, Tokyo City University
Welcome to the Asia Impact Assessment Conference 2018 in Shizuoka! I am Akira
Tanaka, chairperson of the executive committee of the AIC2018. I am a professor of
Tokyo City University in the School of Environment, located in Yokohama.
First, I would like to extend my warmest regards to all those who are present today- from
friends from times past to the international participants of the AIC2018 joining us from
various countries. To University of Shizuoka, who has provided us with this wonderful
venue and to all others who have contributed to the success of this conference, I am
grateful for your help and support. Without you, AIC2018 would not have been
possible.
For AIC2018, 130 participants from more than seven nations, including Korea, China,
Thailand, Philippines, Maldives and Japan, will be joining us. Of the 130 participants,
over 80 are from outside of Japan. There will be more than 50 oral presentations and
35 poster presentations. I believe that there are this many international participants
due to global interest in the AIC, combined with the appeal of Shizuoka, the home of the
world heritage site of Mt. Fuji.
Over the course of the following two days, August 20th and the 21st, oral and poster
presentations will be held at University of Shizuoka, and for the evening of the 21st, we
will have a banquet at Nippondaira Hotel, from which we will have the perfect view of Mt.
Fuji (depending on the weather). There, we will have prepared for you a fantastic meal
made from local ingredients of the Shimizu Ward and City of Shizuoka. I hope that you
will enjoy the special cuisine of the region while getting to know each other. Finally, on
ⅲ

the 22nd, there will be a technical visit by bus. During this time, we will tour the history
and culture of Shimizu and Shizuoka, starting with the best view point of Mt. Fuji.
Now, the AIC was proposed by the International Exchange Committee of the Society for
Impact Assessment in Japan, and the first AIC was held between Japan and Korea in
2003 in Tokyo. The aim was the academic and technological exchange of
environmental policies and technologies, with a focus on the field of environmental
impact assessment. Afterwards, conferences were held between Japan and Korea,
with the location alternating between the two nations. From the sixth conference,
China became a member, and conferences were assembled with these members until
the 10th conference. From 2017, Vietnam became a participant as well, and the
conference was hosted in Da Nang, Vietnam.
This 15th year is the memorable 12th anniversary of the conference, and the aim is the
exchange within the field of environmental impact assessment in Asia. And so, the
conference has been renamed from the names of the four original member countries to
the “Asia Impact assessment Conference (AIC)”. With the theme of “Green Region
and Impact Assessment,” which is relevant on the local, regional, and global levels, it
has been decided that this year’s conference will be held in Shizuoka, Japan, the home
of the world-famous Mt. Fuji. As an original member of this conference and a native to
Shimizu Ward, Shizuoka Prefecture, I am overjoyed to host this conference here today.
I would like to conclude this address with my hopes for this meeting. I have a strong
wish that this conference will reap great benefits for environmental policies and
technologies, beginning with environmental impact assessment, and serve as an
opportunity to both renew old friendships and be blessed with new ones. Finally, I
hope to see you again in good health and happiness.
Thank you very much.
ⅳ

ⅴ

AIC2018 in Shizuoka “Green Region and Impact Assessment”
❖ContentsConference Schedule ....................................................... 1
Program ........................................................................... 7Session Program .............................................................. 9List of Posters ................................................................ 19
Abstracts ........................................................................ 25Opening Plenary Abstract ................................................................ 27Session Abstracts ........................................................... 28Poster Abstracts ............................................................. 79
List of Participants ...................................................... 113Sponsors ....................................................................... 121
ⅵ

ⅶ
AIC2018 in Shizuoka “Green Region and Impact Assessment”
❖Conference Schedule
1

2

3
Day 1 Monday, August 20Time Contents Place 8:00~ Registration Desk Open Entrance of Main Hall
9:00~
9:40
<Opening Plenary> Mitsuru TANAKA (Chairperson of JSIA)
Nobuhiro TANABE(Mayor of Shizuoka)
Sang-Don LEE (Korea)
Wei LI (China)
Hiroshi KITO(President of the University of Shizuoka)
<Special Lecture>
Kazuyoshi YAMADA
(Museum of Natural and Environmental History, Shizuoka)
The Nature of Shizuoka - from Mount Fuji to Suruga Bay -
Main Hall
9:40~
10:10 Taking commemorative photograph
Main Hall
10:10~
10:30 Coffee break / Round table
Lobby at Main Hall
10:30~
12:30
Theme Forum : “Green Region and Impact Assessment”
Co-Chairpersons: Akira TANAKA, Shirley LEE
1. Akira TANAKA (Tokyo City University)Green Region and the Role of SEA/EIAs
2. Shintaro MURAI (Ministry of the Environment, Japan)EIA system and its Implementation in Japan
3. Hidefumi KURASAKA (Chiba University)“Sustainable Zone" - Regional economic indicators
on self-sufficiency of food and energy” 4. Sang-Don LEE (Ewha Womans University)
Application of HEP for maximizing habitat value in theprocess of road construction
5. Seiji ARAI (Japan Association of Environment Assessment)
Study on introduction of biodiversity offset in Japan
Main Hall

4
Day 2 Tuesday, August 21Time Contents Place 8:00~ Registration Desk Open Entrance of Main Hall
8:30~
9:55
Oral presentation session (A-3, B-3)
Presentation 12min each, Q&A 3min
Main Hall /
Sub Hall
9:55~
10:30 Poster session 2 & Coffee break / Round table
1st / 2nd Lobby
10:30~
11:55
Oral presentation session (A-4, B-4)
Presentation 12min each, Q&A 3min
Main Hall /
Sub Hall
11:55~
13:05 Lunch break
A bento-box lunch will
be provided at Student
Hall
13:05~ Oral presentation session (A-5, B-5) Main Hall /
6. Wei LI (Beijing Normal University)Promoting green development of the resource-basedcities in China by integrating the three-line model intoSEA
7. Takahito NIWA (EX Research Institute Ltd.)Proposal towards the Creation of General Policy forMainstreaming of Biodiversity in Japan
12:30~
13:40 Lunch / Coffee Break
A bento-box lunch will be
provided at Student Hall
13:40~
14:50
Oral Presentation Session (A-1, B-1)
Presentation 12min each, Q&A 3min
Main Hall /
Sub Hall
14:50~
15:40 Poster session 1 & Coffee break / Round table 1st / 2nd Floor Lobby
15:40~
16:50
Oral Presentation Session (A-2, B-2)
Presentation 12min each, Q&A 3min
Main Hall /
Sub Hall
16:50~
17:00 Announcements
Main Hall /
Sub Hall
17:00 Break up Main Hall /
Sub Hall

5
14:15 Presentation 12min each, Q&A 3min Sub Hall
14:15~
15:30 Poster session 3 & Coffee break / Round table
1st / 2nd floor of Lobby
15:30~
15:40 Moving to Main Hall for Closing Plenary
15:40~
16:00
<Closing Plenary> Jong-Gwan JUNG
Shirley LEE
Sachihiko HARASHINA
Main Hall
16:00~
16:20 Announcements
Main Hall
Banquet (Nippondaira Hotel, August 21) 16:20~
17:00 Moving to Nippondaira Hotel by Shuttle bus
17:00~
17:15 Banquet reception desk open
Nippondaira Hotel
17:15~
17:30 Taking commemorative photograph
1st floor of
Nippondaira Hotel
Banquet room:
Room “Fuji”
17:30~
19:30
<Banquet> Tsuyoshi TAKAGI
(City of Shizuoka Shimizu Ward Director)
Akira TANAKA (Tokyo City University)
Host country representative of next year
1st floor of
Nippondaira Hotel
Banquet room:
Room “Fuji”
19:30~
20:15 Moving to Shizuoka Station by Shuttle bus
JR Shizuoka Station
20:15 Break up JR Shizuoka Station

6
Day 3 Wednesday, August 22Technical Visit Preregistration is required.
8:00 : Get together at Front of SURUGA Bank (near the JR Shizuoka
Station SOUTH Gate)
8:30~17:00 : A full day of eco tour opportunities to visit Mt.Fuji viewpoints
and Japanese natural and historical sites in Shizuoka
17:00 : Break up at JR Shizuoka Station
Location of Place of getting together
Shizuoka Station (South Gate)
Shizuoka Station (North Gate)
Place of getting together

AIC2018 in Shizuoka “Green Region and Impact Assessment”
❖ProgramSession Program ....................................................................... 9
List of Posters ......................................................................... 19
Each serial number of abstracts is the same as that of the session.
7

8

Sess
ion
Prog
ram
Day
1 M
onda
y, A
ugus
t 20 A
: Mai
n H
all
Tim
e Se
ssio
n N
o.
Pres
ente
r / T
itle
A-0
-The
me
Foru
m-
“Gre
en R
egio
n an
d Im
pact
Ass
essm
ent”
Co-
Cha
irper
sons
: Aki
ra T
AN
AK
A, S
hirle
y LE
E
10:3
0~
10:4
2 1
Akira
TAN
AKA,
Tok
yo C
ity U
nive
rsity
(Jap
an)
Gre
en R
egio
n an
d th
e R
ole
of S
EA/E
IAs
10:4
2~
10:5
9 2
Shin
taro
MU
RAI
, Min
istry
of t
he E
nviro
nmen
t, Ja
pan
(Jap
an)
EIA
syst
em a
nd it
s Im
plem
enta
tion
in J
apan
10:5
9~
11:1
1 3
Hid
efum
i KU
RAS
AKA,
Chi
ba U
nive
rsity
(Jap
an)
"Sus
tain
able
Zon
e" -
Reg
iona
l eco
nom
ic in
dica
tors
on
self-
suffi
cien
cy o
f foo
d an
d en
ergy
11:1
1~
11:2
3 4
Sang
-Don
LEE
, Ew
ha W
oman
s U
nive
rsity
(Kor
ea)
App
licat
ion
of H
EP fo
r max
imiz
ing
habi
tat v
alue
in th
e pr
oces
s of
road
con
stru
ctio
n
11:2
3~
11:3
5 5
Seiji
ARAI
, Gin
ko T
SUJI
SAKA
, Aki
hiko
MAT
SUO
KA, K
oich
i ID
E, S
hogo
OG
ASAW
ARA,
Yas
uhiro
KAT
O, Y
oshi
fum
i SAI
KI, T
aro
SHIR
OM
OTO
, Yuk
i TO
GO
, Tad
ashi
NIS
HIZ
AWA,
Yos
hihi
ro H
OR
I, C
hika
ko W
ATAN
ABE,
Yos
uke
WAT
ANAB
E, T
akaf
umi
KAW
AMU
RA,
Aya
ka M
ATSU
MIY
A, M
asak
azu
AOSH
IMA,
Shi
nji O
DA,
Kiy
ohar
u YO
SHIZ
AWA,
Aki
ra T
ANAK
A,
Japa
n As
soci
atio
n of
Env
ironm
ent A
sses
smen
t (Ja
pan)
St
udy
on in
trod
uctio
n of
bio
dive
rsity
offs
et in
Jap
an
11:3
5~
11:4
7 6
Wei
LI,
Beijin
g N
orm
al U
nive
rsity
(Chi
na)
Prom
otin
g gr
een
deve
lopm
ent o
f the
reso
urce
bas
ed c
ities
in C
hina
by
inte
grat
ing
the
thre
e-lin
e m
odel
into
SEA
11:4
7~
11:5
9 7
Taka
hito
NIW
A, E
X R
esea
rch
Inst
itute
Ltd
(Jap
an)
Prop
osal
tow
ards
the
Cre
atio
n of
Gen
eral
Pol
icy
for M
ains
trea
min
g of
Bio
dive
rsity
in J
apan
9

A : M
ain
Hal
l B
: Su
b H
all
Tim
e Se
ssio
n N
o.
Pres
ente
r / T
itle
Sess
ion
No.
Pr
esen
ter /
Titl
e
11:5
9~
12:3
0 A
-0Q
&A
, Dis
cuss
ion
12:3
0~
13:4
0 Lu
nch
Bre
ak
A-1
Co-
chai
rper
sons
: W
ei L
I, N
aoko
GEN
JID
A
B-1
Co-
chai
rper
sons
: K
iichi
ro H
AYA
SHI,
Myu
ngjin
KIM
13:4
0~
13:5
7
1 Yo
ichi
KUM
AGAI
(Jap
an)
Gre
en c
ity-r
egio
ns: C
riter
ia fo
r sus
tain
abili
ty
asse
ssm
ent
<K
eyw
ords
> gr
een,
city
-regi
on, s
usta
inab
ility,
ass
essm
ent,
crite
ria
1 Ku
ltip
SUW
ANTE
EP (K
orea
) Im
prov
emen
t of E
SC m
onito
ring
syst
em a
nd it
s re
port
by
anal
ysis
on
JIC
A’s
proj
ects
as
case
stu
dy
<Key
wor
ds>
Im
prov
emen
t, M
onito
ring
repo
rt, A
naly
sis,
Ef
fect
iven
ess,
Env
ironm
enta
l and
Soc
ial C
onsi
dera
tion
13:5
7~
14:1
4
2 Sh
irley
LEE
(Chi
na)
EIA
and
Gre
en R
egio
ns fo
r Rai
lway
Pro
ject
s in
H
ong
Kon
g <K
eyw
ords
> Ec
olog
ical
Com
pens
atio
n, E
IA, A
lignm
ent
sele
ctio
n, C
onst
ruct
ion
met
hod
sele
ctio
n, P
ublic
pa
rtici
patio
n
2 Ay
aka
YASU
MO
TO, T
akeh
iko
MU
RAY
AMA,
Shi
geo
NIS
HIK
IZAW
A (J
apan
) A
naly
sis
of M
onito
ring
Rep
orts
for I
nfra
stru
ctur
e D
evel
opm
ent P
roje
cts
thro
ugh
Dev
elop
men
t A
ssis
tanc
e <K
eyw
ords
> En
viro
nmen
tal A
sses
smen
t, En
viro
nmen
tal a
nd S
ocia
l C
onsi
dera
tions
, Dev
elop
men
t Ass
ista
nce,
Mon
itorin
g 14
:14~
14:3
1
3 Ta
kafu
mi K
AWAM
UR
A, A
kira
TAN
AKA
(Jap
an)
Polic
y re
sear
ch o
f Pho
to-v
olta
ic p
ower
ge
nera
tion
and
Bio
dive
rsity
con
serv
atio
n in
th
e Iz
u-pe
nins
ula
<Key
wor
ds>
G
reen
Reg
ion,
Pho
tovo
ltaic
gen
erat
ion,
EIA
, W
ater
shed
, Izu
-pen
insu
la
3 Xi
angl
an Y
U (C
hina
) Th
e ap
plic
atio
n an
d pr
ospe
ct o
f CPT
ED th
eory
in
the
urba
n pl
anni
ng
<Key
wor
ds>
EIA
Act,
CPT
ED, C
rime
Prev
entio
n, U
rban
Pla
nnin
g
A : M
ain
Hal
l B
: Su
b H
all
10

Tim
e Se
ssio
n N
o.
Pres
ente
r / T
itle
Sess
ion
No.
Pr
esen
ter /
Titl
e
14:3
1~
14:4
8
A-1
4 Ka
i TIA
N, Y
anw
ei Z
HAO
(Chi
na)
Con
stru
ctio
n an
d A
pplic
atio
n of
the
Com
preh
ensi
ve A
sses
smen
t Met
hod
for t
he
Ecol
ogic
al E
nviro
nmen
tal I
mpa
ct o
f Tr
ansm
issi
on P
roje
cts
<Key
wor
ds>
EIA,
Tra
nsm
issi
on P
roje
cts,
Com
preh
ensi
ve
Asse
ssm
ent,
Land
scap
e, E
cosy
stem
, Sen
sitiv
e ar
ea
B-1
4 Si
yang
ZH
OU
, Wei
LI (
Chi
na)
A st
udy
on in
tegr
ated
dia
gnos
is m
etho
d of
re
sour
ces-
envi
ronm
ent-
econ
omy
for i
ndus
tria
l pa
th d
epen
denc
e in
min
eral
reso
urce
-bas
ed c
ities
an
d its
app
licat
ion:
bas
ed o
n th
e im
prov
ed C
-D
prod
uctio
n fu
nctio
n <K
eyw
ords
> co
bb-D
ougl
as
prod
uctio
n fu
nctio
n,
min
eral
re
sour
ce-b
ased
ci
ties,
in
dust
rial
path
de
pend
ence
, in
tegr
ated
dia
gnos
is, m
argi
nal r
even
ue
14:4
8~
15:4
0 Po
ster
Ses
sion
& C
offe
e B
reak
A-2
Co-
chai
rper
sons
:San
g-D
on L
EE, H
idef
umi K
UR
ASA
KA
B-2
Co-
chai
rper
sons
: Ya
nwei
ZH
AO
, Aki
ko U
RA
GO
15:4
0~
15:5
7
1 To
mok
i WAS
HIO
,Hid
eyuk
i ITO
, Tak
ahiro
FU
JII
(Jap
an)
Ana
lysi
s of
Fac
tors
to C
ause
Hok
kaid
o Si
ka
Dee
r-Ve
hicl
e C
ollis
ions
- C
ase
Stud
y of
N
atio
nal R
oute
45
- <K
eyw
ords
>
Roa
d-ki
ll, D
eer-V
ehic
le C
ollis
ions
, Tra
ffic
Acci
dent
s, R
oad
Ecol
ogy,
Reg
ress
ion
Anal
ysis
,Tra
nspo
rtatio
n an
d En
viro
nmen
ts,
Hok
kaid
o Si
ka D
eer (
Cer
vus
nipp
on y
esoe
nsis
)
1 Jo
ng-G
wan
JU
NG
(Kor
ea)
An
Initi
ativ
e of
SEA
for t
he L
ocal
Ene
rgy
Tran
sitio
n <K
eyw
ords
>
Ener
gy T
rans
ition
, SEA
, sce
nario
, par
ticip
ator
y pl
anni
ng
A : M
ain
Hal
l B
: Su
b H
all
11

Tim
e Se
ssio
n N
o.
Pres
ente
r / T
itle
Sess
ion
No.
Pr
esen
ter /
Titl
e
15:5
7~
16:1
4
A-2
2 M
yeon
g-je
KIM
, Hye
In C
HU
NG
, Jin
hoo
HW
ANG
, Ju
nhee
LEE
, Yu-
youn
g C
HO
I, Ji
eun
RYU
and
Se
ong-
Woo
JEO
N, (
Kore
a)
Und
erst
andi
ng a
nd P
redi
ctin
g N
DVI
spa
tial
patte
rn w
ith c
limat
e an
d to
pogr
aphi
cal
varia
bles
usi
ng G
WR
<K
eyw
ords
>
GW
R, N
DVI
, clim
ate
varia
bles
, top
ogra
phic
al
varia
bles
, spa
tial a
utoc
orre
latio
n, M
oran
’s I
B-2
2 Ke
isuk
e G
OTO
, Aki
ra T
ANAK
A (J
apan
) C
ompa
rativ
e St
udy
on T
ierin
g in
Str
ateg
ic
Envi
ronm
enta
l Ass
essm
ents
in J
apan
and
the
Uni
ted
Stat
es
<Key
wor
ds>
Ti
erin
g, S
EA, P
olic
y, P
lan,
Pro
gram
16:1
4~
16:3
1
3 Ko
ji AIN
OTA
, Aki
ra T
ANAK
A (J
apan
) Fu
ture
Pot
entia
l of S
ound
scap
e M
onito
ring
in
Urb
an G
reen
ery
<Key
wor
ds>
so
unds
cape
, bio
dive
rsity
, mon
itorin
g, u
rban
, gr
eene
ry
3 Q
ihui
ZH
ANG
, Xia
nqia
ng M
AO (C
hina
) To
tal f
acto
r pro
duct
ivity
ana
lysi
s co
nsid
erin
g en
viro
nmen
t and
ene
rgy
fact
ors
<Key
wor
ds>
To
tal f
acto
r pro
duct
ivity
; env
ironm
ent;
ener
gy; D
EA;
EKC
16
:31~
16:4
8
4 Ki
ichi
ro H
AYAS
HI (
Japa
n)
Con
serv
atio
n Pr
iorit
y M
appi
ng o
f For
est
Ecos
yste
m S
ervi
ces
in th
e C
ase
of N
agoy
a,
Japa
n <K
eyw
ords
>
Ecos
yste
m S
ervi
ce, B
iodi
vers
ity, S
EA, J
apan
, C
onse
rvat
ion
Map
4 Ke
ntar
o N
AKAM
UR
A ,K
enic
hiro
YAN
AGI,
Eiji
KOM
ATSU
and
Aki
hiro
NAK
AMU
RA
(Jap
an)
Stra
tegi
c En
viro
nmen
tal A
sses
smen
t Fra
mew
ork
for C
arbo
n C
aptu
re a
nd S
tora
ge in
Jap
an
<Key
wor
ds>
Car
bon
Cap
ture
and
Sto
rage
(CC
S), S
EA,
Envi
ronm
enta
l law
, Clim
ate
chan
ge, L
ong-
term
liab
ility
12

Day
2 Tu
esda
y, A
ugus
t 21
A : M
ain
Hal
l B
: Su
b H
all
Tim
e Se
ssio
n N
o.
Pres
ente
r / T
itle
Sess
ion
No.
Pr
esen
ter /
Titl
e
A-3
Co-
chai
rper
sons
: M
itsur
u TA
NA
KA
, Koj
i AIN
OTA
B-3
Co-
chai
rper
sons
: Yo
ungs
oo L
EE, H
iroo
KA
SAG
I
8:30
~
8:47
1 Ta
kehi
ko M
UR
AYAM
A (J
apan
) Ex
perie
nces
of a
dvis
ory
pane
l on
envi
ronm
enta
l and
soc
ial c
onsi
dera
tion
in
JIC
A
<Key
wor
ds>
Envi
ronm
enta
l and
soc
ial c
onsi
dera
tion,
D
evel
opm
ent A
ssis
tanc
e, In
frast
ruct
ure
proj
ect
1 Ta
kum
i NAG
ASH
IMA,
Tak
ehik
o M
UR
AYAM
A, A
tsus
hi
NAG
AOKA
, and
Shi
geo
NIS
HIK
IZAW
A (J
apan
) G
eoth
erm
al D
evel
opm
ent P
oten
tial E
valu
atio
n C
onsi
derin
g En
viro
nmen
tal a
nd S
ocia
l Con
ditio
ns
<Key
wor
ds>
R
enew
able
Ene
rgy
Pote
ntia
l, G
eoth
erm
al
Dev
elop
men
t, G
IS, E
nerg
y Po
licy,
Soc
iacc
epta
bilit
y
8:47
~
9:04
2 N
aoyu
ki S
AKU
MO
TO (J
apan
) So
cial
Impa
cts
and
the
Hum
an R
ight
s A
ppro
ach
in A
sia
<Key
wor
ds>
EIA/
SEA,
soc
ial c
onsi
dera
tions
, hum
an ri
ghts
, SD
Gs,
Aar
hus
Con
vent
ion,
UN
Gui
ding
Prin
cipl
es
on B
usin
ess
and
Hum
an R
ight
s
2 Ka
iwen
JI,
Shig
eo N
ISH
IKIZ
AWA,
and
Tak
ehik
o M
UR
AYAM
A (J
apan
) R
esea
rch
on C
omm
unity
Acc
epta
nce
of th
e W
oody
B
iom
ass
Pow
er P
lant
<K
eyw
ords
>
Biom
ass,
Com
mun
ity A
ccep
tanc
e, E
nviro
nmen
tal
Impa
ct, C
ompl
aint
, Ann
oyan
ce
9:04
~
9:21
3 Ka
oru
AKAH
OSH
I, Sh
unsu
ke H
IED
A, N
aoko
G
ENJI
DA
(Jap
an)
EIA
impl
emen
tatio
n an
d ch
alle
nges
in
Mya
nmar
- Su
rvey
with
pos
sibl
e su
ppor
t fro
m
Japa
n <K
eyw
ords
>
EIA,
Bila
tera
l Coo
pera
tion,
Cap
acity
Bui
ldin
g,
Mya
nmar
, Jap
an
3 Sa
chih
iko
HAR
ASH
INA,
Yur
ika
AYU
KAW
A (
Japa
n)
Sust
aina
ble
Ener
gy a
nd S
DG
s - F
rom
the
first
R
E100
uni
vers
ity in
Jap
an-
<Key
wor
ds>
R
enew
able
Ene
rgy,
R
E100
, Nat
ural
Ene
rgy,
H
eart-
war
e
13

A : M
ain
Hal
l B
: Su
b H
all
Tim
e Se
ssio
n N
o.
Pres
ente
r / T
itle
Sess
ion
No.
Pr
esen
ter /
Titl
e
9:21
~
9:38
A-3
4 Ji
anho
ng L
U, Z
heng
yan
LIU
, Pen
g SO
NG
,Xia
nqia
ng M
AO (C
hina
) En
viro
nmen
tal a
nd e
cono
mic
impa
cts
of “
the
Bel
t and
Roa
d In
itiat
ive”
on
typi
cal c
ount
ries
alon
gsid
e <K
eyw
ords
>
“the
Belt
and
Roa
d In
itiat
ive”
, tra
de p
olic
y,
Envi
ronm
enta
l Im
pact
Ass
essm
ent,
GTA
P m
odel
, NTB
s re
duct
ion
B-3
4 H
yung
seok
PAR
K, S
ewoo
ng C
HU
NG
, Sun
gjin
KIM
, Eu
nju
LEE
(Kor
ea)
The
rela
tion
betw
een
ther
mal
str
atifi
catio
n st
reng
th
and
carb
on c
ycle
in a
str
atifi
ed re
serv
oir
<Key
wor
ds>
Car
bon
cycl
e, G
HG
s, L
ake
num
ber,
Lake
Ana
lyze
r, Sc
hmid
t sta
bilit
y
9:38
~
9:55
5 R
ui H
UAN
G (C
hina
) A
Com
para
tive
Stud
y of
EIA
Sys
tem
Bet
wee
n C
hina
and
Vie
tnam
: Bio
dive
rsity
and
Clim
ate
Fact
ors
into
Gre
en O
ne B
elt O
ne R
oad
Initi
ativ
e <K
eyw
ords
> EI
A Sy
stem
, Com
para
tive
Stud
y, B
iodi
vers
ity,
Clim
ate
Fact
ors,
Gre
en O
ne B
elt O
ne R
oad
Initi
ativ
e
5 Ju
n O
TSU
KA, H
idey
uki I
TO, T
akah
iro F
UJI
I (Ja
pan)
C
ompa
rativ
e A
naly
sis
of E
ffort
s fo
r Env
ironm
ent
Con
serv
atio
n by
Tra
vel C
ompa
nies
on
Ecot
our w
ith
Acc
omm
odat
ion
betw
een
Japa
n an
d A
ustr
alia
<K
eyw
ords
> To
uris
m, E
coto
uris
m, E
co C
ertif
icat
ion
Prog
ram
, Tou
r O
pera
tion,
Acc
omm
odat
ion,
Aus
tralia
, Jap
an
9:55
~
10:3
0 Po
ster
Ses
sion
& C
offe
e B
reak
A-4
Co-
chai
rper
sons
: Ta
kehi
ko M
UR
AYA
MA
, Ren
zhi L
IU
B-4
Co-
chai
rper
sons
: Jo
ng-G
wan
g JU
NG
, Nao
yuki
SAK
UM
OTO
10:3
0~
10:4
7
1 Yu
ki S
HIR
OTA
, Aki
ra T
ANAK
A (J
apan
) Su
rvey
on
tren
ds o
f Gre
en In
fras
truc
ture
and
fu
ture
pro
spec
ts in
Jap
an
<Key
wor
ds>
Gre
en In
frast
ruct
ure,
bio
dive
rsity
, Eco
logi
cal
netw
ork,
mul
ti-fu
nctio
n, s
torm
wat
er m
anag
emen
t
1 Ji
ng L
IU, R
enzh
i LIU
(Chi
na)
A B
ayes
ian
App
roac
h to
Inte
grat
ed E
colo
gica
l and
H
uman
Hea
lth R
isk
Ass
essm
ent o
f Acc
iden
tal
Wat
er P
ollu
tion
in W
ater
shed
Sca
le
<Key
wor
ds>
acci
dent
al w
ater
pol
lutio
n; B
ayes
ian
netw
orks
; int
egra
ted
risk
anal
ysis
; unc
erta
inty
; wat
ersh
ed-s
cale
14

A : M
ain
Hal
l B
: Su
b H
all
Tim
e Se
ssio
n N
o.
Pres
ente
r / T
itle
Sess
ion
No.
Pr
esen
ter /
Titl
e
10:4
7~
11:0
4
A-4
2 Te
tsuy
a KA
MIJ
O (J
apan
) Po
sitiv
e co
rrel
atio
n be
twee
n di
scus
sion
of
alte
rnat
ives
and
pub
lic in
volv
emen
t <K
eyw
ords
>
Alte
rnat
ives
, pub
lic in
volv
emen
t, qu
antit
ativ
e te
xt
anal
ysis
, pos
itive
cor
rela
tion,
min
utes
of m
eetin
gs
B-4
2 M
asah
iro T
OKU
MU
RA,
Mak
oto
SEKI
NE,
Moh
amm
ad
RAK
NU
ZZAM
AN, M
d H
abib
ulla
h Al
MAM
UN
, Md
Kaw
ser A
HM
ED, M
uham
mad
Raf
iqul
ISLA
M, Y
uich
i M
IYAK
E, T
akas
hi A
MAG
AI, S
hige
ki M
ASU
NAG
A,
Mas
akaz
u M
AKIN
O (J
apan
) Fe
asib
ility
of Q
uant
itativ
e Im
age
Ana
lysi
s M
etho
dto
Impr
ove
Perf
orm
ance
s of
Ars
enic
Fie
ld T
est K
itfor
Sc
reen
ing
of T
ube
Wel
l Wat
ers
in B
angl
ades
h <K
eyw
ords
>
Arse
nic,
Ban
glad
esh,
drin
king
wat
er, a
naly
sis,
sc
reen
ing
11:0
4~
11:2
1
3 N
amw
ook
CH
O, M
oung
-Jin
LEE
(Kor
ea)
A St
udy
on th
e Sc
ient
ific
Ass
essm
ent o
f En
viro
nmen
tal I
mpa
ct th
roug
h th
e D
ata
Bas
ed
Ass
essm
ent
<Key
wor
ds>
Envi
ronm
enta
l Dat
a, G
IS, A
rchi
ves,
Dat
a Pu
blis
hing
Fra
mew
ork,
Dat
a Sc
ienc
e
3 Jo
ng H
o LE
E, S
ungr
yong
HA
(Kor
ea)
Inte
grat
ed C
ontr
ol o
f Pol
luta
nts
in K
orea
<K
eyw
ords
> In
tegr
ated
Con
trol o
f Pol
luta
nts,
Inte
grat
ed
Envi
ronm
enta
l Man
agem
ent
11:2
1~
11:3
8
4 To
mok
o KA
KU, Y
ohei
SU
ZUKI
(Jap
an)
Stak
ehol
der E
ngag
emen
t in
Envi
ronm
enta
l Im
pact
Ass
essm
ent:
Urb
an R
ailw
ay P
roje
ct in
Sr
i Lan
ka
<Key
wor
ds>
EIA,
Sta
keho
lder
Eng
agem
ent,
Alte
rnat
ive
Anal
ysis
, Pro
tect
ed A
rea,
JIC
A
4 Q
i WAN
G, M
asah
iro T
OKU
MU
RA,
Yui
chi M
IYAK
E,
Taka
shi A
MAG
AI (C
hina
) En
viro
nmen
tal i
mpa
ct o
f hal
ogen
ated
pol
ycyc
lic
arom
atic
hyd
roca
rbon
s em
itted
from
E-w
aste
re
cycl
ing
activ
ities
in V
ietn
am
<Key
wor
ds>
hal
ogen
ated
pol
ycyc
lic a
rom
atic
hyd
roca
rbon
s (X
PAH
s), E
-was
te re
cycl
ing,
ope
n bu
rnin
g, P
OPs
A : M
ain
Hal
l B
: Su
b H
all
15

Tim
e Se
ssio
n N
o.
Pres
ente
r / T
itle
Sess
ion
No.
Pr
esen
ter /
Titl
e
11:3
8~
11:5
5
A-4
5 M
izuk
i KAN
AI, A
kira
TAN
AKA
(Jap
an)
Stud
y on
tim
ing
to p
rote
ct e
ndan
ger s
peci
es in
EI
A
<Key
wor
ds>
Biod
iver
sity
, EIA
, LC
ES, E
ndan
gere
d sp
ecie
s,
Miti
gatio
n
B-4
5 M
itsur
u TA
NAK
A, K
ensh
i BAB
A, a
nd M
akot
o O
GAW
A (J
apan
) C
limat
e C
hang
e A
dapt
atio
n St
rate
gies
in J
apan
and
Su
gges
tions
to E
IA S
yste
m
<Key
wor
ds>
C
limat
e C
hang
e, A
dapt
atio
n, L
ocal
Gov
ernm
ent,
EIA
11:5
5~
13:0
5 Lu
nch
Bre
ak
A-5
Co-
chai
rper
sons
: Yo
ichi
KU
MA
GA
I, Yu
ki S
HIB
ATA
B-5
Co-
chai
rper
sons
: Jo
ng H
o LE
E, S
achi
hiko
HA
RA
SHIN
A
13:0
5~
13:2
2
1 N
atha
sith
CH
IAR
AWAT
CH
AI, T
hana
korn
ERM
UKD
AKU
L, W
oraw
ut H
AMAR
N, K
anat
ip
RAT
ANAC
HO
O (T
haila
nd)
The
2st P
TT’s
Str
ateg
ic E
nviro
nmen
tal
Ass
essm
ent (
SEA
) for
Eas
tern
Eco
nom
ic
Cor
ridor
of I
nnov
atio
n (E
ECi)
Proj
ect,
THA
ILA
ND
<Key
wor
ds>
East
ern
Econ
omic
Cor
ridor
(EEC
), Ea
ster
n
Econ
omic
Cor
ridor
of I
nnov
atio
n (E
ECi),
Envi
ronm
enta
l Im
pact
Ass
essm
ent (
EIA)
,
Stra
tegi
c En
viro
nmen
tal A
sses
smen
t (SE
A),
Sust
aina
ble
Dev
elop
men
t
1 Ko
suke
MU
RAM
ATSU
, Hiro
shi A
IUC
HI,
Yuta
GO
RO
,
Mas
ahiro
TO
KUM
UR
A,
Qi W
ANG
, Tak
anor
i AM
BO, M
asak
azu
MIN
AGAW
A,
Ryu
taro
ISH
IBAS
HI,
Yuic
hi M
IYAK
E, T
akas
hi A
MAG
AI,M
asak
azu
MAK
INO
(Jap
an)
Dec
olor
izat
ion
of C
olor
ed E
fflue
nt fr
om T
extil
e
Man
ufac
turin
g In
dust
ry in
Ban
glad
eshi
by
Phot
o-Fe
nton
Rea
ctio
n C
oupl
ed w
ith C
atal
yst
<Key
wor
ds>
Phot
o-Fe
nton
Rea
ctio
n, C
atal
yst,
Dec
olor
izat
ion,
Col
ored
Effl
uent
, Was
tew
ater
Tre
atm
ent
A : M
ain
Hal
l B
: Su
b H
all
16
Tim
e Se
ssio
n N
o.
Pres
ente
r / T
itle
Sess
ion
No.
Pr
esen
ter /
Titl
e
13:2
2~
13:3
9
A-5
2 Sh
ingo
TAK
EDA,
Tak
ehik
o M
UR
AYAM
A , S
hige
o
NIS
HIK
IZAW
A (J
apan
)
Soci
al C
onsi
dera
tions
for C
oral
Offs
et in
Vanu
atu
<Key
wor
ds>
Miti
gatio
n H
iera
rchy
, Cor
al, B
iodi
vers
ity O
ffset
,
Soci
al C
onsi
dera
tion,
Van
uatu
B-5
2 Yo
ungs
oo L
EE, S
ang-
Ki C
HO
I (Ko
rea)
Crit
eria
for H
ealth
Impa
ct A
sses
smen
t in
Inte
grat
ed
Pollu
tion
Prev
entio
n an
d C
ontr
ol in
Kor
ea
<Key
wor
ds>
IPPC
, HIA
, Crit
eria
13:3
9~
13:5
6
3 H
iroo
KASA
GI,
Akik
o U
RAG
O (J
apan
)
Un-
sust
aina
ble
info
rmat
ion
disc
losu
re a
nd
arch
ives
of t
he E
IA d
ocum
ents
in J
apan
<Key
wor
ds>
EIA
Arch
ives
EIA
dat
abas
e In
form
atio
n di
sclo
sure
EIA
Law
3 H
irota
ka N
AITO
U, Y
ukin
ori T
ANI,
Kous
ke T
OSH
IKI,
Jeon
g-So
o YU
, Erd
ened
alai
BAA
TAR
, Cho
ijilsu
ren
BUYA
NTO
GTO
KH, T
sere
ndor
j JAV
ZAN
DO
LGO
R,
Bolo
rchu
luun
SH
UKH
EE (J
apan
) Su
rvey
of L
ead
pollu
tion
caus
ed b
y m
otor
izat
ion
in
Ula
anba
atar
<K
eyw
ords
> M
ongo
lia, l
ead
pollu
tion,
Blo
od le
ad, m
otor
izat
ion,
liv
esto
ck h
ealth
A : M
ain
Hal
l B
: Su
b H
all
17

Tim
e Se
ssio
n N
o.
Pres
ente
r / T
itle
Sess
ion
No.
Pr
esen
ter /
Titl
e
13:5
6~
14:1
3
A-5
4 Xi
anqi
ang
MAO
, Mud
an W
ANG
and
Men
gyua
n
LIU
(Chi
na)
Co-
Con
trol
Pot
entia
l of S
ubst
itutin
g
Hyd
ropo
wer
for F
ossi
l Fue
ls: A
Cas
e St
udy
in
Sich
uan,
Chi
na
<Key
wor
ds>
hydr
opow
er, c
o-co
ntro
l effe
ct, e
nerg
y su
bstit
utio
n,
emis
sion
redu
ctio
n, S
ichu
an
B-5
4 Ji
axua
n C
HEN
, Run
he C
HEN
G, a
nd W
ei L
I (C
hina
)
Met
hod
and
appl
icat
ion
on o
vera
ll al
loca
tion
of
spac
e an
d in
dust
ry fo
r urb
an in
dust
rial t
otal
atm
osph
eric
pol
luta
nt e
mis
sion
<Key
wor
ds>
urba
n at
mos
pher
ic p
ollu
tion,
tota
l ind
ustri
al e
mis
sion
,
over
all a
lloca
tion,
spa
tial d
istri
butio
n, le
adin
g in
dust
ries
14:1
3~
15:3
0 Po
ster
Ses
sion
& C
offe
e B
reak
18

List of PostersNo. Title & Keywords Name
P-1 Estimation of WTP for transparent noise-barriers by using CVM
<Keywords> CVM, WTP, transparent noise-barrier
In-Chul BAE, Chung-Ki LEE (Korea)
P-2 Mission and Activities of the KSEIA
<Keywords> Mission, Activities, KSEIA, Journal of EIA
Sookjin JEON, Jong-Gwan JUNG, and Myungjin KIM(Korea)
P-3 Modeling of breeding-site occupancy dynamics for Northern Goshawks in urbanized areas
<Keywords> Northern Goshawk, Accipiter gentilis, urbanized area, breeding, dynamic occupancy model
Haruki NATSUKAWA, Kaname MORI, Shizuko KOMURO, Takashi SHIOKAWA, and Hiroyuki MATSUDA (Japan)
P-4 An Analysis of Redevelopment and Resettlement History of Seoul
<Keywords> Redevelopment, Resettlement, Gentrification, Social Impact Assessment
Kongjang CHO, Aram SEO, and Sungju HAN (Korea)
P-5 Development of a leaching assessment framework for the utilization of coal ash at South Korean mine reclamation sites
<Keywords> Leaching assessment, coal ash, mine reclamation, EIA
Hanna CHO (Korea)
P-6 Spatial variations of water quality data in the four weirs installed in Nakdong River
<Keywords> Spatial Variation, Kruskall-Wallis, Harmful Cyanobacteria, Nakdong River, Weir
Daeyeon Park, Hyungseok Park, and Sewoong Chung (Korea)
P-7 Social Impact Management of Geothermal Development
<Keywords> Geothermal Development, Social Impact, Resource Management, Community Design
Yuki SHIBATA, Aki SUWA, and Takehiko MURAYAMA (Japan)
P-8 The Dispersal Trend of Alien Plants in Road Construction
<Keywords> Alien plant, Road development, Dispersal strategy, Seed bank
Yunsoo CHU, Seon-Mi LEE, Jung-kwon KIM, and Hyohyemi LEE (Korea)
P-9 Estimation of PM2.5 Concentration through the Restriction on Diesel Vehicles
<Keywords> Diesel Vehicle, PM2.5 concentration, Emission Reduction, CMAQ
Suhyang KIM, Sun Hwan PARK, Min Uk CHOI and Hyun-Soo JOO(Korea)
19

P-10 Implementation of environmental impact assessment, environmental management and monitoring.
<Keywords> EIA, EMEF, IRT, Management, Monitoring, Implementation
Dikarama KAULA, Vivin IRASWATI, Erri N MEGANTARA, Bambang HERU and Herri Y HADIKUSUMAH (Indonesia)
P-11 Effects of Traffic Characteristics on Roadside Air pollution
<Keywords> Roadside, Air pollution, Traffic, Effect, Correlation
Hyejin KANG, Chulhwan KIM(Korea)
P-12 Approach for Mainstreaming of Climate Change Adaptation in Urban Basic Plan of Korea
<Keywords> Mainstreaming of Climate Change Adaptation, Urban Basic Plan, Korea
Youngsoo LEE, Seung Hyun LEE, and Sang-Ki CHOI (Korea)
P-13 Elution characteristics by sediment characteristics
<Keywords> Elution characteristics, Sediment, Characteristics, Kaolin, Fluorine
Yoon-a PARK, Dong-Min LEE, and Jong-Min OH(Korea)
P-14 Habitat selection analysis of Ural Owls using an occupancy model
<Keywords> Ural Owl, Occupancy model, Habitat Selection, Robust Design, Call-broadcasting
Takumi SHIMIZU, Haruki NATUKAWA, Hiroki YUASA, and Tomohiro ICHINOSE (Japan)
P-15 Water quality assessment for a drinking water resource with a three-dimensional analysis
<Keywords> dam reservoir, drinking water resource, eutrophication, three-dimensional analysis, water quality assessment
Young-Sik HAM (Korea)
P-16 Evaluation of turbid flow by climate change impacts in a large dam reservoir in Korea
<Keywords> Climate change, HadGEM2-AO, RCP 4.5, Turbid water
Hyungseok PARK, Sewoong CHUNG, Yeojeong YOON, and DaeYeon PARK (Korea)
P-17 GIS-based Land-use suitability analysis for urban development using soft computing in Ili Valley, China
<Keywords> Multi-criteria evaluation, Soft computing, Urban development, Ordered weighted averaging, Xinjiang
Chaoxu LUAN, Renzhi LIU, Jing LIU, and Hanwen ZHANG (China)
20

P-18 Analysis of Sediment Contamination Levels in a Hypereutrophic Reservoir
<Keywords> algal bloom, sediment, total phosphorus, hypereutrophic reservoir, water quality
Sungjin KIM, Youngcheol CHO, and Sewoong CHUNG (Korea)
P-19 Towards sustainable management on contaminated agricultural lands in South Korea
<Keywords> Heavy-metal contaminated agricultural soils, Anthropogenic source, Policy alternatives
Sang-il HWANG, Kyeong YANG, and Eun-jee CHA (Korea)
P-20 A Study of Attached Microorganism Community with the Water Quality in Urban Stream
<Keywords> Attached Microorganism, Microorganism Community, Water Quality, Growth Amount, Urban Stream
Tae Kyung KIM, Kyung Mi MUN, Kyoung Eun CHOI, Eun Ji HEO and Jong Min OH (Korea)
P-21 Study on ecological influence of Changchun high-tech development zone on Jingyuetan National Forest Park
<Keywords> EIA, Industrial development Zone, National Forest Park, Ecological Impact
Hongguang CHENG, Zhenzhen WU (China)
P-22 A Study on the Legal and Institutional Review for Improving Bio-Mobility in Environmental Impact Assessment
<Keywords> EIA, Wildlife Crossing, Guiding fence, Escape ramp, roadkill
Su-gon PARK, Yong-Su PARK (Korea)
P-23 Analysis of CO2 Emission Characteristic of Daecheong Reservoir during the Turnover Period
<Keywords> CO2 emission, NAF, turnover, reservoir
Eun-Ju LEE, Hyeong-Seok PARK, and Se-Woong CHUNG(Korea)
P-24 Arsenic and Heavy Metal Contaminations of Rice Grown in Bangladesh
<Keywords> Arsenic, Heavy Metal, Bangladesh, Rice, Analysis
Jumpei MIYAZAKI, Kosuke MURAMATSU, Masahiro TOKUMURA, Muhammad Rafiqul ISLAM, Qi WANG, Yuichi MIYAKE, Masahiro SAKATA, Shigeki MASUNAGA, Takashi AMAGAI, and Masakazu MAKINO (Japan)
P-25 Impact of extreme turbidity events on the connected Andong-Imha reservoirs system
<Keywords> climate change, turbid water, CE-QUAL_W2, RCP 4.5&8.5, BMA
Yeojeong YOON, Hyungseok PARK, and Sewoong CHUNG (Korea)
21

P-26 Improvement Plan for the Assessment of Plantation Areas in the Environmental Impact Assessment, Republic of Korea
<Keywords> National Vegetation Class, Vegetation Development, Plant Species Composition, Vegetation Index, Sorensen’s Diversity Index
Seon Mi LEE, Jae Gyu CHA, Su Gon PARK, and Young Ho CHO (Korea)
P-27 Device for Measuring Dermal Exposure Rate of Flame Retardants via Direct Contact with Products
<Keywords> Dermal Exposure, Flame Retardants, Risk Assessment, Silicon, Migration
Mai SHINDO, Kotone TERAO, Kosuke MURAMATSU, Masahiro TOKUMURA, Qi WANG, Yuichi MIYAKE, Takashi AMAGAI, and Masakazu MAKINO (Japan)
P-28 An influence of Government Trust on Siting Acceptance for NIMBY Facilities
<Keywords> NIMBY, acceptance, incineration, government trust, question investigation
Ik-Jun YEON, Ju-Young JUNG, Sung-Sik PARK, Ji-Sun JUNG, and Jung-Sik CHO(Korea)
P-29 A Comparative Study of Odor Acceptance between Korea and China
<Keywords> acceptance, odor, question investigation, industrial complex, odor awarence
Ik-Jun YEON, Ju-Young JUNG, Sung-Sik PARK, Ji-Sun JUNG, and Jung-Sik CHO(Korea)
P-30 Study on the Preference of the Ecotone in the Natural Landscape
<Keywords> View landscape, Natural landscape, Biodiversity, Characteristics of landscape, Landscape component, Landscape evaluation, Ecotone
Seiichiro OHATA, Akira TANAKA(Japan)
P-31 Performance Evaluation of Noise Reduction Devices which installed on the Noise Barrier
<Keywords> Road Traffic Noise, Noise Barrier, Noise Reduction Device
Chulhwan KIM , Hyejin KANG(Korea)
P-32 Removal of Tar from Biomass Gasification Process
<Keywords> Biomass, Gasification, Tar, Oil Scrubber, Removal
Ju Hoe KIM, Jong Min OH,Young Min JO, and Sang Bum KIM(Korea)
P-33 Distribution Patterns of the Dominance Macrobenthos at Subtidal on Coast Developments in Korea
<Keywords> Macrobenthos, Coast-Developments, Indicators, Dominance-species, Distribution
Hyoung-Sum HAN, Yang-Ho KIM, and Hyun-Shik YEE(Korea)
22

P-34 Nuclear power plant decommissioning project and public participation
<Keywords> NPP, Decommissioning, EIA, Public Participation
Kyunghee SHIN, Jin-gyeong KWON, and Kongjang CHO (Korea)
P-35 “Biotope-package” as Ecological Roof Vegetation -Effects for Biodiversity Conservation and HeatIsland Mitigation-
<Keywords> Biotope-Package, Effects for Biodiversity Conservation, Heart island Mitigation, Wetland
Tanaka Laboratory, Tokyo City University(Japan)
P-36 Study for Feasibility ofJapanese Biodiversity Banking “Satoyama Banking”
<Keywords> Satoyama, Biodiversity Banking, Quantitative Evaluation, HEP, EIA
Tanaka Laboratory, Tokyo City University(Japan)
P-37 “Minami-Alps Biosphere Reserve”
<Keywords> High Mountains, Deep Valleys, Fostering Biological and Cultural Diversity
Shizuoka City (Environmental Policy Division)
23

24

AIC2018 in Shizuoka “Green Region and Impact Assessment”
❖AbstractsOpening Plenary Abstract ............................................................................ 27
Session Abstracts ............................................................................................... 28
Poster Abstracts ................................................................................................. 79
Each serial number of abstracts is the same as that of the session.
25

26

The nature of Shizuoka –from Mount Fuji to Suruga Bay-
Kazuyoshi Yamada1
1Museum of Natural and Environmental History, Shizuoka, Japan Keywords: Mount Fuji, Suruga Bay, Izu Peninsula, Southern Alps, Red lists
1. Introduction
Shizuoka Prefecture locates on center part ofHonshu Is., is an elongated region following the coast of the Pacific Ocean at the Suruga Bay, the deepest in Japan. In the west, the prefecture extends deep into the Japanese Southern Alps which have more than 3,000 m.a.s.l. In the east, it becomes a narrower coast bounded in the north by Mt. Fuji, until it comes to the Izu Peninsula. These diverse landscapes lead to spreading biodiversity in this area. Here, it will be introduced nature of Shizuoka Prefecture (Fig.1).
2. Main Landscape
2.1 Mount Fuji
Mount Fuji is the highest mountain at 3,776.24 m, and active volcano. It was identified four phases of volcanic activities in the formation of Mount Fuji. Modern shape of mountain is thought to b formed since the last 10,000 years ago. Last large eruption had been occurred at AD 1707. In 2013, Mount Fuji was added to the World Heritage List as a Cultural Site.
2.1 Suruga Bay
Suruga Bay, which has ca. 2,500 m in water depth, was formed by tectonic subduction of the Philippine Sea Plate and the Eurasian Plate at the Suruga Trough, making it a source of considerable seismic activity, and giving the bay its extreme depth.
2.3 Southern Alps
Southern (Akaishi) Alps is mountain range of central Honshu Is, one of main area of Japan Alps. Geology of this area was composed by accretionary prism since ca. 100 milllion years ago, due to plate tectonics. High variety of fauna and flora found at the sites. In 2014, Southern Alps was added to UNESCO Biosphere Reserves List.
2.4 Izu Peninsula
The Izu Peninsula has an unique geological scheme other than the mainland of Japan. At 14 milllion years ago, the Izu block located far away from the Island Arc. After that, by tectonic subduction, the block was collided with the mainland, and it formed the peninsula same as today ca. 600,000 years ago. Because of unique geo-history, the Izu Peninsula was finally added to UNESCO Global Geopark List in April, 2018.
3. Biodiversity preservation
In this year, Shizuoka Prefecture will publish2nd version of Red Lists after 2004. Total number of threatened species is reported as 619, that corresponds to 4.8 % against all of species. Although we have unparallelled landscapes as mentioned above, it is time to discuss sustainable preservation for keeping the nature.
Figure 1 Topographical Map of Shizuoka Pref.
Opening Plenary
27

Green Region and the Role of SEA/EIAs
Akira Tanaka
Tokyo City University, Japan
Keywords: Carrying Capacity, Sustainability, Tiering, Zoning, No Net Loss, Biodiversity Offset/Bank, HEP
What is “green region”?
A green region (GR) refers to the states of
balance between cumulative negative impacts (net
loss) on the ecosystem resulting from human
activities such as development and cumulative
positive impacts (net gain) due to conservation
efforts with respect to certain region. It is also
defined as a sustainable state in which the
difference between the net loss and net gain of a
region is within its carrying capacity.
While the scope of GR, likewise with
ecosystems that range from a small aquarium to
the spaceship Earth, can be considered at various
scales of extent, local, regional and global, it is
desirable to apply the concept to an ecological unit
such as a watershed shown in Figure 1.
Why a green region now?
Recently, with the proliferation of the use of
renewable energy from wind and solar, there is a
phenomenon whereby such power plants are
becoming concentrated in some regions. Figure 2
depicts the current state of solar power plant
developments in Izu Peninsula, Shizuoka. EIAs
are not being conducted during the development
of such plants because this type of development is
still new and its scale is small. However, there is a
serious possibility of cumulative impacts on the
environment due to the concentration.
Figure 1 Concept of “Green Region”
Figure 2 Location of Photovoltaic Power Generation Plant in Izu Peninsula, Shizuoka
The role of SEA/EIA in Green Region
There are several roles of SEA/EIA for a GR.
In addition to the current approach of screening by
scale of development project, screening by
ecological vulnerability of the area and “zoning”
with consideration for a region’s overall carrying
capacity should be introduced. A “tiering” that
applies environmental information including zoning,
that is commensurate with the maturity of planning
in the regional SEA and individual EIA respectively,
should be introduced. Assessment of multiple
alternative plans according to the “mitigation
hierarchy” including “no action” should be
introduced. “Quantitative methods” such as
“HEP” for evaluation of both impacts and effects of
mitigation measures, should be introduced.
Lastly, it is important to note that there are
differences in how to conceive GR. Because
some are specific to a land like biodiversity, while
others are universal like CO2 and electricity..
References
Tanaka, Akira (2017) Can EIA be an effective tool for creating ecologically sustainable society? –From the aspect of “Green Region”, The 6
th Korea-
Japan-China Tripartite EIA Conference, p.13.
=A unit of “Green Region”
http://www.nianticriverwatershed.org
A-0-1
28

EIA system and its Implementation in Japan
Shintaro Murai
Environmental Impact Assessment Division Ministry of the Environment, Japan
Keywords: EIA, Wind Power, Zoning, Coal-fired power plant, Japan
1. Introduction (Overview of EIA Act in Japan)In Japan, a system on EIA was first introduced
in 1972. EIA Act was enacted in June 1997, and the Act was revised in 2011.
In the present EIA system, the project proponent implements EIA by the steps of survey, forecast and evaluation for each subject and the Minister of the Environment states his/her opinions for the conservation of the environment according to the requests. EIA system contains 13 items of target projects (wind power generation was added in 2012). In recent years, the number of project in EIA has
increased rapidly. The possible reasons may be, 1) a primary EI consideration at the planning stagewas added in EIA system by the revision of the EIA Act, 2) the wind power generation was added as target project in EIA, and 3) the thermal power generation plan has increased since East Japan Great Earthquake Disaster in 2011.
Figure1. The Number of Submitted Opinions from the
Environment Minister
2. Zoning for Wind Farm in Japan
Responding to Paris Agreement, the cabinet approved the Plan for Global Warming
Countermeasures in 2016. As for renewable energy, a large number of projects of wind power plant were planned and some problems, for example considering wide or cumulative effects in environment, or trouble with residents appeared. MOEJ has promoted zoning method for
resolution of the problems and conducted 10 projects in the country. The project aimed to develop the zoning methodology for wind farm based on the assessment on economic and social impact as well as environmental impact in local government level. The zoning areas would be included the areas where the installation of wind farm should be promoted, avoided and so on.
3. The opinion of the Minister of theEnvironment for coal-fired power plants
Many coal-fired thermal power plants are under planning and EIAs for these projects are in progress. It is necessary to perform EIA for individual projects in order to achieve the CO2 emission target in FY 2030 and further since 2030, following the achievement of the target settled for reduction of CO2 emission in the whole electric utility industry and in each individual company, and monitoring the situation of these actions. The Minister of the Environment stated serious opinions from the view of environment conservation and Global Warming Countermeasures toward some cases recently.
References
M. Oi, F. Ito, M. Tanimoto (2017), Current statusand challenges of EIA for coal fired power plants, Proceedings of the Annual Conference 2017 of JSIA, pp.118-121 (http://www.env.go.jp/policy/assess/Article_3_Current_status.pdf)
5
0
2
02
0 5
96
26
6
A-0-2
29

"Sustainable Zone" - Regional economic indicators on self-sufficiency of food and energy
Hidefumi Kurasaka1
1Chiba University, Japan Keywords: renewable energy, local government, food self-sufficiency, regional revitalization,
energy shift
1. Introduction
Kurasaka laboratory and accredited NPO corporation Institute for Sustainable Energy Policy Research Institute have announced the actual state of renewable energy supply by municipalities in Japan every year since 2005. We call a municipality where the amount of renewable energy obtained in the municipality exceeds the amount of energy consumed in that municipality by calculation as "sustainable zone" municipality.
2. Findings from the Latest Calculation
The latest result of "sustainable zone" research (as of March 2018) is to grasp the renewable energy equipment that is in operation as of the end of March 2017 and to calculate the amount of energy supply when the equipment is operated yearly. The result of this calculation in summarized in Table 1.
We define municipalities, which are producing renewable energy in an amount that exceeds the demand for energy for consumer and agricultural sector in the region as “energy sustainable zones.” And we call municipalities
which generate renewable energy electricity in amounts that exceed the electricity demand for consumer and agricultural sector in the region as “power sustainable zones.” In Japan, numbers of these municipalities are growing as shown in Figure 1.
Municipalities with food self-sufficiency rate exceeding 100% were 566 municipalities. Of the 82 municipalities that are “energy sustainable zones”, 42 municipalities also exceeded 100% in the self-sufficiency of food.
References
Kurasaka Laboratory and Institute for Sustainable Energy Policy (2018) “Sustainable Zone Report FY2017” (in Japanese) http://sustainable-zone.org/wordpress/wp-content/uploads/sustainablezone-2017FY-report.pdf Table 1: Renewable Energy Supply in Japan
Figure 1: Number of Sustainable Zones
Total amount(TJ) ratio within power ratio Growth rate Total amount(TJ) ratio within power ratio Growth rate Total amount(TJ) ratio within power ratio Growth rate
PV 285894 51.1% 43.8% 394211 57.2% 50.4% 137.9% 469532 60.0% 53.6% 119.1% 164.2% 922.4%
Wind 47037 8.4% 7.2% 106.1% 50076 7.3% 6.4% 106.5% 56010 7.2% 6.4% 111.9% 119.1% 116.9%
Geo-thermal power 22078 3.9% 3.4% 100.3% 22175 3.2% 2.8% 100.4% 20947 2.7% 2.4% 94.5% 94.9% 89.3%
Hydro power(below 10 130092 23.3% 19.9% 100.3% 132173 19.2% 16.9% 101.6% 134243 17.2% 15.3% 101.6% 103.2% 101.3%
Biomass power 74290 13.3% 11.4% * 90511 13.1% 11.6% 121.8% 101249 12.9% 11.6% 111.9% 136.3% *
Renewable power 559391 100.0% 85.7% 143.5% 689146 100.0% 88.1% 123.2% 781981 100.0% 89.3% 113.5% 139.8% 291.6%
Solar thermal 30422 4.7% 93.2% 30129 3.9% 99.0% 30290 3.5% 100.5% 107.8% 108.4%
Geo-thermal utilizatio 25655 3.9% 101.5% 25182 3.2% 98.2% 25304 2.9% 100.5% 99.6% 100.0%
Biomass thermal 37476 5.7% * 37626 4.8% 100.4% 37921 4.3% 100.8% 250.6% *
Renewable thermal 93553 14.3% 132.7% 92937 11.9% 99.3% 93515 10.7% 100.6% 136.1% 137.0%
Renewable energy 652944 100.0% 141.9% 782083 100.0% 119.8% 875496 100.0% 111.9% 232.5% 260.2%Ratio to energy demandfor civilian + agricultural,forestry and fisheryindustries
7.86% 9.42% 10.54%
2017.32017/2015 2017/2012
2015.3 2016.3
A-0-3
30

Application of HEP for maximizing habitat value in the process of road construction
Sang-Don Lee1
1 Dept. Environmental Sciences & Engineering, Ewha Womans University, Seoul, Korea Keywords: Evaluation Procedure (HEP), EIA, Road-kill, Eco-corridor, Waterdeer
1. Introduction
In the existing EIA, unlike other fields, the field of natural environment has a poor forecasting method through quantitative evaluation, and it is difficult to select a reduction plan accordingly. In this study, we use the HEP (Habitat Evaluation Procedure) technique, which can quantify the long-term effects of ecosystem, and the CHU (Cumulative Habitat Unit) value of the final derivation unit of HEP thus planning the amount of reduction plan.
2. Title
Application of HEP for habitat value in theprocess of road construction
2.1 Methods
In this study, spatial analysis was used to coordinate the points with waterdeer (Hydropotes inermis). Spatial analyst was selected as the optimum index of habitat for the animal, and data were obtained from the vegetation cover, water density, contour line, and land use and road network. In order to calculate the HSI (Habitat Suitability Index) value and CHU value for the waterdeer in the area of Hongchon to Inje, the study was conducted to investigate the land cover of major classification, national river system, vegetation and highway No. 60 Hongchon - Inje through the distribution map of the major classification and Road Network. After extracting and referring to the report on the EIA of the construction project, ArcView and ArcGIS map were used, and the statistical tests were performed
2.2 Results
As a result of the study, the environmental impacts of the project area due to the road construction showed a net loss ecological value of 912.3, a 362.7 increase in net profit value according to the reduction plan, and a recovery value of 549.6 after 50 years of the reduction plan installation. Comparing ecological corridor of 13 sites, the highest net profit was CHU of 69.5 at point 4, and it can be regarded as an ecological passage connecting habitat most appropriately
3. Conclusions
Restoring can only work as limited amounts because we do not have a system measuring the damage of ecosystem. In this regards restoration should be achieved as much as possible to meet the original condition such as NNL (not net loss) of habitat and population as a biodiversity offset. Government agencies, private conservation organizations, businesses and private landowners can cooperate in large-scale ecosystem management projects to achieve conservation objectives and to restore ecosystem in a sustainable way
Reference
Tanaka, A. 2013. Theory and Practices for Habitat Evaluation Procedure in Japan. Asakura Publishing Company.
A-0-4
31

Study on introduction of biodiversity offset in Japan
Seiji Arai1*2, Ginko Tsujisaka1*3, Akihiko Matsuoka1*4, Koichi Ide1*5, Shogo Ogasawara1*6, Yasuhiro Kato1*7, Yoshifumi Saiki1*8, Taro Shiromoto1*9, Yuki Togo1*10, Tadashi Nishizawa1*11,
Yoshihiro Hori1*12, Chikako Watanabe1*13, Yosuke Watanabe1*14, Takafumi Kawamura1*15, Ayaka Matsumiya1*13,Masakazu Aoshima1,Shinji Oda1,Kiyoharu Yoshizawa1,Akira Tanaka15
1Japan Association of Environment Assessment.,Japan 2NIPPON ENGINEERING CONSULTANTS CO., LTD,Japan 3Prec Institute Inc.,Japan 4ENVIRONMENTAL CONTROL CENTER CO.,LTD.,Japan 5Tokyo Power
Technology Ltd.,Japan 6PACIFIC CONSULTANTS CO.,LTD.,Japan 7NIPPON KOEI CO.,LTD.,Japan 8POLYTECH ADD, Inc.,Japan 9Oriental Consultants Co.,LTD.,Japan 10TOKYO KYUEI CO., LTD.,Japan 11 NS Environment Corporation.,Japan 12SANYO TECHNO MARINE,INC.,Japan 13TAISEI CORPORATION.,Japan
14SHIMIZU CORPORATION.,Japan 15Tokyo City University.,Japan
Keywords: Biodiversity offset, no net loss, Environmental Assessment, Ecosystem Quantitative Evaluation
1. Introduction
To minimize loss of biodiversity bydevelopment projects, biodiversity offsets aspart of compensation of resdual impacts havebeen implemented in developed country.Althougth biodiversity offsets have not beeninstitutionalized in Japan, the concept havebecame important issue for EIA policy. Forfuture institutiolization, this study havepractically examied challenges of biodiversityoffsets in Japan.
2. Methods
Among various challenges of biodiversity offsets in Japan, technical aspect of biodiversity evaluation and institutional aspect of offsetting program operation were studied. Satoyama ecosystem which is Japanese traditional agricaltural landscape with rich biodiversity were focused as potentially offsetting site in Japan in this study. Chiba city in suburban Tokyo were selected as hyphothesical case study area.
3. Results
3.1 Biodiversity evaluation technique
Challenges of applying foreign evaluation methods to Satoyama were studied. Habitat evaluation procedure (HEP) in the United States and Habitat hector method (Hha) in Australia were selected as major foreign
evaluation methods. Biodiversity offset between habitat loss by development and habitat gain by conservation were analyzed. Main results were following; 1) compensation area were evaluated to 3 times larger than development area in case of HEP and 2.4 times in case of Hha, 2) habitat gain by conservation were considerably smaller than habitat gain by development, and 3) when evaluating Satoyama ecosystem, vegetation disturbance by conservation practices needs to be reflected into evaluation criteria.
3.2 Operation of biodiversity offset institution
Three tyepe of institution in United States, Compensation Funds(In-Lieu-Fee program), One-Off Offset, and Mitigation Banking were selected. Based on case study in Chiba city, institutional challenges were examined. Main results were following; 1) with involvement of public sector and various stakeholders, Compensation Fund(In-Lieu-Fee program)
might be sustainable and suite for Japanese Satoyama offsets, and 2) if compensation area were 2.4 times larger than development area, annual cost for one offsetting project were estimated to 820 thousand yen/ha.
4. Reference
Tanaka, A. (2006). Theory and Practices for Habitat Evaluation Procedure in Japan (Japanese language).Asakura. Tokyo. 266pages.
A-0-5
32

Promoting green development of the resource-based cities in China by integrating the three-line model into SEA
Wei Li
Beijing Normal University, China
Keywords: Green development, The three-line model, SEA, Resource-based city, Effectiveness
1. Introduction
The 262 resource-based cities, of which economic structure is dominated by natural resource exploited and processed, have made a tremendous contribution to China’s economic miracle. However, a big proportion of these cities are suffering form economic depression and environmental degradation. How to promote green development of those resource-based cities remains a big challenge to SEA in China.
2. Applying the three-line model into SEA
2.1 The three-line model
The Three Lines refer to the red line of ecological conservation, the bottom line of environmental quality security and the upper line of natural resource utilization. For the resource-based cities, the relation of a studied development plan and the three lines may be interpreted as Fig.1.
Fig.1 Conceptual model of the three lines into an SEA of a development plan
2.2 Case Study
As a emerging resource-based city, the Ordos, has experienced an amazing economic growth with an annually averaged rate over 18% in the past two decades by mining coal and other mineral resources and developing coal chemicals such as cokes, methanol, olefin, dimethyl ether, coal-oil, and so on. Meanwhile, water pollution, grassland losses, ground water decline and other problems have been witnessed, and a worsening trend of local ecosystem is predicted. The development-forbidden zones were mapped out as the red lines for conservation by evaluating ecological importance, sensitivity and vulnerability of the land-use units, the bottom lines for securing environmental quality were identified by estimating the potentials of pollution reduction and industrial updating, and the upper lines for natural resource uses were set up by taking the accumulative effects of land, water and coal uses on long-term ecological improvement into account.
3. Conclusions
It is expected that application of the three-line model would help transform the SEA results from relatively soft recommendations into hard restrictions or criteria, by which a more environmentally sound development be actively attained in the city.
References
Wei Li*, Yang Zhao (2015) Bibliometric analysis of global environmental assessment research in a 20-year period, EIA Review, No.50, pp.158-166.
A-0-6
33

Proposal towards the Creation of General Policy for Mainstreaming of Biodiversity in Japan
Takahito Niwa
EX Research Institute Ltd., Japan
Keywords: Mainstreaming of Biodiversity, Japan Biodiversity Outlook, Potential Map, Ecological Network,
Aichi Mitigation, Aichi Biodiversity Strategy
1. Introduction
According to Japan Biodiversity Outlook (MOEJ
2010), drivers of biodiversity loss are divided into
four crises. Development pressure has the most
serious impacts within four crises thought the rate
of additional biodiversity loss is slightly reduced.
As long-term responses, recovery from past
losses caused during the period of rapid economic
growth is quite significant.
In this paper, the significance of creation general
policy is proposed for recovery from past losses by
collaboration among diverse stakeholders, not by
severe mitigation based on the polluter-pays
principle.
2. Aichi Biodiversity Strategy
2.1 Map of Biodiversity Potential
Potential Map shows the possibility to restore the
ecosystem and the target to create ecological
network by collaboration among stakeholders.
2.2 Aichi Mitigation
Aichi Prefectural Government recommends
companies to create ecological networks. Not only
companies developing nature over a hectare in the
future but also companies which did in the past
can be actors in this method.
Aichi considers that ecological networks increase
due to moral responsibility of the companies which
exploited nature in the past development.
Moreover, Aichi attempts to make this method
legally binding one.
References
Japan Biodiversity Outlook (2010) Ministry Environment of Japan, pp. ⅶ-ⅷ.
Aichi Biodiversity Strategy 2020 (2013) Aichi Prefectural Government
A-0-7
34

Green city-regions: Criteria for sustainability assessment Yoichi Kumagai1 2
1School of Environment, Resources and Sustainability (SERS), University of Waterloo, Canada 2 Centre for Management Studies, Instituto Superior Técnico (CEG-IST), University of Lisbon, Portugal
Keywords: green, city-region, sustainability, assessment, criteria
1. Purpose and method
This study generates criteria for sustainabilityassessment (SA) focusing on green city-regions.First, operational definitions as well as potentialissues of green city-regions are identified byreviewing literature. Second, generic criteria for SAare introduced. Third, the SA generic criteria arespecified for application to green city-regions.
2. Green city-regions
The meaning of “green” as an adjective is elusive when it is used relating to decision-making. I will first examine the existing explanations of words in decision-making accompanied with “green”, such as regions, cities, growth, infrastructure, building, energy, economy, budget, procurement and investment. After all, “green” may simply relate to human actions having positive (or less negative) impact on the natural environment. It may overlook lasting wellbeing of people. More integrative perspective would be beneficial for the concept of “green”, which would make it similar to “sustainable”. Thus, it is meaningful to specify the SA generic criteria to consider requirements for “green city-regions” to be sustainable.
City-region can be understood as a flexible and dynamic geographic location based on direct and indirect interdependence of people’s activities for diverse entrepreneurial and innovative outcomes, connecting neighbourhoods (Kumagai and Partidario 2018). The notion of green city-region would feature urban and suburban setting that has positive impact on the environment while securing lasting wellbeing of people living there. It suggests
better accessibility to wide range of quality goods and services with more resilient urban systems.
3 Specified sustainability assessment criteria
The SA generic criteria presented include: socio-ecological system integrity, livelihood sufficiency and opportunity, intra-generational equity, inter-generational equity, resource maintenance and efficiency, socio-ecological civility and democratic governance, precaution and adaptation, and immediate and long-term integration (Gibson et al 2005). The recognized issues of green city-regions serve as a perspective to specify the SA generic criteria.
4. Conclusion
The key is establishing public will to promote more human-scale and resilient urban system that has positive impact on the environment and secures lasting wellbeing of people. The criteria this study generates are useful not only for the experts in the city-regional politics, but also for the users of the city-region, to have a common ground for the meaningful discussion. In actual use, the SA criteria for green city-regions should be further specified reflecting the region’s situation.
References
Gibson, R.B. with Hassan, S., Holtz, S., Tansey, J and Whitelaw, G., 2005. Sustainability Assessment: Criteria and Processes, London: Earthscan.
Kumagai, Y. and M. Partidario. 2018. Lasting community wellbeing: Comparison of Lisbon and Tokyo. Sustainable Development. in print. DOI 10.1002/sd.1864.
A-1-1
35
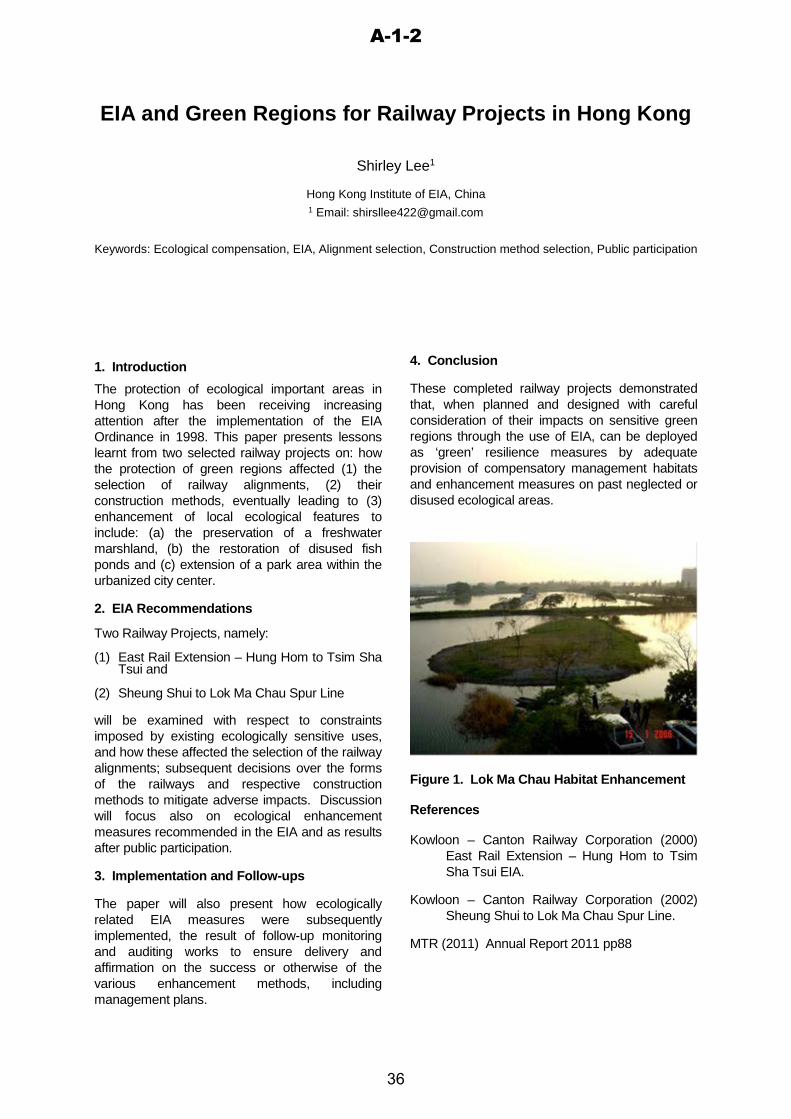
EIA and Green Regions for Railway Projects in Hong Kong
Shirley Lee1
Hong Kong Institute of EIA, China 1 Email: [email protected]
Keywords: Ecological compensation, EIA, Alignment selection, Construction method selection, Public participation
1. IntroductionThe protection of ecological important areas in Hong Kong has been receiving increasing attention after the implementation of the EIA Ordinance in 1998. This paper presents lessons learnt from two selected railway projects on: how the protection of green regions affected (1) the selection of railway alignments, (2) their construction methods, eventually leading to (3) enhancement of local ecological features to include: (a) the preservation of a freshwater marshland, (b) the restoration of disused fish ponds and (c) extension of a park area within the urbanized city center.
2. EIA Recommendations
Two Railway Projects, namely:
(1) East Rail Extension – Hung Hom to Tsim ShaTsui and
(2) Sheung Shui to Lok Ma Chau Spur Line
will be examined with respect to constraints imposed by existing ecologically sensitive uses, and how these affected the selection of the railway alignments; subsequent decisions over the forms of the railways and respective construction methods to mitigate adverse impacts. Discussion will focus also on ecological enhancement measures recommended in the EIA and as results after public participation.
3. Implementation and Follow-ups
The paper will also present how ecologically related EIA measures were subsequently implemented, the result of follow-up monitoring and auditing works to ensure delivery and affirmation on the success or otherwise of the various enhancement methods, including management plans.
4. Conclusion
These completed railway projects demonstrated that, when planned and designed with careful consideration of their impacts on sensitive green regions through the use of EIA, can be deployed as ‘green’ resilience measures by adequate provision of compensatory management habitats and enhancement measures on past neglected or disused ecological areas.
Figure 1. Lok Ma Chau Habitat Enhancement
References
Kowloon – Canton Railway Corporation (2000) East Rail Extension – Hung Hom to Tsim Sha Tsui EIA.
Kowloon – Canton Railway Corporation (2002) Sheung Shui to Lok Ma Chau Spur Line.
MTR (2011) Annual Report 2011 pp88
A-1-2
36

Policy research of Photo-voltaic power generation and Biodiversity conservation in the Izu-peninsula
Takafumi Kawamura1, Akira Tanaka1
1Tokyo City University, Japan Keywords: Green Region, Photovoltaic power generation, EIA, Watershed, Izu-peninsula
1. IntroductionRecently, Japan has faced problems spatial loss of natural environment and biodiversity due to careless construction of photovoltaic power generation plant since 2012, FIT (Feed-in Tariff) Law had instituted. The Izu-peninsula is no exception that was listed in the Global Geopark in April 2018.
In the Ito city, there is a plan of construction of photovoltaic power generation plant and people are concerning for spatial loss of natural environment and biodiversity.
In this research, we collected laws or regulations and systems national, prefecture and municipality level and compared each other focused on special loss of natural environment to suggest Izu-Penisula’s municipality a policy for sustainable society it is balancing environmental impact of constructing photovoltaic power generation plant and natural environment and biodiversity conservation.
2. Results
As a result, there is a FIT law as promotion for construction of photovoltaic power generation plant and has an ability to control careless construction of it. Though, in the Izu-Peninsula, some plans seem to be applied with division (Morino, 2018).
Some municipalities in the Izu-Peninsula have regulation for control construction of photovoltaic power generation plant. It is a reporting system. In case of Ito city, if that plan will cut over 1.2ha, the mayor doesn’t agree for that construction. Though, it doesn’t have an ability of suspension for illegal plan or activity.
Administration or reporting system in the Natural Park law, Natural Environment Conservation law and Forest law don’t request planning with according to Mitigation Hierarchy (avoid, minimize and compensate environmental impacts).
In the Shizuoka prefecture, constructions of photovoltaic power generation plant with land forming over 50ha are listed in prefectural EIA
regulation’s requirement as construction of industrial park. Though, in the Ito-City’s case, that plan will form 48ha land. It wasn’t required assessment following the prefectural EIA regulation.
4. ConclusionWe concern about “avoidance of assessment” due to limitation of assessment target by volume of development area.
Environmental impacts occur in “Watershed” (e.g. many fish die if soil is flashed due to cutting forest).
If improve problem of “avoidance of assessment”, Strategic Environmental Assessment is needed.
If consider environment impacts in the watershed, it is better that fulfill “Green Region”. It will be realized by regional Strategic Environmental Assessment (SEA) and Environmental Impact Assessment (EIA).
Area of municipalities and watersheds almost match in the Izu-peninsula. Unit of “Green Region” is municipality.
In farther research, we consider about SEA and EIA system to be “Green Region” in Izu-Peninsula’s watersheds and municipalities.
References
Hirohisa Morino (2018) Mega solar in the Izu(conclusion) concern about impacts for GLOBAL GEO. Izu News Paper 2018/5/30 (Original title is written in Japanese).
Tanaka, Akira (2017) Can EIA be an effective tool for creating ecologically sustainable society?
-From the aspect of “Green Region”, Proceedings of Impact Assessment and Post Management , the 1st Vietnam-Japan-Korea-China EIA Conference, p.13.
A-1-3
37

Construction and Application of the Comprehensive Assessment Method for the Ecological Environmental
Impact of Transmission Projects
Kai Tian1, Yanwei Zhao1 1School of Environment, Beijing Normal University
Keywords: EIA, Transmission Projects, Comprehensive Assessment, Landscape, Ecosystem, Sensitive area
1. Introduction
Much attention has been paid to the assessment method for the ecological environmental impact of transmission projects, however, the existing researches are mostly single-scale studies and it is not conductive to the implementation of comprehensive assessment for the ecological impact (Liu et al., 2017). This paper analyzes the ecological impact characteristics of three scales of landscape, ecosystem and sensitive areas, and, based on the analytic hierarchy process, puts forward the different scale ecological impact methods and multi-scale ecological impact comprehensive assessment method. Taking Qinghai-Henan±800kV HVDC project as an example, three layers of ecological impact assessment hierarchy were established, and the results of the assessment were compared between different scales and the comprehensive evaluation results were obtained.
2. Ecological impact assessment
2.1 Assessment index system construction
Based on the impact of transmission projects of multiple ecological factors, the ecosystem, sensitive area, landscape as the criterion layer, and selected 10 indexes as index layer (Table 1).
2.2 Project introduction
The project was carried out through four provinces in Qinghai, Gansu, Shanxi and Henan, with a total length of about 1638.6km. The total area of the evaluation area was1096.51km2.
3. Conclusions
This method could realize the comprehensive and given evaluation of ecological impact, and it is beneficial to the connection with different scale environmental impact mitigation measures.
References
Liu, J.L., Zhang, C (2017) Study on environmental impact assessment index of electric power transmission, Energy Environmental Protection, No.3, pp.42-45.
Table 1 Ecological impact evaluation index
system
Target
layer
Criterion layer
Index layer
EIA
Landscape
Land Use Transition
Landscape Fragmentation
Spatial Structure
Landscape
Heterogeneity
Ecosystem
Ecosystem Structure
Energy Flow Process
Biodiversity
Sensitive area
Wildlife Protection
Soil Erosion
Landscape Harmonicity
EIA(ecological impact assessment)
A-1-4
38

Improvement of ESC monitoring system and its report by analysis on JICA’s projects as case study
Suwanteep Kultip
Environmental and Social Considerations Supervision Division,
Credit Risk Analysis and Environmental Review Department,
Japan International Cooperation Agency (JICA)
Keywords: Improvement, Monitoring report, Analysis, Effectiveness and Environmental and Social Consideration
1. Introduction
EIA monitoring is an important tool and beneficial
to the environment as it enables action to be taken
if unexpected problems occur including allow any
issues identified to be rectified. It has the same
goal as EIA, by minimising the negative and
maximising the positive consequences of
development (Marshall et al, 2005). According to
JICA Guidelines for Environmental and Social
Consideration (ESC), JICA confirms monitoring
results in order to ensure that the project
proponents, etc. give the ESC agreed to in the
environmental review after conclusion of an
agreement.
However, the quality of the reports is varying over
time and project-by-project. The strengths and
weaknesses of current practice are a good
indication of where the monitoring could be
extended in order to enhance the role of the
monitoring system and improve effectiveness. This
study aimed to increase the quality of monitoring
report including improve the effectiveness of ESC
monitoring system by using JICA’s projects as
case study.
2. Improvement of ESC monitoring system
2.1 Cases analysis
There are 40 reports of on-going loan projects
fund by JICA between April 2017 to April 2018,
which were selected on this study. It is divided into
4 areas as shown in Fig.1.
Fig.1 Monitoring reports profile
2.2 Quality Improvement
Regarding the importance of the basic element of
monitoring report, the evaluation criteria for this
study was created and developed for improvement
of its quality in practice. There are 10 dimensions
to evaluate and examine in which area should be
concerned/focused.
3. Conclusions
The results demonstrate that the monitoring
reports in practice still need several improvements
especially monitoring parameters selection,
interpreting of monitoring results, monitoring form
and so on. Moreover, JICA has been
implementing the ESC Monitoring Management
Sheet strategy including strengthening on the
review results process. These are for increasing
the efficiency and quality of monitoring reports.
References
Marshall, R, J Arts and A Morrison-Saunders
(2005) International Principles for Best
Practice EIA Follow-up, Impact Assessment
and Project Appraisal, 23(3): 175-181.
B-1-1
39

Analysis of Monitoring Reports for Infrastructure Development Projects through Development Assistance
Ayaka Yasumoto1,Takehiko Murayama1, Shigeo Nishikizawa1
1Tokyo Institute of Technology, Japan Keywords: Environmental Assessment, Environmental and Social Considerations, Monitoring, Development
Assistance
1. Introduction
Preparation and execution of environmental andsocial impact assessment is the key to avoiding andminimizing environmental and social impacts ofinfrastructure projects. However, many projectstend to concentrate on environmental impactassessment preparation prior to projectcommencement, rather than monitoringimplementation. Therefore, we summarize themonitoring requirements of donors, including theWorld Bank, Asian Development Bank (ADB), andJapan International Cooperation Agency, andanalyze the obtained results by monitoring ADB’sreporting frequencies.
2. Monitoring Implementation
2.1 Comparison of Safeguard Policies
Specific analyses on monitoring conditions and requirements of each donor were conducted. These analyses focused particularly on a) monitoring purpose, b) monitoring methods, and c) disclosure methods of monitoring results. Based on these analyses, this research found that the three organizations set different monitoring standards. Furthermore, ADB described more detailed monitoring requirements in their Safeguards Policy Statement (2009). For instance, during the construction phase, the ADB demands at least semiannual monitoring reports for projects likely to have significant adverse environmental impacts, and quarterly monitoring reports for highly complex and sensitive projects.
2.2 ADB’s Monitoring Reports Analysis
Based on the abovementioned analyses, ADB’s 72 transportation (railway and road) projects were selected and monitoring reports available on ADB’s web site were reviewed.
Table 1: Frequencies of Environmental and Social Monitoring Reports (unit: months)
Category Environmental
Monitoring Report
Social Monitoring Report
A 12.3 17.4 B 22.3 24.8 C N.D. 25.9
Overall 17.7 26.6
3. Conclusions
This study compared several donors’ monitoring requirements based on certain criteria. This analysis discovered that a) ADB described more detailed monitoring requirements in their Safeguards Policy than other donors, b) the average frequency of monitoring implementation ranges from once every eighteen months to a little over two years, and c) environmental monitoring tends to be implemented more often than social monitoring.
References
ADB (Asian Development Bank) (2009) Safeguards Policy Statement
B-1-2
40

The application and prospect of CPTED theory
in the urban planning
Xianglan Yu
Zhejiang Gongshang University, China Keywords: EIA Act, CPTED, Crime Prevention, Urban Planning
1. Introduction
At the present time, attention to the understanding of citizen's security and the improvement of them is one of the most important issues for the professional and theatrical issue for the citizens.Crime prevention through environmental design (CPTED) is a multi-disciplinary approach to deterring criminal behavior through environmental design. CPTED strategies rely upon the ability to influence offender decisions that precede criminal acts. Generally speaking, most implementations of CPTED occur solely within the urbanized, built environment. Specifically altering the physical design of the communities in which humans reside and congregate in order to deter criminal activity is the main goal of CPTED.
2. Application of urban planning strategyunder the influence of CPTED
CPTED was originally coined and formulated by criminologist C. Ray Jeffery. A more limited approach, termed defensible space, was developed concurrently by architect Oscar Newman. CPTED macroscopically emphasized on comprehensive crime prevention measures . Today , CPTED mainly refers to Newman or Crowe model, which focuses on environmental design to achieve the goal of deterring the criminals effectively. After 40 years of development,CPTED turns to be increasingly matured, and
the second generation of CPTED, namely, CPTED II,has emerged from the United States to the world.
3. Conclusions and Prospect
CPTED is a more systematic, scientific and technological manner, attracting more and more study, interest and investment from public agencies, academics and security industry in the world.
In summary,relevant legislations and National Standards should specify the process and system of CPTED, also detailed risk assessment checklists and design guidelines/manuals have to be developed so that they can support the crime impact assessment law.
References
Cozens, P. (2002), Sustainable Urban Development and Crime Prevention Through Environmental Design for the British City. Towards an Effective Urban Environmentalism for the 21st Century, Cities: The International Journal of Urban Policy and Planning 19(2): 129-137.
Crowe, T. (2003). Advanced Crime Prevention through Environmental Design; (Seminar notes), American Crime Prevention Institute, Louisville, Kentucky, pp.33-67.
B-1-3
41

A Study on Integrated Diagnosis of Industrial Path Dependence for Mineral Resource-Based Cities: Based on
an Improved Cobb-Douglas Production Function Siyang Zhou
1, Wei Li 1
1State Key Lab of Environmental Simulation and Pollution Control, School of Environment, Business School,
Beijing Normal University, Beijing 100875, China
Keywords: cobb-Douglas production function, mineral resource-based cities, industrial path dependence,
marginal revenue, integrated diagnosis
1. Introduction
Diagnosing and resolving path dependence
(PD) is the key to achieve a green transformation of
industrial development and break the curse of
resources and environment in mineral resource-
based cities (MRBC). Through analyzing the
process of industrial development PD in MRBC and
their ecological environmental issues, the two
resources of minerals and environment are added
as input factors into the C-D function to construct
the Integrated Diagnosis Method of Resources-
Environment- Economy (IDMREE) to quantitatively
diagnose industrial PD and apply to Ordos which is
rich in coal resources.
2. Method
2.1 Establishing the improved C-D function
Mineral resources and environmental
resources are used as input factors to establish the
industrial C-D production function of mineral
resource-based cities as shown in formula (1).
𝑌𝑖 = 𝐴𝑖𝐾𝑖𝛼𝐿𝑖
𝛽𝑀𝑖𝛾𝐸𝑖𝛿 (1)
Among them, 𝑌𝑖 is the industrial added value of
mineral resource city i; 𝐾𝑖 is the input of industrial
fixed assets; 𝐿𝑖 is the input of industrial labor; 𝑀𝑖 is
the input of major mineral resources; 𝐸𝑖 is the input
of ecological environment; 𝛼、𝛽、𝛾、𝛿 are the
output Elasticity.
The partial derivatives of K, L, M, and E are the
marginal revenues (MR) of various input factors to
industrial added value. The integrated MR of input
factor 𝑀𝑅𝐾𝐿𝑀𝐸 is:
𝑀𝑅𝐾𝐿𝑀𝐸 = 𝑀𝑅𝐾 +𝑀𝑅𝐿 +𝑀𝑅𝑀 +𝑀𝑅𝐸(2)
According to the law of diminishing marginal
revenue and 𝑀𝑅𝐾𝐿𝑀𝐸 curve shape, the PD process
can be determined into 2 types: integrated marginal
revenue increasing (IMRI) and integrated marginal
revenue decreasing (IMRD).
2.2 Environmental factors selection and value
evaluation
The ecological system and its service function
destroyed by the resource-based industry, and the
value of environmental pollution are taken as
environmental resources.
3. Results
The integrated output elasticity of the industrial
input factors in Ordos was 0.8158, showing a
decreasing scale of returns, indicating that the scale
expansion has not been able to stimulate industrial
economic growth. 𝑀𝑅𝐾𝐿𝑀𝐸 curve increased from
0.18 to 1.40 yuan between 2001 and 2007, and
industrial development was in the IMRI process;
from 2008 to 2015, the fluctuation from 0.99 to 1.13
yuan, entering the IMRD process, indicating that
The integrated input elements of industrial
development are redundant.
4. Conclusions
The IDMREE method can make up for the time
lag of traditional methods, help mineral resource-
based cities to recognize the resource and
environmental problems brought about by industrial
development earlier, and reduce the economic cost
and technical difficulty of solving traditional routes.
Reference
Field B C. (1995) Natural Resource Abundance and
Economic Growth[J]. Land Economics,
81(4):496-502.
Dinda S. (2004,) Environmental Kuznets Curve
Hypothesis: A Survey. Ecological Economics,
49(4):431-455.
B-1-4
42

Analysis of Factors to Cause Hokkaido Sika Deer-Vehicle Collisions - Case Study of National Route 44 -
Tomoki Washio1, Hideyuki Ito2, Takahiro Fujii2
1Nihon University, Graduate School, Japan 2Nihon University, Japan
Keywords: Road-kill, Deer-Vehicle Collisions, Traffic Accidents, Road Ecology, Regression Analysis, Transportation and Environments, Hokkaido Sika Deer (Cervus nippon yesoensis)
1. Introduction
The population of Hokkaido sika deer (Cervus
nippon yesoensis) have increased after the World War II due to protection policy. Under the circumstances, deer-vehicle collisions (DVCs) have been increased and it has become a serious problem. Therefore, the purpose of study is to analyze the factors that cause DVCs on National Route 44 through the field survey of the roadside environment on National Route 44 connecting between Kushiro and Nemuro in Hokkaido, which has the highest number of DVCs per km.
2. Data and Methods
2.1 Data Collection
DVCs data which had been gathered for 4 years from 2012 to 2014 and 2016 by Hokkaido Police were used in this research. In autumn of 2016, a field survey was conducted on National Route 44 to collect the data of roadside environmental factors such as the installation status of road facilities (fences for deer, animal crossing signs, road lightings, etc.) and the form of road structure, in every 500m. In addition, the land use data around the roadside was created using GIS. We used these data as explanatory variables for analyzing the accident factors of DVCs.
2.2 Poisson Regression Analysis
We developed Poisson regression model and then analyzed the factors affecting the occurrence of DVCs in every 500m. For the analysis, we used response variable as the number of accidents occurring every 500m and used 12 indicators
obtained from field survey of the road environment and land use data as explanatory variables.
3. Results and Conclusion
The result of Poisson regression model is shown in the Table 1. According to the values of the regression coefficients, it was shown that the fence installation rates in front and back section, animal crossing signs and road structure which is embankment had positive values and then it was clarified that these had relation to the occurrence of DVCs in particular. On the other hand, the fence installation rates, road structure (cut and flat) and land uses had negative values, which had few connection with the non-occurrence of DVCs.
Table 1: Result of Poisson Regression Model
References Hubbard, W. M., Danielson, J. B., Schmitz, A. R. (2000)
Factors Influencing the Location of Deer-Vehicle accidents in Iowa, The Journal of Wildlife Management, Vol.64, pp.707-713.
Noro, M., Hara, F., Hagiwara, T. (2009) Determining Causal Factors in Deer-Vehicle Collisions by Examining Deer Ecology, Infrastructure Planning Review, Vol.26, pp.889-900.
Variable β SE Wald P
Fence Installation Rates -0.007 0.002 8.20 0.004 **
0.011 0.003 16.88 0.000
Animal Crossing Signs 0.481 0.096 24.89 0.000 ***
Road Structure Embankment and Cut 1.007 0.227 19.61 0.000 *** Embankment and Flat 1.016 0.242 17.58 0.000 *** Cut and Flat -0.128 0.611 0.04 0.834 Both-sides Embankment 0.838 0.210 15.88 0.000 *** Both-sides Cut 0.435 0.289 2.27 0.132
Land Use (Area Ratio) Open Water -0.011 0.007 2.40 0.122 Pasture -0.010 0.002 24.93 0.000 *** City -0.006 0.002 9.14 0.003 ** Forest -0.006 0.002 9.96 0.002 **
Fence Installation Ratesin Front and Back Section ***
A-2-1
43
Understanding and Predicting NDVI spatial pattern with climate and topographical variables using GWR
Myeong-je Kim1, Hye In Chung1, Jinhoo Hwang1, Junhee Lee1, Yu-young Choi1, Jieun Ryu2 and Seong-Woo Jeon1
1Department of Environmental Science and Ecological Engineering, Graduate School, Korea University, Korea
Keywords: GWR, NDVI, climate variables, topographical variables, spatial autocorrelation, Moran’s I
1. Introduction
Normalized Difference Vegetation Index (NDVI),
which shows the quantitative reference of forest
distribution and the quality of forest area, has been
commonly used to understand the changes in its
spatial patterns. And they are influenced by natural
factors such as topography, climate and so on.
In this study, using GWR model, we try to prove
the actual correlation of NDVI and climate and
topographical variables, and to identify their
estimated regression equation.
2. Main Methods
2.1 Using GWR model
In this study, GWR model has been used to impr
ove the accuracy of prediction. Although OLS,
Ordinary Least Squares, regression model with
vegetation index has been used to analyze their
correlation, it has its own limits of not reflecting on
spatial autocorrelation that spatial data, such as
distribution of vegetation groups have when they
are concentrated in space. Therefore, GWR,
Geographically Weighted Regression, has been
widely used lately to consider the spatial
autocorrelation of each variable.
2.2 Analyzing and Predicting the relationship
Using GWR under the South Korean region, this
study try to 1) analyze the correlation of forest
distribution represented by NDVI and climate and
topographical variables and 2) predict NDVI
change and the trend of its spatial distribution,
deriving relation (NDVI = f(climate, topographical
variables)) where NDVI is a dependent variable.
3. Conclusions
We’ve also conducted to verify the spatial
accuracy, acquiring spatial data of satellite images,
and analyzed the spatial characteristics of patterns
with low accuracy. Based on the results, we’ll
further study the NDVI change of South Korea
under climate change scenarios.
Acknowledgements
This subject is supported by Korea Ministry of
Environment (MOE) as “The Chemical Accident
Prevention Technology Development Project.”
References
Binbin Lu, Paul Harris, Martin Charlton, Chris Brunsdon
(2014) The GWmodel R package: further topics for
exploring spatial heterogeneity using geographically
weighted models, Geo-spatial Information Science,
pp.85-101
Hye-Young Kim, Chul-Min JUN (2012) Land value analysis
using Space syntax and GWR, Journal of the
Korean Association of Geographic Information
Studies, pp.35-45
Luo Guo, Z Ma, and Lianjun Zhang (2008) Comparison of
bandwidth selection in application of geographically
weighted regression: a case study, Canadian journal
of Forest Research, pp.2526-2534
Z. Zhao, J. Gao, Y. Wang, J. Liu, S Li (2015) Exploring
spatially variable relationships between NDVI and
climatic factors in a transition zone using
geographically weighted regression, Theoretical and
Applied Climatology, pp.507-519
A-2-2
44

Future Potential of Soundscape Monitoring in Urban Greenery
Koji AINOTA1, Akira TANAKA1
1Tokyo City University, Japan Keywords: soundscape, biodiversity, monitoring, urban, greenery
1. IntroductionEcosystem evaluation in existing Environmental Impact Assessment has several issues such as time consumption, high costs, lack of quantitative evaluations and considerations of relativity between other evaluating items in EIA, and dependence on researchers’ knowledge and experiences for accurate investigation results. Rapid and quantitative ecosystem evaluation is increasing in demand with the recent trends of applying rapid assessment for ecosystem evaluation. In this study, we considered the future potential of soundscape monitoring for applying to 1)Ecosystem Evaluation in Environmental ImpactAssessment, 2)Ecosystem Evaluation of UrbanGreenery Area.
2. Methodology2.1 Field Investigation
We conducted an investigation that was implemented from September to November in 2014 to collect soundscapes by using recorders. The recorders have built in stereo microphones, and these were used to hold 24 hours of recordings in each sites. In total, the investigation was done in 26 recording sites which have different land uses. These study areas are located around urban areas in Japan. The land uses were forests(F), bamboo forests(BF), artificial lands(AL), grass fields(GF), residential districts(RD), residential street(RS), paddy fields(PF), farms(F), pond, waste land(WL), streams, residential parks(RP), greening area(GA), and so on.
2.2 Analysis
To consider the relationship between soundscapes and landscapes, we chose several different factors, such as Natural Sounds Values(NSV), Green Coverage Ratio(GCR), the number of calling cricket species(NCCS),
Vegetation Diversity Index(VDI), and Shannon Index(Acoustic Diversity Index ; ADI). The correlations were calculated by applying Pearson product-moment correlation coefficient(PPMCC).
3. Discussion
The figure shows the results of ADI, VDI, & NCCS. The results of PPMCC analysis are listed below. VDI & NCCS : 0.57, VDI & ADI : 0.48, NCCS & ADI : 0.49, GCR50m & ADI : 0.45, and GCR100m & ADI : 0.42. The results suggested weak correlation between ADI & other factors. Meanwhile, we found strong positive correlations between NSV and GCRs as the table shows. We emphasize that there are potential applications of Soundscape Monitoring in Japan.
Table. Results of PPMCC between NSV and GCR
Daytime : 6am-6pm Nighttime : 6pm-6am
Average Score
Radius50m
Average Score
Radius100m
Average Score
Radius50m
Average Score
Radius100m
r:0.76 t:5.82 p<0.01
r:0.80 t:6.59 p<0.01
r:0.57 t:3.47 p<0.01
r:0.50 t:2.85 p<0.01
Reference
Ainota K., Tanaka A.(2016) Basic Study of the Relationship between Environmental Sounds and Green Coverage Ratios : Potential Application of Sound Monitoring to Ecosystem Evaluation. Environmental Information Science Vol.30 No.41, pp.375-392.
Figure : Results of ADI, VDI, & NCCS
A-2-3
45

Conservation Priority Mapping of Forest Ecosystem Services in the Case of Nagoya, Japan
Kiichiro Hayashi1 1Nagoya University, Japan
Keywords: Ecosystem Service, Biodiversity, SEA, Japan, Conservation Map
1. Introduction
Urban city has been facing a strong developmentpressure on the nature. Expanding residential areahas been causing the degradation of forest areaand also the fragmentation of the natural area in acity. Nagoya City, Japan is facing the same issueswhich lead to the loss of ecosystem services (ESs).In this study, based on multi-point forest survey,ES maps were developed which can be utilized fora conservation priority mapping.
2. Study method
2.1 Study area
Nagoya City, Japan is selected for this study area. Nagoya region is the third largest city in population and economic activities in Japan. Because of the urbanization, urban forest in Nagoya City has been degrading. City’s green area occupied only 22 % of the total area of the city (Nagoya City, 2015).
2.2 Method
A multi-point forest field survey was conducted. Up to now, nearly 200 forest sites in the city have surveyed. In this study, forest is defined as 1ha and more canopy area in the city. In each forest, 100m2, 300m2 or 400m2 study sites were set up for a field survey which is similar with Hayashi and Ooba (2015, in press).
After collecting the basic data, several ESs were calculated and mapped including biodiversity related topics, regulating services, supporting services and cultural services.
3. Conclusions
Based on the assessment of the ES mappings, conservation priority was developed taking into consideration the distribution of the ES potential supply.
Acknowledgement
We thank the Nagoya City Greenification and Public Works Bureau and many forest owners. We thank N. Yoshino, W. Kobayashi, N. Kawaguchi, J. Okata, H. Takagi, T. Matsumoto, H. Sumi and others for their assistance. This was supported by KAKENHI15K00622 from JSPS, Japan.
References
Nagoya City. 2015. Green coverage research in Nagoya. Nagoya City office web site: http://www.city.nagoya.jp/shisei/category/53-3-3-1-0-0-0-0-0-0.html. (in Japanese)
Hayashi, K., and Ooba, M. 2015. A framework study on the methodology of biodiversity offset assessment in Japan—Hypothetical case of GIS screening and on-site field assessment—. IAIA15 Web Proceedings, http://conferences.iaia.org/2015/final_papers.php, accessed November 25 2016.
Hayashi, K., Ooba, M. (in press) Spatial assessment of cultural ecosystem services for urban forests based on a multi-pointfield survey: case in Nagoya City, Japan. IJERD8-2.
A-2-4
46

An Initiative of SEA for the Local Energy Transition
Jong-Gwan Jung
Chungnam Institue, Korea Keywords: Energy Transition, SEA, scenario, participatory planning
1. IntroductionEnergy transition is generally defined as a long-term structural change in energy systems. That is a particularly significant set of changes to the patterns of energy use in a society, potentially affecting resources, carriers, converters, and services. Particularly the debate on phase-out of coal and nuclear power plants is progressing rapidly due to changes in internal conditions, including the occurrence of earthquakes and frequent air quality deterioration issues in Korea. The Korean Ministry of Commerce Industry and Energy has announced the ‘Renewable Energy
3020 Plan’, which is to extend the portion of
renewable energy mix to a target of 20% by 2030. In this context, to achieve this target we need ambitious action plan in the provincial level. And cumulative effects are part of the framework for the local energy transition at the project levels according to the application of the back-casting scenario schemes.
2. MethodWe set up representative model to forecast thefuture energy system by using accumulateddataset on energy consumption and supply, whichis to estimate the change in specific point of future.And then draw out critical variables to predict thatwill affect the energy system.By accepting these conditions, we set 3 scenarios,such as CE(carbon economy) as is to maintainexisted trends, NE(new energy) with technologyinnovation and focus on the hydrogen industry inlow growth era, and EC(energy citizen) with post-coal renewable sources. In the process ofscenario setting, we selected quantitative variablesto energy demand for each section. And futureestimation of these are used based on thestatistical database and regional development plansuch as population, GRDP, and added valuealong the industry.
3. ResultUnder the condition that congested coal-firedpower plants in Chungnam Province, we needsome strategies to reflect the diverse possibilityand constraints through the transition scenarios. Atransition toward sustainable energy is the shift todecentralized renewable energy and efficiency.Although so far these shifts have been replacingcoal-fired energy, their declared goal is theabolishment of coal, reducing non-renewableenergy sources and the creation of an energysystem based on 60% renewable energy by 2050.Achieving the necessary energy transition willrequire interests to be weighted at national andlocal level. SEA can support the discussionsamong many stakeholders by presenting theoptions for transition. This may also assist inreducing public resistance to plans for transition.Energy Vision of Chungnam Province containsaspirations for 2050 and a vision on the directionof developments within the area for ensuringcomplete energy neutral in 2050.We suggested Provincial energy vision with theobjective to transit all the traditional energy torenewables expressed as a slogan of ‘Full of
starlight made by energy citizen’. This includes the
participatory planning that making a plan andimplement to invest demand side managementand renewables development scheme as anenergy transition process. This would bringmultiple benefits such as better quality of life, jobcreation and social inclusive growth.
References Canter, L. (2015), Cumulative Effects Assessment and Management, pp.269~273. World Bank (2017), Environmental Assessment: Emerging Lessons Series #3, Washington DC, pp. 31~36. NCEA (2018), Views and Experiences, pp. 26~27
B-2-1
47

Comparative Study on Tiering Systems in Strategic Environmental Assessments in Japan and the United
States
Keisuke GOTO1, Akira TANAKA2
1Tokyo City University, Japan 2 Tokyo City University, Japan
Keywords: Tiering, SEA, Policy, Plan, Program
1. Introduction
In Japan, implementation of the environmental impact assessment (EIA) process in earlier stages is promoted. Correspondingly, tiering is utilized, however, it is noted that tiering used in Japan does not have original meaning of tiering. Therefore, this study clarifies and compares the definitions of tiering used in Japan and the United States
2. Method
This study clarifies the definitions of tiering used in Japan and the United States by consulting the relevant statutes, directives and guidelines implemented in Japan and the United States.
3. Conclusions
Tiering used in the countries surveyed are presented in Table 1. It is noted that, in the United States, tiering refers to the difference in the scale and characteristics of decision-making in the prior and later tiers in the tiered process and collection of information at each tier according to the corresponding characteristics. On the other hand, in Japan, tiering refers to using, in the later tier, the information collected in the prior tier.
Table 1: Definitions of tiering in the countries surveyed
Countries surveyed
Tiering
Japan Tiering in the plan stage refers to utilizing or reflectiong on the information and result collected in the plan stage of the research in the
investigation, forecasting, and evaluation stages to make the EIA process effective and reasonable … .
United States
Agencies are encouraged to tier their environmental impact statements to eliminate repetitive discussions of the same issues and to focus on the actual issues ripe for decision at each level of environmental review (§1508.28). Whenever a broadenvironmental impact statement hasbeen prepared (such as a programor policy statement) and a subsequent statement or environmental assessment is then prepared on an action included within the entire program or policy (such as a site specific action) the subsequent statement or environmental assessment need only summarize the issues discussed in the broader statement and incorporate discussions from the broader statement by reference and shall concentrate on the issues specific to the subsequent action.
Source: Environment Agency (2013) [Japan]; Council on Environmental Quality (1970) [United States]
References
Environment Agency (2013) Technical Guide to Consideration in Plan Stage, 189pp. (This is an English translation of the original text written in Japanese)
Council on Environmental Quality (1970) Regulations for Implementing NEPA.
B-2-2
48

Total factor productivity analysis considering environment and energy factors Zhang Qihui1, Mao Xianqiang1
1Beijing Normal University Keywords: Total factor productivity; environment; energy; DEA; EKC
1.Introduction
In past four decades, rapid economic growth has caused great energy consumption and serious environmental and ecological problems in China. China is now the world's largest energy-consuming country and the largest emitter of carbon dioxide (CO2). In 2017, the total energy consumption reached 4.47 billion tons of standard coal equivalent (SCE), which is about 7.82 times that of 1978. Therefore, adjusting the energy structure and increasing the efficiency of energy use will greatly benefit the building of an environment-friendly society. Recently, China has introduced a series of policy measures to adjust the energy structure and increase the proportion of non-fossil energy sources. Does energy structure adjustment improve energy efficiency and reduce CO2 emissions? What is the optimal energy structure? What are the energy efficiencies of different energy types? And what is the potential CO2 emission reduction after china's energy structure adjustment? These issues will be discussed in this article.
2.Methods
2.1 The environmental Kuznets curve (EKC) analysis EKC hypothesis attempts to explain the impact of economic development on environmental pollution by simulating the evolution between per capita income and environmental pollution indicators. In general, the environmental Kuznets curve presents an inverted "U" type. The basic model of the environmental Kuznets curve is as follows.
Yi= αi + β1xi + β2xi2 + β3xi
3 + εi (1)
Where Y denotes per capita CO2 emissions or CO2 emissions per unit of GDP; x denotes per capita regional GDP; subscript i denotes different cities or regions; α is a constant; βk is a coefficient
of the k-th explanatory variable; ε is a random error term.
2.2 Data Envelopment Analysis (DEA)
Data Envelopment Analysis (DEA) is an efficiency evaluation method based on the concept of relative efficiency. In this study, a calculation model SBM model considering undesired outputs is used. Assuming there are n DMUs, each DMU contains m inputs and s outputs. The calculation method is as follows.
0s0,s,0s0,λ
sλYy
sλYy sXλxs.t.
)/yS/yS(ss
11
/xm11
ρ min
bg
bbb
gggo
s
1r
s
1r
bbr
ggr
21
m
1iioi
o
o
1 2
roro
s
³³³³
+=
-=
+=
++
-
-=
-
-
= =
=
-
å å
å
(2)
3.Preliminary Conclusions
The EKC curve of China's urban CO2 emissions presents an inverted "N" type, most cities in China are near the highest point of the curve. Since there are great disparities in potential energy savings and CO2 emission reductions in regions, policy making for the efficiency improvement should take these differences into consideration. Energy structure adjustment by decreasing coal consumption while increasing other energies’ supplies is an effective way to improve the efficiencies of coal dominated energy structure in China. Promoting non-fossil energy is an important way to adjust the existing energy structure. However, this should be done according to local conditions.
Reference
Onater-Isberk E (2016) Environmental Kuznets curve under noncarbohydrate energy, Renewable & Sustainable Energy Reviews, 64:338-347.
B-2-3
49

Strategic Environmental Assessment Framework for Carbon Capture and Storage in Japan
Kentaro Nakamura ,Kenichiro Yanagi, Eiji Komatsu and Akihiro Nakamura
Centre for Environmental Law, Meiji University, Japan Keywords: Carbon Capture and Storage (CCS), SEA, Environmental law, Climate change, Long-term liability
1. Current legal framework of EIS for CCS inJapan
Current legal framework of EIS for Carbon Capture and Storage (CCS) in Japan is stipulated in the Marine Pollution and Prevention Law. However, the environmental impact assessment law does not target for CCS project itself.
2. Uncertainties of CCS projects
CCS has scientific and technological uncertainties (e.g. data or facts on leakage) and uncertainties due to long time scale of CO2 storage. Considering some of cancelled large-scale projects in EU, these uncertainties, along with financial problems, are key factors of success of the projects.
3, Role of SEA
EIA will contribute to find and provide knowledge to improve scientific and technological uncertainties, and legal framework of long-term liability contribute to assure uncertainties due to long time scale. For success of individual CCS projects, it is important to assess appropriately and enhance public understanding for the common
factors (features and risks of CCS technology, or its role in national policy of climate change and energy) in every CCS projects, as well as for the factors derived from individual projects. In SEA process, each of feasible multiple scenarios developed by a project planner will be made an impact assessment in aspect of environment, society and economy, so that the best scenario will be identified. In this point, SEA will play an important role because it assesses upper level policies or plans of individual CCS projects.
4. Conclusions
Much of cost for current CCS projects have to rely on national subsidies for much of its large cost, and long time scale storage needs to take account of impacts on future generations. As a result, public acceptance is critical, and to set a legal framework for CCS and apply SEA is expected to enhance public acceptance in Japan. Therefore, it is important to implement SEA in Japan for policies and upper plans including CCS. It is an urgent matter that reflecting result of SEA in policies or plans to overcome challenges and barriers of CCS projects, and designing a long-term policy strategy plans and programs for deploying and increasing CCS.
References
K. Yanagi (2011), Comprehensive study ofenvironmental assessment law, Seibunsha ,pp.105-107.This study is supported by “EnvironmentResearch and Technology DevelopmentFund of the Ministry of the Environment,Japan”.
- Long-term GHG Reduction Target, - Strategic Energy Plan,- Act on Promotion of Global Warming Countermeasures,
- Science and Technology Basic Plan
R&D, Policyframework
GHG Reduction framework
Permitting framework
R&DPolicy
DemonstrationProject
CCS Installation
Policy
Price and limit on emissions
Permitting process of
CCS
Regulations‐safe
‐environment
Post‐closure framework
Closure Permit
Transfer of responsibility
・Measures of significant irregularities or leakages
・Financial security
CCS legal framework
CCS development and installation policy
CCSSEA
Figure 1: Role of SEA for CCS framework
B-2-4
50

Experiences of advisory panel on environmental and social consideration in JICA
Takehiko Murayama
Tokyo Institute of Technology, Japan Keywords: Environmental and social consideration, Development Assistance, Infrastructure project
1. Introduction
Japan International Cooperation Agency (JICA)has started an advisory committee onenvironmental and social consideration for theprojects in 2004. In 2010, the guideline was revisedin response to organizational change in 2008. Fromthe beginning of the committee, the author hascontributed as a chair, and we have someexperiences on advices for specific projects. In thispresentation, the outline of activities of thecommittee as well as our advices for the projectsare summarized.
2. Activities of the panel
Currently, the committee consists of 24 members who come from academia, research institutes, consultants as well as NGOs. We review the projects categorized in A (and B if necessary). In general, we have discussions with JICA members twice, the first stage of scoping period after implementation of initial environmental examination (IEE), and the second stage after draft final report has been completed. For each project, we organize a working group and have opportunities to discuss with JICA staffs and study group members in the above two stages. In addition, we have plenary meetings hold on monthly basis, and finalize our comment drafted by the working group.
3. Comments of the panel
Table 1 shows distribution of the panel’s advices for targeted projects between 2016 and 2017. The most frequently advised points were alternative analysis, and it was followed by livelihood restoration, explanation to the local stakeholders,
Local safety & health, and biodiversity. In addition, text mining method was applied for the committee’s advices related to recent projects.
4. Effects and challenges
Effects of committee’s activities would include the following points, improvement of project reports in view of technical aspect, upgrading the reports on justification and verification of the project, proposal of additional studies and advices on careful consideration to large-scale projects with uncertain impacts. We also have challenges including insufficient Information at earlier stage of proposed projects, mixture of certain and uncertain aspects of findings, limited information on projects’ sites, conflicts of views for controversial projects.
Reference
Murayama, Kawazoe, Matsumoto and Sakurai (2012): JICA’s Advisory Committee: Benefits and challenges”, IAIA Annual Meeting.
Table 1 Distribution of the panel’s advices
Item Number Alternative analysis 67 Livelihood restoration 53 Explanation for local stakeholders 41 Local safety and health 24 Biodiversity 23 Vulnerable groups 22 Monitoring 21 Resettlement 20 Noise, Vibration 16 Air pollution 14 Waste 14 Cultural heritage 14 Others 211 Total 540
A-3-1
51

Social Impacts and the Human Rights Approach in Asia
Naoyuki Sakumoto
Japan External Trade Organization/JETRO, Japan
Keywords: EIA/SEA, social considerations, human rights, SDGs, Aarhus Convention, UN Guiding Principles on Business and Human Rights
1. Introduction
Most Asian countries have undergone politicaldemocratization process in late years, however,many do not reach the attainment of socialdemocratization stage including environmentaldemocracy. From the point of effective EIAimplementation, democratic aspects based onhuman rights are regarded indispensable. In thiscontext, the need for EIA decision-making processin a democratic manner will be focused, togetherwith the discussion how Asian countries areranked in “international standards.” We are nolonger allowed to single out environment issuesalone for discussion without considering otherglobal factors under SDGs framework.
2. Title: Social Impacts and the Human RightsApproach in Asia
2.1 General Situation of EIA/SEAs in Asia and the need for social considerations
The status and role of EIA/SEA as one of the environmental management instruments in Asia is examined. The need for paying attention to social considerations is understood indispensable under any socio-political and environmental condiitons.
2.2 Tasks and gaps in implementing EIAs and the overcoming efforts
Up to the present, various efforts to develop EIA have been made to strengthen EIAs in Asia through different channels and stages. However, environmental democracy situation in Asia is still weak and the constraints to rights approach are existing. Studies on the human rights approach to the environment in some Asian countries at a
Constitutional level, environmental democracy indexation result, and the environment-related human rights infringement cases are introduced.
2.3 Towards the internationally standardized environmental goals
Three environment-related international goals, including SDGs, Aarhus Convention, UN Guiding Principles on Business and Human Rights, are discussed and analyzed to examine the underlying basic principles. These documents are regarded important from the point of identifying the basic principles and specifying the roles and responsibilities of environmental actors in realizing environmental democracy.
3. Conclusions
Asian countries are still fragile in the attainment of environmental democratization. EIA can be referred to as a Roman God “Janus” who has two contrasting faces of democratic and regulatory aspects. Development of public participation in EIA symbolizes the degree of democratized decision-making process in respective country. In this point, human rights approach depends much on respective country’s political and social situation, however, it should not be ignored.
References
UNECE (United Nations Economic Commission for Europe). The Aarhus Convention: An Implementation Guide (2nd ed., 2014).
WRI (World Resources Institute). “Environmental Democracy Index,” (https://environmentaldemocracyindex.org/)
A-3-2
52

EIA implementation and challenges in Myanmar - Survey with possible support from Japan Kaoru Akahoshi1, Shunsuke Hieda2 and Naoko Genjida1
1Institute for Global Environmental Strategies (IGES), Japan and 2Nippon Koei Co., Ltd., Japan Keywords: EIA, Bilateral Cooperation, Capacity Building, Myanmar, Japan
1. IntroductionMinistry of Natural Resource and EnvironmentConservation (MONREC), Myanmar introducedEIA procedure (EIAP) in December 2015. TheMinistry of Environment Japan (MOEJ) wasconsidering to support Myanmar which stands atthe initial stage of effective implementation of EIA.As a starting point, MOEJ, Institute of GlobalEnvironmental Strategies (IGES), and NipponKoei Co. Ltd. conducted a ground survey andinterviewed MONREC officials, NGOs,Environmental consultants, and Japanesebusinesses in Myanmar on EIA related issues inNovember 2017. Based on that survey, severalcooperation programs have been devised aspossible means of Japan’s cooperation to thecountry. We will introduce the results of the survey and discuss possible supports Japan couldprovide to Myanmar.
2. Current problems on the ground2.1 Current situation and challengesMyanmar's assessment has three types ofprocedures namely EIA, Initial EnvironmentalExamination (IEE), and EnvironmentManagement Plan (EMP). According to theinterview survey, several issues MONREC facesin the operation of EIAP, and existing supportprograms for MONREC provided by variousdevelopment assistance organizations wereidentified. The existing problems are: Issues related to EIAP institutions (e.g. The
targets are quite extensive; Existing casesare also requested to go through EIAP.)
Issues related to EIAP enforcement (e.g.More than 2,500 cases have on the waitinglist to get reviewed.)
Lacking in human resources (both MONREC staff and environmental consultants)
Insufficient of technical capability As for these problems, the necessity of supportwith the mid- to long-term span has beenconfirmed. In addition, another urgent issue is thatMONREC plans to drastically increase thenumber of staff in the future aiming fordecentralization to the local branch department.
The large number of new staff with various background need capacity building on basics of environmental problems and technical knowledge for EIA work. 2.2 Consideration of a cooperation program As for drafting cooperation programs, following points were taken into consideration: to be flexible as MONREC is still in the early stage of EIA implementation; to avoid overlapping of supporting programs and cooperate with other donors; to utilize the strengths of Japan especially in forecast and evaluation technics of environmental impacts that has not been supported by other donors yet; to utilize IGES’ research and analysis in EIA in neighboring Asian countries to support Myanmar.
3. Possible cooperation and points to note3.1 Support programs planned:
1) Provision of EIA technical guidebook2) Technical training for new staff: Basicinformation and assessment training3) Setting up a help desk for businesses onEIA (Web-site based)4) Establishing a monitoring database on EIAimplementation status
3.2 Challenges to be addressed : How we could help MONREC staff to
understand the importance of EIA rather than conducting EIA as a simple administrativeprocedure to get funds.
How to motivate trainees who could be so-called “training fatigue” by taking lots oftraining from various donors.
In the long term, wider scale of institutionalreform might need to be also considered.
References
MOEJ, IGES, Nippon Koei Co. Ltd., et al. (2018) Commissioned Report for Promoting Asian Regional Collaboration on EIA: pp171-226, Appendix: pp1141-1221
Japan Association of Environmental Assessment (2017) Technical Guidebook on EIA: pp6-303
A-3-3
53

Environmental and economic impacts of “the Belt and Road Initiative” on typical countries alongside
Jianhong Lu1, Zhengyan Liu1, Peng Song2,Xianqiang Mao*,1
1School of Environment, Beijing Normal University, No. 19 Xinjiekouwai street, Beijing 100875, P. R. China
2 School of Public Affairs, Chongqing University, No. 174 Shazheng street, Chongqing 400044, P. R. China
Keywords: “the Belt and Road Initiative”, trade policy, Environmental Impact Assessment, GTAP model, NTBs reduction
1. Introduction
“The Belt and Road Initiative” is an ambitious
economic vision. It will promote the opening-up of
and cooperation among the countries along this
route, and also generate economic and
environmental impacts on those countries which
are currently facing the most challenging
development and environmental problem. But
there have yet been no studies to analyze the
economic and environmental consequence of the
most important trade liberalization. This research
aims to identify the environmental and economic
impacts of “The Belt and Road Initiative” from the
angle of NTBs reduction.
2. Methodology and Data
2.1 Methodology
GTAP Model is a multi-sector, multi-regional
computable general equilibrium (CGE) model,
which is employed to simulate the economic
impact of NTBs reduction due to the Belt and
Road as a basis for projecting its environmental
impact.
Low, moderate and high trade facilitation
scenarios were established to simulate different
implementation efforts on basis of baseline
scenario. Considering the planning of the Belt and
Road and trade volume, the change of NTBs
between ASEAN and China, Russia and China,
India and China, European Union and China were
simulated in this study.
2.2 Data sources
Main data for GTAP model is derived from GTAP
9 database. The sectoral GHGs and pollutant
emissions factor data of China and other trade
partners in 2011 are drawn from WIOD. AVEs of
NTBs used in this study come from the research
Overall Trade Restrictiveness Indices and Import
Demand Elasticities published by World Bank
(Kee et.al, 2006).
3. Conclusions
“The Belt and Road Initiative” will bring a win-win
consequence to objective regions. Social welfare
and GDP of China, ASEAN, India, EU and Russia
rise in different simulated scenarios, which shows
the positive effect of “The Belt and Road Initiative”
on economics. The various changes of imports
and exports in different sectors of different regions
shows that “The Belt and Road Initiative” allows
the countries and regions to maximize its
comparative advantages in manufacture goods.
From the perspective of environmental impact,
total GHGs and pollutants (SOx, NOx) emissions
of China, ASEAN, India and Russia decrease,
GHGs and NOx emissions in EU decrease but
SOx emissions in EU increase. These changes in
different regions take global GHGs, SOx and NOx
emissions decrease, which means this strategy
can facilitate a downward trend of global total
GHGs and pollutants emissions.
References
Kee, H.L.,Olarreaga, M., Nicita, A. 2006.
Estimating Trade Restrictiveness Indices.
The Economic Journal 119(7): 172-199.
A-3-4
54

A Comparative Study of EIA System Between China and Vietnam: Biodiversity and Climate Factors into Green One
Belt One Road Initiative
Rui Huang1
1Beijing Normal University, China Keywords: EIA system, Comparative Study, Biodiversity, Climate Factors, Green One Belt One Road Initiative
1. Introduction
Since 2013, China putting forward its One BeltOne Road Strategy, the cooperation betweenChina and Vietnam in political, economic andenvironmental protection tends to closer andcloser. Meanwhile, as one of the fastest growingcountries in the region, Vietnam is facing both theopportunities and challenges from the internationalcommunity, which is also a double-edged swordfor its natural environment, threatening the localbiodiversity and increasing the adverse impact ofclimate factors. Though both China and Vietnamhave been developing national environmentalimpact assessment (EIA) for decades, there aresignificant differences between the systems.
2. Description and comparative analysis ofEIA system in China and Vietnam
As SEA in the two countries is still in the early stage of development, this study mainly compares the EIA for construction projects.
2.1 Legal guarantee
EIA is required by environmental legal system and guided by specific regulations in both countries. While only Vietnam requires the protection of biodiversity by law.
2.2 Purpose
EIA focuses more on coordinated development of economy and environment in China, and reflection of environmental protection in social activities in Vietnam.
2.3 Structure of reports
More bio-diversification content is involved in Vietnam’s EIA structure according to the official circular.
2.4 Appraisal process
The decision-making authority in both countries regulates the preparation and implementation of EIA through the appraisal process.
2.5 Public participation
There is more attention to climate factors and necessary components for public participation in Vietnam.
3. Conclusions
The comparison between Vietnamese and Chinese EIA systems shows possible ways to seek common ground while reserving differences in bilateral cooperation, which is the key to flourish the development and build Green One Belt One Road Initiative.
References
Alison Clausen, Hoang H. Vu, M. Pedrono (2011). An evaluation of the environmental impact assessment system in Vietnam: The gap between theory and practice. Environmental Impact Assessment Review, 31(2).
Law on Environmental Protection. Vietnam, 2005
Law of People’s Republic of China on Environ-mental Impact Assessment, 2016
A-3-5
55

Geothermal Development Potential Evaluation Considering Environmental and Social Conditions
Takumi Nagashima1, Takehiko Murayama1, Atsushi Nagaoka1, and Shigeo Nishikizawa1 1 Tokyo Institute of Tecnology, Japan
Keywords: Renewable Energy Potential, Geothermal Development, GIS, Energy Policy, Sociacceptability
1. Introduction and purposeAmount of geormal resource development in
Japan is 2% of estimated amount of viability.Evaluation of geormal development potential isbeing studied as a promotion measure fordevelopment. However, it is pointed out thatconsideration of environmental and socialconditions is not sufficient. Purpose of this research is to evaluate potential of geothermal development considering more expanded environmental and social conditions and to clarify issues for introducing geothermal power generation in Japan in the future.
2. MethodBased on survey conducted by Japanese
Ministry of the Environment in 2014, data on fourkinds of environmental and social conditions notconsidered were added and analyzed (Figure 1). 2out of 4 analyzes are described in the next part.
3. Result3.1 Effect from deregulation in National parksThe amount of geothermal resources that can be
drilled in Type 1 Special Region where thederegulation was made in 2017 was calculated.The main results are shown in Table 1.Result shows 9.3% of drilling geothermal
resources existed in this area nationwide average,indicating the possibility that these can be drilleddue to deregulation.
Table1 resources in type 1 special area
3.2 Population change around resources For Akita Prefecture and Oita Prefecture, it was
clarified how much population exists in area 2 km from geothermal resource (about 2010 statistics and estimates in 2050) and rate of change in population. Area map about distribution of resources and population is shown in Figure 2, and result is shown in Table 2. As a result, in both prefectures, the population
declines by more than 30% in 2050, and in Akita prefecture the population will be halved. This suggests Akita would have a lower development risk in terms of impacts to living environment.
Figure 1 Distribution of resources and population (in Ooita Prefecture)
Table 2 Population near resource (2010, 2050)
4. ConclusionsThe following findings were obtained by four
analyzes.
- In the national level, 1) Deregulation in nationalpark type 1 special areas increase geothermalresources equivalent to 9.3% in national level. 2)Considering the influence from the existing hotspring area, new geothermal resources of 20%or more would be newly considered.
- From case study for two prefectures, 3) Thepopulation near geothermal resources tends todecrease by 30% or more. 4)The impact ofeconomic activities considering accommodationcapacity would be high at around 40%.
Reference Jouju Uechi, et al. (2016) Conflict Analysis over
Geothermal Power Developments, lanning and public management, No. 39(3), pp.44-57.
Figure 1 Research Framework
Evaluation of Geothermal Development Potential in Japan
Evaluation of Geothermal Development Potential
in Akita and Ooita prefecture
Analysis ④Consideration of accommodation
capacities
Analysis ③Population
change around geothermal resources
Analysis ②: Consideration of
distance from hot spring areas
Analysis ①:Effect from
deregulation in National parks
Environmental condition
Social condition
Social condition
Social condition
Hot Spring Locations
Geothermal resources
National park areas
Current laws on geothermal
power generation
Statistical population
(2010)Estimated population
(2050)
Selectedareas
Accommodation capacities
Geothermal resources
Current laws on geothermal
power generation
Used data Used data
Ratio
10.8%
21.5%
55.8%9.3%Total 22,202,520 2,067,467
Prefecture Total (kw)Within Type 1 Special
Area(kw)Hokkaido 2,779,098 300,866
Akita 2,071,153 444,817
Toyama 618,523 345,174
Ooita 142,415 97,243 68.3%
change rate(Base: 2010)2010 2050
Akita 21,457 11,589 54.0%
PrefecturePopulation
B-3-1
56
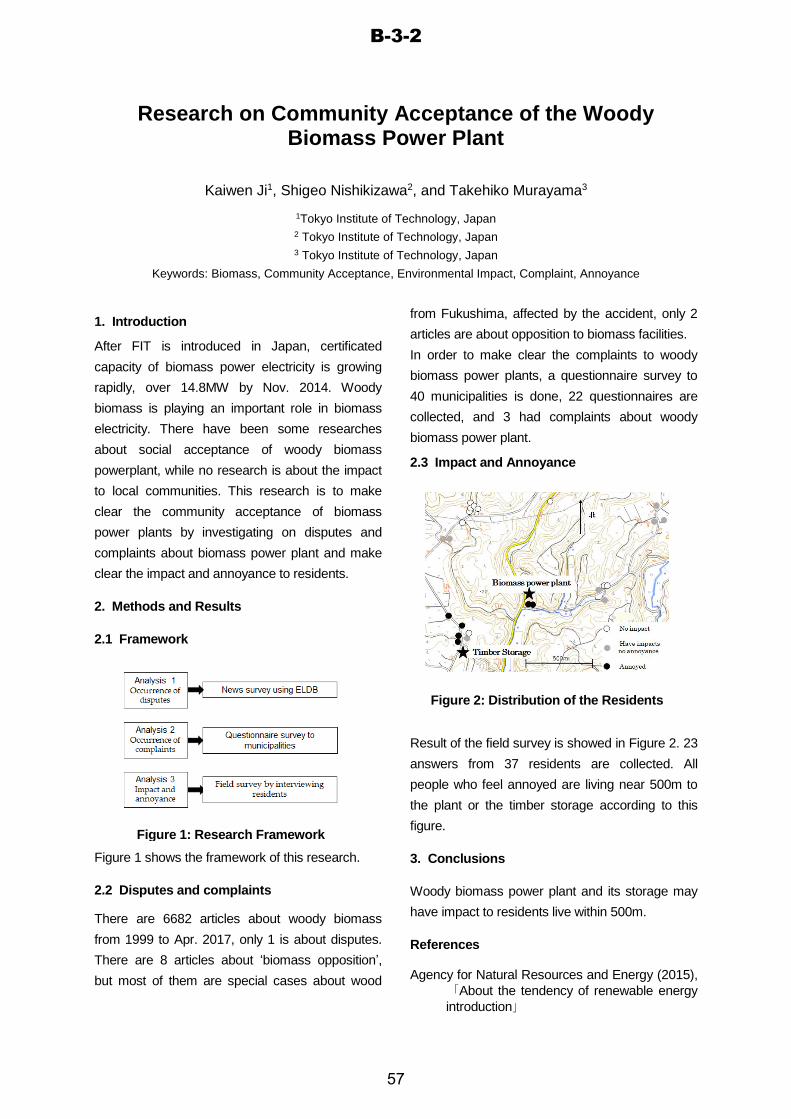
Research on Community Acceptance of the Woody Biomass Power Plant
Kaiwen Ji1, Shigeo Nishikizawa2, and Takehiko Murayama3
1Tokyo Institute of Technology, Japan 2 Tokyo Institute of Technology, Japan 3 Tokyo Institute of Technology, Japan
Keywords: Biomass, Community Acceptance, Environmental Impact, Complaint, Annoyance
1. Introduction
After FIT is introduced in Japan, certificated capacity of biomass power electricity is growing rapidly, over 14.8MW by Nov. 2014. Woody biomass is playing an important role in biomass electricity. There have been some researches about social acceptance of woody biomass powerplant, while no research is about the impact to local communities. This research is to make clear the community acceptance of biomass power plants by investigating on disputes and complaints about biomass power plant and make clear the impact and annoyance to residents.
2. Methods and Results
2.1 Framework
Figure 1 shows the framework of this research.
2.2 Disputes and complaints
There are 6682 articles about woody biomass from 1999 to Apr. 2017, only 1 is about disputes. There are 8 articles about ‘biomass opposition’, but most of them are special cases about wood
from Fukushima, affected by the accident, only 2 articles are about opposition to biomass facilities. In order to make clear the complaints to woody biomass power plants, a questionnaire survey to 40 municipalities is done, 22 questionnaires are collected, and 3 had complaints about woody biomass power plant.
2.3 Impact and Annoyance
Result of the field survey is showed in Figure 2. 23 answers from 37 residents are collected. All people who feel annoyed are living near 500m to the plant or the timber storage according to this figure.
3. Conclusions
Woody biomass power plant and its storage may have impact to residents live within 500m.
References
Agency for Natural Resources and Energy (2015),「About the tendency of renewable energy introduction」
Figure 2: Distribution of the Residents
Figure 1: Research Framework
B-3-2
57

Sustainable Energy and SDGs -From the first RE100 university in Japan-
Sachihiko Harashina1, and Yurika Ayukawa1
1Chiba University of Commerce, Japan Keywords: Renewable Energy, RE100, Natural Energy, Heart-ware, CUC
1. IntroductionThe goal 13 of the SDGs, Climate Action, is quite important for sustainable future. The RE100 movement is a good way to shift energy policy sustainable, as concrete activities indicating the possibility of renewables should work effectively to change the mind of the people. The first RE100 University in Japan was appeared in 2018, which is Chiba University of Commerce, CUC.
2. Three wares for introducing renewables
To change a policy in a society, three types of wares of hardware, software and heart-ware are necessary as shown in the figure. The authors started the actions towards RE100 by holding open seminar series for enlightenment, a measure for Heart-ware creation, of the CUC community in 2013 when the Feed in Tariff system to promote renewables was started. In the same year, CUC management installed a mega solar PV as a fund operation by applying FIT on the Noda site 10km far from the main campus in Ichikawa. The performance in 2014, the first year, was quite good. The electricity produced was equivalent to 77% of that consumed in the main campus.
3. The process to be the first RE100
Then, Dr. Harashina, as Dean of the Faculty of Policy Informatics at that time, launched “Energy
saving and energy generating project” in 2014,
and a feasibility study on RE100 in electricity was conducted, supported by government subsidy, and lead by Prof. Ayukawa with the help of outside experts, together with students in 2015. The result of the study showed the possibility. Becoming the CUC president In 2017, Dr. Harashina authoraized
Hardware
Energy Efficiency and Generation
Software
Visualization and Management
■EMS■Monitoring:
Generation andConsumption
■Optimization
Heart-ware
■Energy abuse survey (by Students)
■Incentives bysprinkling action
■Incentives bygreen shades
Incentives by experiences
■Mega Solar PV■LED Lighting■Rooftop PV■Solar Thermal
etc.
Hardware to empower human action
Man-machineinteractiveeffect
Datarequests
Data
Control
Action feedbackHints of
improvement
the project as a university activity and decided investments of installing such hardware as LEDs for lightings of all buildings and additional solar panels at the Noda solar plant and introduced such software as EMS. These actions were taken within FY2017 and CUC became, theoretically, the first RE100 University in Japan, which is on electricity. CUC is examining it by monitoring the performance within FY2018.
4. Next stepCUC also sets more ambitious goal as RE100, which is on total energy use including not only electricity but also heating until FY2020. To achieve the 2020 goal, we will work with students for energy saving, and make investments for energy producing by installing more rooftop solar panels and a bio-gas turbine in the main campus. We believe that the power of commerce could change the society towards sustainable energy.
References CUC Press Release (2017) Towards the 1st RE
100 University in Japan. 13, November 2017
B-3-3
58

The relation between thermal stratification strength and carbon cycle in a stratified reservoir
Hyungseok Park, Sewoong Chung, Sungjin Kim, Eunju Lee
1Chungbuk National University, Korea Keywords: Carbon cycle, GHGs, Lake number, Lake Analyzer, Schmidt stability
1. Introduction
Inland waters take an important role of the globalcarbon budget estimation because of the ability tostore, decompose and emission organic carbonfrom watersheds (Battin et al., 2009). Over 1million dams globally were reported that importantsource of GHGs as like CO2, CH4, N2O (Demeer,2016). However, studies on the 'pulse emission'mechanism occurring during the convective mixingof atmosphere-water surface and turnover havebeen insufficiency. The aim of this study was todiscover the relation between thermal stratificationstrength and carbon cycle using measured data ofpCO2, temperature profiles.
2. Materials and Methods
Monitoring was performed during July–December 2017 at the Daecheong Reservoir in Korea. Weather (temperature, precipitation, wind direction & speed) and reservoir operation data (inflow, outflow, water level) collected from Korean Meteorological Administration and K-water. To survey the seasonal changes of stratification in the reservoir, thermistor chain (15 ea) was installed in front of the dam from 0 to 33 m by depth, measuring data every 10 minute. Schmidt stability(St) and Lake number(LN) as indicators of stratification strength in the waterbody were calculated from collected temperature data using rLakeAnalyzer package in R. In situ pCO2 was measured to survey for distribution of CO2 partial pressure by water depth using a submersible NDIR detector (Pro-Mini CO2, Pro-Oceanus Systems Inc., 2016).
3. Results and discussion
At the beginning of the survey, the temperature was 26.7℃ in the middle of July, St was 2383 J m-
2 that stable thermal stratification was formed. And, highest St showed 2674 J m-2 on August 12. As the average temperature dropped below 10 ℃ at the end of October, the thickness of metalimnion decreased sharply (8.8 -> 4.4 m) and the thermal stratification intensity weakened(St 790.2 J m-2). During mixture between the upper and lower layer by turnover mechanism, the pCO2 of the upper layer increased and the pCO2 of the lower layer decreased, approaching the equilibrium concentration.
4. Conclusions
pCO2 was oversaturated under the thermocline during the period in which a stable thermal stratification was formed. Which is caused of accumulated inorganic carbon from decomposition of organic carbon in the bottom layer. pCO2 of whole layer was supersaturated to 632.6 - 1454.0 uatm after turnover.
References
Battin, T. J., S. Luyssaert, L. A. Kaplan, A. K. Aufdenkampe, A. Richter, and L. J. Tranvik (2009): The boundless carbon cycle. Nature Geoscience, 2, pp. 598-600.
This research was supported by the Ministry of Education, Republic of Korea and National Research Foundation of Korea in 2017. (National Research Foundation of Korea-2016-R1D1A3B03-2016131042)
B-3-4
59

Comparative Analysis of Efforts for Environment Conservation by Travel Companies on Ecotour with
Accommodation between Japan and Australia
Jun Otsuka1, Hideyuki Ito2, Takahiro Fujii2
1Nihon University, Graduate School, Japan 2Nihon University, Japan
Keywords: Tourism, Ecotourism, Eco Certification Program, Tour Operation, Accommodation, Australia, Japan
1. Introduction
Ecotourism is defined responsible travel to natural areas that conserves the environment, sustains the well-being of the local people, and involves interpretation and education. Recently, ecotours based on ecotourism concept have being held in various regions of Japan. However, according to existing research (Ito et al. 2016), it is shown that the efforts for environmental conservation of ecotours without accommodation in Japan is inferior to that of Australian ecotours. Therefore, the purpose of this research is to compare the efforts for environment conservation by travel companies between Japan and Australia using questionnaire survey with focusing on ecotours with accommodation.
2. Questionnaire Survey
The questionnaire in this research was developed based on Australia's advanced certification program that is called "Eco certification program". This Eco certification program is consisted of 55 evaluation items. For simplifying this, we selected and summarized to 39 items by cutting off the items related to Australian aborigines and integrating the questions concerning efforts of environmental conservation of each transportation mode. Consequently, the evaluation items in the questionnaire were questions such as service quality of ecotour, involvement of local communities and efforts for energy saving of accommodation. We asked to answer the
questionnaire to all travel companies operated ecotours in Japan and Australia in five point scale.
3. Results
The total score was calculated by sum of each score of evaluation items. As the result, the both total score of most ecotours and the average score of each ecotour in Australia were higher than that of Japan.
4. Conclusion
It was concluded that the ecotours with accommodation in Japan had many problems such as insufficient actions for environmental conservation, unclear conservation target and no criteria for assessing the ecotours in Japan. Therefore, it could be said that it is necessary to introduce certification program for better ecotours in Japan.
References
Ito, H., Nakayama, Y., Fujii, T. (2016) Comparative Study on Ecotours of Australia and Japan Based on International Criteria (GSTC) of Ecotourism , Technical Papers of the 19th Annual Meeting, Japan Association for Human and Environmental Symbiosis, Vol.19, pp.1-6.
Lee, H. W., Moscardo, G. (2005) Understanding the Impact of Ecotourism Resort Experiences on Tourists’ Environmental
Attitudes and Behavioural Intentions, Journal of Sustainable Tourism, Vol.13, pp.546-565.
B-3-5
60

Green Infrastructure and It's Future Prospects in Japan
Yuki Shirota1, and Akira Tanaka1 1Tokyo city University, Japan
Keywords: Green Infrastructure, biodiversity, Ecological network, multifunction, stormwarter management
1. Introduction
Green Infrastructure (hereinafter it is called “GI”) attracts attention because it helps to solve environmental problems such as natural disasters, degradation of biodiversity and improve economic effects. One of the features of GI multifunction is active in many scenes. In contrast to most Gray infrastructures, Single objective. GI is multifunctional which means it can promote win-win solutions or ‘small loss-big gain’ combinations
that deliver benefits to a wide range of stakeholders as well as to the public at large. In addition, there are big effects by a combination of GI and Gray Infrastructure (European Commission, 2013). However, GI has not reached common recognition. The purpose of this study is organizing the characteristics of GI by comparing typical GI through Clarifying how does GI been defined. Then this study is concluded by considering the necessary points to consider to define GI in Japan.
2. Main contents
EU and United States Environmental Protection Agency (hereinafter it is called “EPA”) of America have defined GI at country or large range. The EU defines GI as a strategically planned network of high quality natural and semi-natural areas with other environmental features, which is designed and managed to deliver a wide range of ecosystem services and protect biodiversity in both rural and urban settings. (European Commission, 2013). In the EU, GI has strong relationship with Natura 2000. Especially, EU’s GI
focus on ecosystem networks and biodiversity. On the one hand EPA of America defines GI as a
comprehensive approach to water quality protection defined by a range of natural and built systems that can occur at the regional, community and site scales. (EPA, 2010). EPA’s GI focus on solution as flood control and stormwater management.
3. Conclusions
There is no unified definition of GI among the nations. Also, the definition in Japan is not established. GI has not always constant definition, and it could be changed depending on the characteristics of the land or the problems that is facing. Therefore, it is necessary to form a concept of GI based on Japan's problems and features. It is important to consider GI as a small range and a large range. If so, the idea of the Green Region greatly contributes to Japan's GI.
References
European Commission (2013) Building a Green for Europe Environment infrastructure, 24pp.
European Commission (2012) Multifunctional Urban Agriculture for Sustainable Land Use,37
EPA (United States Environmental Protection Agency) (2010) Green Infrastructure Case Studies: Municipal Policies for Managing Stormwater with Green Infrastructure, 76pp.
Tanaka, Akira (2017) Can EIA be an effective tool for creating ecologically sustainable society?
-From the aspect of “Green Region”,
Proceedings of Impact Assessment andPost Management , the 1st Vietnam-Japan-
Korea-China EIA Conference, p.13.
A-4-1
61
Positive correlation between discussion of alternatives and public involvement
Tetsuya Kamijo
JICA Research Institute, Japan
Keywords: Alternatives, public involvement, quantitative text analysis, positive correlation, minutes of meetings
1. Introduction
Public involvement is a key EIA process but
previous studies reveal some shortcomings such
as no involvement due to lack of recognition for
early participation (Doelle and Sinclair 2006); the
gap between legal process and poor practice
(Panigrahi and Amirapu 2012); lack of
understanding of the process (Wiklund 2011).
Some studies propose recommendations to low
public involvement such as providing access,
adequate notice, and sharing findings (Spaling et
al. 2011); mutual trust among stakeholders
(Kengne et al. 2013); the authorities credible
commitment (Chi et al. 2014). Other studies focus
on a relationship between alternatives and public
involvement (Hoover and Stern 2014; Rega and
Baldizzone 2015; Kamijo and Huang 2016). There
is a possibility to improve public involvement
through the discussion of alternatives. However,
little is known about a linkage between two
processes based on data analysis. The study
applied quantitative text analysis (QTA) to the
minutes of meetings of three projects supported by
the Japan International Cooperation Agency. The
analysis focused on five subjects (environmental
issues, social issues, development issues,
alternatives, and a sense of public involvement)
using coding rules. The number of paragraphs
corresponding to each coding rules was counted
according to each stakeholder.
2. Positive linkage of discussion of
alternatives and public involvement
The number of participating stakeholders who
discussed the alternatives and the number of
paragraphs for three projects is 24 and 67
respectively. Out of them, 13 stakeholders
mention public involvement in 33 paragraphs. The
correlation coefficient between paragraphs of
alternatives and the sense of public involvement is
0.77 (**p<.01, n=24). In addition, the number of
participating stakeholders who discussed
alternatives in more than two paragraphs is eleven
and ten out of eleven stakeholders spoke about
public involvement. The discussion of alternatives
affects an attitude of participating stakeholders
(Cuppen et al. 2012). A good alternatives analysis
may induce improved public involvement (Kamijo
and Huang 2016). The participating stakeholders
who discussed alternatives, tended to show a high
sense of public involvement.
3. Conclusions
The positive correlation between the discussion of
alternatives and a sense of public involvement
was identified. Public involvement could be
enhanced through the active discussion of
alternatives. Further studies are needed to activate
the discussion of alternatives and public
involvement.
References
Kamijo, T, Huang G. (2016) Improving the quality
of environmental impact assessment
reports: effectiveness of alternatives
analysis and public involvement in JICA
supported projects. Impact Assess. Project
Appraisal 34(2), 143-151.
Kamijo, T., Huang G. (2017) Enhancing the
discussion of alternatives in EIA using
principle component analysis leads to
improved public involvement, Environ.
Impact Assess. Rev. 65, 63-74.
A-4-2
62

A Study on the Scientific Assessment of Environmental Impact through the Data Based Assessment
Namwook Cho1,2, Moung Jin Lee1
1Korea Environment Institute, Korea 2Yonsei University, Korea
Keywords: Environmental Data, GIS, Archives, Data Publishing Framework, Data Science
1. Introduction
The environmental impact assessment(EIA)process can be broadly divided into predictthrough present status information, reductionmeasures of development, and post-management.Also possible to manage social conflict throughEIA(Gauthier et al, 2011).
In order to assess the environmental impact, it is necessary to utilize various regional and environmental information. However, in order to evaluate the environmental impacts scientifically, it is necessary to secure institutional objectivity as well
Because EIA is based on predictions, there is uncertainty and subjectivity is inevitable in the search of mitigation method.
2. Disclosure of EIA
EIA information is being disclosure for value such as transparency of the EIA operation.
The effects of information disclosure can be estimated on the basis of policy evaluation theory and information economics theory.
Through the disclosure, At first, it can strengthen the accountability of the business entity, Second, it can be used as scientific evidence for conflict adjustment. Last, the validity of the EIA system can be strengthened.
3. EIA Archive Case
In Korea, EIA information is provided through EIASS(EIA Support System), which provides on
environmental impact statement, evaluation process, environmental information in the nearby area.
EIASS collects and provides environmental impact statement, and EIA information of various projects based on spatial information. and linking with other information can increase the available for EIA.
4. Conclusions
In order to scientific assessment of environmental impact, it is necessary to operate an information disclosure based system, which can positively affect EIS contents.
In the case of Korea, EIASS provides an environment where spatial or time-series based evaluation can be performed through the disclosure of EIA information.
Especially, information on accumulated EIA can be used for cumulative impact assessment through monitoring of development demand concentrated in a specific area, and can contribute to scientific evaluation
References
Gauthier, M., Simard, L., & Waaub, J. (2011). Public participation in strategic environmental assessment (SEA): Critical review and the quebec (canada) approach. Environmental Impact Assessment Review, No.31(1), pp.48-60.
Sörme, L., Palm, V., Finnveden, G., 2016. Using E-PRTR data on point source emissions to air and water—first steps towards a national chemical footprint. Environmental Impact Assessment Review, No.56, pp.102–112
A-4-3
63

Stakeholder Engagement in Environmental Impact Assessment: Urban Railway Project in Sri Lanka
Tomoko Kaku1, and Yohei Suzuki2
1ERM Japan, Ltd., Japan 2ERM Japan, Ltd., Japan
Keywords: EIA, Stakeholder Engagement, Alternative Analysis, Protected Area, JICA
1. Introduction
The study for the implementation of New Light Rail Transit (LRT) System Project in Colombo, Sri Lanka was conducted by Government of Sri Lanka with cooperation of JICA (Japan International Cooperation Agency) and Environmental Impact Assessment (EIA) study was carried out as part of the study. A case study of stakeholder (SH) engagement during the EIA study will be introduced with some lessons and learns which can be applied to future projects.
2. Stakeholder Engagement in EIA Process
2.1 Importance of Stakeholder Mapping
The LRT Project is proposed to solve traffic issues in Colombo, with total length of approx.16km and 16 stations, and with all elevated structure. As it is a lineal project in urban area, there are various types of SHs which was considered to be one of key challenges in the study. Therefore, at the beginning of the study, stakeholder mapping was conducted carefully. Relevant national/local governments, project affected farmers/business owners, etc. were identified as SHs of the Project.
2.2 Role of Stakeholders’ Involvement
It was highlighted that Involvement of stakeholder played significant role, especially at the process of alternative analysis of route selection. In the process of the route selection, the Project examined several routes through the consultation with various stakeholders for various purposes, such as route around a protected area or sacred trees (Bo trees). For such successful involvement of SHs, however, the Project experienced practical difficulties such as convening SHs in meetings and adjusting conflict of interests of each SH.
3. Conclusions
Early identification and involvement of SHs contributed to the successful EIA process of the Project. Some challenges in the SH engagement are found in practic, thus such lessons can be reflected in other future projects’ SH engagement plans and activities.
References
Government of the Democratic Socialist Republic of Sri Lanka Ministry of Megapolis and Western Development (MMWD) (2018) Environmental Impact Assessment for Colombo Light Rail Transit (LRT) Project.
JICA (2018) Draft Final Report: Preparatory Survey on the Project for Establishment of New Rail Transit System in Colombo.
Figure 2: Stakeholder Engagement Program
A-4-4
64

Study on timing to protect endanger species in EIA
Mizuki KANAI1, & Akira TANAKA1
1Tokyo city University, Japan Keywords: Biodiversity, EIA, LCES, Endanger Species, Mitigation
1. Introduction
Japanese Environmental Impact Assessment selects indicator species from the viewpoint of superiority, typicality and speciality, then its habits, abundance and habitat are comprehended. But it doesn’t usually include habitat analysis.
(Mashuyama, 2007) In fact, in Chiba Prefecture, despite Lake Inba is an important habitat of bittern (Botaurus stellaris) which is listed as Endangered (EN), express railroad across the wetland of Lake Inba was still constructed. In Japan, there is a low related to endangered species called “The Low for
the Conservation of Endangered Species of Wild Fauna and Flora (LCES)” Which was enforced in
1993, aiming conservation of wild animals and plants. Thus the purpose of this research is to explain how the EIA which manage both development and conservation and LCES which is for biodiversity preservation are related each other, and exactly when the species are conserved.
2. Title
In terms of the relationship for biodivercity consevation between EIA and LCES, the following the points can be abstracted. This study investigate these two points based on the existing literature and interview.
1. How does the mechanism of LCES work When the indicator species are identified during EIS?
2.If the species which was found during the practice of EIA was not listed as indicator species but its scarcity alue was regrarded, are there any emagency steps such as to select as indicator species? In this case, how does the business in question have to deal with it?
3. Discussion
ESA defines “conservation “as “Based on the
standerd, when the situation of the endangered
species and threatened species improved so that they should not be listed anymore.” On the other
hand, LCES doesn’t clearly define nor explain
“conservation“. Also at the case of LCES, Natural
Habitat Protection Areas can be designated only when the Minister of the Environment approves. IN the case of ESA, the critical habitat of the species is designated when the species are regarded as endangered species and threatened species .In fact, there are differences in the number of designated area. Despite ESA includes 704 species, LCES is 7 species and 9 sites. This research is still in progress, so it is required to study more about present and future situation of EAI, based on the comparison between the U.S and Japan.
References
Tetsuo Masuyama (2007) Ecosystem Assessment in Environmental Assessment. 259-274, Tatsuya Niisato, Masataka Sato, Wildlife protection technology Second Edition. Kaiyusya, Tokyo, 426. (This is an English translation of the original text written in Japanese)
A-4-5
65

A Bayesian Approach to Integrated Ecological and Human Health Risk Assessment of Accidental Water Pollution in Watershed Scale
Jing Liu, Renzhi Liu School of Environment, Beijing Normal University, China
Keywords: accidental water pollution; Bayesian networks; integrated risk analysis; uncertainty; watershed-scale
1. Introduction
Open waterways, such as rivers and lakes, are particularly
susceptible to accidental pollution events. Regional-scale
ecological and human health risk assessments (ERA-
HHRAs) are used to determine the likelihood of effects
from multiple stressors on ecological and/or human
endpoints to estimate the risk of accidental water
pollution. We propose a Bayesian Network Framework to
integrated ecological and human health risk assessment
of accidental water pollution. By using this approach, we
are able to conduct quantitative, probabilistic, and spatially
explicit risk assessments for watershed-scale accidental
pollution.
2. Conceptual Model Construction
By identifying sources of stressors, stressors, exposure
pathways, effects of stressors on receptors, and the
resulting impacts on endpoints at a watershed scale, we
constructed a conceptual model in Figure 1.
Figure 1 Conceptual model of ERA-HHRAs
3. Bayesian-Network Processes
BNs are graphical models used to describe probabilistic
cause and effect relationships, making them similar to the
conceptual models typically used in risk assessment.
3.1 Node Definition and Data Sources
Input parameters are presented as probability distributions,
which are derived directly from simulation data. Input
parameters and CPTs can be refined to reflect our greater
knowledge of the system, thereby reducing the uncertainty
in the risk estimates.
3.2 Discrete node states
Parent, child and endpoint nodes are discretized into
ranked states, which allows for the evaluation of combined
effects from multiple stressors, including those that are
categorial or vary in their units of measurement.
3.3 Conditional Probability Tables
The CPTs contain the probabilities of the daughter node
states given all possible combinations of the parent node
states. Each possible combination is shown as a row, and
the row must sum to 100%. The CPTs can be obtained by
expert judgment, empirical evidence, mathematical or
biological equations and case file learning.
4. Uncertainty Analysis
Uncertainty in any model input was incorporated into the
input frequency for that node. Uncertainty in the model
inputs was translated through the model as wider
probability distributions of the intermediate and endpoint
nodes.
5. Results
Bayesian networks of conceptual model has finally been
constructed and calculated in Figure 2.
Figure 2 Bayesian Networks for ERA-HHRAs
Reference
Harris, M. J., Stinson, J., & Landis, W. G. (2017). A
Bayesian Approach to Integrated Ecological and Human
Health Risk Assessment for the South River, Virginia
Mercury-Contaminated Site. Risk Analysis, 37(7), 1341-
1357.
B-4-1
66

Feasibility of Quantitative Image Analysis Method to Improve Performances of Arsenic Field Test Kit for Screening of Tube Well Waters in Bangladesh
Masahiro Tokumura1, Makoto Sekine2, Mohammad Raknuzzaman3, Md Habibullah Al Mamun3, Md Kawser Ahmed3, Muhammad Rafiqul Islam4, Yuichi Miyake1, Takashi Amagai1, Shigeki Masunaga2, Masakazu Makino1
1University of Shizuoka, Japan 2Yokohama National University, Japan
3University of Dhaka, Bangladesh 4Bangladesh Agricultural University, Bangladesh
Keywords: Arsenic, Bangladesh, drinking water, analysis, screening
1. Introduction
To efficiently address the arsenic problem, to know the accurate and extensive contamination levels in drinking waters is essential. However, in Bangladesh, laboratory facilities to determine arsenic concentration such as an inductively coupled plasma mass spectrometer (ICP-MS) are rarely present. Arsenic field test kit is expected to be alternative solution to collect nation-wide contamination levels in drinking waters.
In this study, to evaluate commercial arsenic field test kit, the arsenic concentrations in drinking water (in both shallow tube and deep tube wells) in Bashailbogh village, Bangladesh were determined by using commercial arsenic field test kit and compared with those by ICP-MS. Furthermore, to improve performance of commercial arsenic field test kit for determination of arsenic concentration, we tried to apply quantitative image analysis method to more accurately determine the arsenic concentration from the digital picture of test paper of the arsenic field test kit.
2. Method
The sampling was conducted in February 2014 (post-winter). Water samples were collected from both shallow (n = 7) and deep tube wells (n = 14) of fourteen different Barees.
In general, the arsenic concentration is visually and sensuously determined by the arsenic field test kit based on the color of the test paper which is colored according to the arsenic concentration. It is likely to cause the wide interindividual variability and the difficulty to apparently discriminate a small color difference, which results in error of measurement. Therefore, in the developed quantitative image analysis method, the color of the test paper is numerically determined by color difference which is calculated from RGB (Red Green Blue) values of colored and based parts of the kit.
3. Results and discussion
The arsenic concentrations measured by the developed method (quantitative image analysis method) were in good agreement with those by the common method accordance with its manual. The arsenic concentrations measured by the developed method (quantitative image analysis method) were in good agreement with those by ICP-MS within 100 µg L–1 of the arsenic concentration.
4. Conclusions
The developed method could improve performance of commercial arsenic field test kit for determination of arsenic concentration. This method could be applied to other field test kit.
B-4-2
67

Integrated Control of Pollutants in Korea
Jong Ho Lee¹, Sungryong Ha²
¹Department of Urban Planning and Real Estate, Cheongju University, 28503 Republic of Korea
²Department of Urban Engineering, Chungbuk National University, 28644 Republic of Korea
Keywords: Integrated Control of Pollutants, Integrated Environmental Management
1. Introduction
One important change in environmental
management in Korea is the integrated control of
environmental pollutant facilities based on the
Integrated Management Act of Environmental
Pollutant Facilities. But it is not integrated
management of environmental media or pollutants,
but integrated control of environmental pollutant
facilities. This study tries to suggest the direction
for integrated management of environmental
media or pollutants.
.
2. Integrated Environmental Management
2.1. Integrated Control of Environmental
Pollutant Facilities
The purpose is to protect people's health and
environment by integrating the control of pollutant-
discharging facilities so as to effectively reduce
pollutants produced from each business
establishment, and by establishing a system under
which best techniques for environmental control
can be applied to meet conditions of each
business establishment.
2.2 Integrated Management of Environmental
Media
In order to prevent air pollution due to incineration
of solid waste, water pollution resulting from landfill,
and aquatic ecosystem damage due to acid rain,
the integrated management of environmental
media (air, water, and soil etc) is necessary. But
integrated management of environmental media
has not been sufficiently implemented. This study
reviews and the cases, and tries to suggest
desirable direction.
2.3 Integrated Control of Pollutants
Integrated management of pollutants is required in
order to decrease photochemical smog resulting
from chemical combination of hydrocarbon and
nitrogen oxides under the condition of strong solar
radiation and windless, and secondary particulate
matter formed through chemical reaction of sulfur
dioxides or nitrogen oxides with vapor, ozone, and
ammonia etc. Lately in Korea, the concentration of
particulate matter has become higher from internal
and abroad pollutant sources. Therefore this study
reviews the cases, and suggests desirable
direction.
3. Conclusion
For environmental conservation, not only
integrated control of environmental pollutant
facilities but also integrated management of
environmental media and/or integrated control of
pollutants are required.
References
Korea Environment Institute, 2016, A Research on
Efficient Implementation of Integrated
Environmental Management, Ministry of
Environment.
Ministry of Environment, 2017, White Paper of
Environment.
B-4-3
68

Environmental impact of halogenated polycyclic aromatic hydrocarbons emitted from E-waste recycling activities in
Vietnam
Qi Wang1, Masahiro Tokumura1, Yuichi Miyake1, Takashi Amagai1
1 University of Shizuoka, Japan Keywords: halogenated polycyclic aromatic hydrocarbons (XPAHs), E-waste recycling, open burning, POPs
1. Introduction
Halogenated polycyclic aromatic hydrocarbons (XPAHs) are pollutants unintentionally produced by combustion processes of organic material containing chlorine or bromine. Several XPAHs elicit dioxin-like activities comparable to those of several mono-ortho polychlorinated biphenyl (PCB) congeners. On the other hand, recycling processes of electronic waste (E-waste) is a new major source of dioxin-related compounds due to uncontrolled burning and primitive recycling operations of E-waste. However, little is known about productions and emissions of XPAHs by the E-waste recycling processes. In order to assessthe XPAHs contaminations in the vicinity of E-waste recycling activities, we have determined XPAHs in 32 surface soil and 8 river sediment samples collected around the E-waste recycling area in northern Vietnam. Thirty-one target compounds including 21 chlorinated PAHs (ClPAHs) and 10 brominated PAHs (BrPAHs) were quantified by gas chromatography-high resolution mass spectrometry (GC-HRMS) in this study.
2. Results and discussion
2.1 Occurrence of XPAHs by E-waste recycling activities
The highest concentrations of XPAHs in soils (3,960 pg/g dry wt) and sediments (3,930 pg/g dry wt) were detected from samples near an open burning site and an E-waste recycling workshop, and the profiles of individual XPAHs isomer in these samples were similar. On the other hand,
the lowest concentrations were detected from samples collected near rice paddy (25.4 pg/g dry wt, soil sample) and upstream area of river (20.3 pg/g dry wt, sediment sample) which are not E-waste recycling area. Furthermore, composition ratios of BrPAHs to total XPAHs in this study were higher than those in fly ash of waste incinerators which were reported in previous studies. It means that bromine content ratios of E-waste in this study could be larger than those of waste material, because E-waste in this study contained a large amount of brominated flame retardants.
These results suggested that XPAHs occurred in E-waste recycling activities and they impacted thesurrounding soil and sediment.
2.2 Unidentified isomer
A large number of peaks of unidentified isomers of XPAHs were observed based on the isotope patterns of molecular ions [M, M+2, M+4] by GC-HRMS analyses. These unidentified isomers should be an important factor in the impact assessment for XPAHs.
3. Conclusions
The XPAHs occurred in E-waste recycling activities and they contaminated the surrounding soil and sediment. The inclusion of unidentified compounds would result in an increased excess risk of XPAHs.
References
Wang, Q. et al., (2016) Journal of Water and Environment Technology, Vol.14, No.3, pp.166-176.
B-4-4
69

Climate Change Adaptation Strategies in Japan and Suggestions to EIA System
Mitsuru Tanaka1, Kenshi Baba2, and Makoto Ogawa3
1Hosei University, Japan 2Tokyo City University, Japan
3Hosei University, Japan Keywords: Climate Change, Adaptation, Local Government, EIA
1. Introduction
IPCC AR5 (Fifth Assessment Report, ClimateChange 2013/2014) declares that global averagesurface temperature is projected to likely increaseat a high speed for the end of the 21st century. Asglobal warming continues, the ways in whichclimate change is manifested will differ significantlydepending on the region. Our society in generalshould prepare for the accelerating global warmingand take adaptations to climate change based onlocal circumstances. This report discusses theactual conditions of adaptation measures in Japanand make a trial examination on a relationshipbetween climate adaptations and EIA system.
2. Adaptation Measures to Climate Change
2.1 Knowledge of IPCC AR5
IPCC AR5 ‘Summary for Policymakers’ is tells us that the increase of global average surface temperatures for 2081–2100 relative to 1986–2005 is projected to likely be in the ranges derived from the CMIP5 model simulations, that is, 0.3°C to 1.7°C (RCP2.6) and 2.6°C to 4.8°C (RCP8.5). In this context RCP means Representative Concentration Pathways which are used for
making projections to describe four different 21st century pathways of GHG emissions and atmospheric concentrations, air pollutant emissions and land use.
2.2 Policy Trends of Adaptations in Japan
In November 2015 Japan’s first National Plan for Adaptation to the Impacts of Climate Change was adopted by Cabinet Decision, clarifying in detail the country’s basic approaches to climate change adaptation and measures in each sector and the implementation of the related measures started. Naturally, prior to that National Plan, measures were being taken in individual areas such as agriculture and water-related disasters. And in July 2018 Climate Change Adaptation Act was enacted and promulgated.
3. Conclusions
Through responding to intensifying climate change and planing adaptations, careful examination is required regarding with predicting and assessing environmental factors such as atmosphere, topography / geology, water in EIA system. Environmental measures with a target project also should be reconsidered cautiously.
References
Intergovernmental Panel on Climate Change (2014) Climate Change 2014 Synthesis Report ’Summary for Policymakers’, IPCC,pp.10-11.
Center for Regional Research, Hosei University (2018) Report on Local Climate Change, Hosei University, Tokyo, pp.3-7
Figure 1: Global average temperature change
B-4-5
70

The 1st PTT’s Strategic Environmental Assessment (SEA) for Eastern Economic Corridor of Innovation (EECi) Project, THAILAND
Nathasith Chiarawatchai, Thanakorn Ermukdakul, Worawut Hamarn, Kanatip Ratanachoo Project Environmental Management Department, PTT Public Company Limited (PTT)
Keywords: Eastern Economic Corridor (EEC), Eastern Economic Corridor of Innovation (EECi), Environmental Impact Assessment (EIA), Strategic Environmental Assessment (SEA)
1. Introduction
In Thailand, SEA is gaining momentum as a necessary
prerequisite for sustainable Policy, Plan, and Program
decision making. The SEA guideline is being developed
by the Office of the National Economic and Social
Development Board (NESDB), then will be legalized and
applied to government sectors. Project entities shall use
SEA as a mandatory framework for conducting EIA.
PTT has established EECi @ Wangchan Valley Project
in Rayong (Figure 1). Creating value as a hub of R&D
and innovation with 3,000 rai (480 ha) area, it
encompasses start-up & innovation center, pilot plant,
accommodation, utility, and others. Although SEA is yet
legalized, in order to prevent environmental problems
from rival activities in newly area-based development,
PTT decides to conduct the 1st Preliminary SEA by itself
aiming to integrate environmental, economic, and social
consideration into master plan before conducting project
EIA. Carrying capacities and environmental constraints
are taken into account during strategic decision making
on applicable project types and sizes to prevent
exceeding carrying capacities like other area in the past.
Figure 1 Project Location
2. Methodology
PTT has integrated related guidelines established by
NESDB, Office of Natural Resources and Environmental
Policy and Planning (ONEP), with PTT’s experience in
EIA for applying to preliminary SEA of this project. Study
concept consists of four steps as shown in Figure 2.
Public participation shall be inclusive in all processes.
Figure 2 Draft Thailand’s SEA Process (NESDB, 2018)
3. Result
The preliminary SEA is beneficial to indicate
environmental aspects related to carrying capacity of
target area. Mitigation and measures can be set up
simultaneously with project master plan to mitigate
impact to acceptable level and used as a mandatory
framework for conducting EIA. Furthermore, the data
and results can be used for supporting any future
promulgated SEAs conducted by government sector.
4. Conclusions
The preliminary SEA is a practical tool for informing and
influencing strategic decision making. However, some
processes according to SEA guideline need to be
modified for practicability. PTT envisions this study shall
be a good practice for other projects in environmental
advocacy towards making sustainable choice, which
potentially leads to project concurrence in the future.
Reference
Eastern Economic Corridor of Innovation (EECi) (2018)
www.eeci.or.th
National Economic and Social Development Board
(NESDB) (2018) Draft Guideline of SEA Process.
A-5-1
71

Social Consideration for Coral Offset in Vanuatu
Shingo Takeda 1, Takehiko Murayama2, and Shigeo Nishikizawa3
1Environmental and Social Consideration Review and Supervision Division, Credit Risk Analysis and Environmental Review Department, Japan International Cooperation Agency (JICA)
2,3 School of Environment and Society, Tokyo Institute of Technology
Keywords: Mitigation Hierarchy, Coral, Biodiversity Offset, Social Consideration, Vanuatu
1. Introduction
International Organization such as World Bank
requests counterpart agency to take measures for
conservation of ecosystems and natural habitat,
applying the mitigation hierarchy to their
development projects (BBOP 2012). JICA’s ODA
loan project “Pori-Vila international multipurpose
wharf construction project in Vanuatu” (hereinafter
referred to as “the Project”) impacts on corals, thus
the Project transplanted the corals as a mitigation
measure after consideration of alternative site to
avoid the impact. However, the survival rate of the
transplanted corals became low (less than 50%)
according to monitoring reports. JICA has
suggested implementation of coral offset to
compensate the coral loss to the counterpart
agency and it was accepted. The idea of the coral
offset is to offset the coral loss and loss of coral-
related human activities at affected site by creating
small scale Community Conservation Area (CCA)
at the site on which physically damaged corals
exist.
2. Methodology
A rapid assessment was conducted at 20 sites in
the Port-Vila bay to select candidate offset sites.
Consequently, four (4) candidate offset sites which
meet criteria of good accessibility, presence of
damaged corals and presence of certain amount
of live corals were selected. The candidate offset
sites were studied to grasp coral cover, species
composition of corals, bethic animals and sea
algae/weed, and physicochemical environment e.g.
water temperature and salinity. While community
nearby candidate offset sites was interviewed to
know their coral-related activities, benefit from
corals, and perception of coral conservation. The
biological and social similarity between candidate
offset sites and affected site was calculated with
cluster analysis software, and social significance
and acceptance of the offset were discussed.
3. Result
The candidate offset site “Ifira” and “Vatumaru”
have higher biological and social similarity with
affected site respectively. People around the
“Iririki” is relatively less engaged in the coral-
related activities while they have relatively higher
awareness for the conservation of corals, and this
may indicate easiness of offset implementation at
Iririki. These results will be used for stakeholder
meetings to select best offset site(s) and for
preparation of offset site management plan.
4. Conclusion
Consideration of social significance and people’s
perception of natural resource management are
extremely important to set up the offset site
because natural resources are inextricable part of
human life. However conventional case of
biodiversity offset have been more focused on
biological aspect. Our attempt aims to incorporates
the social aspect throughout the offset process. In
order to confirm the effectiveness social
consideration, preparation of selective
management plan and regular monitoring of the
offset will be carried out in our offset program.
References
BBOP. Guideline Note to the Standard on
Biodiversity Offset. 2012.
Fig. 1 Map of Port-Villa bay. Circle indicates
the candidate offset sites.
A-5-2
72

Un-sustainable information disclosure and archives of the EIA documents in Japan
Hiroo Kasagi1, Akiko Urago2
1NPO Workshop for Sustainable Community, Japan 2Raven Ltd., Japan
Keywords: EIA, EIA database, Information disclosure, Archives, EIA Law
1. Introduction
Information disclosure and archives of the EIA documents in Japan is far from the international standard. Most of the EIA reports cannot be accessed after one month disclosed period, although EIA law has come into force since 1999. Environmental measured data for EIA is not shared with the open database. Followings are the problems of EIA disclosure and some actions by Japan Society for Impact Assessment (JSIA).
2. Limited access to EIA reports
All the national level EIA reports had been stored and allowed to access freely at the office of Japan Association of Environment Assessment (JEAS) since 1999. But Ministry of Environment Japan (MOEJ) closed the reference room in 2011. It was because of the complaints by some project owners who insisted the copy right and risk of the disclosure of secrets.
After revision of the EIA law in 2011, disclosure of the EIA reports on the website was stipulated. But after the one month disclosure period, most of the EIA reports cannot be accessed. The downloaded pdf files of EIA reports were also programed to be locked. The only way to access the EIA reports after the disclosure period is requesting to view the EIA reports to MOEJ. After acceptance of the request, MOEJ consult to the project owner whether they can present the report or not. Only the original EIA reports which allowed by the project owners can be accessed at the room of the MOEJ.
3. Actions of JSIA
Kasagi and other members of JSIA researched treatment of the EIA report and EIA data after reviewing at local level and revealed that;
- Many local governments stopped disclosure ofthe EIA report just after the disclosing period,
- Some local governments classify EIA reports asnormal official documents which should be disposed when expired (Kasagi 2016a), and
- Biological data and Environmental measureddata for EIA is not utilized for cumulative impact assessment nor Environmental planning. (Kasagi 2016b, Kasagi 2017).
4. New rules and remained issues
JSIA submitted a written opinion to MOEJ in 2016 after some meetings and seminars based on the research. MOEJ started internal discussion about the EIA documents and changed the rules of disclosure in April 2018.
References
KASAGI and URAGO (2016a) Disclosure and archives of the EIA report, Japan Society for Impact Assessment, Vol. 14 No.1, pp17-21 (in Japanese)
KASAGI (2016b) Storage and disclosure of the EIA report after EIA procedures, Environmental Information Science Vol. 44 No.4 (in Japanese)
AKAMATSU, KASAGI (2017) Trend and issues of the open databases of the Environmental data, Japan Society for Impact Assessment, Vol. 15 No.1 (in Japanese)
A-5-3
73

Co-Control Potential of Substituting Hydropower for Fossil Fuels:
A Case Study in Sichuan, China
Xianqiang Mao, Mudan Wang and Mengyuan Liu1
1School of Environment, Beijing Normal University, China
Keywords: hydropower, co-control effect, energy substitution, emission reduction, Sichuan
1. Introduction
The rapid economic growth in China calls for enormous
energy input and is associated with bad air quality. The
fossil fuel consumption can cause a huge number of air
pollutants and GHGs emissions. Clean energy is an
ideal alternative to achieve this goal, in which
hydropower is a typical representative.
Owing abundant hydropower resources, Sichuan
province is taken as the case area to analyze co-control
potential of substituting hydropower for fossil fuels and
provide important policy implications for policy makers.
2. Research methods and contents
2.1 Energy development scenarios setting
According to the Energy Development Planning and
present situation of Sichuan, several kinds of energy
development scenarios were proposed. Hydropower in
Sichuan province, which was sold to other provinces in
China, is applied to replace fossil fuels used in power
generation sector, or oil used in transportation sector
respectively, or fossil fuels used in above two sector at
the same time. Co-control potential is tested and
compared to provide energy policy implication for local
policy makers.
2.2 Carbon and air pollutant emission reduction
Based on 2006 IPCC Guidelines for National
Greenhouse Gas Inventories (IPCC, 2006) and air
pollutant coefficient data from researches, SO2, smoke
dust and carbon emission of fossil fuel consumption in
power generation and transportation are estimated in
Sichuan province. The emission reduction of air
pollutants and carbon from hydropower substitution are
calculated.
2.3 Co-control effects analysis
The co-control effect coordinate system (Zeng et al.,
2017) and air pollutant emission reduction equivalence
indicator (Mao et al., 2013) were applied to evaluate co-
control effects of different energy development
scenarios. Different scenarios were compared and
ranked based on their respective co-control effects.
3. Conclusions
The application of hydropower has good co-control
potential of CO2 and air pollutant in Sichuan. The best
co-control effect appears in the scenario where the
hydropower is applied to substitute fossil fuels in power
generation. Co-control effect is much lower when
hydropower is used to replace oil consumption in
transportation. Power generation is prioritized to
substitution with hydropower to realize emission
reduction and energy saving.
References
IPCC, 2006. 2006 IPCC Guidelines for National Greenhouse Gas
Inventories, IPCC National Greenhouse Gas Inventories
Programme.
Mao, X., Zeng, A., Hu, T., Zhou, J., Xing, Y., Liu, S., 2013. Co-control of
Local Air Pollutants and CO2 in the Chinese Iron and Steel
Industry. Environ. Sci. Technol. 47, 12002–12010.
doi:10.1021/es4021316
Zeng, A., Mao, X., Hu, T., Xing, Y., Gao, Y., Zhou, J., Qian, Y., 2017.
Regional co-control plan for local air pollutants and CO 2 reduction:
Method and practice. J. Clean. Prod. 140, 1226–1235.
doi:10.1016/j.jclepro.2016.10.037
A-5-4
74

Decolorization of Colored Effluent from Textile Manufacturing Industry in Bangladeshi by Photo-Fenton
Reaction Coupled with Catalyst
Kosuke MURAMATSU¹, Hiroshi AIUCHI¹, Yuta GORO¹, Masahiro TOKUMURA¹, Qi WANG¹, Takanori AMBO2, Masakazu MINAGAWA2, Ryutaro ISHIBASHI2,
Yuichi MIYAKE¹, Takashi AMAGAI¹,Masakazu MAKINO¹
1University of Shizuoka, Japan
2Mitsubishi Chemical Corporation, Japan
Keywords: Photo-Fenton Reaction, Catalyst, Decolorization, Colored Effluent, Wastewater Treatment
1. Introduction
A large amount of organic dyes is used in
textile industries, and 40–50% of which end
up in wastewater. Since most dyes are non-
biodegradable, the activated sludge process,
which is the most commonly used
conventional wastewater treatment process,
is not suitable to treat them. Consequently,
inappropriate treatments of the colored
wasterwater causes severe environmental
problems in the world, especiaaly in
Bangladesh.
The photo-Fenton reaction, in which OH
radicals being a powerful oxidizing agent are
continuously and efficiently, has drawn
attention as a promissing wastewater
treatment process to efficiently treat the
colored wasterwater. However, the runnning
cost of photo-Fenton reaction is high
compared with that of the conventional
biological wasterwater treatment processes.
In this study, to reduce the running cost, we
developed a novel wastewater treatment
process by using the photo-Fenton reaction
coupled with a catalyst.
2. Method
A 500 mL Pyrex beaker was used as a
reactor. Three black light blue lamps
(maximum irradiation wavelength = 380 nm)
were used as a light source for the photo-
Fenton reaction. The initial pH was adjusted
to pH = 3, which is the optimum pH for the
photo-Fenton reaction, with sulfuric acid. After
the concentration of Orange II, which is a
model azo-dye used in this study, was
adjusted, the experiment was started by
adding iron sulfate, hydrogen peroxide, and a
catalyst and turning on the lamps.
3. Results and discussion
The typical and conventional photo-Fenton
reaction (without the catalyst) required 40 min
for the complete degradation of 30 mg L-¹
Orange II. On the other hand, the developed
photo-Fenton reaction (with the catalyst) took
20 min to degrad it.
The reaction kinetics anlaysis revealed that
the synergistic effects occurred in the
developed photo-Fenton reaction.
4. Conclusions
The photo-Fenton reaction was significantly
imporoved by the combination with the
catalyst. The reaction kinetics anlaysis
elucidated the mechanisms of the
improvemnet of the photo-Fenton reaction by
the catalyst, which could be usuful for further
improvemnet of the catalyst.
References
Zanta et al., J. Hazard. Mater., 178, 258-263,
2010.
B-5-1
75

Criteria for Health Impact Assessment in Integrated Pollution Prevention and Control in Korea
LEE Youngsoo, Choi Sang-Ki
Korea Environment Institute, Korea Keywords: IPPC, HIA, Criteria
1. Introduction
In 2017, Ministry of Environment of Korea hasimplemented Act on integrated management ofenvironmental pollution facilities. In this act,Minister of Environment has to consider impact onhuman health from the facilities for approval. Inthis paper, we are going to explain the Act, criteriafor health, review method for approval and,methodology of HIA of Korea
2. Criteria for Health Impact
2.1 National Standards
Framework Act on Environmental Policy of Korea has designated national standards for air, water and noise. For 8 air pollutants (SO2, NO2, PM-10, PM-2.5, CO, O3, Pb, C6H6), according to averaging time, national standards are classified. These standards are administrative goals to achieve good environment.
2.2 Target Level of Environmental Quality
For another hazardous air pollutants except 8 air pollutants, to attain good environment assuring human health, target level of environmental quality is prepared. For example, the level of
Formaldehyde is 5 μg/m3 for 1 year average.
2.3 Review Method for Approval
There are 3 steps for approval for 8 pollutants which has national standard. The 1st is to compare additional concentration to 3% of long-term(usually 1 year) national standard. If the 1st step fails, the 2nd step is to compare total pollution(present concentration + additional concentration) to
national standard(long-term or short-term standard). If the 2nd step also fails, another modelling will be carried out.
2.4 Methodology of HIA
For HIA(Health Impact Assessment), we calculate cancer risk for carcinogenic materials like heavy metal and exposure ratio for non-carcinogenic materials.
3. Conclusions
In order to take into account human health from air pollutant emitting facilities in IPPC, it is considered to be reasonable to prepare standard concentration in ambient air for hazardous air pollutants.
References
LEE, Youngsoo et als. (2014) Effective Implementation Method of Health impact Assessment, Korea Environment Institute.
Korean Government(2016) Act on Integrated Management of Environment Pollution Facilities
B-5-2
76

Survey of Lead pollution caused by motorization in Ulaanbaatar
Hirotaka Naitou1, Yukinori Tani1, Kouske Toshiki2, Jeong-Soo Yu3, Erdenedalai Baatar3, Choijilsuren Buyantogtokh4, Tserendorj Javzandolgor4, Bolorchuluun Shukhee4
1 University of Shizuoka, Japan 2 University of Miyazaki, Japan
3 Tohoku University, Japan 4 Institute of Veterinary Medicine, Mongolia
Keywords: Mongolia, lead pollution, Blood lead, motorization, livestock health
1. Introduction
Motorization associated with the process ofeconomic growth has caused environmentalpollution in its progress with development. EvenMongolia, where many people are nomadic, hasundergone a sudden wave of motorization, withmainly Japanese used cars being imported intothe country. Due to commonly-performed batteryrecycling, heavy metal pollution is a problem in theused car industry. This study investigated the stateof lead pollution in livestock based on apreliminary survey conducted in 2015. We reportthe results of lead concentration tests on bloodfrom livestock pastured in the Ulaanbaatar area in2016.
2. Material and Method
2.1 Sampling
Blood was collected from 20 nomads livestock in each district (goat and sheep, 5 females, 5 males each). Blood samples were collected from livestock via puncture of the jugular vein using a blood collection tube containing heparin. Blood samples underwent dissolution within 24 hours and measurement within 48 hours.
2.2 2. Measurement of lead in blood
The LeadCare® II System (Magellan Diagnostics, MA, USA) was used to measure lead concentration in blood. The LeadCare® II System uses an electrochemical technique called Anodic
Stripping Voltammetry to determine the amount of lead in a blood sample. Measurement range of LeadCare ® II is so 3.3 ~ 65 μg / dL, high concentration sample (range over) was measured again 10-fold dilution, and the obtained value was taken as the assumed value.
3. Results and Discussion
Among the five districts surveyed in 2016, only the Tuw - aimag district, which was 20 km south of the Ulan Bator city area, showed high blood lead levels in nomadic livestock. 625 μg / dL of Sheep (male) aged 4 years old and 662 μg / dL of goat (female) aged 3 years old showed extremely high lead concentrations in the blood. The other 18 animals, there was no difference depending on the livestock species, sex and age, and the blood Lead level was high, 13.7 to 326 μg / dL respectively.
In the Tuw-aimag district, the grassland spreads on both sides across the main road, and I saw the nomadic livestock in this area crossing the artery freely freely. The nomadic livestock that we blood collected this time is also highly likely to be affected by automobile exhaust gas traveling through the main road. Identification of lead contamination sources in this area is a future task.
References
Naitou H., Toshiki K., Yu J. S. et.al. (2017) Survey of lead pollution in nomadic livestock in Ulaanbaatar, Environmental science, 30 pp. 274-281.
B-5-3
77

Method and application on overall allocation of space and industry for urban industrial total atmospheric pollutant emission
Jiaxuan Chen1, Runhe Cheng2, and Wei Li3
School of Environment, Beijing Normal University, China
Keywords: urban atmospheric pollution, total industrial emission, overall allocation, spatial distribution, leading industries
1. Introduction
Concentration over-standard and excessiveemission discharge of air pollutants caused byindustrial activities has become the most essentialpressure for the improvement of atmosphericenvironmental quality, which has significant spatialand structural characteristics in China. As animportant means to emission reduction, control oftotal emission control can help to coordinate urbandevelopment and environmental protection. Thereasonable allocation of total limits is the key toensure the effectiveness of measures and policiesabout total emission control. To improve urbanenvironmental air quality and promote greentransformation of urban industries, it is necessaryto take into account both the spatial distribution ofpollution sources and the characteristics of theindustrial structure of pollution emissions.
2. Technical processes and methods
Industrial air pollutant space and industry overall allocation of space and industry should not only consider the spatial distribution of atmospheric pollutant emissions, but also need to superimpose the emission characteristics of the industrial sector. The distribution process mainly includes four steps of screening leading industry and main-control factor, determining the total allocation limit, estimating spatial or industrial distribution coefficients and implementing overall allocation.
Based on the overall allocation indicator system, we use entropy method to estimate the allocation coefficient. The total emission indicator of urban industrial air pollutants can be allocated to each space unit and the leading industry according to the coefficient ratio.
3 Case Study
Ordos is located in the southwest of Inner Mongolia autonomous region with a total area of 87,000 km2, which is also regarded as the important energy-chemical industry base in China. The structural characteristics of economic development are significant, while the economic contribution of coal mining and coal-based industry is relatively outstanding. Using the above-mentioned process and methods to do the spatial and industrial allocation for the total emission of atmospheric pollutants in Ordos (Table 1)
4. Conclusions
Urban atmospheric environmental quality is entering a stage of the stage of comprehensive improvement in China. Pollution reduction work combined with the adjustment and upgrading of industrial structure has become an important measure to deepen the control of the total emission for atmospheric pollutants can improve regional, industrial air pollution control system, and promote the transformation and optimization of industrial structure.
References
Wei Li, Yanju Liu, Wen Liu. Study on spatial distribution and dynamic optimization of total atmospheric pollutant control in planning environmental assessment [J]. Journal of Safety and Environment, 2009, 9(3):73-77.10
B-5-4
78

Estimation of WTP for transparent noise-barriers by using CVM
In-Chul Bae1 and Chung-Ki Lee2
1Korea Expressway Corporation Research Institute, Korea 2Korea National Open University, Korea
Keywords: CVM, WTP, transparent noise-barrier
1. Introduction
The contingent valuation method(CVM) has been the most preferred framework in deciding the price of environment goods. This study uses CVM as an analytic tool in order to estimate the WTP of installing transparent noise-barriers. To do this, a survey of 600 households was implemented on the effects of installing noise-barriers around the expressways.
2. Methodology and Results
2.1 Methodology
This method involves constructing a hypothetical market or referendum scenario and uses questionnaires in a survey to elicit customers preferences for public goods and services such as the natural environment by finding out how much they would be willing to pay for the specified improvements in them or receive for the degradation of these goods and services(Mitchell and Carson, 1989; Arrow et al., 1993). Respondents assume the established hypothetical market to state their WTP or vote for or against a public program at a particular tax price.
In order to allow for heteroskedasticity in individual households’ willingness-to-pays(WTPs) along with spike models that are widely used to deal with censoring problem of responses at 0 in the CVM researches, we set a model with parametric conditional variance functions and derived closed-form expressions for conditional WTP and conditional probability to pay any non-zero amount for noise-barriers. These closed-form expressions
were used to estimate unconditional WTPs and to analyze patterns in WTPs according to the household characteristics.
2.2 Empirical Results
Table 1: WTP for transparent noise-barriers
3. Concluding Remarks
The results indicate that the household is annually willing to pay 2,393, 2,886 and 2,969 Korean Won for the three height of transparent noise-barriers respectively. They suggest that increasing investment in noise-barriers potentially has a positive effect on improving the expressway environments. Henceforth the estimates will be used as significant information on the economic evaluation of transparent noise-barrier installation projects.
References
Arrow, K., R., Solow, P. R. Portney, E. E. Leamer, R. Radner, and E. H. Schuman. 1993.“Report of the NOAA panel on contingentvaluation”. Federal Register, 58(10): 4601-4614.
Mitchell, R.C. and Carson, R.T., 1989. Using survey to value public goods: The contingent valuation method. Resources for the Future. Washington, DC.
Height 5m 10m 15m
E[WTPi] 2,393 2,886 2,969
P-1
79

Mission and Activities of the KSEIA
Sookjin Jeon, Jong-Gwan Jung*, and Myungjin Kim
Korean Society of EIA, *Chungnam Institue, Korea Keywords: Mission, Activities, KSEIA, Journal of EIA
1. EIA and KSEIASince Korea has introduced environmental impactassessment in 1977 (legally, 1971), EIA hasimproved markedly over the past four decades byenlarging EIA projects, instituting publicparticipation and environmental monitoring,developing methodologies, and introducingstrategic environmental assessment, health impactassessment and greenhouse gases impactassessment. The linkage system of land andenvironment planning in 2014 has been introduced.Several issues for EIA enhancement are beingdiscussed.In this respect, the role of KSEIA (Korean Societyof EIA) for achieving sustainable society is toprovide a responsible EIA tools and facilitateopportunities for desirable futures. KSEIA missionsare to contribute to enhance the quality of impactassessment, promote academic exchange andprofessional working, encourage participation inIAIA and affiliate forum, exchange the latestinformation in environmental assessment, andserve as a foothold for international collaboration.
2. KSEIA ActivitiesThe KSEIA has long been played as a linchpin ofimpact assessment in the Northeast Asia since1992 established. Regionally KSEIA has aconnection with Japan, China, Vietnam, Germanyand other international organization such as IUCN.KSEIA contributes to make a better world throughimpact assessment by mutual collaboration andcapacity building. Major activities by year are asfollows;
1992. 6: Foundation of the KSEIA 1992.12: Publication of the 1st Journal of
Environmental Impact Assessment 1995. 6: The 1st Participation of the 15th
Conference of IAIA 2005. 7: Joining as a Member of IAIA Affiliates
2007. 6: The 27th Annual Conference of IAIA in Seoul, Korea
2012. 6: The 20th Anniversary of KSEIA Foundation
2012. 9: Korea-IUCN WCC EIA Workshop 2014. 3 and 2016. 9: Publication of an EIA
Textbook 2014.10: CBD workshop on Improving
Biodiversity for SD 2017. 3: Publication of “Assessing Korea: Impact
Assessment for Sustainable Development,” Charlie Wolf’s Memory
3. Journal of EIAThe KSEIA has published the Journal ofEnvironmental Impact Assessment bimonthlysince 2004, after the first volume (1992). Till June2018, the KSEIA published the volume 27 and 122publications in total. The journal is interdisciplinaryand comprises various aspects of environmentalimpact assessment including EIA procedures(theories, methods, and legislations), quantitativemethods (modellings, predictions etc.), riskassessment, social impact assessment andeconomic measures. The journal delivers theexperts to stay current with the latest standards ofEIA practices. The Journal contents increase inthe discipline of biodiversity, ecosystem, andclimate change as well. KSEIA had been set upthe submission and review system for the Journalof EIA by online; https://kseia.jams.or.kr
References Myungjin Kim and Charlie Wolf, 2014, The Impact Assessment We want, IAPA, Vol.32, No.1, 19-20 Jong-Gwan Jung and Myungjin Kim, 2018, IAIA Affiliate KSEIA, Affiliates, Branches, and Associated Organizations Forum, IAIA18, Durban
P-2
80

Modeling of breeding-site occupancy dynamics for Northern Goshawks in urbanized areas
Haruki Natsukawa1, Kaname Mori
2, Shizuko Komuro
2, Takashi Shiokawa
2 and Hiroyuki Matsuda
1
1Yokohama National University, Japan
2Japanese Wild Bird Society Kanagawa branch, Japan
Keywords: Northern Goshawk, Accipiter gentilis, urbanized area, breeding, dynamic occupancy model
1. Introduction
Habitat occupancy by organisms is closely
related to individual fitness. Breeding sites play a
key role in maintaining the long-term viability of
organisms. Even though organisms inhabit sites
in the present time, it is not possible to conclude
that they are to inhabit the same site to the same
extent in the future. Therefore, elucidation of
temporal change in breeding-site occupancy is
extremely important.
Urbanization has various effects on many
organisms. The response of organisms to
urbanization varies greatly depending on species
and taxonomic group. Urbanization is expected to
increase even rapidly in the future. Hence,
ecological studies in urban areas have become
more vital than ever.
Northern Goshawk is a medium-sized raptor
which inhabits forests in agricultural areas.
However, recently it has expanded its distribution
to urban areas in Japan. Studies on goshawks
inhabiting urban areas are very limited, and no
studies have elucidated the breeding-site
occupancy dynamics. Therefore, this study was
aimed at elucidating the breeding-site occupancy
dynamics of urban-breeding goshawks.
2. Methods
2.1 Study Areas and field survey
The field survey was conducted in the eastern
part of Kanagawa, Japan from 2004 to 2017. 80%
of this study area consists of Densely Inhabited
Districts. The study area of the forests was
investigated between January 1 and June 15
each year, to detect the occupied nests by
goshawks.
2.2 Measurement of environmental factors
A circle of 1 km radius was set centering the
goshawk nests and land cover factors were
measured the within the same. The measured
land cover factors were; forest area, open area,
highly vegetated urban (HVU) area, urban area,
tangential length of forest and open area,
tangential length of forest and HVU.
2.3 Statistical modeling
Breeding-site occupancy dynamics were
analyzed using dynamic occupancy model
(MacKenzie et al. 2003). This model can
simultaneously estimate the occupancy
probability, the colonization probability (the
probability of occupying a site by year t+1, which
was unoccupied in year t), the local extinction
probability (the probability of not occupying a site
by year t+1, which was occupied in year t), and
the detection probability. For the covariates of the
habitat state model, the land cover factors
measured in 2.2 were used. For the covariates of
the detection model, the number of days from
January 1 and its square and cube terms were
used. The model with the smallest AIC value was
defined as the top-ranked model.
3. Results
In the top-ranked model, the forest area rate
showed a significant positive effect on the
occupancy and the colonization probability.
Further, it demonstrated a significant negative
effect on the local extinction probability. There
was no adopted covariate in the detection
probability.
4. Conclusion
The study revealed the importance of
conserving the forest sites to maintain the
long-term urban-breeding goshawk population.
References
MacKenzie, D. I., Nichols, J. D., Hines, J. E.,
Knutson, M. G., Franklin, A. B. (2003).
Estimating site occupancy, colonization, and
local extinction when a species is detected
imperfectly. Ecology, No.84, pp.2200-2207.
P-3
81

An Analysis of Redevelopment and Resettlement History of Seoul
Kongjang CHO, Aram SEO, Sungju HAN
Korea Environment Institute, Korea
Keywords: Redevelopment, Resettlement, Gentrification, Social Impact Assessment
1. Introduction
Korea has been experienced unprecedentedly
rapid urbanization and industrialization since
1970’s. As a result, high concentration of the
population has been demonstrated from then.
Especially the capital Seoul has become a
metropolis with the population over 10 million.
Accordingly, the urban redevelopment projects
actively led by the government across the city
have been implemented since 1970’s. As a result,
the land value of 2010 has soared almost 1,370
times more than that of in 1960.
Urban redevelopment of Seoul can be summarized
as a process of ‘social upgrading’ by implementing
physical improvement (e.g. demolition, rebuilding).
In other words, in Korean context, the urban
redevelopment process can be seen as a form of
‘gentrification’. This research investigates the
problems caused by redevelopment process focusing
on the gentrification and resettlement problem.
2. Characteristics of redevelopment history
2.1 Mid 1970’s~Early 2000’s
The redevelopment was processed by the
developers (association of property owners), who
only seek the maximized development rent,
resulting in rush in the process.
While compensation for residential measure has
been improved slow by slow, the compensation for
the commercial tenants was hugely insufficient.
In order for developers to clear the process swiftly,
various types of illegal expedient are occurred for
maximization of the developers’ profit. The violence
brought huge conflict and resistance from the
residents.
2.2 Mid 2000’s ~ Presents
The developers, the real-estate consultants and
landlords, saddle the vulnerable group such as the
tenants with the development cost. Due to the
biased current system, low-income tenants cannot
be compensated fully about what they have
invested in, for example a “foregift”, which is 50-
100 times higher than the monthly rental fee. Also,
increased rental fee after the redevelopment
burdens the original tenant. Subsequently, it
promotes speculation in real-estate economy.
3. Conclusions
Redevelopment process in Seoul has made the
area more attractive and activated, however, the
marginalized group in the community has been
discriminated during the process. The supply of
higher level of the housings which not everyone
can afford rather makes current dwellers have
lower chance to purchase and even to return to
the area. The problems represented in the most of
the redevelopment of Seoul can be told as a
typical example of ‘exclusive displacement’. Higher
proportion of tenant than the landlord in Korea
makes involuntary resettlement inevitable.
References
1. Park, T.W et al. (2016), Gentrification in Korea, Urban
Information Service, 413, 3-14.
2. Ku, D and Kim, S.J (2006), Social Impact Assessment
of Urban Development Project : The Case of Eunpyeong
New Town Project in Seoul, ECO, 2006.12, 7-43.
P-4
82

Development of a leaching assessment framework for the utilization of coal ash at South Korean mine reclamation
sites
Hanna Cho1
1Korea Environment Institute, Korea Keywords: Leaching assessment, coal ash, mine reclamation, EIA
1. Introduction
Numerous leaching procedures for coal ash havedemonstrated that the quantity of the extractedmajor and trace elements can be extremelyvariable, depending on the nature of both the coalash and the leaching solution. It is difficult toidentify the suitable leaching method for coal ashaccording to the particular situation in the fieldarea. Nevertheless, to reduce deviations betweenleaching test estimates in the laboratory andmeasurements in the field, the appropriateleaching test must be identified and theappropriate leaching procedures with the rightconditions must be selected. Site-specificconditions must be given due attention in theselection of a leaching test for coal ash
2. Methods
In South Korea, there is one legal leaching procedure: KLP(Korea leaching procedures). To find suitable leaching procedures for using coal ash at mine reclamation sites in South Korea, several leaching procedures relative to coal ash were reviewed and evaluated. To evaluate KLP according to its release of coal ash elements by comparing it with that of other leaching methods, data on several leaching methods, such as KLP, TCLP(Toxicity characteristic leaching procedure), SPLP(Synthetic precipitation leaching procedure), and MWLP(Mine water leaching procedure) were collected and analyzed.
3. Conclusions
It was observed from this research that the KLP might have underestimated the leaching potential of nearly each trace metal in the analysis. Also, KLP appeared to have in accurately predicted the long-term effect of coal ash in mine environments. Most Korean coal ashes have alkaline characteristics, and when their alkalinity has been exhausted, their leachate becomes acidic. There is no suitable leaching procedure for acid environments in Korea. Due to this fact, the pH of the MWLP buffer solution was lower than that of other procedures. MWLP effectively exhausts elements of coal ash and helps determine the long-term leaching behavior of waste placed in acid environments. Therefore, MWLP may be a more appropriate leaching test for the environmental impact assessment of the use of coal ash at mine reclamation sites in Korea
Acknowledgements This research was supported by the
Korea Environment Institute (2017M3D8A2085339)
References
Zandi M, Russell NV (2007) Design of a leaching test framework for coal fly ash accounting for environmental conditions. Environ Monit Assess 131:509–526.
Sakanakura H, Osako M, Kida A, Sakai SI (2011) Design optimization and standardization of an environmental availability test under both acidic and alkaline conditions. J Mater Cycle Waste Manag 13:56–67
P-5
83

Spatial variations of water quality data in the four weirs installed in Nakdong River
Daeyeon Park†, Hyungseok Park, Sewoong Chung
Department of Environmental, Urban and Chemical Engineering Graduate school, Chungbuk National University, Cheongju, Korea
Keywords : Spatial Variation, Kruskall-Wallis, Harmful Cyanobacteria, Nakdong River, Weir
1. Introduction
The occurrence of algal blooms is one of the
important environmental issues that has been
observed in Nakdong River after installation of the
6 weirs since 2012. The field data collected
through a regular water quality monitoring program
are not sufficient to characterize the spatial
variability of water quality. Thus, intensive water
quality monitoring for acquiring spatial data in
lateral and vertical directions are under performed
by the Korean Ministry of Environment and Korea
Water Resources Corporation to better understand
the physical, chemical, and biological factors that
influence on the bloom processes. However,
intensive monitoring requires cost and labor.
Therefore, it is needed to optimize sampling points
to represent the spatial variability of the
waterbodies.
The objective of this study was to perform
statistical analysis on the field data to validate the
difference of water quality variables in lateral and
vertical directions using the Kruskall-Wallis test.
2. Materials and Method
Lateral (left, center, right) and vertical (top, middle,
bottom) field data were collected at 500 m from
each weir (G-G, DA, H-C, C-H) installed in
Nakdong River. Sampling was performed 14 times
from August to October, 2017. Water quality
variables including water temperature, dissolved
oxygen and four harmful cyanobacteria species
(Anabaena, Aphanizomenon, Microcystis,
Ocillatoria) were analyzed using the Kruskal-Wallis
test with Nemenyi’s test (Pohlert, 2014) for the
pairwise multiple comparison of variables
measured at different location. Hypothesis test
was conducted with a significance level of 0.1.
3. Results and Discussions
The results showed that the lateral variations of
most water quality variables are not significant(p <
0.1), but the vertical variations are statistically
significant for many variables (Table 1). 10
variables in the G-G weir and 13 variables in the
DA weir showed a significant difference by water
depth. In the H-C weir, 5 variables such as BOD,
Chl-a, Cyanobacteria were different by water
depth, and DO, SS, NH3-N, Chl-a, Microcystis
were difference by water depth at the C-H weir.
For the lateral variation tests, Euglena showed
significant difference in the DA weir. And
Cyanobacteria and Dinophyta were significantly
different in the left side and right side in the C-H
weir.
Table 1. Kruskall-Wallis test and post-test results(Top,
Middle, Bottom)
4. Conclusions
In the four weirs, the water quality and algae
species showed significant difference by depths,
while the lateral variations were found to be not
significant.
5. References
Pohlert T. The pairwise multiple comparison of
mean ranks package (PMCMR). 2014. R package.
P-6
84

Social Impact Management of Geothermal Development
Yuki SHIBATA1, Aki SUWA 2, Takehiko MURAYAMA3
1TOHO University, Japan 2Kyoto Women’s University, Japan
3Tokyo Institute of Technology, Japan
Keywords: Geothermal Development, Social Impact, Resource Management, Community Design
1. Introduction
Japan has world’s-third geothermal resource potential (23-GW) behind US (39-GW), and Indonesia (27-GW) (Williams, C.F. et.al., 2008, Darma, S. et al., 2010). However, the Japanese electric capacity of installed geothermal power (537-MW) ranks 8th in the world lists behind US, Philippine, Indonesia, Mexico, Italy, New Zealand, Iceland. Geothermal power development in Japan has been started in the early 1970’s, and currently 17 large/medium scale geothermal power plants are in operation, but the total geothermal electric power generation is only 0.2% of the total electric power supply in this country (Thermal and Nuclear Power Engineering Society, 2012).
On this background, we established “Geothermal Governance Study Group” in 2011. Since then, we have summarized the current situation and latest challenges of geothermal resource uses in Japan and other geothermic regions. This presentation shows the results of our study activities and proposes a new approach for the community driven geothermal resource management scheme.
2. Results of Our Study Activities
The result of our study activities were published as an introductory textbook “Geothermal uses in the community” in 2018. This textbook consists three main parts. The first part explains the basic mechanism of geothermal uses from the geological understandings to the engineering of power generation. The second part describes the social barriers of geothermal developments and introduces the 9 advanced cases which challenge the new approaches for community and/or municipal based geothermal development projects in Japan. The final part indicates various lessons from the theoretical studies of related fields including risk communications, impact assessment and consensus building. This part also refers suggestions from the good practices in Iceland, New Zealand and other Asian countries.
3. Conclusions
Through the publishing, our study group proposes a new approach for the community driven geothermal resource management and the planning systems including consensus based social impact management.
Acknowledgement
This work was supported by Grant-in-Aid for Young Scientists (B) Grant Number 17K12862. References
SHIBATA, Y., KANASUGI, M. UECHI J. “Social Impacts from Geothermal Developments” International Association of Impact Assessment , Annual Conference 36(2016)
Williams, Colin F., Reed, Marshall J., Mariner, Robert H., De Angelo J., Galanis, S. Peter Jr. (2008) “Assessment of moderate- and high- temperature geothermal resources of the United States”.
Fig. 1 Geothermal Potential and installed Capacity (Williams, C.F. et.al., 2008, Darma, S. et al., 2010) ThinkGeoEnergy Research, GEA IGA (2015)
P-7
85

The Dispersal Trend of Alien Plants in Road Construction
Yunsoo Chu1, Seon-Mi Lee1, Jung-kwon Kim1, and Hyohyemi Lee1
1National Institute of Ecology, Korea Keywords: Alien plant, Road development, Dispersal strategy, Seed bank
1. Introduction
Road development is a construction in which civil engineering works such as logging and cutting are basically carried out. As a stabilized ecosystem is transformed into a bare land ecosystem due to disturbance of topsoil (Faucette et al., 2006), the area becomes very easy to invade alien plants (Forman, 2003). To identify the acceleration of the introduction and dispersal of alien plants due to the road construction, we investigated the seed bank and the aboveground vegetation survey at the Seolma-Gueum road construction site.
2. Results and discussion2.1. Alien flora characteristic
Since disturbance is constantly occurring due to the characteristic of the road construction, the percentage of annual plants was high in most of the study sites. Xanthium strumarium, Aster
subulatus appeared only in the seed bank, mostly unintentionally introduced species.
2.2. Classification of type according to alien plants
The result of principal coordinate analysis was classified into the three groups (Fig. 1). First, aboveground vegetation with high weight and volume of seeds and the unassisted dispersal. Second, natural vegetation with high percentage of wind dispersal. Third, seed bank with wind and unassisted dispersal ratio similar.
3. Conclusion
Road construction promotes the introduction of new alien plants. Vegetation was classified into three types, but it is expected that it will be similar as construction progresses. Because of the characteristics of the road, bidirectional dispersal
of alien plants will be possible at a much faster rate. It is predicted that dense alien plants will become a dispersal passage to the rural area because intercity connection is the main purpose.
Figure 1. Results of principal coordinates analysis using soil seed bank and aboveground vegeataion
References
Faucette, L. B., L. M. Risse, C. F. Jordan, M. L. Cabrera, D. C. Coleman, L. T. West (2006) Vegetation and soil quality effects from hydroseed and compost blankets used for erosion control in construction activities, Journal of Soil and Water Conservation, No.61, pp.355-362.
Forman, RT (2003) Road ecology: science and solutions, Island Press.
P-8
86

Estimation of PM2.5 Concentration through the Restriction on Diesel Vehicles
Suhyang Kim1, Sun Hwan Park1, Min Uk Choi2 and Hyun-Soo Joo2
1Sunil Engineering & Consultant, Co., Korea 2Korea Environment Institute, Korea
Keywords: Diesel Vehicle, PM2.5 concentration, Emission Reduction, CMAQ
1. Introduction
Diesel exhaust was recently classified as Group 1carcinogen by the International Agency forResearch on Cancer (IARC, 2012). The Koreangovernment has established the emissionreduction measures for the on-road transportationsector, such as fuel reformation, DPFs supply,retrofitting of aged diesel vehicles, encouragingthe use of low emission vehicles (LEV).
The aim of this study is to estimate PM2.5 concentrations when all of the diesel passenger cars, vans, light trucks and buses are replaced with in gasoline or LPG vehicles in Seoul by WRF-SMOKE-CMAQ modeling system.
2. Methods
The target period is 14th~18th January, 2018, when the high PM2.5 concentration episodes occurred in Seoul. High-concentration air pollutants were long-range transported into Seoul, after then, they were accumulated with domestic emissions and persisted in the near-surface atmosphere due to stagnant atmospheric conditions (Ministry of Environment, 2018).
CMAQ v4.7.1, WRF v.3.6.1 and SMOKE v.3.6 were employed. Local Data Assimilation and Prediction System (LDAPS) data of the Korea Meteorological Administration (KMA) were used to provide initial and boundary conditions for meteorological fields. The domain 1 for nesting process was covered the East Asia. The domain 4 covered Seoul is 67×67 grids in plane with 1 km grid resolution. The emissions in East Asia are
based on the INTEX-B emission. The anthropogenic emissions from Korea are derived from Clean Air Policy Support System (CAPSS) 2014 of the National Institute of Environmental Research (NIER).
3. Conclusions
In 2014, the NOX emissions in Seoul were 62,358 tons, and 49% of which were from on-road mobile sources. Also, the NOX emissions from target vehicles were 18,477 tons, accounted for 30%. The changes in emissions depending upon the conversion of vehicles were estimated by multiplying the ratio of the emission factors for diesel vehicles to gasoline or LPG vehicles.
As the results, NOX emissions were estimated to 2,061 tons when diesel vehicles were converted to gasoline vehicles by totally 100%, it means approximately 88% decrease in NOX emissions (18,477 tons to 2,061 tons). In addition, when converted to LPG vehicles, NOX emissions were estimated to 2,576 tons, which means approximately 86% decrease in NOX emissions. Finally, this study suggests that PM2.5 concentrations over Seoul can be estimated using the reduced emissions as above.
References
IARC (2012) Diesel Engine Exhaust Carcinogenic, International Agency for Research on Cancer, World Health Organization.
Ministry of Environment (2018) High concentration Particle matter in Seoul metropolitan area, press release, 7th Feb., 2018, in Korea.
P-9
87

Implementation of environmental impact assessment, environmental management and monitoring.
(Case Study of Environmental Management and Monitoring Implementation in Padang Pariaman District, and EIA in Kendal District, Indonesia)
Dikarama Kaula¹, Vivin Irawati¹, Erri N Megantara², Bambang Heru³ and Herri Y Hadikusumah² ¹ Master's Program in Environmental Science, Universitas Padjadjaran, Indonesia
² Master's Program and Doctor of Environmental Science, Universitas Padjadjaran., Indonesia ³ Doctoral Program of Management Science, Universitas Pasundan, Indonesia.
Keywords: EIA, EMEF, IRT, Management, Monitoring, Implementation
1. Introduction
Rules and Regulations that dictates Environmental Law in Indonesia have existed since more than 30 years ago. But in reality these days, there are still many Projects that neglects the importance of it. In Padang Pariaman There are 109 businesses and/or activities in this district which have Environmental Licenses, 87 of which have Environtmal Impact Assesment (EIA), eight have Environtmental Monittoring Effort Form (EMEF), and 14 others have environmental documents at EIA/EMEF level (LHPKPP Services of Padang Pariaman District, 2016).
Figure 1. Indonesia Map
In Kendal district there are 12 projects which is mandatory to have EIA, but only 6 of them accomplished that term, only 1 of those 6 have Implementation and Reporting Techniques (IRT).
2. Methodology
2.1 Objects and Location of Research
The object of the research is the implementation of management and monitoring of business
environment and/or activity in Padang Pariaman District which already has EIA or EMEF and has operated for at least one year. The research sites are included in the area of Padang Pariaman , and Kendal District (Marked in Figure 1).
2.2 Research Methods
The method used in the research is a combination of quantitative and qualitative methods (mixed method). The merger design is a convergent parallel where both quantitative and qualitative methods are used simultaneously, in which the results of the two are linked/compared for subsequent interpretation (Creswell, 2016).
3. Conclusions
Factors influencing a policy adopted from the Mazmanian and Sabatier (1983) theories have been shown to have an effect on the implementation of environmental management and monitoring of businesses and/or activities in Padang Pariaman District, although with varying degrees of significance. Influence can be either positive or negative. While in Kendal there is also a lack of understanding of EIA and funds to implement it from the government officials.
References
Creswell, J. W. 2016. Research Design (Qualitative, Quantitative, and Mixed Methods Approaches) – Fourth Edition. Pustaka Pelajar. Yogyakarta.
Mazmanian, D dan Sabatier, A. 1983. Implementation and Public Policy. Scot Foresman Company. California.
P-10
88
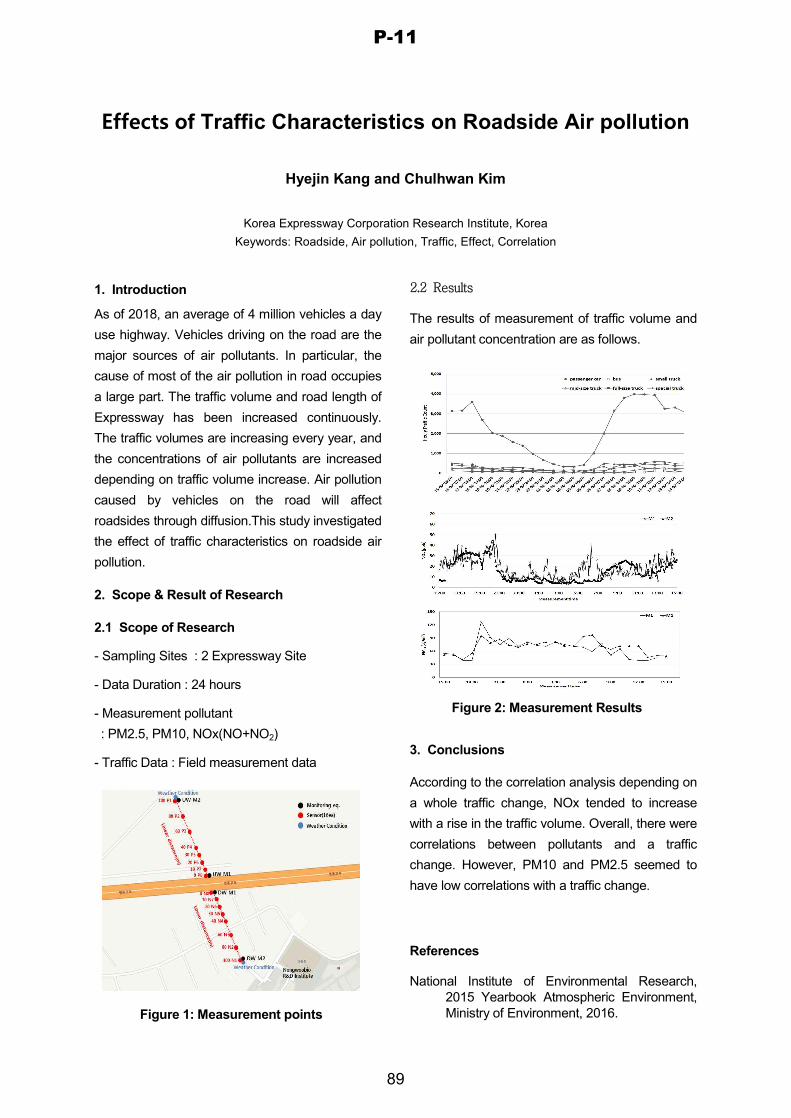
Effects of Traffic Characteristics on Roadside Air pollution
Hyejin Kang and Chulhwan Kim
Korea Expressway Corporation Research Institute, Korea Keywords: Roadside, Air pollution, Traffic, Effect, Correlation
1. Introduction
As of 2018, an average of 4 million vehicles a dayuse highway. Vehicles driving on the road are themajor sources of air pollutants. In particular, thecause of most of the air pollution in road occupiesa large part. The traffic volume and road length ofExpressway has been increased continuously.The traffic volumes are increasing every year, andthe concentrations of air pollutants are increaseddepending on traffic volume increase. Air pollutioncaused by vehicles on the road will affectroadsides through diffusion.This study investigatedthe effect of traffic characteristics on roadside airpollution.
2. Scope & Result of Research
2.1 Scope of Research
- Sampling Sites : 2 Expressway Site
- Data Duration : 24 hours
- Measurement pollutant: PM2.5, PM10, NOx(NO+NO2)
- Traffic Data : Field measurement data
2.2 Results
The results of measurement of traffic volume and air pollutant concentration are as follows.
3. Conclusions
According to the correlation analysis depending on a whole traffic change, NOx tended to increase with a rise in the traffic volume. Overall, there were correlations between pollutants and a traffic change. However, PM10 and PM2.5 seemed to have low correlations with a traffic change.
References
National Institute of Environmental Research, 2015 Yearbook Atmospheric Environment, Ministry of Environment, 2016. Figure 1: Measurement points
Figure 2: Measurement Results
P-11
89

Approach for Mainstreaming of Climate Change Adaptation in Urban Basic Plan of Korea
LEE Youngsoo, LEE Seung Hyun, Choi Sang-Ki
Korea Environment Institute, Korea
Keywords: Mainstreaming of Climate Change Adaptation, Urban Basic Plan, Korea
1. Introduction
Climate change adaptation is very important to minimize adverse impact of extreme disaster caused by climate change. For the mainstreaming of climate change adaptation in the high-level administrative plan, we reviewed guideline for basic urban plan and confirmed how much adaptation is considered in this guideline. And we suggested revised guideline to take into account climate change adaptation
2. Guideline for Urban Basic Plan
2.1 Contents of Guideline
The guideline is composed of 5 chapters.
Chapter 1 : Generals
Chapter 2 : Range of Planning
Chapter 3 : Contents and Principles of Planning
Chapter 4 : Criteria for Planning of Specific Plan
Chapter 5 : Planning Procedure
Chapter 1 consists of 3 parts. The 1st is purpose of the guideline. The 2nd is meaning of the guideline. The 3rd is hierarchy and position.
Chapter 2 consists of 3 parts. The 1st is target of plan. The 2nd is target year. The 3rd is spatial zone of plan.
Chapter 3 consists of 3 parts. The 1st is contents of urban basic plan. The 2nd is basic principles of planning. The 3rd is notice for planning.
Chapter 4 consists of 13 parts. The 1st is characteristics and status of city. The 2nd is goal of plan and index designation. The 3rd is designation of spatial structure. The 4th is land use plan. The 5th is infrastructure. The 6th is core of city and living environment. The 7th is preservation and management of environment. The 8th is landscape and esthetics. The 9th is park and green space. The 10th is prevention of disaster and safety. The 11th is development and promotion of economy, industry, society and culture. The 12th is execution of plan. The 13th is division of living space.
Chapter 5 consists of 5 parts. The 1st part is set up of plan. The 2nd is increase of public participation. The 3rd is application for approval. The 4th is approval of plan.
3. Conclusions
In order to identify whether climate adaptation is considered in high-level administrative plan, we reviewed guideline for set up of urban basic plan. It was found that adaptation is considered rarely in the urban basic. Thus, we suggested a revised guideline.
References
Ministry of National Land and Transportation, (2017) Guideline for Set up of Urban Basic Plan
P-12
90

Elution characteristics by sediment characteristics
Yoon-A Park1, Dong-Min Lee1, and Jong-Min Oh2
1 Department of Applied Environmental Science Kyung hee University, Korea 2 Department of Environmental Science & Engineering Kyung hee University, Korea
Keywords: Elution characteristics, Sediment, Characteristics, Kaolin, Fluorine
1. Introduction
The purpose of this study was to Elution characteristics by sediment characteristics in the river by conducting an experiment with small and medium rivers in Gyeonggi-do. A total of three sampling sites have been selected to collect river sediment of different Particles in diameter. Adsorption and elution characteristics according to saturation showed that the higher the clay content, the higher the adsorption amount of fluorine and the lower the amount of fluorine released. From this study, It was possible to predict the behavior of fluorine dating from depending on the soil of sediments.
2. Research method
Fluorine concentration in sediment is measured using an ultraviolet / visible ray spectroscope according to Standard methods for the examination of Soil pollution. We used artificial contaminated specimens 1, 2, and 3 to see how Elution characteristics by sediment characteristics. In the neutral conditions, 30 ml of the third distilled water was added to each of the 2 grams of artificially contaminated specimens, which were then added to the 50 ml capacity chemical tube and tested for six hours at room temperature. After centrifugation of the suspension, the fluorine concentration of the upper layer was then measured using an ion electrode (ISE meter).
3. Conclusions
Analysis of the results of the experiment showed that The amount of fluorine eluted changed with the amount of kaolin added. In all of the samples 1, 2 and 3, less elution was emitted when no kaolines were added at all. If sample 1, 2, and 3 were analyzed without adding kaolines, the amount of fluorine was high in the order of sample 3 of sample 1 > sample 2. As the absorption reaction with fluorine was better in specimen 3 with a higher proportion of silt and clay, the result was that the amount of elution in the water was the least. The characteristics of the soil may vary depending on the physical conditions such as stream velocity, depth, and width of the stream, and the characteristics of fluorine in different sections are expected to vary.
4. Acknowledgement.
This research was supported by a grant (12-TI-C02)(code18CCTI-B063263-07) from Advanced Water Management Research Program funded by Ministry of Land, Infrastructure and Transport of Korean government
5. References
Chae-Lim Kim, 2017, Effect of sediment Property on Adsorption of Fluoride, KyungHee University
Table 1: Amount of fluorine eluted Sample1 Sample2 Sample3
Addition of kaoline 0% 1.5% 0.9% 0.6%
Addition of kaoline 0% 3.3% 3.1% 1.6%
P-13
91

Habitat selection analysis of Ural Owls using an occupancy model
Takumi Shimizu1, Haruki Natukawa2, Hiroki Yuasa3 and Tomohiro Ichinose4
1Keio University, Japan 2Yokohama National University, Japan
Keywords: Ural Owl, Occupancy model, Habitat Selection, Robust Design, Call-broadcasting
1.IntroductionHabitat selection by organisms is
closely related to individual fitness. Habitat selection can be identified by the disproportionate rate of some habitats compared to their availability in the environment, and it reveals essential requirements of the organisms.
The Ural Owl (Strix uralensis) is a medium-sized raptor distributed from northern Eurasia to the Scandinavian Peninsula. Top predators, such as Ural Owls, are often associated with high species richness because they usually have large home range with spatial heterogeneity. Therefore, raptors can be designed as surrogate species to represent the status of many species on some habitats. For this reason, to elucidate the habitat selection of Ural Owl and to quantify the habitat requirement is important for habitat management of the owl and many species.
Nevertheless, previous studies on habitat selection of Ural Owl are limited. Therefore, this study aims to elucidate the habitat selection of Ural Owl.
2. Method2.1 Study Area and field survey
The field survey was conducted in Kamakura City, Kanagawa Prefecture, Japan from the beginning of April to the middle of May 2018(Figure 1). We used the call-broadcasting method at 41 randomly selected survey points from 7 pm to 6 am the following day. Each survey lasted six minutes and consisted of three minutes of playing back the male territorial song using a speaker and three minutes of waiting. During the six minutes, we recorded as “present” if there was a reaction in the neighborhood less than 250m from the survey spot. This survey was a robust design that conducted iterative surveys 5 to 6 times at each spot.
Figure 1: Survey area of this study
2.2 Statistical modeling We analyzed using occupancy model
with the objective variable of whether owls were present or absent and covariates of land cover rate within 500 m around the survey site. The occupancy model can simultaneously estimate the presence probability and the detection probability of organisms (Mackenzie et al. 2002). This model is described hierarchical bayesian model and posterior probability of parameter is calculated Markov chain Monte Carlo method.The analysis was carried out by a combination of all covariate, and the model with the lowest WAIC value was considered the top-ranked model.
3. ResultThe Ural Owl presence probability
when the cover rate of forest and grassland within 500 m around the survey spot increased. The detection probability was 42.1 % in this survey.
4. ConclusionsTherefore, land use plans considering
forests and grasslands are important for Ural Owls and other species.
References MacKenzie, D. I., J. D. Nichols, G. B. Lachman,
S. Droege, J. A. Royle, and C. A. Langtimm.(2002). Estimating site occupancy rateswhen detection probabilities are less thanone. Ecology No.83, pp.2248–2255.
P-14
92

Water quality assessment for a drinking water resource with a three-dimensional analysis
Young-Sik Ham
Faculty of Environmental Studies, Tokyo City University, Japan
Keywords: dam reservoir, drinking water resource, eutrophication, three-dimensional analysis, water quality assessment
1. Introduction
Generally, the dam reservoir is one of important
drinking water resources. However, dam
reservoirs are susceptible to Water Quality
Degradation by Eutrophication originating from
high water temperature, and excessive nitrogen
and phosphorus concentration, which is generally
resulting from some human activities (e.g.,
nitrogen and phosphorus fertilization, domestic
wastewater & etc.). Even though biochemical
oxygen demand (BOD) values representing river
water quality in Japan has been decreasing,
chemical oxygen demand (COD), nitrogen and
total coliform bacteria have an increasing trend or
chronically undesirable situation for freshwater in
Japan. This research reports a water quality
assessment for the Sagami lake of drinking water
resource in Kanagawa Prefecture and Yokohama
City in Central Japan.
2. Materials & Methods
On site, turbidity, dissolved oxygen & water
temperature were three-dimensionally measured
by a digital turbidity meter (TD-M500, OPTEX,
Japan) & digital DO meter (Multi 3410, WTW,
Germany) in May and August of 2017. All samples
were transported to our laboratory for the analysis.
Total coliform bacteria & Escherichia coli were
also analyzed by a coliform detection paper
(Suncoli X-Type, Sun Chemical Co., Ltd, Japan).
F-, Cl-, NO2-, Br-, NO3-, HPO42-, SO42-, Li+,
Na+, NH4+, K+, Mg2+, Ca2+ were determined by
an ion chromatography (ICS-1100, DIONEX, USA).
pH and EC (Electrical Conductivity) were
measured by a pH meter (691 pH Meter, Metrohm,
Swiss) and EC meter (DS-72, HORIBA, Japan).
COD was measured in triplicate by a pack test
(WAK-COD (D), Kyoritsu Chemical Check Lab.,
Corp., Japan) to which was applied a oxidation
with potassium permanganate in alkalinity and
visual colorimetric method.
3. Result & Discussion
Algae bloom caused by eutrophication has been
observed in the Sagami lake since the dam
reservoir (1947), which has been causing the
alkalization of high pH (>8.5). Furthermore, under
the condition of high pH, the mobilization and
release of toxic heavy metals (Bourg & Loch,
1995) can be accelerated with some water quality
degradations and negative environmental effects
for the aquatic living things including human being.
In water depths, water temperature, turbidity &
dissolved oxygen are seasonally showing some
difference and pattern. Although water quality is
generally downgraded in summer (August in this
study), the turbidity was improved in summer and
deeper water down to 5 m. This study assesses
suitable and unsuitable points for drinking water
resources throughout three-dimensional analysis.
This assessment will be very useful for selecting
suitable points for the water intake of drinking
water resource and improving the water quality.
References
Bourg, A. C. M., J. P. G. Loch (1995) Mobilization
of heavy metals as affected by pH and
redox conditions, Salomons & Stigliani
(Eds.), In Biogeodynamics of Pollutants in
Soils and Sediments, pp.87-102.
P-15
93

Evaluation of turbid flow by climate change impacts in a large dam reservoir in Korea
Hyungseok Park, Sewoong Chung, Daeyeon Park, Yeojeong Yoon
1Chungbuk National University, Korea
Keywords: Climate change, HadGEM2-AO, RCP 4.5, Turbid water
1. Introduction
Long-term discharge of turbid water from large
dam reservoirs is an important socioenvironmental
problem in Korea. This study used a suite of
mathematical models to simulate the fate of
turbidity flows in Soyanggang Reservoir in Korea,
which is an important source of drinking water for
the Seoul Capital Area, in response to selected
extreme flood events based on the Representative
Concentration Pathway 4.5 climate scenario.
2. Materials and Methods
Soyanggang Reservoir (latitude 37°56′44″,
longitude 127°48′52″), is located 12 km upstream
of Soyang River (North Han River) in Korea. The
reservoir is used for multipurpose including water
supply, flood control, and hydropower generation.
For the generation of future climate data in the
watershed, a specific climate scenario (RCP 4.5)
simulated using HadGEM2-AO, which is the
national standard General Circulation Model
(GCM) in Korea, is selected. The GCM data were
created based on the IPCC’s Fifth Assessment
Report (Chung et al. 2015).
Fig.1 Conceptual diagram of individual model simulation steps
The simulation was performed according to the
procedure as shown in Fig.1. Evaluation of turbid
flow was analyzed based on the stratification
strength (St; Schmidt number) and density flow
regimes.
3. Results and discussion
The model was validated using the observed
extreme flood event (2006) and showed a
satisfactory performance in simulating the thermal
stratification and transport of turbidity flow in the
stratified reservoir. The thermal stratification was
strong (St 3785 J m−2) when turbid flow entered in
2027. Subsequently, the thermal stratification
weakened but the persistent turbidity problem did
not occur. On the other hand, the turbid water
mixed to the surface layer as the thermal
stratification intensity weakened (St 2491 J m−2) in
2040. These results imply that management of
persistent turbidity in the reservoir may be difficult
when the extreme flood event and autumn
turnover occur simultaneously.
4. Conclusions
The fate of turbidity flows was highly influenced by
both the thermal stability of the reservoir and the
season in which the flood event occurred. The
high-turbidity plume remained in the mid-layer of
the reservoir under strong thermal stratification but
it rapidly mixed with the ambient water under weak
stratification
This work is supported by the Korea Agency for
Infrastructure Technology Advancement(KAIA)
grant funded by the Ministry of Land, Infrastructure
and Transport (Grant 18AWMP-B083066-05)
P-16
94

GIS-based Land-use suitability analysis for urban development using soft computing in Ili Valley, China
Chaoxu Luan, Renzhi Liu, Jing Liu and Hanwen ZhangSchool of Environment, Beijing Normal University, China
Keywords: Multi-criteria evaluation, Soft computing, Urban development, Ordered weighted averaging, Xinjiang
1. Introduction
Land-use suitability analysis is an important step in land use planning for urban development. This study aimed to implement two GIS-based multi-criteria soft computing methods: Ordered Weighted Averaging (OWA) and Logic Scoring of Preference (LSP), to comparatively evaluate and map land-use suitability for urban development in Ili Valley, China.
2. MethodologyThe GIS-MCA procedure for the land-use
suitability can be subdivided into several stages (see Fig. 1).
Figure 1: GIS-based Land-use suitability analysis procedure
2.1 Selection of the factors
The evaluation used fourteen factors as suitability criteria. The suitability criteria were grouped into four main categories, namely: natural criteria, socio-economical criteria, ecological criteria and constraint criteria.
2.2 Design and combination
The order weight and the parameter α (attitudinal character) characterize the OWA aggregation. The order weight was generated by applying the maximum entropy approach. The LSP aggregation structure is a decomposition structure based on soft computing models (see Fig. 2). Combination of the opportunity criteria was achieved from the two
methods. The Multiplicative operator was used to obtain the constraint map by means of constraint criteria. Overall land-use suitability map is determined by combining the opportunity map and the constraint map.
Figure 2: The LSP aggregation structure for Land-use suitability
2.3 Classification of the land-use suitability
The resultant map was classified into 5 levels: not suitable, marginally suitable, moderately suitable, suitable and highly suitable.
3. Results
Fig. 3 shows the urban development land-use suitability distribution for Ili Valley with two methods.
Figure 3: Overall suitability map with two methods
References
Liu R, Zhang K, Zhang Z, Borthwick A G L. 2014. Land-use suitability analysis for urban development in Beijing [J]. Journal of Environmental Management, 145: 170-179.
Montgomery B, Dragićević S, Dujmović J, Schmidt M. 2016.
A GIS-based Logic Scoring of Preference method for evaluation of land capability and suitability for agriculture [J]. Computers and Electronics in Agriculture, 124: 340-353.
Yager R R, Alajlan N. 2016. Some issues on the OWA aggregation with importance weighted arguments [J]. Knowledge-Based Systems, 100: 89-96.
P-17
95

Analysis of Sediment Contamination Levels in a Hypereutrophic Reservoir
Sungjin Kim, Youngcheol Cho†, and Sewoong Chung
Chungbuk National University, Korea
Keyword : algal bloom, sediment, total phosphorus, hypereutrophic reservoir, water quality
1. Introduction
The nutrients released from the reservoirs
sediments are known to have a major impact on
primary production and water quality of the aquatic
system (Boström et al., 2002). Many agricultural
reservoirs in Korea are eutrophic and showing a
high-level of contamination with nuisance algal
bloom and offensive odor during the summer.
Particularly the aged reservoirs have relatively
larger amount of contaminants accumulated in the
sediments for long time. In order to manage the
water quality of these reservoirs, it is necessary to
assess the contamination levels of the sediments
and to take measures to remove pollutants. The
aim of this study was to investigate the spatial
distributions of sediment contaminants in a
hypereutrophic reservoir and assess the
contamination level of sediments according to the
Sediment Quality Assessment Guideline of
Korean Government.
2. Materials and methods
To investigate the pollution level of sediments in
the reservoir, we collected sediments twice or
more from each site in 20 sites in the reservoir and
analyzed the degree of pollution. The analysis
items are pH, particle size, COD, ignition loss, total
nitrogen (T-N), total phosphorus (T-P), heavy
metals (Zn, Cr, Co, Ni, Pb, As, Hg, Cd), release rate
nutrients from sediments.
3. Results and Discussions
The concentrations of ignition loss and total
nitrogen tended to increase from upstream to
downstream and ranged in 4.38-12.93% and
2,153-4,723 mg/kg, respectively. Heavy metals
were in the order of Zn>Cr>Co>Ni>Pb>As>Hg,
and the contamination level of the heavy metals
was not high as a whole. T-P concentrations were
in the range of 765 ~ 3,238 mg/kg, which
exceeded the contamination level of the Sediment
Quality Assessment Guideline of River and Lake
Sediment (Rule No. 2015-687 of the National
Institute of Environmental Research, Korea) at two
upstream sites, four midstream sites, and all
downstream sites. These results indicated that the
pollution level of the T-P, which is the main factor
related to algal bloom, was found to be serious.
Figure 1 Spatial distribution (up-, mid-, and down-
stream from left to right ) of T-P in the reservoir.
4. Conclusions
1) About 33% of upstream and 67% of midstream
and 100% of downstream sediments were
exceeded the contamination level of the Sediment
Quality Assessment Guideline of River and Lake
Sediment.
2) It is necessary to establish a countermeasure
for sediment management to control the algal
bloom which occurs periodically in the reservoir.
5. References
Boström, B., Jansson, M., and Forsberg, C (2002),
Phosphorus release from lake sediments, Arch
Hydrobiol Beih Erebn Limnol, 18(5): pp. 59.
P-18
96

Towards sustainable management on contaminated agricultural lands in South Korea
Sang-il Hwang*, Kyeong Yang, and Eun-jee Cha
Korea Environment Institute, Korea
Keywords: Heavy-metal contaminated agricultural soils, Anthropogenic source, Policy alternatives
1. Introduction
In Korea, heavy metal contamination in agricultural
land is caused by an increase in geological,
geographical, and climatic characteristics, as well
as by artificial pollution caused by the use of
industrial activities, fertilizers, and pesticides by
humans. In this study, we would like to contribute
to the future management of heavy-metal
contaminated agricultural soils by proposing an
advanced management of contaminated
agricultural soils after reviewing the current
systems in both domestic and international cases
in order to provide a systematic management of
heavy metal contaminated agricultural land.
2. Sustainable Management of Agricultural
Land Pollution
2.1 Examples of soil contamination in
domestic agricultural areas
The Ministry of Agriculture, Food and Rural Affairs
and Korea Rural Affairs conducted a survey of
5,645 districts and 86,709.2 hectares of farmland
pollution during the period 2002 to 2004. As a
result, the standards for soil contamination in the "
Soil Environment Conservation Act " were
exceeded in 158 areas, and the main causes of
soil contamination were mining areas, industrial
(agricultural-industrial) complexes, and
uncontrolled landfills.
2.2 A Study on the Analysis and Improvement
of Legal Systems
In the case of heavy metal management in
Korea's agricultural environment, the related laws
are operated in accordance with the scope and
contents of the work between concerned
departments, resulting in insufficient systematic
management of contaminated farmland. In the
case of soil contamination caused by artificial or
natural causes of farmland, the risk assessment
process is not implemented by granting an
exception. The cleanup work is to be carried out
based on the " Farmland Act ". Lack of such laws
caused heavy metal contaminated farmland to be
placed at the blind spot of the Act in the course of
the survey, prevention of diffusion, and cleanup of
contaminated sites.
3. Conclusions
Problems among the Soil Environment
Conservation Act, the Farmland Act, and the Mine
Damage Prevention Act were identified and
improvement measures were prepared.
References
Ministry of Agriculture, Food and Rural Affairs
(2015), Research on the need to establish
and operate an environment management
system for farmland, 216pp.
Acknowledgement
This subject is supported by Korea Environment
Institute(KEI) as “A Study of Policy Alternatives for
Managing Heavy-metal Contaminated Agricultural
Soils by Natural Causes”
P-19
97

A Study of Attached Microorganism Community with the Water Quality in Urban Stream
Tae Kyung Kim1, Kyung Mi Mun1, Kyoung Eun Choi1, Eun Ji Heo1 and Jong Min Oh1
1Kyunghee University, Korea
Keywords: Attached Microorganism, Microorganism Community, Water Quality, Growth Amount, Urban Stream
1. Introduction
The attached Microorganisms are clearly changed
in volume due to water flow, flow rate, water
temperature, and nutrients compared to other life
groups, and are useful for identifying cumulative
changes in the water system by attaching them to
the substrate. In this study, water quality changes
and attached microbial communities are analyzed
in the stream to analyze the effects of business
site discharge on the attached microbial
community. These studies can be used to
understand stream ecosystems and to assess
biological water quality, which can be used as a
basis for establishing efficient water quality
management measures for streams in the future.
2. Methods and Results
2.1 Methods
In measures the TOC, T-N, T-P, water
temperature, pH, EC as its water measure, and
analyzes ions(F-, Cl- and SO42-). And to analyze
the amount of growth of the attached microbial
community, an artificial bricks are installed on the
stream bed for five weeks, and then collects
microbial communities attached to bricks at weekly
intervals. Take only the same amount of square
size of 5 cm X 5 cm when taking samples. Use
this sample to measure SS, AFDW and
Chlorophyll-a.
2.2 Results
The Ion analysis analyzed the amount of
temperature after discharge, and found that three
ions increased after discharge. The data analyzed
weekly samples of the attached microbial
community showed that the SS was about 20
times greater in the stream than in the previous
five weeks. AFDW increased by about 2.6 times in
the stream after the introduction of the discharge
water, and chlorophyll-a also increased by about 9
times in the stream after the discharge water was
introduced.
3. Conclusions
In this study, the effect of the effects of attached
microorganisms in urban streams was understood
to some extent, and a variety of aspects such as
the degree of attachment of attached algae and
changes in geology are needed. And that these
data should be used as a pollution indicator of the
stream and be applied to water quality
management in the river.
Acknowledgement
This subject was supported by “Development of
algae management using stream structures in the
stream” (code 18AWMP-B098640-04) funded by
MOLIT(Ministry of Land, Infrastructure and
Transport).
References
Tae-Woong Ahn, I-Song Choi, Jong-Min Oh
(2008) Effect of Attached Microorganism
Community on Water Quality with the
Conditions of Stream Environment, Journal
of Korean Society of Water Science and
Technology, Vol.16, No.4, pp.55-62.
Hyun-Woo Kim, Kyong Ha, Gea-Jae Joo (1998)
Evaluation of Exposure Times for
Periphyton Biomass Estimate using Artificial
Substrata in Headwater Streams, Journal of
the Korean Environmental Sciences Society,
Vol.7, No.1, pp.112-115.
P-20
98

Study on ecological influence of Changchun high-tech development
zone on Jingyuetan National Forest Park
Hongguang Cheng1,Zhenzhen Wu1
1 Beijing Normal University, Beijing, China Keywords: EIA, Industrial development Zone, National Forest Park, Ecological Impact
1. Introduction
The environmental impact assessment of regional development is to evaluate the potential impact of human development activities on environment at a certain geographical range, comprehensively and systematically. However, it is also very important to identify and predict the potential impact of development activities on the Nature Reserve and Scenic Area, scientifically and accurately, which are around the developing zone. In this study, Jingyuetan National Forest Park was selected as the research object to analyzes the influence of the construction of Changchun High-tech Industrial development Zone (High-tech Zone) on its ecological environment. Jingyuetan National Forest Park is located in the east of Changchun Jingyue High-tech Development Zone in Jilin
Province.
Figure 1:Location
2. Methods
Jingyuetan National Forest Park is near by the Changchun Jingyue High-tech Development Zone, so it is very important to evaluate the effect of
exploitation on the ecosystem service function of Jingyuetan National Forest Park. The course of development and construction has influence on the functions of regulator, supply, support and culture. Forest ecosystems not only provide human beings with the necessary food, medicine and industrial and agricultural production of raw materials and other products, but also maintain the survival and development of human life support system.
3. Conclusions
To sum up, it is meaningful to assess the effect of
development on the ecosystem service function of
National Forest Park.
4 Reference
WANG Jin-ye,YANG Li-lin,et,al.Impact
Assessment of Ecotourism Environment of National
Nature Reserve— A case study of Mao'er Mountain
National Nature Reserve[J].Journal of central south
university of forestry & technology,2010,1(4):105-
108.
Briassoulis H. Tourism and Envionment : planning
issues and approaches. Istanbul [M ]. Turkey : Yildiz
University Press,1991 : 78- 83.
TANG Xiao—hui,LIN Nian-feng,JIANG Ling-
ling.The assessment and contrastive analysis of the
city ecological construction current state in Jilin
Province[J].Journal of Jilin University(Earth Science
Edition),2004,34(Sup.):144—148.
P-21
99

A Study on the Legal and Institutional Review for Improving Bio-Mobility in Environmental Impact Assessment
Su-gon Park1, Yong-Su Park1
1National Institute of Ecology, Korea
Keywords: EIA, Wildlife Crossing, Guiding fence, Escape ramp, roadkill
1. Introduction
In 1998, a box-shaped ecological aisle began to
be constructed in Jirisan Siamjae. In 2018, there
are now 458 Wildlife Crossing. The cost of
constructing Wildlife Crossing ranges from a
minimum of 10 million won to a maximum of several
hundred billion won depending on the type and
scale. Even at such a high cost, there are about
2,000 wildlife road kills each year.
The purpose of this study is to analyze the
causes of the decrease of road kills and to improve
the consultation process and post-management-
techniques in environmental impact assessment.
2. Method
2.1 Analysis of ecosystem cut-off facilities in
the environmental impact assessment report.
Based on the results of analysis of 370 projects
that mention ecosystem cut-off facilities (Wildlife
Crossing, Guiding fence, Escape ramp, etc.) among
504 post-environmental impact surveys received in
the 2016 National Institute of Ecology. The study
was carried out in order to elucidate the problems of
ecological aisle through the environmental impact
assessment and suggest ways to improve it.
2.2 Research on Wildlife Crossing composition
Of the 370 post-environmental survey projects that
were received as a linear project in 2016, 44 plants
were selected randomly from about 30% of the 143
sites completed in June 2011 to June 2016 (5
years) And confirmed the actual condition of the
passage.
3. Conclusions
Based on the survey of 504 post-environmental
impacts received at the National Institute of Ecology
in 2016, we conducted literature surveys and on-
site surveys on the eco-pathways established
through the consultation on environmental impact
assessment. The following five problems and
improvement measures were derived.
First, the idea of Wildlife Crossing and the principle
of unification are unified. Second, there are
guidelines that can be applied at each stage in the
field. Third, if the contents are different from the
contents of the consultation, a penal clause is
established to prevent formal formation. Fourth,
there is a need for measures to strengthen basic
research on Wildlife Crossing installation. Fifth, a
systematic improvement plan should be prepared
for enhancing the post inspection function of Wildlife
Crossing and correcting it if it can not function.
Taken together, it would not have resulted in the
fragmentation of habitat if roads were not built, and
it would have been possible to move wild animals in
wider areas than Wildlife Crossing. It would have
been better connected than the current Wildlife
Crossing
However, it can be said that wild animals have been
used to set up Wildlife Crossing rather than leaving
fragmented habitats as they are, but wild animals
have not increased compared to pre-construction,
which caused habitat fragmentation.
References
Kim, M. S., H. Y․ Heo, S. M․ Cho, S. A. Shin,
T. M. Ahn (2005) An analysis of eco-corridors
in Korea by Case study of Domestic and
Foreign Cases. The journal of environmental
restoration technology 8(2): 41-55.
P-22
100

Analysis of CO2 Emission Characteristic of Daecheong Reservoir during the Turnover Period
Eun-Ju LeeΨ, Hyeong-Seok Park, Se-Woong Chung
Department of Environmental, Urban and Chemical Engineering Graduate school, Chungbuk National University, Chungju, Korea
1. Introduction
Various studies have been conducted to identify
the global carbon cycle. The global carbon cycle
studies have largely been done without taking into
account the function of land freshwater, such as
lakes and reservoirs. However, CO2 transfer from
inland water to the atmosphere is a component of
the global carbon cycle, and land freshwater is
reported as a major source of atmospheric CO2 in
the carbon cycle analysis (Guerin et al., 2006;
Battin et al., 2009).
In this study, CO2 emission characteristics at
Daecheong Reservoir located in Geum River
basin of Korea were evaluated during the turnover
period (June to November 2017) by estimating the
Net Atmospheric Flux (NAF) of CO2 at the
atmosphere - water interface.
2. Materials and Methods
To evaluate the carbon emission characteristics of
Daecheong Reservoir during the turnover period,
this study conducted 14 field surveys for 6 months.
The pH was measured with YSI pH1200.
Alk(mg/L), COD(mg/L), TOC(mg/L), DOC(mg/L)
and Chl-a(mg/m3) were analyzed according to
Standard Method (APHA, 2005). The partial
pressure of dissolved CO2 in water (pCO2) was
calculated by thermodynamic equilibrium equation
including pH, DIC, Alk and water temperature
using CO2SYS. The NAF was calculated
according to the partial pressure difference of the
atmosphere and water with gas transfer velocity
estimated using Wanninkhof and Knox equation.
3. Results and Discussion
The NAF in the period of strong formation of
hydrothermal stratification (June to September)
was mostly absorbed atmospheric CO2. On July
27 and August 3, NAF temporarily showed a
positive value, which is considered to be due to
rainfall. During the period from September 6 to 12,
September 26 to October 10, the pCO2 decreased
due to the primary production of algae.
The pCO2 in the reservoir surface and the NAF
tended to increase as the stratification strength
weakened. Fall turnover started from October 23rd,
afterward the surface water was rapidly mixed with
pCO2 supersaturated deep water. Consequently,
the surface pCO2 increased up to 1500 μatm and
the NAF was greater than 3000 mg/m2·d, and
tended to increase with time.
The results confirm that the accumulated CO2 in
the middle and bottom of the reservoir discharges
to the atmosphere rapidly after turnover period.
References
Guerin, F., Abril, G., Richard, S., Burban, B.,
Reynouard, C., Seyler, P. and Delmas, R.
(2006), Methane and carbon dioxide
emissions from tropical reservoirs:
significance of downstream rivers.
Battin, T.J., Luyssaert, S., Kaplan, L.A.,
Aufdenkampe, A.k., Richter, A. and Tranvik,
L.J. (2009), The boundless carbon cycle.
This research was supported by the Ministry of Ed
ucation, Republic of Korea and National Research
Foundation of Korea in 2017. (National Research
Foundation of Korea-2016-R1D1A3B03-
2016131042)
P-23
101

Arsenic and Heavy Metal Contaminations of Rice Grown in Bangladesh
Jumpei MIYAZAKI1, Kosuke MURAMATSU1, Masahiro TOKUMURA1, Muhammad Rafiqul ISLAM2, Qi WANG1, Yuichi MIYAKE1, Masahiro SAKATA1,
Shigeki MASUNAGA3, Takashi AMAGAI1, Masakazu MAKINO1
1University of Shizuoka, Japan
2Bangladesh Agricultural University, Bangladesh
3Yokohama National University, Japan
Keywords: Arsenic, Heavy Metal, Bangladesh, Rice, Analysis
1. Introduction
In Bangladesh, rice, which is the staple food, is
contaminated by arsenic and heavy metals. One
of their sources is recognized as wastewater from
industries which is not properly treated before
discharge. The wastewater pollutes not only
irrigation water, but also soil in the paddy field,
which results in the pollution of rice by arsenic and
heavy metals. As a result, the rice consumption in
Bangladesh increases the risk of adverse health
effects. (M. S Islam et al., 2015)
In this study, to perceive current pollution situation
in Bangladesh, we measured the concentrations of
arsenic and heavy metals in rice. In addition, the
concentrations of them in soil in the paddy field, in
which the rices were produced, were also
measured to investigate the relationship between
the concentrations of them in the rice and soil.
2. Methods
Arsenic (As) and heavy metals, cadmium (Cd),
cobalt (Co), chromium (Cr), copper (Cu), nickel
(Ni), lead (Pb), selenium (Se), and zinc (Zn), were
targeted in this study.
The paired samples of rice and soil were obtained
from Sripur, Tongi (two places: A and B),
Sonaragon, and Madhupur, in Bangladesh.
Inductively coupled plasma-mass spectrometry
(ICP-MS) was used to measure the concentrations
of arsenic and heavy metals in rice and soil.
3. Results and discussion
The concentration of As in the rices produced in
Madhupur, Sripur, and Sonargaon exceeded the
guideline value established by CODEX (200
µg/kg). The concentration of Cd in the rice
produced in Tongi A exceeded the guideline value
established by CODEX (400 µg/kg). It is reported
that As, Cd are contained in the wastewaters from
textile industries. Therefore, the contaminations of
As, Cd in rice produced in Madhupur, Sripur,
Sonargaon, and Tongi in Bangladesh could be
due to the anthropogenic sources.
In all the regions, the concentrations of As and the
heavy metals in the soil in the paddy field were
lower than the corresponding guideline values.
The significant relationships between the
concentrations in the rice and soil were observed
in Zn and Cd.
4. Conclusions
The concentrations of As, Cd in rice exceeded the
guideline values. No soil contamination in the
paddy field were observed.
References
Islam et al. (2015) The concentration, source and
potential human health risk of heavy metals
in the commonly consumed foods in
Bangladesh, Ecotoxicology and
Environmental Safety, No. 122, pp. 462-469.
P-24
102

Fig.1 Historical (box plot) and future daily maximum inflow
Impact of extreme turbidity events on the connected Andong-Imha reservoirs system
Yeojeong Yoon, Hyungseok Park · Sewoong Chung†
Department of Environmental, Urban and Chemical Engineering Graduate school, Chungbuk National University
Keywords: climate change, turbid water, CE-QUAL_W2, RCP 4.5&8.5, BMA
1. Introduction
Recently(2015), Andong and Imha dam
reservoirs were connected via a tunnel (L=1.9km,
D=5.5m) for a conjunctive use of the reservoirs.
The Imha Dam, however, had a problem that
turbid water after large flood events was released
to downstream for a long time in the past. The
turbidity events may be exaggerated due to future
climate change as rainfall patterns change (Lee et
al., 2010). There is a need to analyze the impact of
projected extreme events on the persistent
turbidity in the reservoirs system. The objectives of
this study were to project the future (2017-2100)
extreme flood events using mathematical
models(climate-watershed-reservoir), to simulate
the fate and transport of turbidity flows in the
connected two reservoirs, and to assess the
effectiveness of a selective withdrawal facility
(SWF) based on the operational rules of the
system.
2. Materials and methods
The climate data used to project the inflows were
generated using Bayesian Moving Average
method with 5 GCMs (ACCESS 1.3, CanESM2,
CNRM-CM5, GFDL-ESM2G, HadGEM2-AO) and
RCP 4.5 and RCP 8.5 scenarios. A 2D
hydrodynamic and water quality model was
constructed to simulate the Andong-Imha system.
The model was calibrated with the field data
collected in 2002 and 2003 when the most
extreme turbidity event occurred in the history. The
historical daily maximum inflows of Andong (1977-
2016) and Imha reservoirs (1993-2016) were
compared with the projected inflows (2017-2100)
in Fig. 1. The goal of turbidity flow control was to
minimize the number of days (Nday) discharging
high-turbid water (TSS > 25 mg/L). The operation
scenarios were classified as a selective clean
water withdrawal and an urgent turbid water
discharge. The selective withdrawal layer was
chosen according to the operating rules provided
by Korea Water Resources Corporation.
3. Results and Discussions
According to both historical and future projected
daily inflow data, the past 2002-2003 event was
found to be the most extreme event. However,
occurrence frequency of the extreme events
showed to increase in September in the future
compared to past, which is more vulnerable to
cause persistent turbidity because of fall turnover
mixing. The flood event projected to occur in
September of 2066 with RCP 8.5 was selected to
assess the effect of the SWF. Simulation results
showed that the Nday is about 107 days, which is
much less than the 2002 event (468 days).
Several different withdrawal scenarios simulations
showed the SWF can reduce Nday about 18 days.
References
Lee GS, Kim JY, Ahn SR, Sim JM (2010) Analysis
of Suspended Solid of Andong and Imha Basin
According to the Climate Change. Journal of the
Korean Association of Geographic Information
Studies 13:1-15.
P-25
103

Improvement Plan for the Assessment of Plantation Areas in the Environmental Impact Assessment, Republic of
Korea
Seon Mi Lee, Jae Gyu Cha, Su Gon Park, and Young Ho Cho*
National Institute of Ecology, Korea
Keywords: National Vegetation Class, Vegetation Development, Plant Species Composition, Vegetation Index, Sorensen’s Diversity Index
1. Introduction
Korea’s forests were severely devastated by theJapanese colonial era and the Korean War. Anational reforestation project was carried out in the1970s to rehabilitate them. As a result, the forestsrecovered and the area reaches up to 63.1%.Ministry of Environment makes an actualvegetation map and evaluates the NationalVegetation Classification, which has five classes,based on vegetation survey data every five years.Plantation areas are entirely assessed as fourthclass regardless of the time that has elapsed sinceplantation. This means the area is able to bedeveloped. The purpose of this study is to suggestan improvement plan for the plantationassessment in the Environmental ImpactAssessment (EIA).
2. Materials and Methods
2.1 GIS Analysis
We used a forest type map (1:5,000) made by the Korea Forest Service to show the plantation areas that are capable of development. Protected areas were excluded from the plantation areas.
2.2 Data Analysis
We collected vegetation data on secondary forests such as the Pinus densiflora community, Quercus mongolica community, Q. variabilis community and P. rigida plantation. A Vegetation Index (Hcl) and Sorensen’s diversity Index (Iss) were calculated based on the vegetation survey data and compared.
Hcl=(∑Hl×Vcl)/100 (Hl: Height of the l layer, Vcl: Plant coverage of the l layer)
ISs=(2C/A+B)×100 (A: No. of species in the secondary forest; B: No. of species in the plantation; C: No. of species common to both)
3. Results and Conclusions
We analyzed the Hcl: P. densiflora community: 7.3~20.28; Q. mongolica community: 7.1~23.7; Q. variabilis community: 6.6~21.45; P. rigida plantation: 5.7~18.13. As a result of analyzing the ISs between the secondary forests and plantation, we found high values over 50. The Hcl and ISs of the plantation areas tended to be similar to that of the secondary forests. This means that the vegetation structure and species composition of plantation areas have almost recovered to those of secondary forests. Therefore, the plantation assessment in the EIA should be specified considering time-lapsed plantation to prevent careless development projects. In addition, we should consider that a plantation area that has three or four layer and higher ISs value should be limited from development projects.
References
National Institute of Ecology. 2016. Development of technic and foundation construction for ecosystem conservation. pp. 237-325.
National Institute of Ecology. 2017. Diagnostic assessment of damaged ecosystem and restoration areas and practice of resilience. pp. 279-320.
P-26
104

Device for Measuring Dermal Exposure Rate of Flame Retardants via Direct Contact with Products
Mai SHINDO, Kotone TERAO, Kosuke MURAMATSU, Masahiro TOKUMURA, Qi WANG, Yuichi MIYAKE, Takashi AMAGAI, Masakazu MAKINO
University of Shizuoka, Japan
Keywords: Dermal Exposure, Flame Retardants, Risk Assessment, Silicon, Migration
1. Introduction
To reduce the risk of fire, flame retardants are
contained in indoor products at high concentration.
Some of them have toxicity such as
carcinogenicity. Recent study reported that the
dermal exposure could be a significant exposure
route for flame retardants (Hammel et al., 2016).
As conventional methods to estimate a potential
dermal exposure rate, the EpiSkin epidermis
model and human skin obtained from plastic
surgery are used. However, they are expensive
and/or require technological expertise.
In this study, we developed a device, which is
cheaper and easy-to-use, to estimate a potential
dermal exposure rate of flame retardants in indoor
products via direct contact with the products. As a
material of the device, silicone seat was selected.
2. Methods of analysis
A silicone seat (2.5 cm × 2.5 cm, 0.5 cm thick) was
prewashed by the ultrasonication with ethyl
acetate/methanol (1:1, v/v) for 15 min twice and
then dried. As a product which includes flame
retardants, a car seat which concentrations were
preliminary determined was selected. In a
migration experiment, the prewashed device was
put on the product and sampled at predetermined
contact times. The migrated flame retardants in
the device were extracted by the Soxhlet
extraction method. The extract was concentrated
with an evaporator, and it was further concentrated
with nitrogen purge. The analysis was performed
by using liquid chromatography coupled with
tandem mass spectrometry (LC-MS/MS).
3. Results and discussion
We firstly determined the optimum analytical
method for flame retardants in silicone. Although
the cleanup method for the extract was optimized,
the recovery rates of most flame retardants (13 out
of 14) were not in the sufficient range (80%–
120%). In contrast, the recovery rates of most
flame retardants (9 out of 14) without cleanup
were in the sufficient range. Therefore, it was
concluded that no cleanup was suitable to analyse
flame retardants targeted in this study in silicone.
In the migration experiment, the concentrations of
flame retardants in the device increased with the
contact time with the product. The migration rates
of flame retardants from the car seat to the device
were 1.2 (CsDPhP: cresyl diphenyl phosphate),
0.75 (TCEP: tris(2-chloroethyl) phosphate), 0.40
(TCPP: tris(2-chloroisopropyl) phosphate), 0.14
(TPhP: triphenyl phosphate), and 0.11 (TCsP:
tricresyl phosphat) ng cm-2 h-1.
4. Conclusions
The experimental results revealed that the silicone
device developed in this study could be useful to
estimate the potential dermal exposure rate via the
direct contact with products.
References
Hammel et al. (2016) Measuring Personal
Exposure to Organophosphate Flame
Retardants Using Silicone Wristbands
and Hand Wipes, Environ. Sci. Technol.,
No.50, pp.4483-4491.
P-27
105

An influence of Government Trust on Siting Acceptance for NIMBY Facilities
Yeon Ik-Jun1, Jung Ju-Young2, Park Sung-Sik3, Jung Ji-Sun1, Cho Jung-Sik1
1Dept. of Environmental Engineering, Korea National University of Transportation, Korea 2Dept. of Public Management Information System, Korea National University of Transportation, Korea
3Dept. of Flight Operation, Korea National University of Transportation, Korea Keywords: NIMBY, acceptance, incineration, government trust, question investigation
1. Introduction
The ordinary concept of trust includes both being willing to risk of cooperation and being favorable to others with positive expectation for their intention or behaviors (Bae, J.H., 2011). Based on such definition above, the government trust could be defined as being favorable to government’s policy
with a positive expectation or as either attitude or behavior to cooperate the government. This paper has tried to find answers for the major questions as below and to suggest implications to improve policy acceptance of people regarding the selection of location for a garbage incineration plant. Firstly, in which intent the government trust would impact the tendency of the residents to cooperate the government’s policy? Secondly, might the diffent values among the residents result in the different cooperative responses against the government policy?
2. Trust in Government
2.1 Definition of the Concept
Government trust could be explained from various perspectives. Depending on the trust target, it could be divided into either the ruling party or the central government. From the context perspective, it might be explained to trust the capability or morality of the target. From the functional perspective, it might also be explained to trust the role performance of a particular policy of the government. In this paper, however, trust was defined as favorable perception and attitude against the policy based on positive expectation on government’s intention and role.
2.2 Factors on Government Trust
It have impacted the government trust of such major factors as economic, social, political, even procedural performances and etc. In other words, people would trust their government if the economy was stable, the society was peaceful and there was no conflict in politics. But a value and tendency of indificual resident have a significant effect on the government trust. The trust has been affected by traditionalism, materialism and even egalitarianism.
3. Conclusions
It is a critical component to decide to build unpleasant facility in my town how much local residents trust the local government regarding the location of the garbage incineration facility. Government trust is a significant variable of government acceptance. Based on the empirical research for “G” local government in Korea, it was
proven the government trust had a significant impact on government acceptance. The more people perceived the local government has reasonably responded the conflicts during the location process of the incineration facility, the stronger they contended the necessity of building the facility. To sum up, the local government had better prepare strategies to maintain the residents’
trust since the government trust is found out a major factor in deciding government acceptance in the process of locating unpleasant facility.
References
Bae J. H. (2011). The Root of Government Trust in Asia, <Doctoral Thesis in a Graduate School of Korea University>
P-28
106

A Comparative Study of Odor Acceptance between Korea and China
Yeon Ik-Jun1, Jung Ju-Young2, Park Sung-Sik3, Jung Ji-Sun1, Cho Jung-Sik1
1Dept. of Environmental Engineering, Korea National University of Transportation, Korea 2Dept. of Public Management Information System, Korea National University of Transportation, Korea
3Dept. of Flight Operation, Korea National University of Transportation, Korea
Keywords: acceptance, odor, question investigation, industrial complex, odor awarence
1. IntroductionOdor pollution is a special air pollution, which takes air as the spread medium and affects human body through respiratory system. Generally, all smellwhich can stimulate olfactory organ of people, make people feel uncomfortable and damage living environment can be called as odor (Du Na, 2012). Odor in Korean ‘Laws of Prevention and Treatmentof Odorous Substance’ is defined as hydrogen sulfide, thioalcohols, amines and other gases with pungent odor, which stimulate residents’ respiratory system and bring uncomfortable feeling to people insmell, are called as odor. This paper tried tounderstand the difference of people in the twocountries for odor adopting exploring factoranalysis to tell the difference of factors affectingtheir odor acceptance. Based on correctunderstanding of odor problem using solid dataanalysis, this paper could draw conclusions to dealwith a country’s own odor issues and provide themost suitable answers to solve odor problems inthese two countries.2. Difference of Perception
2.1 Understanding of Odor
People have different cognitions and feelings for odor due to different living environment, psychological states, characteristics of social and cultural background, ages, individual health states and other personal situations. There will be differences in the cognitions and feelings of China and Korea for odor. In the aspect of lifestyle, there are certain differences between China and Korea in dining habit. China is with rich diet culture. There are a lot of spices in China, which are commonly used in daily life. But in Korea, the spices are seldom used and it is difficult for the Korean people to accept the spices. The spices will not commonly exist or used in daily life of Korean people. Considering lifestyle, there are great differences between these two countries in the cognition of smell. 2.2 Factors affecting Perception of Odor
The acceptance is often affected by several
factors like personal cultural attainments, spirit shackles, living environment and institutions since it includes the part to understand human’s value system. Instead of a single-tired concept, it is a multi- level one (Jeong, 2008). Various factors can make positive or negative impacts on individual. Jung(2017), who makes research of the social acceptability to odor has put forward an idea the odor issue is necessary to be considered from several aspects and thought with diversified factors. It was said the factors could be divided into such categories as technology, risk, economic acceptance and etc. 3. Conclusions
In this study, the residents living near the industrial park are taken as the respondents. It analyzes the factors that affect odor acceptance of the residents. The samples chosen were both Chinese residents living near Nanjing Industrial Park and Korean residents living near Korean Qingzhou Industrial Park. In this study, the same analysis results were generated through the exploratory factor analysis for the permanent residents near Korea and China's Industrial Parks. However, a slight difference could be found in factors classified. In China, the first one is the ‘Danger awareness’, the second one is the ‘Development’, the third one is ‘Economic loss’, and the last is the ‘Trust’. But in Korea, the first one is the ‘Danger awareness’, the second one is the ‘Development’, the third one is the ‘Trust’ and the last one is the ‘Economic benefit’. References
Du Na, (2012), Study on odor pollution analysis and countermeasures of city industrial park-a case study of Suzhou industrial park. Jeong J. Y., (2008), A study on the reversal phenomenon of policy acceptability: focusing on the policies for the location of the radioactive waste treatment plant, Korea University, Doctoral thesis. Jung, J. S., (2017), A study on the odor characteristics per source category and the odor acceptance by the public
P-29
107
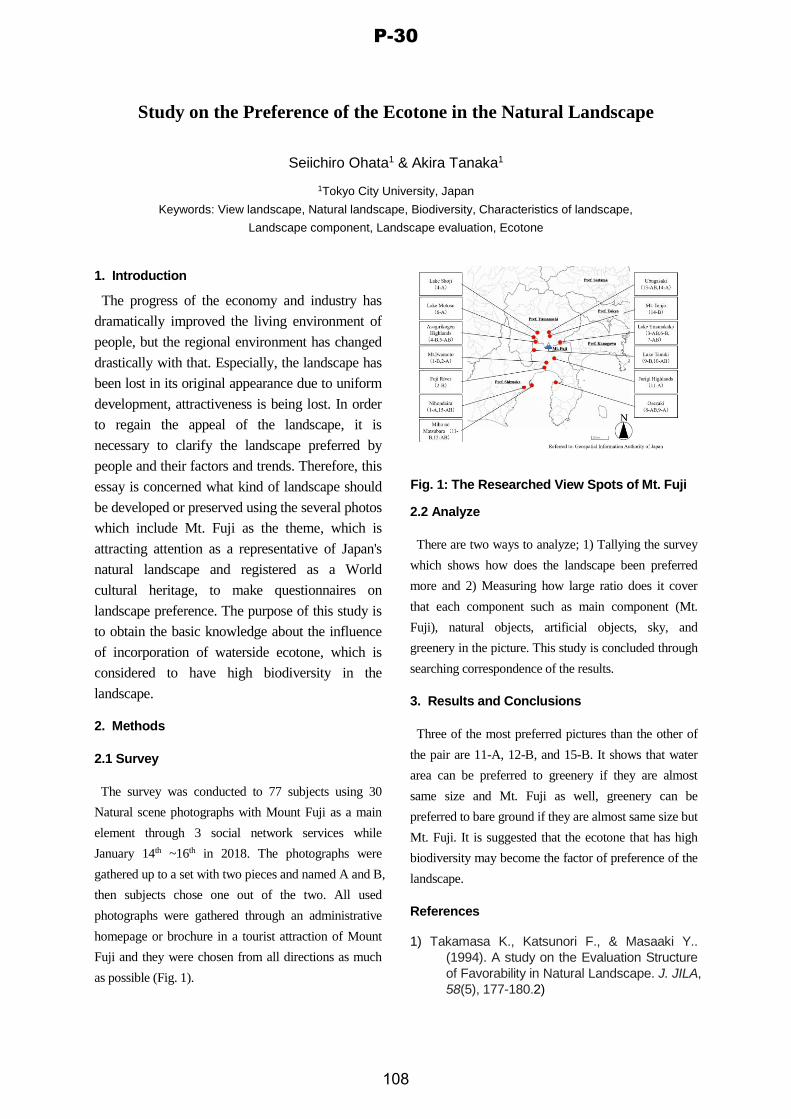
Study on the Preference of the Ecotone in the Natural Landscape
Seiichiro Ohata1 & Akira Tanaka1
1Tokyo City University, Japan Keywords: View landscape, Natural landscape, Biodiversity, Characteristics of landscape,
Landscape component, Landscape evaluation, Ecotone
1. Introduction
The progress of the economy and industry has
dramatically improved the living environment of
people, but the regional environment has changed
drastically with that. Especially, the landscape has
been lost in its original appearance due to uniform
development, attractiveness is being lost. In order
to regain the appeal of the landscape, it is
necessary to clarify the landscape preferred by
people and their factors and trends. Therefore, this
essay is concerned what kind of landscape should
be developed or preserved using the several photos
which include Mt. Fuji as the theme, which is
attracting attention as a representative of Japan's
natural landscape and registered as a World
cultural heritage, to make questionnaires on
landscape preference. The purpose of this study is
to obtain the basic knowledge about the influence
of incorporation of waterside ecotone, which is
considered to have high biodiversity in the
landscape.
2. Methods
2.1 Survey
The survey was conducted to 77 subjects using 30
Natural scene photographs with Mount Fuji as a main
element through 3 social network services while
January 14th ~16th in 2018. The photographs were
gathered up to a set with two pieces and named A and B,
then subjects chose one out of the two. All used
photographs were gathered through an administrative
homepage or brochure in a tourist attraction of Mount
Fuji and they were chosen from all directions as much
as possible (Fig. 1).
2.2 Analyze
There are two ways to analyze; 1) Tallying the survey
which shows how does the landscape been preferred
more and 2) Measuring how large ratio does it cover
that each component such as main component (Mt.
Fuji), natural objects, artificial objects, sky, and
greenery in the picture. This study is concluded through
searching correspondence of the results.
3. Results and Conclusions
Three of the most preferred pictures than the other of
the pair are 11-A, 12-B, and 15-B. It shows that water
area can be preferred to greenery if they are almost
same size and Mt. Fuji as well, greenery can be
preferred to bare ground if they are almost same size but
Mt. Fuji. It is suggested that the ecotone that has high
biodiversity may become the factor of preference of the
landscape.
References
1) Takamasa K., Katsunori F., & Masaaki Y..(1994). A study on the Evaluation Structure of Favorability in Natural Landscape. J. JILA, 58(5), 177-180.2)
Fig. 1: The Researched View Spots of Mt. Fuji
P-30
108

Performance Evaluation of Noise Reduction Devices which installed on the Noise Barrier
Chulhwan Kim and Hyejin Kang
Korea Expressway Corporation Research Institute, Korea Keywords: Road Traffic Noise, Noise Barrier, Noise Reduction Device
1. Introduction
The noise reducing device (NRD) is one ofmeasure for mitigating road or rail traffic noise.NRDs have been commonly used in Korea sincelate 1990’s and various types and shapes of NRDsare developed and suggested. But, it has beeninstalled without considerations of the noisesource’s characteristics. The spectrum of the noisesource may affect to the NRD’s effect. In this study,the effects of NRDs have been estimated for thedifferent noise sources.
2. Evaluation Method
14 samples (A~N) of NRDs are tested its insertion loss at 9 receiving points shown if figure1 and then calibrated by source spectrum shown in Figure2. The effect of NRD is figured out by averaged for the 9 receivers shown in Figure1. Figure2 show the representative noise source spectra of the study. 3 road traffic sources and 3 railroad sources are considered in this study. Figure3 show the noise spectrum of different sources which are shown in Figure2. Each spectrum is measured at the road and railway side and band level are normalized by the level of 1,000Hz.
3. Results
Results of the study are shown in Table 1 for different 14-NRD smaples(A~N), and shows different value for the same NRD because of different source spectrum.
References
C. Kim, et al. (2010) A Study on the Test Methodfor Noise Reduction Devices Installed on the Noise Barriers, Transactions of the Korean Society for Noise and Vibration Engineering, Vol. 20, No. 9, pp. 791-796 Figure 1: NRDs and test facility for evaluation.
Road Traffic Sources
Asphalt Cement Low-noise
Railroad Sources
Conventional KTX Electric
Figure 2: Noise spectra of different sources.
Table 1: Estimated results of 14-NRD samples.
Samples A B C D E F G H I J K L M NAsphalt 1.9 1.7 1.0 1.8 1.9 0.4 1.0 0.8 1.7 1.7 0.7 0.6 1.4 0.6Cement 2.2 2.1 1.1 2.0 2.2 0.7 1.5 1.2 2.0 2.1 1.0 0.9 1.7 0.9
Low-noise 1.4 1.1 0.7 1.5 1.4 -0.1 0.2 0.0 1.2 1.0 0.3 0.1 1.0 0.2Coventional 1.5 1.5 0.8 1.7 1.5 0.3 0.5 0.6 1.6 1.5 0.5 0.5 1.2 0.3
KTX 2.3 3.2 1.2 2.3 2.4 1.7 2.6 2.9 3.1 3.4 1.5 2.1 2.4 1.5Electric 1.3 1.6 0.6 1.5 1.3 0.3 0.2 0.7 1.6 1.5 0.3 0.4 1.3 0.4
P-31
109

Removal of Tar from Biomass Gasification Process
Ju Hoe Kim1,2, Jong Min Oh2,Young Min Jo2, and Sang Bum Kim1
1Korea Institute of Industrial Technology (KITECH), Cheonan 331-825, Republic of Korea 2Department of Applied Environmental Science, Kyunghee University 1732 DuckYoung Street, Ki Heung, Young-
In, Kyenggi-do, Republic of Korea Keywords: Biomass, Gasification, Tar, Oil Scrubber, Removal
1. Introduction
Gasification of biomass is one of promising options to
compensate CO2 generation and an alternative energy
source to fossil fuel [1]. However, a significant air
pollutant, tar is being produced from the process [2].
Thus this work attempted to reduce the tar from the
biomass gasification process by oil scrubbing. A few oils
including water, soybean oil, mineral oil and waste
cooling oil have been applied.
2. Experimental
2.1 Apparatus
The target biogas was generated from a bubble
fluidized reactor, and fed to the settling bed with
impingers as shown in Fig. 1.
Figure 1: Tar removal test layout.
2.2 Method
Removal rate of tar was evaluated according to
scrubbing time; 30, 60 and 90 mins. Sample gases were
taken from the upflow and downflow of the reactor and
analyzed GC-TCD/FID. The impinge reactor contained
100 ml of scrubbing liquid respectively.
3. Conclusions
Residence time, 30 minutes, resulted in the highest in
removal rate of tar from the gas stream for all scrubbing
liquids. The efficiency of each liquid was soybean oil
(97%), waste cooking oil (71%), mineral oil (63%) and
water (31%).
Figure 2: Removal efficiency of scrubbing liquids.
Water does not seem to be appropriate for tar absorption
due to its nonpolar species. On the other hand, the low
efficiency of waste cooking oil may be because
transformation of molecular structure arisen from
oxidation, hydrolysis and /or pyrolysis at high
temperature cookings and reduction of pores by inflow
of pollutants.
References
[1] Myung Won Seo, Jeong Hoi Goo, Sang Done Kim,
See Hoon Lee and Young Chan Choi (2010)
Gasification characteristics of coal/biomass blend
in a dual circulating fluidized bed reactor, Energy
Fuels, 24, 3108-3118
[2] Woo Jin Jo, Soo Hwa Jeong, Sungin Park, YoungTai
Choi and DongHyun Lee (2015) Effects of
Biomass Gasification by Addition of Steam and
Calcined Dolomite in Bubbling Fluidized Bes,
Korean Chem, Eng Res 53, 783-791
P-32
110

P-33
111
Nuclear power plant decommissioning project and public participation
Kyunghee Shin, Jin-gyeong Kwon, and Kongjang Cho
Korea Environment Institute, South Korea Keywords: NPP, Decommissioning, EIA, Public Participation
1. Introduction
A large number of nuclear power plants (NPP) willbe decommissioned and Korea also decideddecommissioning of ‘Kori Unit 1 nuclear powerplant’ in June 2017. Decommissioning of NPPcould emerge the various concerns that relatedmainly to associate impacts such as communitywell-being, waste disposal and public health. Thus,the decommissioning project could becontroversial and transparent and interactivecommunication processes are required. Theresearch aims to examine how public participationwas undertaken and a case study approach wasintroduced.
2. Methodology
For each of the case studies, information was gathered including documentation review (including Environmental Impact Statements), experience reports and so on. When participation was carried out, the range of stakeholders, access of information and related issues were investigated.
3. Results
Canadian Nuclear Laboratories (CNL) is performing the decommissioning of the Whiteshell Laboratories (WL) nuclear research facility and Comprehensive Study Report (CSR) under the Canadian Environmental Assessment Act was completed for the decommissioning project. As part of the environmental assessment process for the project, CNL conducted aboriginal engagement activities to inform communities and to communicate the potential effects of these activities to the environment, and to members of the community. Also CNL operates a Public
Information Program to inform groups about ongoing activities at sites and the potential effects of these activities on the public. Engagement methods included presentations to various stakeholders, publishing and updating project-specific webpage content, and conducting site visits etc. The Maine Yankee nuclear power plant closed prematurely in 1997 and when the plant closed, the Maine Yankee Community Advisory Panel on Decommissioning (CAP) was established. The Maine Yankee represented the purpose of CAP was to enhance open communication, public involvement and education on Maine Yankee decommissioning issues. Maine Yankee was not obligated to accept or conform to the advice or recommendations made by the CAP. Then, Maine Yankee, in cases of disagreement, provided the CAP with an appropriate rationale for the disagreement. The case study provided the value of public participation and the information collected pointed that the importance of early participation, providing sufficient information and on-going communication with all stakeholders.
References
Catherine W. Ferdinand Black Diamond Consultants, Inc.(2005) The Maine Yankee Decommissioning Advisory Panel A Model for Public Participation in Nuclear Projects
Canadian Nuclear Laboratories, White shell Laboratories (2017), Environmental Impact Statement for the In Situ Decommissioning of WR-1 at the Whiteshell Laboratories, Executive Summary, Revision 1
P-34
112

AIC2018 in Shizuoka “Green Region and Impact Assessment”
❖List of Participants
113

114

List of Participants Name Organization Nationality Notes
AHMED, Safa MALDIVES ENVIRONMENTAL PROTECTION AGENCY
Maldives
AINOTA, Koji Tokyo City University Japan Presentation(A-2-3) Co-chairperson(A-3)
AKAHOSHI, Kaoru Institute for Global Environmental Strategies
Japan Presentation(A-3-3)
ARAI, Seiji Japan Association of Environment Assessment
Japan Theme Forum(A-0-5)
AUNG, Thiri Shwesin Peking University, China Myanmar
BAE, In-chul Korea Expressway Corporation Korea Poster(P-1)
CASCANTE, Madelyn Freelance EIA Consultant Philippines
CHEN, Jiaxuan Beijing Normal University,School of environment
China Presentation(B-5-4)
CHENG, Hongguang Beijing Normal University China Poster(P-21)
CHIARAWATCHAI, Nathasith
PTT Public Company Limited Thailand Presentation(A-5-1)
CHO, Hanna Korea Environment Institutue Korea Poster(P-5)
CHO, Kongjang Korea Environment Institute Korea Poster(P-4)
CHO, Namwook Korea Environment Institute Korea Presentation(A-4-3)
CHO, Youngho National Institute of Ecology Korea
CHOI, Min Uk Korea Environment Institute Korea
CHOI, Sang Ki Korea Environment Institute Korea
CHU, Yunsoo National Institue of Ecology Korea Poster(P-8)
ERMUKDAKUL, Thanakorn
PTT Public Company Limited Thailand
FAHMY, Farhana Maldives Environmental Protection Agency
Maldives
GENJIDA, Naoko Institute for Global Environmental Strategies (IGES)
Japan Co-chairperson(A-1)
GOTO, Keisuke Tokyo City University Japan Presentation(B-2-2) HADIKUSUMAH, Herri Center for
Environmental and Sustainability Science
Indonesia Poster(P-10)
HAM, Young-Sik Tokyo City University Korea Poster(P-15)
115

HAN, Hyoung-Sum Korea Environment Corporation Korea Poster(P-33)
HARASHINA, Sachihiko
Chiba University of Commerce Japan Presentation(B-3-3)
Co-chairperson(B-5) HAYASHI, Kiichiro Nagoya University Japan Presentation(A-2-4)
Co-chairperson(B-1) HORI, Ayumi Toho University Japan HUANG, Rui Beijing Normal
University China Presentation(A-3-5)
HWANG, Sang-il Korea Environment Institute Korea Poster(P-19)
INOUE, Naomi Graduate School of Global Environmental Studies, Sophia University
Japan
ITO, Natsuki Toho University Japan JEON, Sookjin, Korean Society of EIA Korea Poster(P-2) JI, Kaiwen Tokyo Institute of
Technology China Presentation(B-3-2)
JOO, Hyun Soo Korea Environment Institute Korea
JUNG, Jong-Gwan Chungnam Institute Korea Presentation(B-2-1) Co-chairperson(B-4)
KAKU, Tomoko ERM Japan. Ltd. Japan Presentation(A-4-4) KAMIJO, Tetsuya Japan International
Coopertion Agency(JICA) Research Institute
Japan Presentation(A-4-2)
KANAI, Mizuki Tokyo City University Japan Presentation(A-4-5) KANG, Hyejin Korea Expressway
Corporation Research Institute
Korea Poster(P-11)
KASAGI, Hiroo NPO Workshop for Sustainable Community
Japan Co-chairperson(B-3)
KAWAMURA, Takafumi Tokyo City University Japan Presentation(A-1-3) KIM, Chulhwan Korea Expressway
Corporation Research Institute
Korea Poster(P-31)
KIM, Myeong-je Korea University Korea Presentation(A-2-2) KIM, Myungjin Korean Society of EIA Korea Co-chairperson(B-1) KIM, Sang Bum KOREA INSTITUTE
OF INDUSTRIAL TECHNOLOGY
Korea Poster(P-32)
KIM, Suhyang Sunil E&C Korea Poster(P-9) KIM, Sung-Jin Chungbuk university Korea Poster(P-18) KIM, Tae Kyung Kyung hee University Korea Poster(P-20) KIM, Yang-Ho Korea Environment
Corporation Korea
KOBAYASHI, Masanori University of Tokyo Japan KOJIMA, Neiri Toho University Japan KUMAGAI, Yoichi University of Waterloo Japan Presentation(A-1-1)
Co-chairperson(A-5) KURASAKA, Hidefumi Chiba University Japan Theme Forum(A-0-3)
Co-chairperson(A-2)
116

KWON, Yong-Su National Institute of Ecology Korea
LEE, Chunwon DONGSUNG ENGINEERING CO., LTD
Korea
LEE, Eun-ju Chungbuk National University Korea Poster(P-23)
LEE, Hyeoncheol Korea Environment Institute Korea
LEE, Jong Ho Cheongju University Korea Presentation(B-4-3) Co-chairperson(B-5)
LEE, Sang-Don Ewha Womans University Korea Theme Forum(A-0-4)
Co-chairperson(A-2) LEE, Seon Mi National Institute of
Ecolgy Korea Poster(P-26)
LEE, Shirley Retiree from Environmental Protection Department
China Presentation(A-1-2) Co-chairperson(A-0)
LEE, Youngsoo Korea Environment Institute Korea
Presentation(B-5-2) Poster(P-12) Co-chairperson(B-3)
LI, Wei Beijing Normal Universisty China Theme Forum(A-0-6)
Co-chairperson(A-1) LIU, Jing Beijing Normal
Universisty China Presentation(B-4-1)
LIU, Renzhi Beijing Normal University China Co-chairperson(A-4)
LU, Jianhong Beijing Normal University China Presentation(A-3-4)
LUAN, Chaoxu Beijing Normal University China Poster(P-17)
MEGANTARA, Erri Center for Environmental and Sustainability Science
Indonesia Poster(P-10)
MIYAZAKI, Jumpei University of Shizuoka Japan Poster(P-24)
MURAI, Shintaro Ministry of the Environment, Japan Japan Theme Forum(A-0-2)
MURAMATSU, Kosuke University of Shizuoka Japan Presentation(B-5-1)
MURAYAMA, Takehiko Tokyo Institute of Technology Japan Presentation(A-3-1)
Co-chairperson(A-4) NAGASHIMA, Takumi Tokyo institute of
tecnology Japan Presentation(B-3-1)
NAITOU, Hirotaka University of Shizuoka Japan Presentation(B-5-3)
NAKAMURA, Kentaro Center for Environmental Law, MEIJI University
Japan Presentation(B-2-4)
NATSUKAWA, Haruki Graduate School of Environment and Information Sciences, Yokohama National University
Japan Poster(P-3)
117

NIWA, Takahito EX Research Institute Ltd. Japan Theme Forum(A-0-7)
OH, Jong Min Kyung hee University Korea OHATA, Seiichiro Tokyo City University Japan Poster(P-30) OKADA, Yuki JBIC (Japan Bank for
International Cooperation)
Japan
OKAWA, Kio Yachiyo Engineering Co., Ltd. Japan
OTSUKA, Jun Nihon University Graduate School Japan Presentation(B-3-5)
PARK, Daeyeon Chungbuk National University Korea Poster(P-6)
PARK, Hyungseok Chungbuk National University Korea Presentation(B-3-4)
Poster(P-16) PARK, Su-Gon National Institute of
Ecolgy Korea Poster(P-22)
PARK, Sun Hwan SUNIL E&C Korea PARK, Yoon-a kyung hee university Korea Poster(P-13) SAKAGUCHI, Manabu ERM Japan Ltd. Japan SAKUMOTO, Naoyuki Japan External Trade
Organization Japan Presentation(A-3-2) Co-chairperson(B-4)
SETIANINGSIH SAGIMAN, Dwi
Independent Consultant Indonesia
SHIBATA, Yuki Toho University Japan Poster(P-7) Co-chairperson(A-5)
SHIMIZU, Takumi Keio University Japan Poster(P-14) SHIMOMURA, Nobuko Almec Corporation Japan SHIN, Kyunghee Korea Environment
Institute Korea Poster(P-34)
SHINDO, Mai University of Shizuoka Japan Poster(P-27)
SHIROTA, Yuki Tokyo City University Japan Presentation(A-4-1) SUNG, Sunyong National Institute of
Ecology Korea
SUWANTEEP, Kultip Japan International Coopertion Agency(JICA)
Korea Presentation(B-1-1)
SUZUKI, Yohei ERM Japan Ltd Japan TAKEDA, Shingo Japan International
Coopertion Agency(JICA)
Japan Presentation(A-5-2)
TANAKA, Akira Tokyo City University Japan Theme Forum(A-0-1) Co-chairperson(A-0)
TANAKA, Mitsuru Hosei University Japan Presentation(B-4-5) Co-chairperson(A-3)
TEERAPATSAKUL, Artit
PTT PUBLIC COMPANY LIMITED Thailand
TOKUMURA, Masahiro University of Shizuoka Japan Presentation(B-4-2)
TIAN, Kai Beijing Normal University, China China Presentation(A-1-4)
TIKA RAM, Pokharel Tokyo City University Japan TYAS, Rahayu Global Water Partner
ship- SEA Region Indonesia
118

URAGO, Akiko Raven Ltd. Japan Presentation(A-5-3) Co-chairperson(B-2)
VERMUDO, Judy Asian Development Bank Philippines
WANG, Mudan Beijing Normal University China Presentation(A-5-4)
WANG, Qi University of Shizuoka China Presentation(B-4-4)
WASHIO, Tomoki Nihon University Graduate School Japan Presentation(A-2-1)
YAMADA, Kazuyoshi Museum of Natural and Environmental history, Shizuoka
Japan Opening plenary
YASUMOTO, Ayaka Tokyo Institute of Technology, School of Environment and Society
Japan Presentation(B-1-2)
YEE, Hyun-Shik Korea Environment Corporation Korea
YEON, Ik Jun Korea National University of Transportation
Korea Poster(P-28) Poster(P-29)
YOON, Yeo Jeong Chungbuk National University Korea Poster(P-25)
YU, Xianglan Zhejiang Gongshang University of Professor/KSEIA
China Presentation(B-1-3)
ZHANG, Qihui Beijing Normal University China Presentation(B-2-3)
ZHAO, Yanwei Beijing Normal University China Co-chairperson(B-2)
ZHOU, Siyang Beijing Normal University China Presentation(B-1-4)
119

120

AIC2018 in Shizuoka “Green Region and Impact Assessment”
❖Sponsors
121

122

―Sponsors―
Shizuoka Prefecture Environmental Assessment Association
http://www.habi.ne.jp/sea/ 13-12 Seikan-cho, Aoi-ku, Shizuoka-shi, Shizuoka 420-0047, Japan
Founded in 1986, SEA is a consortium of six environmental research companies. The association takes the leading role in supporting the development of the industry in Shizuoka,e.g., by providing professional seminars and liaising with public sectors.
Environmental Assessment Center Co. Ltd EAC is a leading environmental research company,
proud of its localized and customized solutions to the region. Our top priority is sustainability, with long term horizon.
13-12 Seikan-cho, Aoi-ku, Shizuoka-shi, Shizuoka 420-0047, Japanhttp://www.eac-net.co.jp/
123

Environmental liability assessments in Japan can be a tough task for foreign players, with a frustrating scarcity of straight answers – to the point where clients tell us, “Japan is like stepping through the Looking Glass."
At EAI, we cut through all that. Across Japan, we have the technical expertise, experience and on-the-ground knowledge required to get the clarity you need: accurately assessing environmental risks and pinpointing their regulatory ramifications. We deliver definitive answers in plain terms your stakeholders can understand.
EAI Co., Ltd. Hulic Jimbocho Building, 3F 2-2-31 Kanda Jimbocho, Chiyoda-kuTokyo, 101-0051 JapanPhone: +81.3.3263.6051email: [email protected]
124
Environmental Assessment
Center Co. Ltd. http://www.eac-net.co.jp/
Fujiyama Co., Ltd.
http://www.con-fujiyama.com/
Science Co., Ltd.
http://www.science-c.co.jp/
SHIZUOKA CONSULTANT CO., LTD. http://www.shizuoka-con.co.jp
Industrial Environment Reseach Center
http://www.sankan.or.jp
Tohnichi Co., Ltd
http://www.tohnichi-net.co.jp/
125

Executive Committee: Akira TANAKA (Chairperson), Tokyo City University, Japan Koji AINOTA, Tokyo City University, Japan Takafumi KAWAMURA, Tokyo City University, Japan Mizuki KANAI, Tokyo City University, Japan Saki ISHINO, Tokyo City University, Japan Seiichiro OHATA, Tokyo City University, Japan Seiya OKITA, Tokyo City University, Japan Yuki SHIROTA, Tokyo City University, Japan
Yuki SHIBATA, Toho University, Japan Ayumi HORI, Toho University, Japan Natsuki ITO, Toho University, Japan
Managing Committee Chairperson: Yuichi MIYAKE, University of Shizuoka, Japan Masahiro TOKUMURA, University of Shizuoka, Japan Hirotaka NAITO; University of Shizuoka, Japan
Japan Society for Impact Assessment
City of Shizuoka, Japan
126

The 12th Asia Impact assessment Conference in Shizuoka AIC2018
“Green Region and Impact Assessment” August 20 – 22, 2018
Publication:
Japan Society for Impact Assessment
International Exchange Committee
Chairperson, Akira TANAKA
http://jsia.net/3_activity/koryu/English/index.html
Address:
Tokyo City University Ushikubo-nishi 3-3-1, Tsuzuki-ku, YOKOHAMA 224-8551 Japan
http://www.yc.tcu.ac.jp/~tanaka-semi/en/index.html

Japan Society for Impact Assessment http://jsia.net/3_activity/koryu/English/index.html