jqlnqlk7 qdh/ - international journal of lean thinkingthinkinglean.com/img/files/paper_2(3).pdf ·...
TRANSCRIPT
International Journal of Lean Thinking Volume 3, Issue 1 (June 2012)
Lean Thinkingjournal homepage: www.thinkinglean.com/ijlt
Lean Manufacturing: a study of application in a customary atmosphere
D. Rajenthirakumar * Department of Mechanical Engineering, PSG College of Technology, Peelamedu Coimbatore – 641 004, Tamil Nadu, India E-mail: [email protected]
R. Sridhar PSG College of Technology, Coimbatore, India E-mail: [email protected]
A.Dominic Savio PSG College of Technology, Coimbatore , India
A B S T R A C T K E Y W O R D S
A R T I C L E I N F O
Lean manufacturing, Value stream mapping (VSM), Inventory, Line balancing
Received 12 July 2011 Accepted 04 October 2011 Available online 01 December 2011
Lean Manufacturing is a technique originally developed in the automotive industry that concentrates on shortening the time between the customer’s order and shipment. Lean manufacturing has been applied very successfully in manufacturing operations, resulting in shorter production lead times, greatly reduced inventories, and significantly enhanced profitability. These techniques also promote improved flexibility, enhanced reliability and substantial cost reductions [1-4].
This work addresses the implementation of lean philosophy in a textile machinery manufacturer, with a focus on elimination of process bottle necks and optimizing the process layout. Value stream mapping was the main tool used to identify the opportunities for various lean techniques. The primary motive is to evolve and test several strategies in the elimination of bottle necks on the shop floor by the incorporation of a layout modification and a versatile automation strategy. Simulation models are built for the inherent processes and the denouements of such changes modeled and analyzed. The effects of lean and the value addition by automation are clearly demonstrated by the simulation. A noticeable reduction in lead time and work-in-process inventory level is achieved.
________________________________ * Corresponding Author
1. Introduction and literature survey
Waste elimination is one of the most effective ways to increase the profitability of any
business. Processes either add value or waste during the production of a goods or service.
Waste and its elimination form the core of the Toyota Production System [5], also known as
lean manufacturing. Lean typically targets the seven so-called deadly wastes, which are: (i)
overproduction (ii) unnecessary inventory (iii) excess motion (iv) waiting (v) transportation (vi)
inappropriate processing (vii) non-right the first time, defects. Applications of lean
S. Jerine Chrispal Prakash PSG College of Technology, Coimbatore , India
N. Srinath PSG College of Technology, Coimbatore , India
RAJENTİRAKUMAR, SRIDHAR, SAVIO, PRAKASH, SRINATH / International Journal of Lean Thinking Volume 3, Issue 1(June2012)
21
manufacturing have spanned many sectors including automotive, electronics, white goods, and consumer
products manufacturing [6].
To eliminate waste, it is important to understand exactly what waste is and where it occurs. While
products differ significantly between factories, the typical wastes found in manufacturing environments
are quite similar. For each kind of waste, there is a strategy to reduce or eliminate its effect on a company,
thereby improving overall performance and quality. Discrete Event Simulation is one tool for
identification of production waste and VSM and other process modeling methods are also used in lean
manufacturing system development and analysis [7].
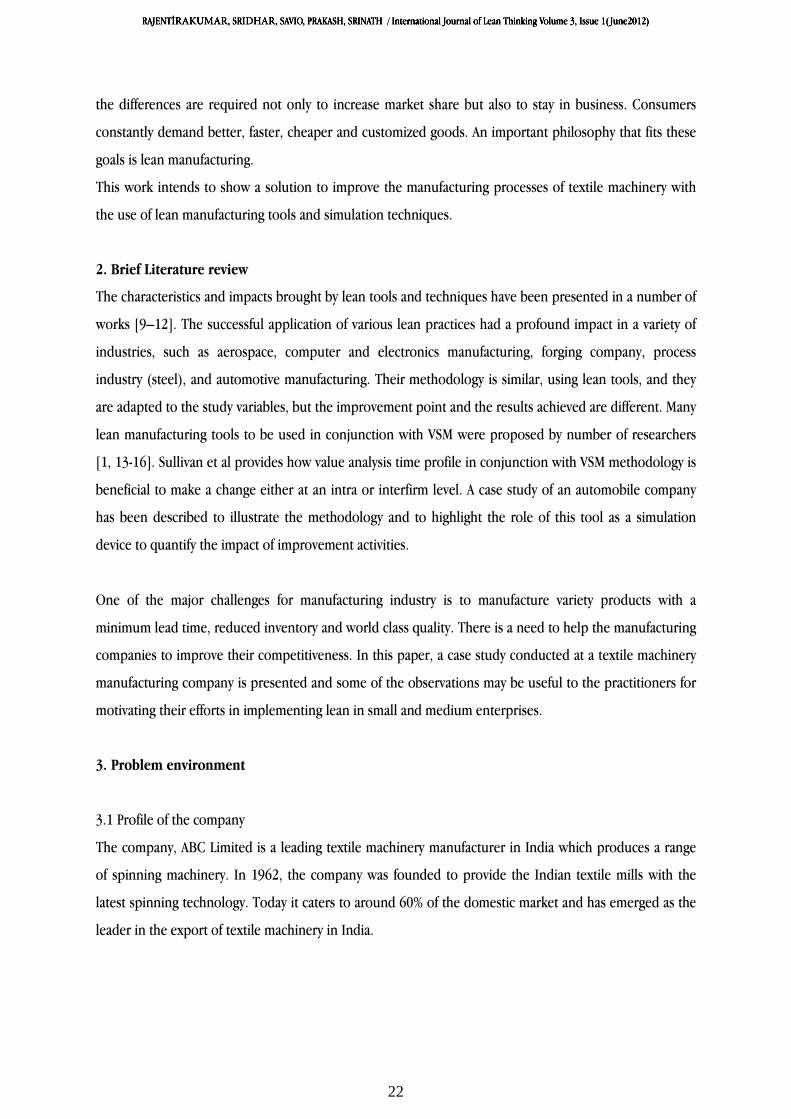
The textile machinery manufacturing is one of the largest capital goods segments in India. While there
are a few firms close to the international frontier in terms of product, design, capability and process
technology, the technical capabilities of several other players are limited. The capital goods industry
contributes 9 to 12 % of the total value added in manufacturing and hence the growth of this sector has a
close co-relation with industrial development. Of the Gross Domestic Investment, the capital goods
industry accounts for a share of 17 to 21%. This sector has lately demonstrated high versatility and with
the improvement in the overall economic scenario, this sector has shown a growth rate of over 12% in
2004-2005 and the momentum is continuing (Fig. 1) [8].
Fig. 1 Indian textile machinery demand trend
In order to compete with their global counterparts, the textile machinery manufacturer must prepare for a
new business world where variety and customization of products become the norm. They need to
increase their market share and differentiate from their competitors. Moreover, due to the market crisis
DEMAND FOR TEXTILE MACHINERY
44 43
3430
27 29
0500
10001500200025003000350040004500
1999-00 2000-01 2001-02 2002-03 2003-04 2004-05(E)(YEARS)
(VA
LUE
IN R
S. C
RO
RE
)
10
20
30
40
50
PRODUCTION (Minus Exports)IMPORTS (less parts imported by machinery manufacturers)TOTAL DOMESTIC DEMAND% Share of demand met by indigenous industry
Source : Directorate General of Commercial Intelligence & Statistics, Government of India
RAJENTİRAKUMAR, SRIDHAR, SAVIO, PRAKASH, SRINATH / International Journal of Lean Thinking Volume 3, Issue 1(June2012)
22
the differences are required not only to increase market share but also to stay in business. Consumers
constantly demand better, faster, cheaper and customized goods. An important philosophy that fits these
goals is lean manufacturing.
This work intends to show a solution to improve the manufacturing processes of textile machinery with
the use of lean manufacturing tools and simulation techniques.
2. Brief Literature review
The characteristics and impacts brought by lean tools and techniques have been presented in a number of
works [9–12]. The successful application of various lean practices had a profound impact in a variety of
industries, such as aerospace, computer and electronics manufacturing, forging company, process
industry (steel), and automotive manufacturing. Their methodology is similar, using lean tools, and they
are adapted to the study variables, but the improvement point and the results achieved are different. Many
lean manufacturing tools to be used in conjunction with VSM were proposed by number of researchers
[1, 13-16]. Sullivan et al provides how value analysis time profile in conjunction with VSM methodology is
beneficial to make a change either at an intra or interfirm level. A case study of an automobile company
has been described to illustrate the methodology and to highlight the role of this tool as a simulation
device to quantify the impact of improvement activities.
One of the major challenges for manufacturing industry is to manufacture variety products with a
minimum lead time, reduced inventory and world class quality. There is a need to help the manufacturing
companies to improve their competitiveness. In this paper, a case study conducted at a textile machinery
manufacturing company is presented and some of the observations may be useful to the practitioners for
motivating their efforts in implementing lean in small and medium enterprises.
3. Problem environment
3.1 Profile of the company
The company, ABC Limited is a leading textile machinery manufacturer in India which produces a range
of spinning machinery. In 1962, the company was founded to provide the Indian textile mills with the
latest spinning technology. Today it caters to around 60% of the domestic market and has emerged as the
leader in the export of textile machinery in India.

RAJENTİRAKUMAR, SRIDHAR, SAVIO, PRAKASH, SRINATH / International Journal of Lean Thinking Volume 3, Issue 1(June2012)
23
3.2 Product description
The name of the product selected in this work is “pressure finger” which is an integral part of a
component by name “flyer” (Fig. 2). The component is used in textile industries to produce very fine
threads. It is used to guide the thread coming out of the flyer-tube to the bobbin that is attached to the
spindle. Accurate guiding of the thread is governed by certain parameters, out of which, the radius of the
pressure finger (EN 8 steel and 300 grams weight) is the most critical. Fig. 3 shows the major operations
involved in the manufacturing of pressure finger. Cycle time for various operations are summarised in
Table 1.
Fig. 2 Three dimensional model of the “flyer” with “pressure finger”
Fig. 3 Major operations involved
RAJENTİRAKUMAR, SRIDHAR, SAVIO, PRAKASH, SRINATH / International Journal of Lean Thinking Volume 3, Issue 1(June2012)
24
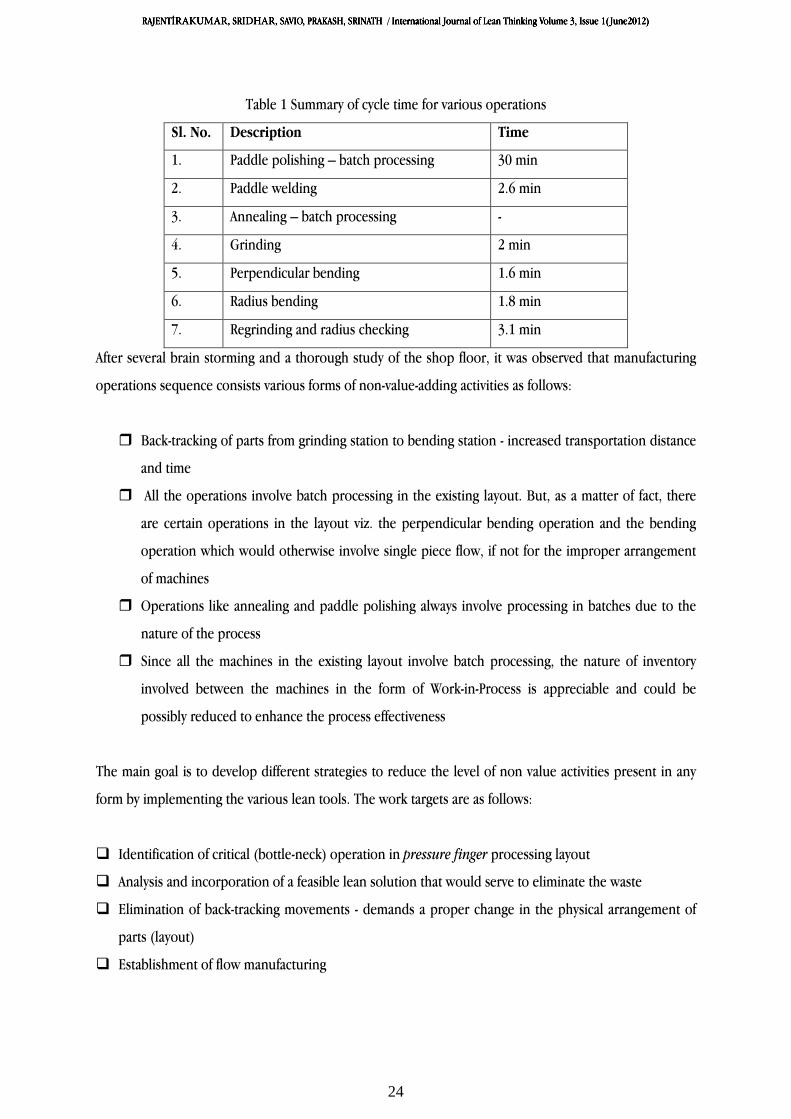
Table 1 Summary of cycle time for various operations
Sl. No. Description Time
1. Paddle polishing – batch processing 30 min
2. Paddle welding 2.6 min
3. Annealing – batch processing -
4. Grinding 2 min
5. Perpendicular bending 1.6 min
6. Radius bending 1.8 min
7. Regrinding and radius checking 3.1 min
After several brain storming and a thorough study of the shop floor, it was observed that manufacturing
operations sequence consists various forms of non-value-adding activities as follows:
Back-tracking of parts from grinding station to bending station - increased transportation distance
and time
All the operations involve batch processing in the existing layout. But, as a matter of fact, there
are certain operations in the layout viz. the perpendicular bending operation and the bending
operation which would otherwise involve single piece flow, if not for the improper arrangement
of machines
Operations like annealing and paddle polishing always involve processing in batches due to the
nature of the process
Since all the machines in the existing layout involve batch processing, the nature of inventory
involved between the machines in the form of Work-in-Process is appreciable and could be
possibly reduced to enhance the process effectiveness
The main goal is to develop different strategies to reduce the level of non value activities present in any
form by implementing the various lean tools. The work targets are as follows:
Identification of critical (bottle-neck) operation in pressure finger processing layout
Analysis and incorporation of a feasible lean solution that would serve to eliminate the waste
Elimination of back-tracking movements - demands a proper change in the physical arrangement of
parts (layout)
Establishment of flow manufacturing

RAJENTİRAKUMAR, SRIDHAR, SAVIO, PRAKASH, SRINATH / International Journal of Lean Thinking Volume 3, Issue 1(June2012)
25
4. Implementation and results
4.1 Continuous flow
As a first step to establish continuous flow, VSM is done. The current state map presents the existing
position of the company. The critical problem areas and different kinds of non-value added activities are
identified in this stage. The next step is development of future state map. In order to develop the future
state map, the current state map was analysed using the steps and guidelines developed by Rother and
Shook [18]. The last step is analysis of the results obtained after implementing the proposed changes.
This has to be quantified in terms of lead time reduction, cycle time reduction, inventory reduction, etc.
All the data for current state map are collected according to the approach recommended by Rother and
Shook [18]. The data boxes are prepared to capture the changeover time, available time and cycle time.
The information flow is also captured. The production lead time and value-added time are noted on the
current state map. It provides the snapshot in time. Inventory storage points in between the stages are
shown in triangles. The timeline at the bottom of the current state map has two components. The first
component is the production lead time and second component is value-added time or processing time.
Value-added time is calculated by adding the processing time for each process in the value stream. The
cycle time for each is the average cycle time, which is determined by using actual data from the company.
This current state map provides a picture of existing positions and guide about the gap areas. It helps to
visualise how things would work when some improvements are incorporated. The gap area in the existing
state results in a road map for improvement. Fig. 4 shows the current state map.

RAJENTİRAKUMAR, SRIDHAR, SAVIO, PRAKASH, SRINATH / International Journal of Lean Thinking Volume 3, Issue 1(June2012)
26
Fig. 4 Current state map
RAJENTİRAKUMAR, SRIDHAR, SAVIO, PRAKASH, SRINATH / International Journal of Lean Thinking Volume 3, Issue 1(June2012)
27
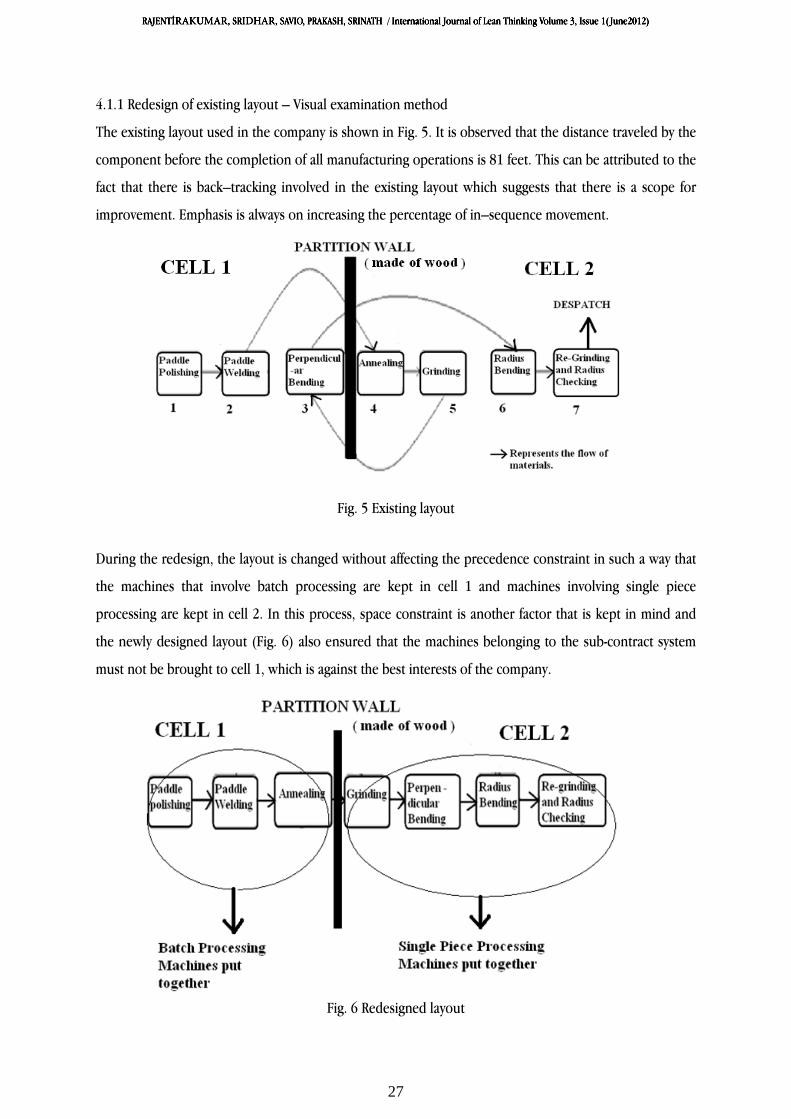
4.1.1 Redesign of existing layout – Visual examination method
The existing layout used in the company is shown in Fig. 5. It is observed that the distance traveled by the
component before the completion of all manufacturing operations is 81 feet. This can be attributed to the
fact that there is back–tracking involved in the existing layout which suggests that there is a scope for
improvement. Emphasis is always on increasing the percentage of in–sequence movement.
Fig. 5 Existing layout
During the redesign, the layout is changed without affecting the precedence constraint in such a way that
the machines that involve batch processing are kept in cell 1 and machines involving single piece
processing are kept in cell 2. In this process, space constraint is another factor that is kept in mind and
the newly designed layout (Fig. 6) also ensured that the machines belonging to the sub-contract system
must not be brought to cell 1, which is against the best interests of the company.
Fig. 6 Redesigned layout

RAJENTİRAKUMAR, SRIDHAR, SAVIO, PRAKASH, SRINATH / International Journal of Lean Thinking Volume 3, Issue 1(June2012)
28
4.1.2 Work-space utilisation
Work-space is an imaginary area occupied by a machine wherein the distance between successive
machines is always greater than four feet [20]. The term work-space includes the space occupied by every
machine plus some of the free space on either side of a machine (Table 2). The redesigned layout
requires annealing to be included in cell 1 in place of perpendicular bending and the latter should be
shifted to cell 2. Further, from Table 2, it is observed that both the cells occupy the same area and that;
cell 2 has lesser free space than cell 1. Hence, there is some scope for improvement which leads to a
corresponding increase in free space in cell 2.
Table 2 Summary of work-space utilisation
MACHINE WORK SPACE Cell 1 Paddle polishing machine 4x4 feet Paddle welding machine 10x5 feet Perpendicular bending 8x6 feet Total area of cell 1 40x20 feet
Free space in cell 1 15 feet (measured from perpendicular bending machine to partition wall)
Cell 2 Annealing 11x7 feet Grinding machine 6x4 feet Bending (bending to required shape) machine 8x6 feet
Regrinding and radius checking 12x6 Total area of cell 2 40x20
Free space in cell 2 less than 10 feet ( measured from radius checking machine till the end of cell 2)
Observations led to a conclusion that both annealing and perpendicular bending occupied approximately
the same space and it is viable that the former can be replaced by the latter considering the fact that there
is 15 feet of free space after accommodating the perpendicular bending machine. But in the re-designed
Layout, this free space would decrease to 12 feet which is still within the acceptable limits. Fig. 7 shows
the work space of machines in the re-designed layout and a conspicuous increase in free space in cell 2
with a corresponding decrease in free space in cell 1. Also, with annealing now being shifted to cell 1, it
provides considerable leeway which is a pre-requisite, given the nature of the process.

RAJENTİRAKUMAR, SRIDHAR, SAVIO, PRAKASH, SRINATH / International Journal of Lean Thinking Volume 3, Issue 1(June2012)
29
Fig. 7 Work space of machines in the re-designed layout
4.1.3 Line balancing
Line balancing is a strategy used in the allocation of resources and work schedules to the workers
involved, thereby minimizing discrepancies arising from unequal service times and idle times [19]. In this
work, the Ranked Positional Weight (RPW) method [19] is used for line balancing and the methodology
followed is shown Fig. 8. The results of line balancing are given in Table 3 and Fig. 9. From the line
balancing results, it is evident that at station “D” for operation “5” the cycle time is 3.1 min which exceeds
the takt time by 0.12 min. This implies that the operation “5” in station “D” is a “critical operation” and
steps should be taken to minimize this discrepancy. Further, the results of line balancing, which are done
on this redesigned layout, yielded a result which could possibly bolster the new redesign i.e. grouping of
machines involving batch processing together in cell 1 and machines involving single piece processing in
cell 2.
Fig. 8 RPW method for line balancing
Draw PERT diagram considering the precedence constraints
Compute RPW time (time from start to finish)
Arrange operations in decreasing orders of RPW time and rank
Compute “takt time” and fix it as constraint for grouping (takt time=total working time/demand)
Assign work element to station / Higher RPW time given preference / Continue until “takt time” is violated

RAJENTİRAKUMAR, SRIDHAR, SAVIO, PRAKASH, SRINATH / International Journal of Lean Thinking Volume 3, Issue 1(June2012)
30
Table 3 Results of RPW method – Assignments of operations to stations
Station Manufacturing operation Total station time (min)
A 1 2.6
B 2 2.0
C 3 1.6
D 4 1.8
E 5 3.1
Fig. 9 Line balancing result - Identification of critical operation
The critical operation can be eliminated by adopting either of the following two methods: (i) By
increasing the number of operators in station “D” (ii) By the adoption of suitable automation strategies to
minimize the cycle time in station “D”.
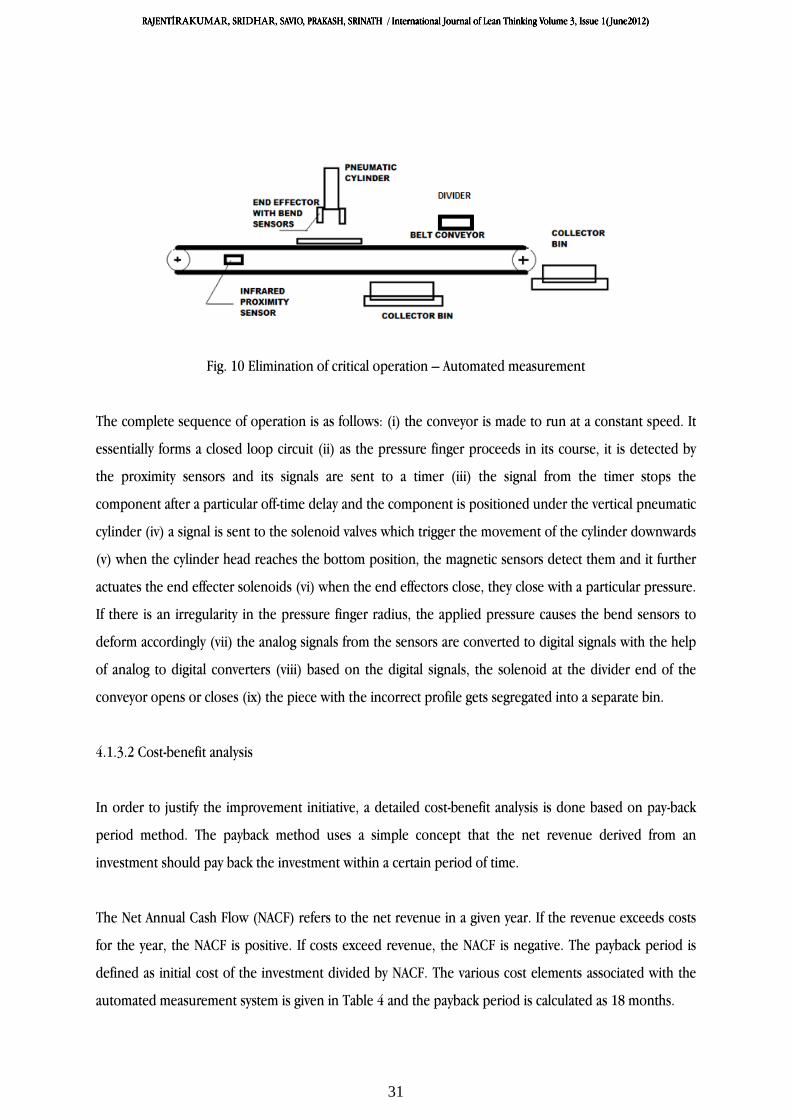
4.1.3.1 Automated measurement system
The critical operation, checking and regrinding pressure finger is eliminated by the implementation of
automated measurement system (Fig. 10). The idea of the automation system is to segregate the pressure
fingers with the correct radius from the incorrect ones. The radius of the pressure finger forms the critical
dimension and it requires checking cum hammering for the correction of radius. The automation system
enables to hasten the process and increases the flow rate of the component.
RAJENTİRAKUMAR, SRIDHAR, SAVIO, PRAKASH, SRINATH / International Journal of Lean Thinking Volume 3, Issue 1(June2012)
31
Fig. 10 Elimination of critical operation – Automated measurement
The complete sequence of operation is as follows: (i) the conveyor is made to run at a constant speed. It
essentially forms a closed loop circuit (ii) as the pressure finger proceeds in its course, it is detected by
the proximity sensors and its signals are sent to a timer (iii) the signal from the timer stops the
component after a particular off-time delay and the component is positioned under the vertical pneumatic
cylinder (iv) a signal is sent to the solenoid valves which trigger the movement of the cylinder downwards
(v) when the cylinder head reaches the bottom position, the magnetic sensors detect them and it further
actuates the end effecter solenoids (vi) when the end effectors close, they close with a particular pressure.
If there is an irregularity in the pressure finger radius, the applied pressure causes the bend sensors to
deform accordingly (vii) the analog signals from the sensors are converted to digital signals with the help
of analog to digital converters (viii) based on the digital signals, the solenoid at the divider end of the
conveyor opens or closes (ix) the piece with the incorrect profile gets segregated into a separate bin.
4.1.3.2 Cost-benefit analysis
In order to justify the improvement initiative, a detailed cost-benefit analysis is done based on pay-back
period method. The payback method uses a simple concept that the net revenue derived from an
investment should pay back the investment within a certain period of time.
The Net Annual Cash Flow (NACF) refers to the net revenue in a given year. If the revenue exceeds costs
for the year, the NACF is positive. If costs exceed revenue, the NACF is negative. The payback period is
defined as initial cost of the investment divided by NACF. The various cost elements associated with the
automated measurement system is given in Table 4 and the payback period is calculated as 18 months.

RAJENTİRAKUMAR, SRIDHAR, SAVIO, PRAKASH, SRINATH / International Journal of Lean Thinking Volume 3, Issue 1(June2012)
32
Table 4 Cost elements of automated measurement system
Description Amount (`)
Total number of workers 5.00
Total cost per piece 6.25
Savings per piece (in terms of labour charge) 1.25
Savings per day (for 150 pieces) 187.50
Amount saved in 24 working days 4500.00
Electricity cost per day to run the conveyor 0.61
Electricity cost per month 14.52
Net savings in running cost per month 4485.48
Net savings per year (NACF) 53500.00
Initial cost of the investment 78750.00
Payback period (78750/53500) ~ 18 months
4.2 Simulation model
To evaluate potential gains based on the implementation of the lean tools, a detailed simulation model is
developed using Arena simulation software (21). Before evaluating the future state considerable effort is
expended to verify and validate the model for the current system. Verification is the process that ensures
that the simulation model mimics the real system. A detailed animation is also used to verify that the
model sufficiently replicated the real system. Based upon the initial observations from the current state
map and discussions with managers at ABC limited it is decided to measure the two primary performance
measures (i) machine availability (ii) value added time. A snap shot of the arena simulation results is
shown in Fig. 11. It is found the magnitudes of the improvements in the two selected performance
measures are significant. Further, the results indicate that the machine availability is increased by 50% and
the value added time also improved by 70%.

RAJENTİRAKUMAR, SRIDHAR, SAVIO, PRAKASH, SRINATH / International Journal of Lean Thinking Volume 3, Issue 1(June2012)
33
Fig. 11 Snap shot of arena simulation result showing machine availability
5. Conclusions
The textile machinery manufacturer must seek improvement alternatives as a part of their global strategy
to stay in business, to remain competitive and to increase their market share in a tougher market. Lean
manufacturing tools, as the one studied in this work, proved to be good strategies for textile machinery
manufacturer to achieve improvements that significantly outweigh the cost of the implementation. This
work gives a set of alternatives to improve the output of a productive system without incurring in major
investment.
References
1. Womack JP, Jones D, Roos D (1990) The machine that changed the world. Rawson Associates, New
York
2. Peters G, Lodge M, Goodrich BF (1999) Aerospace 717 engine nacelle. Lean Enterprise Institute,
Atlanta
3. Womack JP, Fitzpatrick D (1999) Lean thinking for aerospace: the industry that can afford its future.
Lean Enterprise Institute, Atlanta

RAJENTİRAKUMAR, SRIDHAR, SAVIO, PRAKASH, SRINATH / International Journal of Lean Thinking Volume 3, Issue 1(June2012)
34
4. Liker JK (1998) Becoming lean. Productivity Press, Portland
5. Monden Y (1993) Toyota Production System: An Integrated Approach to Just-in-Time. Chapman and
Hall, London
6. Womack JP, Fitzpatrick D (1999) Lean thinking for aerospace: the industry that can afford its future.
Lean Enterprise Institute, Atlanta
7. Juhain Heilala, Salla Lind, Bjorn Johansson et al (2008) Simulation based sustainable manufacturing
system design. Proceedings of the 2008 winter simulation conference
8. Textile Machinery Manufacturers' Association (India) (2011) Home page at http://www.tmmaindia.net/
9. Dyer JH, Ouchi WG (1993) Japanese-style partnerships: giving companies a competitive edge. Sloan
Manag Rev 35:51–63
10. Womack JP, Jones DT (1996) Beyond Toyota: how to root out waste and pursue perfection. Harvard
Bus Rev (September– October):140–158
11. Womack JP, Jones DT (1996) Lean thinking: banish waste and create wealth for your corporation.
Simon & Schuster, New York
12. Shah R, Ward PT (2007) Defining and developing measures of lean production. J Oper Manag
25:785–805
13. Barker R. C. (1994) The design of lean manufacturing systems using time based analysis. International
Journal of Operations and Production Management, Vol. 14, pp. 86–96
14. Hines, P. and Rich, N. (1997) The seven value stream mapping tools’, International Journal of
Operations and Production Management, Vol. 17, No. 1, pp. 46–64
15. Liker, J. K. (1998) Becoming Lean. Productivity Press

RAJENTİRAKUMAR, SRIDHAR, SAVIO, PRAKASH, SRINATH / International Journal of Lean Thinking Volume 3, Issue 1(June2012)
35
16. Taylor, D. and Brunt, D. (2001) Manufacturing Operations and Supply Chain Management: The Lean
Approach. Thomson Learning.
17. Sullivan, J., Hines, P., Rich, N., Bicheno, J., Brunt, D., Taylor, D. and Butterworth, C. (1998) Value
stream management. Int Jour of Logistics Management, Vol. 9, No. 1, pp. 25–42.
18. Rother, M., Shook, J. (1998) Learning to See: Value Stream Mapping to Add Value and Eliminate
Muda. The Lean Enterprise Institute.
19. Groover Mikell P (2000) Automation, Production Systems, And Computer- integrated Manufacturing.
PHI
20. Sunderesh S Heragu (2006) Facilities design. iUniverse, USA.
21. David Kelton W., Randall P. Sadowski, Nancy B. Swets (2010) Simulation with Arena. Rockwell
Automation, McGraw-Hill