jpmorgan us smaller companies investment trust plc annual ... · patrick industries manufacturers...
TRANSCRIPT

FOR PROFESSIONAL CLIENTS/QUALIFIED INVESTORS ONLY - NOT FOR RETAIL USE OR DISTRIBUTION
JPMorgan US Smaller Companies Investment Trust plc Annual General Meeting 29 April 2015
Fiona Harris, Executive Director, Client Portfolio Manager

1 | FOR PROFESSIONAL CLIENTS/QUALIFIED INVESTORS ONLY - NOT FOR RETAIL USE OR DISTRIBUTION
Daniel Percella, Executive Director Co-Portfolio Manager / Research Analyst Industry Exp: 13 years JPM Exp: 7 years
Don San Jose, Managing Director Portfolio Manager Industry Exp: 18 years JPM Exp: 14 years
Jonathon Brachle, Vice President Research Analyst Industry Exp: 7 years JPM Exp: 7 years
Jason Blumstein, Vice President Research Analyst Industry Exp: 10 years JPM Exp: 8 years
1
A tight knit team with a disciplined focus on delivering alpha
As of April 2015. Source: J.P. Morgan Asset Management. There can be no assurance that the professionals currently employed by J.P. Morgan Asset Management will continue to be employed by J.P. Morgan Asset Management or that the past performance or success of any such professional serves as an indicator of such professional’s future performance or success.
Also leverages the insights of the J.P. Morgan Equity organization, which includes over 40 research analysts in the US

2 | FOR PROFESSIONAL CLIENTS/QUALIFIED INVESTORS ONLY - NOT FOR RETAIL USE OR DISTRIBUTION
Our investment philosophy - We are fundamental bottom-up stock pickers
The targets and aims provided above are the Investment Manager’s targets and aims only and are not necessarily part of the Fund’s investment objectives and policies as stated in the prospectus. There is no guarantee that these will be achieved.
Our approach leads to a portfolio that has historically shown less volatility than the market with less exposure to the downside
Quality Business Quality Management Valuation
We focus on quality first:
Durable business model
Consistent earnings
Clear competitive advantages
High return on invested capital
Sustainable free cashflow
Management is key:
Good stewards of capital
Committed to increasing shareholder value
Track record of success
Valuation is critical:
Price/earnings
Price/book value
Private market analysis
Free cashflow yield
Enterprise value analysis

3 | FOR PROFESSIONAL CLIENTS/QUALIFIED INVESTORS ONLY - NOT FOR RETAIL USE OR DISTRIBUTION
Portfolio Review

4 | FOR PROFESSIONAL CLIENTS/QUALIFIED INVESTORS ONLY - NOT FOR RETAIL USE OR DISTRIBUTION
JPMorgan US Smaller Companies Investment Trust plc: 2014 Performance As of December 2014
FY 2014
JPM US Smaller Companies IT share price1 5.6%
JPM US Smaller Companies IT net asset value2 12.8%
Russell 2000 Index Net (£)3 11.1%
Excess return4 1.7%
Past performance is not necessarily indicative of future results. The current portfolio management team assumed responsibility of the portfolio November 2008. 1Change in share price with net dividends, if any, reinvested (Source: Morningstar). 2Change in net asset value per share with net dividends, if any, reinvested (Source: Morningstar). 3Change in the Index with net income reinvested, in sterling terms. Comparison of the Company’s performance is made against this index. The benchmark is a recognized index of stocks which should not be taken as wholly representative of the Company’s investment universe. The Company’s investment strategy does not follow or “track” this index and therefore there may be a degree of diversity in performance from the main index stated. (Source: Morningstar) 4Arithmetic difference between the net asset value and the index

5 | FOR PROFESSIONAL CLIENTS/QUALIFIED INVESTORS ONLY - NOT FOR RETAIL USE OR DISTRIBUTION
Russell 2000 Sector performance
27% 24% 24%
16% 14%
9% 6% 5%
-35% Health Care Consumer
Staples Utilities Financial
Services Technology Consumer
Discretionary Materials & Processing
Producer Durables
Energy
2014 Russell 2000 sector performance in GBP
Source: Wilshire.
For the twelve month period ending 31 December 2014

6 | FOR PROFESSIONAL CLIENTS/QUALIFIED INVESTORS ONLY - NOT FOR RETAIL USE OR DISTRIBUTION
21%
39% 40%
22% 20%
11% 15%
8%
-41%
27% 24% 24%
16% 14% 9% 6% 5%
-35%
Health Care Consumer Staples
Utilities Financial Services
Technology Consumer Discretionary
Materials & Processing
Producer Durables
Energy
Portfolio Russell 2000
Sector performance
2014 sector performance in GBP
Source: Wilshire. The portfolio is an actively managed portfolio; holdings, sector weights, allocations and leverage, as applicable are subject to change at the discretion of the Investment Manager without notice. The above data excludes cash and gearing.
For the twelve month period ending 31 December 2014
7 | FOR PROFESSIONAL CLIENTS/QUALIFIED INVESTORS ONLY - NOT FOR RETAIL USE OR DISTRIBUTION
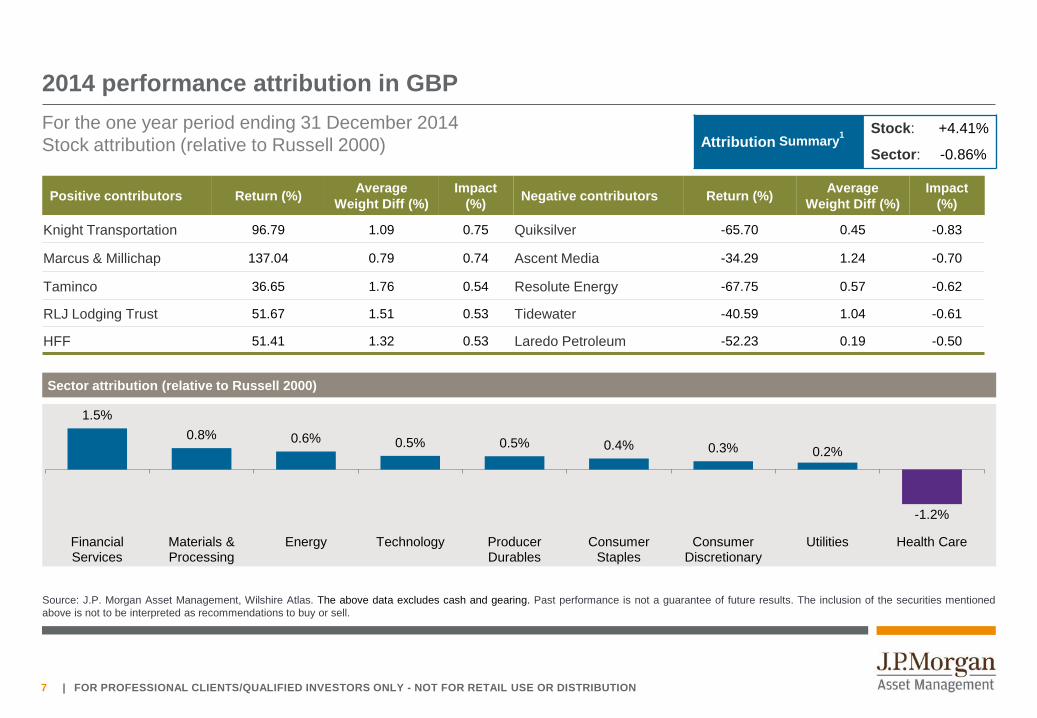
2014 performance attribution in GBP
Source: J.P. Morgan Asset Management, Wilshire Atlas. The above data excludes cash and gearing. Past performance is not a guarantee of future results. The inclusion of the securities mentioned above is not to be interpreted as recommendations to buy or sell.
For the one year period ending 31 December 2014 Stock attribution (relative to Russell 2000)
Attribution Summary1 Stock: +4.41%
Sector: -0.86%
Sector attribution (relative to Russell 2000)
Positive contributors Return (%) Average Weight Diff (%)
Impact (%) Negative contributors Return (%) Average
Weight Diff (%) Impact
(%)
Knight Transportation 96.79 1.09 0.75 Quiksilver -65.70 0.45 -0.83
Marcus & Millichap 137.04 0.79 0.74 Ascent Media -34.29 1.24 -0.70
Taminco 36.65 1.76 0.54 Resolute Energy -67.75 0.57 -0.62
RLJ Lodging Trust 51.67 1.51 0.53 Tidewater -40.59 1.04 -0.61
HFF 51.41 1.32 0.53 Laredo Petroleum -52.23 0.19 -0.50
1.5% 0.8% 0.6% 0.5% 0.5% 0.4% 0.3% 0.2%
-1.2%
Financial Services
Materials & Processing
Energy Technology Producer Durables
Consumer Staples
Consumer Discretionary
Utilities Health Care

8 | FOR PROFESSIONAL CLIENTS/QUALIFIED INVESTORS ONLY - NOT FOR RETAIL USE OR DISTRIBUTION
JPMorgan US Smaller Companies Investment Trust plc: Annualised Performance As of 31 March 2015
FY 2014
Q1 2015
One year
Three years
Five years
Since 11/08*
Ten years
JPM US Smaller Companies IT share price1
5.6% 11.4% 20.4% 23.1% 19.8% 25.9% 11.3%
JPM US Smaller Companies IT net asset value2 12.8% 11.5% 23.4% 20.9% 19.5% 24.5% 10.0%
Russell 2000 Index Net (£)3 11.1% 9.5% 21.2% 18.8% 14.7% 18.5% 11.2%
Excess return4 1.7% 2.0% 2.2% 2.1% 4.8% 6.0% -1.2%
Past performance is not necessarily indicative of future results. *The current portfolio management team assumed responsibility of the portfolio November 2008. These figures are run from 30 November 2008 through 31 March 2014. 1 Change in share price with net dividends, if any, reinvested (Source: Morningstar). 2 Change in net asset value per share with net dividends, if any, reinvested (Source: Morningstar). 3 Change in the Index with net income reinvested, in sterling terms. Comparison of the Company’s performance is made against this index. The benchmark is a recognized index of stocks which should not be taken as wholly representative of the Company’s investment universe. The Company’s investment strategy does not follow or “track” this index and therefore there may be a degree of diversity in performance from the main index stated. (Source: Morningstar) 4 Arithmetic difference between the net asset value and the index

9 | FOR PROFESSIONAL CLIENTS/QUALIFIED INVESTORS ONLY - NOT FOR RETAIL USE OR DISTRIBUTION
Q1 2015 performance attribution in GBP
Source: J.P. Morgan Asset Management, Wilshire Atlas. The above data excludes cash and gearing. Past performance is not a guarantee of future results. The inclusion of the securities mentioned above is not to be interpreted as recommendations to buy or sell.
For the QTD period ending 31 March 2015 Stock attribution (relative to Russell 2000)
Attribution Summary1 Stock: +2.47%
Sector: -0.37%
Sector attribution (relative to Russell 2000)
Positive contributors Return (%) Average Weight Diff (%)
Impact (%) Negative contributors Return (%) Average
Weight Diff (%) Impact
(%)
Freescale Semiconductor 69.69 1.18 0.62 Career Education -24.09 1.16 -0.44
Patrick Industries 48.72 1.36 0.47 Rovi -15.33 1.44 -0.33
Advent Software 51.21 1.18 0.44 Ascent Media -21.00 0.90 -0.32
Cinemark Holdings 33.86 1.43 0.30 Tidewater -37.39 0.52 -0.27
Drew Industries 30.72 1.24 0.23 First Of Long Island -4.22 1.34 -0.21
1.2% 0.9% 0.8%
0.3%
-0.1% -0.1% -0.1% -0.2% -0.5%
Consumer Discretionary
Materials & Processing
Financial Services
Energy Utilities Technology Producer Durables
Consumer Staples
Health Care

10 | FOR PROFESSIONAL CLIENTS/QUALIFIED INVESTORS ONLY - NOT FOR RETAIL USE OR DISTRIBUTION
Sector absolute and relative1 weights
Sector weightings
Source: Wilshire. 1 Reflects relative position to the Russell 2000 Index.
As of March 31, 2015
24.7% 22.4%
15.6%
10.3% 9.8% 8.4%
3.0% 2.9% 2.8%
-0.2%
7.7%
2.6% 3.7%
-4.8% -7.4%
0.1%
-1.5% -0.3%
Financial Services
Consumer Discretionary
Producer Durables
Materials & Processing
Technology Health Care Consumer Staples
Utilities Energy
Absolute Relative

11 | FOR PROFESSIONAL CLIENTS/QUALIFIED INVESTORS ONLY - NOT FOR RETAIL USE OR DISTRIBUTION
Top ten holdings
The companies/securities above are shown for illustrative purposes only. Their inclusion should not be interpreted as a recommendation to buy or sell. J.P. Morgan Asset Management may or may not positions on behalf of its clients in any or all of the aforementioned securities. Source: J.P. Morgan Asset Management.
As of March 31, 2015
Top Ten Holdings Portfolio Weight Benchmark Weight Relative Weight
Waste Connections 2.83% 0.00% 2.83%
Jarden 2.74% 0.00% 2.74%
Brinker International 2.03% 0.00% 2.03%
Toro 1.93% 0.00% 1.93%
Pool Corp 1.91% 0.17% 1.74%
Patrick Industries 1.76% 0.03% 1.73%
Spectrum Brands 1.75% 0.00% 1.75%
Douglas Dynamics 1.74% 0.03% 1.71%
Silgan Holdings 1.70% 0.00% 1.70%
AptarGroup 1.65% 0.00% 1.65%

12 | FOR PROFESSIONAL CLIENTS/QUALIFIED INVESTORS ONLY - NOT FOR RETAIL USE OR DISTRIBUTION
Patrick Industries
Stock example: Patrick Industries (PATK)
Overview Patrick Industries manufacturers building products and materials for the
recreational vehicle (RV) and manufactured housing (MH) industries.
They manufacture a diverse range of products including vinyl/paper laminated panels, granite and quartz countertops, furniture, bathroom/shower components, cabinet doors and bedding.
Attributes The company is headquartered in the RV capital of North America
(Elkhart, IN) but its nationwide, integrated manufacturing and distribution network creates a key competitive advantage by keeping the company close to its customers.
Patrick is a key supplier and trusted partner in its key markets.
Experienced management team and healthy balance sheet allows the company the flexibility to make strategic acquisitions in a highly fragmented industry.
Growth has accelerated due to the rapid recovery in the RV market and long term demographic trends support continued growth.
Content per RV is increasing with new production introductions.
$0
$10
$20
$30
$40
$50
$60
$70
Apr
-10
Jul-1
0
Oct
-10
Jan-
11
Apr
-11
Jul-1
1
Oct
-11
Jan-
12
Apr
-12
Jul-1
2
Oct
-12
Jan-
13
Apr
-13
Jul-1
3
Oct
-13
Jan-
14
Apr
-14
Jul-1
4
Oct
-14
Jan-
15
Figures as of 31 March 2014. Source: Bloomberg, J.P. Morgan Asset Management. There is no guarantee this holdings will remain in the portfolio and holdings may change at the portfolio manager’s discretion without notice. The information in this case study is intended as an example only and should not be construed as advice, it may not be suitable for your particular circumstances and if you are unsure of the suitability of any investment you should seek financial advice. Past performance is not a guarantee of the future. The opinions and views expressed here are those held by the author as at date of this document, which are subject to change and are not to be taken as or construed as investment advice. J.P. Morgan Asset Management may or may not hold positions on behalf its clients in any or all of the aforementioned securities.
Stock price from 31 March 2010 through 31 March 2015

13 | FOR PROFESSIONAL CLIENTS/QUALIFIED INVESTORS ONLY - NOT FOR RETAIL USE OR DISTRIBUTION
Crocs
Stock example: Crocs Inc. (CROX)
Overview Crocs is engaged in the development and distribution of casual lifestyle
footwear, apparel and accessories for men, women and children.
Developed the unique clog in 2002 and today has hundreds of styles including crocs sneakers and cros golf.
Attributes Cros is an innovative leader in footwear. Its patented cell-resin Croslite
materials allows it to manufacture soft, comfortable, lighweight and odor resistant shoes.
We viewed 2014 as a transitional year for the company as it looked to simplify its business model, tighten its cost structure, re-emphaise product innovation, expand globally and have a consistent global message.
We expected these strategic initiatives to lead to better margins and the company has made significant progress in implementing them.
$0
$5
$10
$15
$20
$25
$30
$35
Apr-
10
Jul-1
0 O
ct-1
0 Ja
n-11
Ap
r-11
Ju
l-11
Oct
-11
Jan-
12
Apr-
12
Jul-1
2 O
ct-1
2 Ja
n-13
Ap
r-13
Ju
l-13
Oct
-13
Jan-
14
Apr-
14
Jul-1
4 O
ct-1
4 Ja
n-15
Figures as of 31 March 2014. Source: Bloomberg, J.P. Morgan Asset Management. There is no guarantee this holdings will remain in the portfolio and holdings may change at the portfolio manager’s discretion without notice. The information in this case study is intended as an example only and should not be construed as advice, it may not be suitable for your particular circumstances and if you are unsure of the suitability of any investment you should seek financial advice. Past performance is not a guarantee of the future. The opinions and views expressed here are those held by the author as at date of this document, which are subject to change and are not to be taken as or construed as investment advice. J.P. Morgan Asset Management may or may not hold positions on behalf its clients in any or all of the aforementioned securities.
Stock price from 31 March 2010 through 31 March 2015

14 | FOR PROFESSIONAL CLIENTS/QUALIFIED INVESTORS ONLY - NOT FOR RETAIL USE OR DISTRIBUTION
Market capitalisation
Portfolio characteristics
1Including negatives. 212 month forward. Source: J.P. Morgan Asset Management, FactSet, Wilshire.
As of March 31, 2015
Portfolio Portfolio Index*
Market capitalization (weighted average) $3,281m USD2,068m
P/E ratio - forward1 18.6x 21.5x
Dividend Yield 1.4% 1.3%
EPS growth2 11.4% 14.0%
Return on Equity2 15.8% 9.3%
Holdings 91 1,977
Gearing 5.9% -
Turnover – trailing 12 month 20.9% -
50%
24% 19%
6%
24%
37%
31%
9%
0%
10%
20%
30%
40%
50%
60%
> 3B 1.5 - 3B 500M - 1.5B < 500M
Portfolio
Russell 2000

15 | FOR PROFESSIONAL CLIENTS/QUALIFIED INVESTORS ONLY - NOT FOR RETAIL USE OR DISTRIBUTION
US market review and outlook

16 | FOR PROFESSIONAL CLIENTS/QUALIFIED INVESTORS ONLY - NOT FOR RETAIL USE OR DISTRIBUTION
Returns and Valuations by Style
GTM - U.S. | Page 8
Value Blend Growth
Larg
e
116.4% 104.3% 91.7%
Mid 124.4% 118.1% 98.5%
Smal
l
114.3% 107.1% 97.4%
Value Blend Growth Value Blend Growth
Larg
e
41.1% 55.5% 76.6%
Larg
e
251.8% 247.5% 260.2%
Mid 72.5% 76.8% 78.7% Mid 340.5% 326.5% 313.1%
Smal
l
51.0% 64.4% 77.7%
Smal
l
273.5% 296.3% 319.4%
Value Blend Growth Value Blend Growth
Larg
e
-0.7% 1.0% 3.8%
Larg
e
13.5% 13.7% 13.0%
Mid 2.4% 4.0% 5.4% Mid 14.7% 13.2% 11.9%
Smal
l
2.0% 4.3% 6.6%Sm
all
4.2% 4.9% 5.6%
YTD
Since Market Low (March 2009)
2014
Since Market Peak (October 2007) Current P/E as % of 20-year avg. P/E
Current P/E vs. 20-year avg. P/E
16.4 16.9 19.3
14.1 16.2 21.1
17.8 19.6 21.7
14.3 16.6 22.0
16.6 18.6 21.0
14.5 17.4 21.6Smal
l
Value Blend Growth
Larg
eM
idSource: Russell Investment Group, Standard & Poor’s, FactSet, J.P. Morgan Asset Management. All calculations are cumulative total return, including dividends reinvested for the stated period. Since Market Peak represents period 10/9/07 – 3/31/15, illustrating market returns since the S&P 500 Index high on 10/9/07. Since Market Low represents period 3/9/09 – 3/31/15, illustrating market returns since the S&P 500 Index low on 3/9/09. Returns are cumulative returns, not annualized.
For all time periods, total return is based on Russell-style indexes with the exception of the large blend category, which is based on the S&P 500 Index. Past performance is not indicative of future returns. P/E ratios reflect latest available data. Earnings estimates are as of February for Russell Indexes and as of March for Standard & Poor’s. Data are as of March 31, 2015.

17 | FOR PROFESSIONAL CLIENTS/QUALIFIED INVESTORS ONLY - NOT FOR RETAIL USE OR DISTRIBUTION
-$1
$1
$3
$5
$7
$9
$11
$13
$15
$17
$19
'65 '70 '75 '80 '85 '90 '95 '00 '05 '10 '15-6%
-4%
-2%
0%
2%
4%
6%
8%
10%
Real GDPYear-over-year % chg
4Q14YoY % chg: 2.4%
Components of GDP4Q14 nominal GDP, trillions USD
13.4% Investment Ex-housing
68.5% Consumption
18.0% Gov’t Spending
3.3% Housing
- 3.1% Net Exports
Average: 3.0%
QoQ % chg: 2.2%
Real GDP
Expansion Average:
2.3%
Economic Growth and the Composition of GDP
Source: BEA, FactSet, J.P. Morgan Asset Management. Values may not sum to 100% due to rounding. Quarter over quarter percent changes are at an annualized rate. Average represents the annualized growth rate for the full period. Expansion average refers to the period starting in the second quarter of 2009. Guide to the Markets – U.S.Data are as of March 31, 2015
GTM - U.S. | Page 16

18 | FOR PROFESSIONAL CLIENTS/QUALIFIED INVESTORS ONLY - NOT FOR RETAIL USE OR DISTRIBUTION
Energy: Supply, Demand and Prices
Source: EIA, Factset, J.P. Morgan Asset Management. *Forecasts are from EIA Short-Term Energy Outlook and start in 2015. ** Forecasts are from EIA Annual Energy Outlook and start in 2014. *** Production numbers as of 2015. **** Other includes conventional on and offshore natural gas drilling, tight gas, and coalbed methane. Natural gas prices are $/mmbtu and are of February 2015. Guide to the Markets – U.S. Data are as of March 31, 2015.
'86 '88 '90 '92 '94 '96 '98 '00 '02 '04 '06 '08 '10 '12 '14$0
$20
$40
$60
$80
$100
$120
$140
$160
'95 '00 '05 '10 '15 '20 '250
5
10
15
20
25
30
35
Change in Production and Consumption of OilProduction, consumption and inventories, million barrels per day
Price of OilBrent crude, nominal prices, USD/barrel
Mar. 2015: $58.17
Gbl. Natural Gas PricesJapan $13.37Germany $9.29U.S. $2.74
U.S. Natural Gas Production***Trillions of cubic feet, USD
Other****
Shale Gas
EIA Forecast**
2013 2014 2015*Production
U.S. 12.4 14.0 14.9 20.8%
OPEC 36.5 36.5 36.5 -0.1%
Other 42.0 42.6 42.7 1.5%
Global 90.9 93.0 94.1 3.5%
Consumption
U.S. 19.0 19.0 19.3 2.0%
Europe 14.3 14.2 14.1 -1.6%
Japan 4.5 4.3 4.2 -7.5%
China 10.3 10.7 11.0 6.8%
Other 43.2 44.0 44.5 3.2%
Global 91.2 92.2 93.1 2.1%
Inventory Change -0.3 0.9 1.0
Growth since 2013
GTM - U.S. | Page 27

19 | FOR PROFESSIONAL CLIENTS/QUALIFIED INVESTORS ONLY - NOT FOR RETAIL USE OR DISTRIBUTION
Labor Market Perspectives
Source: (Left) BLS, Census Bureau, FactSet, J.P. Morgan Asset Management. (Right) BLS FactSet, J.P. Morgan Asset Management. Unemployment rates shown are for civilians aged 25 and older. Guide to the Markets – U.S. Data are as of March 31, 2015
Net Job Creation Since Feb. 2010 – Millions of Jobs
'92 '94 '96 '98 '00 '02 '04 '06 '08 '10 '12 '140%
2%
4%
6%
8%
10%
12%
14%
16%
18%
Unemployment Rate by Education Level
2.5%4.8%5.3%8.6%Less than High School Degree
High School No CollegeSome CollegeCollege or Greater
Education Level Mar. 2015
'90 '92 '94 '96 '98 '00 '02 '04 '06 '08 '10 '12 '1462%
63%
64%
65%
66%
67%
68%Labor Force Participation Rate
Mar. 2015: 62.7%
GTM - U.S. Left chart | Page 24 Right charts | Page 23

20 | FOR PROFESSIONAL CLIENTS/QUALIFIED INVESTORS ONLY - NOT FOR RETAIL USE OR DISTRIBUTION
Consumer Finances
Source: BEA, FRB, J.P. Morgan Asset Management. *Revolving includes credit cards. **1Q15 household debt service ratio and 4Q14 household net worth are J.P. Morgan Asset Management estimates. Values may not sum to 100% due to rounding. Guide to the Markets – U.S. Data are as of March 31, 2015.
GTM - U.S. | Page 17
'90 '92 '94 '96 '98 '00 '02 '04 '06 '08 '10 '12 '14
$10,000
$20,000
$30,000
$40,000
$50,000
$60,000
$70,000
$80,000
$90,000
Household Net Worth Billions USD, not seasonally adjusted 1Q15**:
$83,899
2Q07: $ 67,866
'80 '82 '84 '86 '88 '90 '92 '94 '96 '98 '00 '02 '04 '06 '08 '10 '12 '14
9%
10%
11%
12%
13%
14%
Household Debt Service Ratio Debt payments as % of disposable personal income, sa
1Q80: 10.6%
1Q15**: 9.9%
4Q07: 13.2%

21 | FOR PROFESSIONAL CLIENTS/QUALIFIED INVESTORS ONLY - NOT FOR RETAIL USE OR DISTRIBUTION
% of GDP
We think we have a few years left in an up cycle
Source: J.P. Morgan Asset Management and US Bureau of Economic Analysis. Data as of 31 December 2014.
Durable goods and fixed investment as % of GDP
12/14 24.1% LT average: 25.7%
18%
20%
22%
24%
26%
28%
30%
51 56 61 66 71 76 81 86 91 96 01 06 11

22 | FOR PROFESSIONAL CLIENTS/QUALIFIED INVESTORS ONLY - NOT FOR RETAIL USE OR DISTRIBUTION
Positive earnings growth despite the negative impact of energy
Source: S&P 500 earnings are J.P. Morgan Asset Management estimates; 1Russell 2000 earnings are Bank of America Merrill Lynch estimates. Data as of 3/31/15. Opinions, estimates, forecasts, projections and statements of financial market trends that are based on current market conditions constitute our judgment and are subject to change without notice. There can be no guarantee they will be met. Shown for illustrative purposes only. Past performance is not a guarantee of future results.
US Earnings Picture
Russell 2000 Earnings Growth 1 2015 vs 2014
Materials 28%
Health Care 19%
Industrials 18%
Consumer Discretionary 16%
Information Technology 13%
Financials 7%
Utilities 2%
Consumer Staples 0%
Energy NM
Russell 2000 +8.3%
Russell ex-Energy +12.9%
4%
11%
8%
13%
0%
2%
4%
6%
8%
10%
12%
14%
2015E 2015E ex-Energy
S&P 500
Russell 2000
Estimates for 2015 Earnings

23 | FOR PROFESSIONAL CLIENTS/QUALIFIED INVESTORS ONLY - NOT FOR RETAIL USE OR DISTRIBUTION
Sector performance in 2015 could depend in part on interest rates
Source: Standard & Poor’s, U.S. Treasury, FactSet, J.P. Morgan Asset Management. Returns are based on price index only and do not include dividends. Markers represent monthly 2-year correlations only. Guide to the Markets – U.S. Data are as of March 31, 2015.
-0.8
-0.6
-0.4
-0.2
0
0.2
0.4
0.6
0.8
0% 2% 4% 6% 8% 10% 12% 14% 16%
Correlations Between Weekly Stock Returns and Interest Rate Movements Weekly S&P 500 returns, 10-year Treasury yield, rolling 2-year correlation, May 1963 – Mar. 2015
Positive relationship between yield movements and stock returns
Negative relationship between yield movements and stock returns
When yields are below 5%, rising rates are generally associated with rising stock prices
10-Year Treasury Yield
Co
rre
lati
on
Co
eff
icie
nt
GTM - U.S. | Page 12
Sector correlations to rates 2-year rolling, 1994-2013
Max Average
Current Min
-1.00 -0.50 0.00 0.50 1.00
Utilities
Telecom
Cons. Staples
Materials
Technology
Health Care
Energy
Cons. Disc.
S&P 500
Industrials
Financials
More positively correlated with rising
interest rates
Less positively correlated with rising
interest rates

24 | FOR PROFESSIONAL CLIENTS/QUALIFIED INVESTORS ONLY - NOT FOR RETAIL USE OR DISTRIBUTION
US Federal Reserve Policies and equity market responses to Fed tightening cycles
Fed policy implemented through quantity of reserves1965-1966 -1% -11% -13%1967-1969 -4% 12% 8%1971 4% -4% -1%1972-1973 2% -3% -1%1974 -4% -11% -14%1977-1979 -4% 4% 0%1980 -1% 12% 11%1982 -6% 1% -5%1983-1984 -2% 10% 8%1987 -5% 32% 26%1988-1989 -8% 27% 17%Fed policy implemented through interest rates1994-1995 -9% 7% -2%1999-2000 -7% 18% 10%2004-2006 -8% 20% 11%
S&P 500 price return
Rate hike episode:
Initial reaction to first hike
Subsequent reaction to remaining
hikesTotal reaction
to all hikes
Source: Federal Reserve Board, The Wall Street Journal, US Treasury, JPMorgan Asset Management. For illustrative purposes only
Source: US Federal Reserve, FactSet, J.P. Morgan Asset Management. Guide to the Markets - Europe. Data as at 31 March 2014.

25 | FOR PROFESSIONAL CLIENTS/QUALIFIED INVESTORS ONLY - NOT FOR RETAIL USE OR DISTRIBUTION
26
-10
1517
1
26
15
2
12
27
-7
26
47
-2
34
20
3127
20
-10-13
-23
26
9
3
14
4
-38
23
13
0
13
30
11
.4
-17 -18 -17
-7
-13
-8 -9
-34
-8 -8
-20
-6 -6 -5-9
-3
-8-11
-19
-12
-17
-30-34
-14
-8 -7 -8-10
-49
-28
-16-19
-10-6 -7
-4
-60%
-50%
-40%
-30%
-20%
-10%
%
10%
20%
30%
40%
'80 '85 '90 '95 '00 '05 '10 '15
S&P 500 Intra-year Declines vs. Calendar Year ReturnsDespite average intra-year drops of 14.2%, annual returns positive in 27 of 35 years*
YTD
Annual Returns and Intra-year Declines
Source: Standard & Poor’s, FactSet, J.P. Morgan Asset Management. Returns are based on price index only and do not include dividends. Intra-year drops refers to the largest market drops from a peak to a trough during the year. For illustrative purposes only. *Returns shown are calendar year returns from 1980 to 2014 excluding 2015 which is year to date. Guide to the Markets – U.S. Data are as of March 31, 2015.
GTM - U.S. | Page 11

26 | FOR PROFESSIONAL CLIENTS/QUALIFIED INVESTORS ONLY - NOT FOR RETAIL USE OR DISTRIBUTION
Summary
The manager seeks to achieve the stated objectives. There can be no guarantee the objectives will be met.
Fundamental, bottom-up research process aiming to outperform benchmark and peers over full market cycle
Focus on quality companies, with strong management teams and attractive valuations
– Lower market risk
– Diversified portfolio with eye on risk management
– Solid protection in down markets
Experienced investment team led by Don San Jose, with over 17 years of industry experience
– A proven ability to pick stocks
– Strong, consistent track record
The market environment remains constructive for US equities, including small caps

27 | FOR PROFESSIONAL CLIENTS/QUALIFIED INVESTORS ONLY - NOT FOR RETAIL USE OR DISTRIBUTION
Appendix

28 | FOR PROFESSIONAL CLIENTS/QUALIFIED INVESTORS ONLY - NOT FOR RETAIL USE OR DISTRIBUTION
JPMorgan US Smaller Companies Investment Trust: Performance attribution since manager inception*
*Manager Inception date: Don San Jose assumed co-portfolio management duties of the Fund in November 2008. Don San Jose became lead portfolio on the strategy in February 2013. Attribution is annualized, gross of fees and also excludes cash. On 31/01/98 the benchmark for the Fund was changed from Russell 2000 to Russell 2000 Net. On 04/07/07 the benchmark changed to Russell Micro Cap Index (Total Return Net). On 01/10/09 the benchmark changed to the Russell 2000 Net Index. Source: J.P. Morgan Asset Management, Wilshire.
Annualized performance attribution from 30 November 2008 through 31 March 2015
Stock Selection Sector Selection Total
Financial Services 3.06 0.17 3.23
Consumer Discretionary 1.90 0.03 1.93
Technology 0.95 0.21 1.16
Energy -0.08 0.22 0.14
Producer Durables 0.01 -0.01 0.00
Materials & Processing -0.04 -0.03 -0.07
Utilities -0.13 -0.01 -0.14
Consumer Staples -0.27 -0.04 -0.31
Health Care -0.41 -0.32 -0.73
Total 4.99 0.23 5.23

29 | FOR PROFESSIONAL CLIENTS/QUALIFIED INVESTORS ONLY - NOT FOR RETAIL USE OR DISTRIBUTION
Disclaimer
J.P. Morgan Asset Management
This is a promotional document and as such the views contained herein are not to be taken as an advice or recommendation to buy or sell any investment or interest thereto. Reliance upon information in this material is at the sole discretion of the reader. Any research in this document has been obtained and may have been acted upon by J.P. Morgan Asset Management for its own purpose. The results of such research are being made available as additional information and do not necessarily reflect the views of J.P.Morgan Asset Management. Any forecasts, figures, opinions, statements of financial market trends or investment techniques and strategies expressed are unless otherwise stated, J.P. Morgan Asset Management’s own at the date of this document. They are considered to be reliable at the time of writing, may not necessarily be all-inclusive and are not guaranteed as to accuracy. They may be subject to change without reference or notification to you.
It should be noted that the value of investments and the income from them may fluctuate in accordance with market conditions and taxation agreements and investors may not get back the full amount invested. Changes in exchange rates may have an adverse effect on the value, price or income of the product(s) or underlying overseas investments. Both past performance and yield may not be a reliable guide to future performance. There is no guarantee that any forecast made will come to pass. Furthermore, whilst it is the intention to achieve the investment objective of the investment product(s), there can be no assurance that those objectives will be met.
J.P. Morgan Asset Management is the brand name for the asset management business of JPMorgan Chase & Co and its affiliates worldwide. You should note that if you contact J.P. Morgan Asset Management by telephone those lines may be recorded and monitored for legal, security and training purposes. You should also take note that information and data from communications with you will be collected, stored and processed by J.P. Morgan Asset Management in accordance with the EMEA Privacy Policy which can be accessed through the following website http://www.jpmorgan.com/pages/privacy.
Investment is subject to documentation (Investment Trust Profiles, Key Features and Terms and Conditions), copies of which can be obtained free of charge from JPMorgan Asset Management Marketing Limited. Issued by JPMorgan Asset Management Marketing Limited which is authorised and regulated in the UK by the Financial Conduct Authority. Registered in England No: 288553. Registered address: 25 Bank St, Canary Wharf, London E14 5JP
4d03c02a800243aa