jpmorgan chase & co jpm (nyse) | a+corporate.morningstar.com/us/documents/...jpmorgan.pdf ·...
TRANSCRIPT
Business Risk Stress Test Solvency Score Distance To Default Economic Moat™ Industry Group Sector
Good Fair Fair Fair Narrow Banks Financial Services
JPMorgan Chase & Co JPM (NYSE) | A+
Morningstar Corporate Credit Research
© Morningstar. All Rights Reserved. Unless otherwise provided in a separate agreement, you may use this report only in the country in which its original distributor is based. The information contained herein is not represented or warranted to beaccurate, correct, complete, or timely. This report is for information purposes only, and should not be considered a solicitation to buy or sell any security. Redistribution is prohibited without written permission. To order reprints, call +1 312-696-6100.To license the research, call +1 312-696-6869.
2009 2010 2011(E) 2012(E)
Tier 1 Capital Ratio 11.1 12.1 — —
Tangible Common Equity/TangibleAssets
5.3 5.6 6.0 6.0
Allowance for Loan Losses/NetCharge-offs
137.6 136.3 168.0 177.6
Net Charge-Offs/Gross Loans 3.3 3.6 2.1 1.6
Return on Assets 0.6 0.8 1.0 1.1
Return on Average Common Equity 7.0 10.2 11.8 12.7
Net Interest Margin 2.8 2.8 2.5 2.8
Efficiency Ratio 51.7 60.4 62.9 60.2
2009 2010 2011(E) 2012(E)
Net Interest Income 51,152 51,001 47,901 54,865
Non-Interest Income 48,172 48,728 50,445 50,525
Net Revenue 99,324 99,729 98,346 105,390
Non-Interest Expense 52,352 61,196 62,611 64,083
Pre-Tax, Pre-Provision Earnings 48,082 41,498 36,935 42,507
Provision for Loan Losses 32,015 16,639 5,449 6,350
Net Income 11,728 15,764 19,891 22,910
Prior Year Prior Quarter Current
Book Equity 156.57 Bil 168.31 Bil 172.8 Bil
Total Deposits 925.3 Bil 930.37 Bil 995.83 Bil
Debt 362.39 Bil 340.34 Bil 352.34 Bil
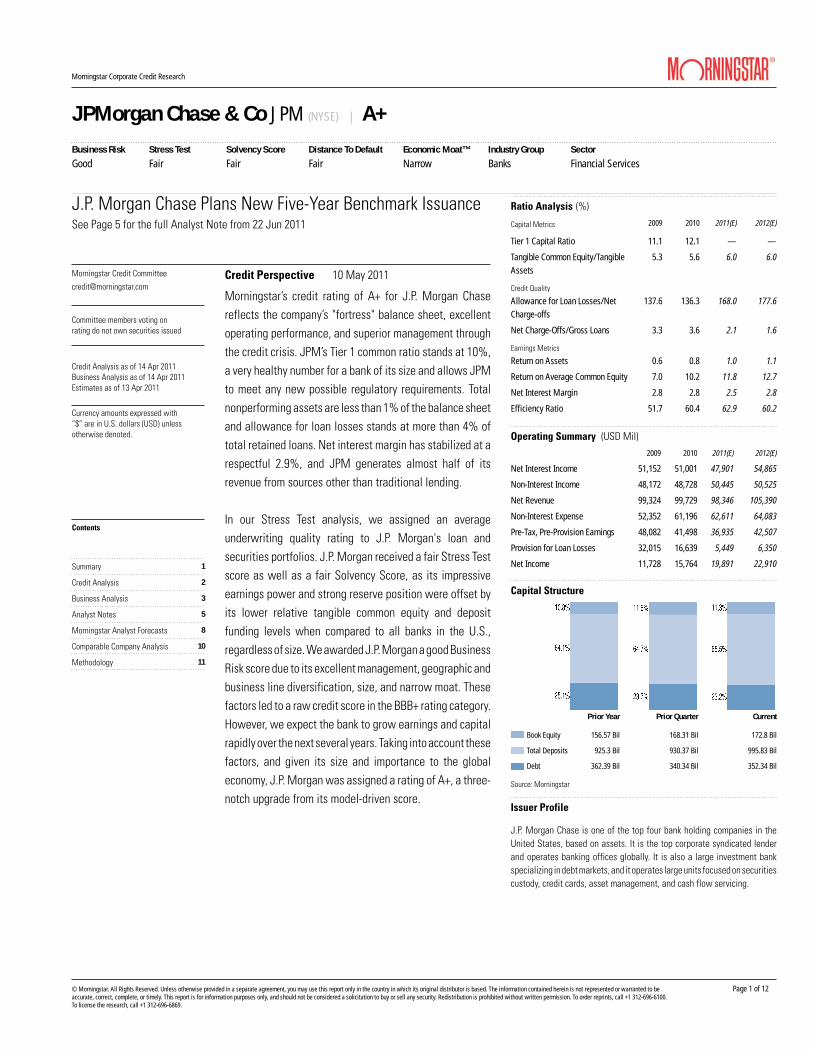
J.P. Morgan Chase Plans New Five-Year Benchmark Issuance
Morningstar Credit Committee
Credit Analysis as of 14 Apr 2011Business Analysis as of 14 Apr 2011Estimates as of 13 Apr 2011
Credit Perspective 10 May 2011
Morningstar’s credit rating of A+ for J.P. Morgan Chasereflects the company’s "fortress" balance sheet, excellentoperating performance, and superior management throughthe credit crisis. JPM’s Tier 1 common ratio stands at 10%,a very healthy number for a bank of its size and allows JPMto meet any new possible regulatory requirements. Totalnonperforming assets are less than 1% of the balance sheetand allowance for loan losses stands at more than 4% oftotal retained loans. Net interest margin has stabilized at arespectful 2.9%, and JPM generates almost half of itsrevenue from sources other than traditional lending.
In our Stress Test analysis, we assigned an averageunderwriting quality rating to J.P. Morgan's loan andsecurities portfolios. J.P. Morgan received a fair Stress Testscore as well as a fair Solvency Score, as its impressiveearnings power and strong reserve position were offset byits lower relative tangible common equity and depositfunding levels when compared to all banks in the U.S.,regardless of size. We awarded J.P. Morgan a good BusinessRisk score due to its excellent management, geographic andbusiness line diversification, size, and narrow moat. Thesefactors led to a raw credit score in the BBB+ rating category.However, we expect the bank to grow earnings and capitalrapidly over the next several years. Taking into account thesefactors, and given its size and importance to the globaleconomy, J.P. Morgan was assigned a rating of A+, a three-notch upgrade from its model-driven score.
J.P. Morgan Chase is one of the top four bank holding companies in theUnited States, based on assets. It is the top corporate syndicated lenderand operates banking offices globally. It is also a large investment bankspecializing in debt markets, and it operates large units focused on securitiescustody, credit cards, asset management, and cash flow servicing.
Issuer Profile
Ratio Analysis
Capital Metrics
Credit Quality
Earnings Metrics
Operating Summary (USD Mil)
(%)
Capital Structure
Source: Morningstar
Committee members voting onrating do not own securities issued
Currency amounts expressed with“$” are in U.S. dollars (USD) unlessotherwise denoted.
Contents
Summary
Credit Analysis
Business Analysis
Analyst Notes
Morningstar Analyst Forecasts
Comparable Company Analysis
Methodology
See Page 5 for the full Analyst Note from 22 Jun 2011
1
2
3
5
8
10
11
Page 1 of 12

Business Risk Stress Test Solvency Score Distance To Default Economic Moat™ Industry Group Sector
Good Fair Fair Fair Narrow Banks Financial Services
JPMorgan Chase & Co JPM (NYSE) | A+
Morningstar Corporate Credit Research
© Morningstar. All Rights Reserved. Unless otherwise provided in a separate agreement, you may use this report only in the country in which its original distributor is based. The information contained herein is not represented or warranted to beaccurate, correct, complete, or timely. This report is for information purposes only, and should not be considered a solicitation to buy or sell any security. Redistribution is prohibited without written permission. To order reprints, call +1 312-696-6100.To license the research, call +1 312-696-6869.
Size (Assets in USD Mil) 2,212,488Economic Moat Rating NarrowEquity Uncertainty Rating (uncertainty of equity residual) HighGeographic/Business Line Concentration Very LowManagement Grade ExcellentDependence on Capital Markets LowBusiness Risk Score Good
Tangible Common Equity 122,688Risk Weighted Assets 1,193,529Tangible Assets 2,145,448Post-Stress TCE/Risk-Weighted Assets(%) 9.8Post-Stress TCE/Tangible Assets(%) 5.5Potential Loan Losses/TCE(%) 51.1Potential Securities Losses/TCE(%) 29.0Stress Test Score Fair
Ratio(%)
(NPAs + Past-Due Loans)/Assets 2.8Allowance/(NPAs + Past-Due Loans) 50.0(NPAs + Past-Due Loans)/Tangible Common Equity 58.8Tangible Common Equity/Tangible Assets 5.0Deposits/Liabilities 47.9Pre-Tax, Pre-Provision Earnings/Average Assets 1.9Solvency Score Fair
JPM SectorBusiness Risk 2.6 3.6Stress Test 5.0 4.0Solvency Score 4.7 4.0Distance to Default 6.0 3.7Credit Rating A+ A-
Business Risk Summary
Credit Analysis
Stress Test Summary (USD Mil, as of Dec 2010)
Solvency Score Summary (as of Dec 2010)
Solvency Score History
Credit Rating Pillars Peer Group Comparison
Source: Morningstar Estimates Note: Scoring is on a scale 1-10; 1 being Best and 10 being Worst.
Financial Health
After sailing through two rounds of government stress tests,J.P. Morgan was the first of the top four retail banks torepurchase its TARP funds and one of the first to raise itsdividend. J.P. Morgan remains well capitalized, with theresources to withstand the economic recession. As of March31, J.P. Morgan's Tier 1 common equity ratio was 7.3% ona Basel III basis--meaning it already meets the 2019 basicstandards.
Capital Structure
With its 7.3% Tier 1 common ratio, J.P. Morgan meets the2019 standards set by the Basel III announcement. However,the additional burden for systemically importantbanks--which J.P. Morgan will qualify as--has yet to be set.Aside from its strong equity base, we believe J.P. Morgancontinues to benefit from "too big to fail" status. Despitethe best efforts of Congress, the disappearance of too bigto fail is not likely, in our opinion. We note that thegovernment stepped in with $25 billion of funding earlier inthis crisis--taking a ranking even below Tier 1 qualified trustpreferred stock--and while trying to unwind one large bankfailure may be possible, another systemic crisis wouldprobably to lead to another systemwide bailout.
Enterprise Risk
Despite some heroic actions during the crisis, J.P. Morgan'ssize and profits have made the company a target oflegislators looking to score political capital. This hasresulted in items like the upcoming reduction in debit cardinterchange fees. Additionally, much of the Dodd-Frank billwas written so vaguely that it is difficult to say with certaintythe bank will not suffer permanent harm. On top of all ofthis, J.P. Morgan is facing years of legal strugglesassociated with issues including robo-signing, BernieMadoff, and its purchases of Bear Stearns and WaMu.
Page 2 of 12
Business Risk Stress Test Solvency Score Distance To Default Economic Moat™ Industry Group Sector
Good Fair Fair Fair Narrow Banks Financial Services
JPMorgan Chase & Co JPM (NYSE) | A+
Morningstar Corporate Credit Research
© Morningstar. All Rights Reserved. Unless otherwise provided in a separate agreement, you may use this report only in the country in which its original distributor is based. The information contained herein is not represented or warranted to beaccurate, correct, complete, or timely. This report is for information purposes only, and should not be considered a solicitation to buy or sell any security. Redistribution is prohibited without written permission. To order reprints, call +1 312-696-6100.To license the research, call +1 312-696-6869.
Business Analysis
Thesis
J.P. Morgan Chase has received--and earned--high praisethroughout the credit crisis. While the company deserveskudos for its accomplishments during the crisis, as well asfor the mistakes it didn't make in the preceding years, weare more excited about its future opportunities. We believemuch of its success is attributable to well-known CEO JamieDimon and his tight grip on the risks the company takes asa whole. Now, with a stronger-than-ever franchise, J.P.Morgan must show that it can execute and meet its returntargets. We believe management has laid out a clear pathfor each of its divisions and must now prove that its glowingreputation is well deserved.
Dimon joined J.P. Morgan in 2004 following the acquisitionof Bank One, which he then ran. The integration was not asmooth one, and returns suffered. By the time Dimonassumed the top spot in 2006, he inherited a wide-rangingempire that did not function all that well as a whole.Precrash returns on equity were only 8%-13%, while othermajor players were posting returns in the high teens. Dimonset about consolidating operations with a focus onprofitability and intelligent risk-taking. He assured thatindividual business lines did not simply shift questionableassets and activities into other pockets of the firm. Theseefforts were key to J.P. Morgan's success as the credit crisishit.
Having created a "fortress balance sheet" leading up tothe crisis, J.P. Morgan was able to expand while rivalsfaltered. In 2008, the bank acquired Bear Stearns andWashington Mutual--relative giants on their own--on termsso attractive they would have been unthinkable only monthsbefore the deals were struck. While the bank--like all of itspeers--accepted government Troubled Asset Relief Programcapital during the crisis, it was the first to return these fundsto the taxpayer when the storm began to pass. It was alsoone of the first to be approved for a dividend increase. The
new rate of $0.25 per quarter is meaningful, but still allowsthe bank to expand its capital base to meet the upcomingBasel III requirements.
As a result of the savvy moves made during the crisis, J.P.Morgan is positioned to have earnings exceed ourestimated 11% cost of equity despite the hits it will takefrom the financial reform bill and Basel III rules. J.P.Morgan's internal return on equity goals average out to a14.6% return on equity for the company through the cycle.Each business line's goals are attainable even with theburden of overdraft regulation, debit card interchange feelosses, and higher capital standards. If J.P. Morgan cancontinually hit its goals, this stock will be a winner forinvestors, but it will require the discipline and close eye onrisk that Dimon has become famous for.
Economic Moat
J.P. Morgan operates in a highly commodified industry.However, its nationwide footprint has allowed the companyto achieve significant economies of scale, lowering its operatingcosts per dollar of revenue compared with most of itssmaller competition. This is the primary basis for our narrowmoat. Additionally, the company's strong reputation forsafety has lured worried customers away from competitorsduring this uncertain time.
Moat Trend
The potential for much greater regulatory restrictions islikely to reduce the bank's ability to generate excess returnson invested capital. Additionally, roughly 27% of J.P.Morgan's earnings in a normal year are generated from itsinvestment bank, where a sustainable competitiveadvantage is nearly impossible to achieve. However, evenconsidering the negative impact of legislation, we do notexpect the additional scrutiny to eliminate J.P. Morgan'sability to generate excess returns. The company has alow-cost nationwide retail franchise, a strong asset-management
Page 3 of 12

Business Risk Stress Test Solvency Score Distance To Default Economic Moat™ Industry Group Sector
Good Fair Fair Fair Narrow Banks Financial Services
JPMorgan Chase & Co JPM (NYSE) | A+
Morningstar Corporate Credit Research
© Morningstar. All Rights Reserved. Unless otherwise provided in a separate agreement, you may use this report only in the country in which its original distributor is based. The information contained herein is not represented or warranted to beaccurate, correct, complete, or timely. This report is for information purposes only, and should not be considered a solicitation to buy or sell any security. Redistribution is prohibited without written permission. To order reprints, call +1 312-696-6100.To license the research, call +1 312-696-6869.
Business Analysis
division, and the scale to compete in global custody. Thepotential growth in these moatworthy businesses matchesthe downside of regulation, causing us to believe our narrowmoat rating is stable.
Page 4 of 12

Business Risk Stress Test Solvency Score Distance To Default Economic Moat™ Industry Group Sector
Good Fair Fair Fair Narrow Banks Financial Services
JPMorgan Chase & Co JPM (NYSE) | A+
Morningstar Corporate Credit Research
© Morningstar. All Rights Reserved. Unless otherwise provided in a separate agreement, you may use this report only in the country in which its original distributor is based. The information contained herein is not represented or warranted to beaccurate, correct, complete, or timely. This report is for information purposes only, and should not be considered a solicitation to buy or sell any security. Redistribution is prohibited without written permission. To order reprints, call +1 312-696-6100.To license the research, call +1 312-696-6869.
Recent Notes from our Credit and Equity Analysts
J.P. Morgan Chase Plans New Five-Year Benchmark
Issuance 22 Jun 2011
J.P. Morgan Chase JPM (A+) is coming to market todaywith a new five-year benchmark issuance. Details on pricingand size are yet to be determined, but we think fair valueon the new issuance would be in the area of 150 basis pointsabove Treasuries, which also is in line with where theexisting five-year trades. We remain positive on J.P. Morganfrom a credit perspective, as the firm is well capitalized witha solid balance sheet. As investors begin to look to thefinancial sector to pick up yield for rating, JPM is a topchoice. Investors with a little more risk appetite can look tonames such as Citigroup C (A-), where they can pick upmore than 50 basis points of spread over JPM for a lowerrating of just two notches.
Losing 'Too Big to Fail' Not Too Big a Deal for Our Ratings
08 Jun 2011
Recently, there has been a lot of press about the ratingagencies and how they incorporate "too big to fail" statusinto their bank ratings. One rating agency gives some banksas much five notches of uplift for TBTF. With the possibilitythat further rulemaking associated with the Dodd-Frankfinancial reform bill will eliminate TBTF, the rating agenciesare preparing the market for the possibility of massivedowngrades in the banking sector.
For Morningstar, the possibility of certain banks losing theirTBTF status would have little effect. We generally give aone-notch upgrade from our model-driven rating for theeffects of TBTF. We have always believed that businessesshould be rated on their merits, rather than as extensionsof the federal government. In our view, if the large bankstruly possess long-term TBTF status, then they should be
rated and trade almost in line with U.S. Treasuries. We werealso concerned that political backlash against rescues offinancial firms could lead to a lack of protection in the future,regardless of the economic consequences. We thereforeincorporate only a one-notch rating upgrade for the largestbanks, acknowledging the possibility of assistance withoutbasing our ratings on political analysis.
Without TBTF status, it appears that rating agencies wouldrate big banks like Citibank C and Bank of America BACin the mid to high BBB area, down from their low AA/highA current ratings. Five-year credit default swaps on Citi andB of A are about 140 and 160 basis points, respectively. Itis clear to us that the market already discounts the TBTFstatus, and while we expect some increase in CDS shouldthe TBTF status be more explicitly removed, we doubt thatit would have a meaningful impact. Counteracting the lossof TBTF is the overall improvement in the health of the bigbanks. Recently, we upgraded Citi from BBB+ to A- as thebank has raised its Tier 1 common ratio more than 200 basispoints in the past year to 11.3%. We also placed Citi bondson our investment-grade Best Ideas list. We believe bondinvestors should evaluate the banks on their stand-alonemerits and invest accordingly, as shaking hands with thegovernment becomes far more risky as free-marketadvocates gain sway in Congress. But even on that basis,bank bonds still trade wide to the rest of the market andbond investors who do their homework will benefit from thejuicy yields.
JPM Plans to Issue New 10-Year Benchmark Issuance
05 May 2011
J.P. Morgan Chase (A+) is coming to market today with anew 10-year benchmark issuance. There are no details onexact size, but we expect the size to be over $1 billion. Theprice talk is 150 basis point area. Last October J.P. Morgan
Page 5 of 12

Business Risk Stress Test Solvency Score Distance To Default Economic Moat™ Industry Group Sector
Good Fair Fair Fair Narrow Banks Financial Services
JPMorgan Chase & Co JPM (NYSE) | A+
Morningstar Corporate Credit Research
© Morningstar. All Rights Reserved. Unless otherwise provided in a separate agreement, you may use this report only in the country in which its original distributor is based. The information contained herein is not represented or warranted to beaccurate, correct, complete, or timely. This report is for information purposes only, and should not be considered a solicitation to buy or sell any security. Redistribution is prohibited without written permission. To order reprints, call +1 312-696-6100.To license the research, call +1 312-696-6869.
Recent Notes from our Credit and Equity Analysts
came to market with another 10-year benchmark deal thatpriced in the 180 area, but that issuance has subsequentlytightened to the 140s. This new is issuance looks severalbasis points cheaper to the existing 10-year, and we expectit to trade well on the opening break. We remain positiveon J.P. Morgan from a credit perspective, as the firm remainswell capitalized with a solid balance sheet. For comparison,Bank of America's (A-) 10-year notes trade in the 175 area,and we believe the J.P. Morgan notes represent a slightlybetter value, given our better credit outlook for it.
J.P. Morgan Takes Mortgage Charge but Reports Stellar
First-Quarter Results 13 Apr 2011
J.P. Morgan JPM beat street and our expectations forthe first quarter, earning $1.28 per share. Investmentbanking, asset management, and treasury services resultswere all excellent. Credit cards continued to showimprovement. However, consumer banking results were hurtby a large one-time mortgage-related charge and continuedlosses from mortgage putbacks and loan losses. Overall, wewere pleased with the results and are maintaining our fairvalue estimate.
The bank recorded a $1.1 billion charge on its mortgageservicing asset. This is a result of a consent order from theOCC that will increase the expenses related to foreclosingon a home. Since the MSR asset is the capitalized futureincome J.P. Morgan expects to earn off of its $1 trillion ofserviced mortgages throughout the lives of the loans, thecharge looks large--but it is really the up-front recognitionof slightly higher expenses over several years. This is aone-time charge, and we are not concerned by the presenceof a consent order at the bank. In fact, every major lenderis likely to face similar charges when they report. The
consent order will help settle the robo-signing foreclosureproblems with regulators, but J.P. Morgan still faces thefines and settlement with the state attorneys general.
Credit quality continues to improve. Credit card losses weredown to 6.2% of average loans compared with 7.1% lastquarter, and prime mortgage net charge-offs were down to1.06% of average loans from an adjusted 1.56% last quarter.This improvement in losses and continued improvement indelinquencies allowed the bank to release $2.5 billion ofreserves during the quarter--primarily from its credit cardoperations.
Going forward, we think the bank must continue to gainmarket share to grow its balance sheet. Total loanscontracted once again, as consumer loan declines were notquite offset by commercial loan growth. We are pleasedwith the commercial loan growth; it is another positive signthat our economy is getting stronger. However, unless thebank can find a way to offset consumer payoffs with newloans, we think the bank will struggle to show anymeaningful growth despite its new branch building efforts.
Finally, we come to capital. J.P. Morgan increased its BaselIII Tier 1 common ratio by 30 basis points this quarter to7.3%. This rapid growth will be offset somewhat by thenewly increased $0.25 quarterly dividend and share buybackprogram. However, we suspect capital will continue toaccumulate on the balance sheet. Jamie Dimon promptlyshot down any hopes of a second dividend increase in 2011,which does not worry us. It just means that J.P. Morgan willhave plenty of room to give shareholders another largeincrease next year.
Page 6 of 12

Business Risk Stress Test Solvency Score Distance To Default Economic Moat™ Industry Group Sector
Good Fair Fair Fair Narrow Banks Financial Services
JPMorgan Chase & Co JPM (NYSE) | A+
Morningstar Corporate Credit Research
© Morningstar. All Rights Reserved. Unless otherwise provided in a separate agreement, you may use this report only in the country in which its original distributor is based. The information contained herein is not represented or warranted to beaccurate, correct, complete, or timely. This report is for information purposes only, and should not be considered a solicitation to buy or sell any security. Redistribution is prohibited without written permission. To order reprints, call +1 312-696-6100.To license the research, call +1 312-696-6869.
Recent Notes from our Credit and Equity Analysts
J.P. Morgan Raises Dividend, Plans $15 Billion Buyback
18 Mar 2011
J.P. Morgan JPM increased its quarterly dividend to$0.25 per share, up from just $0.05 after the successfulcompletion of its government stress test. The company,trading at a significant discount to our fair value estimate,also announced a $15 billion share repurchaseauthorization--with up to $8 billion eligible for use in 2011.We view this quite favorably, as repurchasing shares at adiscount should create considerable value for shareholders.At an annualized rate of $1 per share, the new dividendpayout ratio would be 17%, below the bank's long-rangetarget of 30%. Considering our assumption that the bank'snormalized earnings power is currently in the neighborhoodof $6.50--we assume the dividend will be able to reach the$2 during the next few years.
J.P. Morgan Reports 2010 Earnings 14 Jan 2011
J.P. Morgan Chase JPM earned $3.96 per share in 2010and $1.12 in the fourth quarter, once again showing it is oneof the top performers in the banking industry. The resultswere in line with our estimates, so we are leaving our fairvalue estimate unchanged. As credit losses have comedown, J.P. Morgan's core earnings power is shining through.While the firm is still burdened with several problemsrelated to the credit crisis, we expect its earnings to continueto rise throughout the next year.
J.P. Morgan took an additional $2.1 billion of credit reservesagainst the Washington Mutual portfolio, the result ofhigher losses in the home equity portfolio than the companyexpected when it purchased the portfolios from the FDIC in2008. On its Chase portfolio, the company released reserves,as we saw improvements in credit cards and autos.
J.P. Morgan added $1.5 billion to its litigation reserve for
mortgages in the quarter (after adding about $1 billion lastquarter) to account for the expected legal fighting overprivate-label putbacks. It appears to us that J.P. Morgan isgearing up to face the same type of pressure that Bank ofAmerica BAC is experiencing. J.P. Morgan and WashingtonMutual combined to issue $647 billion of private-labelmortgages. While these issues are likely to cause to a fewbillion of losses, it will be over the course of several years.
We believe the company has plenty of room to increaseits dividend; it already meets the 2019 levels under BaselIII. Having submitted its stress test, the bank is now waitingfor the results from the regulators, which are expectedsometime at the end of the quarter. Consequently, we expectJ.P. Morgan will announce a dividend raise in the secondquarter. We currently expect the rate to be somewhere near$0.25 per quarter.
Page 7 of 12

Morningstar Equity Research
© Morningstar. All Rights Reserved. Unless otherwise provided in a separate agreement, you may use this report only in the country in which its original distributor is based. Data as originally reported. The information contained herein is notrepresented or warranted to be accurate, correct, complete, or timely. This report is for information purposes only, and should not be considered a solicitation to buy or sell any security. Redistribution is prohibited without written permission. Toorder reprints, call +1 312-696-6100. To license the research, call +1 312-696-6869.
Last Price Fair Value Consider Buy Consider Sell Uncertainty Economic Moat™ Moat Trend™ Stewardship Morningstar Credit Rating Industry Group
40.45 USD 61.00 USD 36.60 USD 103.70 USD High Narrow Stable A A+ Banks
JPMorgan Chase & Co JPM (NYSE) | QQQQ
Dec 2008 Dec 2009 Dec 2010 Dec 2011 Dec 2012Net Interest Income 38,779 51,152 51,001 47,901 54,865Provision for Losses on Loans 20,979 32,015 16,639 5,449 6,350Net Interest Income after Provision 17,800 19,137 34,362 42,452 48,516
Non-Interest Income 26,913 48,172 48,728 50,445 50,525
Net Revenue 65,692 99,324 99,729 98,346 105,390Net Revenue After Provision (excluding Gains on Sale) 44,713 67,309 83,090 92,897 99,041Gains on Sale 1,560 1,110 2,965 1,200 1,200Net Revenue After Provision (including Gains on Sale) 46,273 68,419 86,055 94,097 100,241
Non-Interest Expense 43,500 52,352 61,196 62,611 64,083
Operating Income 1,213 14,957 21,894 30,286 34,958(excluding Gains on Sale)
Taxes -926 4,415 7,489 9,918 11,570Minority Interest, net of income taxes — — — 0 0Income after Taxes 3,699 11,652 17,370 21,568 24,587
Cumulative Effect of Accounting Change — — — 0 0After-tax Non-recurring Items -1,906 -76 — 0 0Discounted Operations — — — 0 0Preferred Dividends 674 — 1,606 1,677 1,677
Net Income attributable to common shareholders, 3,025 11,652 15,764 19,891 22,910Excluding All After-tax items
Net Income attributable to common 4,931 11,728 15,764 19,891 22,910shareholders, including all after-tax items
Average Diluted Shares Outstanding 3,733 3,942 3,977 3,977 3,977
Diluted EPS Excluding Charges 0.81 2.96 3.96 5.01 5.77Diluted EPS Including Charges 1.32 2.98 3.96 5.01 5.77
Morningstar Analyst Forecasts
Income Statement (USD Mil)Forecast
Page 11 of 16
Income Statement (USD Mil)
Business Risk Stress Test Solvency Score Distance To Default Economic Moat™ Industry Group Sector
Good Fair Fair Fair Narrow Banks Financial Services
JPMorgan Chase & Co JPM (NYSE) | A+
Morningstar Corporate Credit Research
© Morningstar. All Rights Reserved. Unless otherwise provided in a separate agreement, you may use this report only in the country in which its original distributor is based. The information contained herein is not represented or warranted to beaccurate, correct, complete, or timely. This report is for information purposes only, and should not be considered a solicitation to buy or sell any security. Redistribution is prohibited without written permission. To order reprints, call +1 312-696-6100.To license the research, call +1 312-696-6869.
© Morningstar. All Rights Reserved. Unless otherwise provided in a separate agreement, you may use this report only in the country in which its original distributor is based. The information contained herein is not represented or warranted to beaccurate, correct, complete, or timely. This report is for information purposes only, and should not be considered a solicitation to buy or sell any security. Redistribution is prohibited without written permission. To order reprints, call +1 312-696-6100.To license the research, call +1 312-696-6869.
Page 8 of 12
Morningstar Equity Research
© Morningstar. All Rights Reserved. Unless otherwise provided in a separate agreement, you may use this report only in the country in which its original distributor is based. Data as originally reported. The information contained herein is notrepresented or warranted to be accurate, correct, complete, or timely. This report is for information purposes only, and should not be considered a solicitation to buy or sell any security. Redistribution is prohibited without written permission. Toorder reprints, call +1 312-696-6100. To license the research, call +1 312-696-6869.
Last Price Fair Value Consider Buy Consider Sell Uncertainty Economic Moat™ Moat Trend™ Stewardship Morningstar Credit Rating Industry Group
40.45 USD 61.00 USD 36.60 USD 103.70 USD High Narrow Stable A A+ Banks
JPMorgan Chase & Co JPM (NYSE) | QQQQ
Earning Assets Dec 2009 Dec 2010 Dec 2011 Dec 2012
Cash and Due from Banks 26,206 27,567 29,348 30,962Interest Bearing Deposits at Banks 63,230 21,673 38,238 40,341Federal Funds Sold and Securities Borrowed 315,034 222,554 233,682 245,366or Purchased Under Agreement to ResellBrokerage Receivables — — 0 0Other Receivables (excluding interest — — 0 0receivables)Trading Assets 411,128 489,892 524,184 560,877Investment Securities Held to Maturity — — 0 0Investment Securities Available-for-Sale 360,390 316,336 338,480 362,173Financial Instruments Owned, at Fair Value — — 0 0(trading securities)Other Earning Assets 0 123,587 132,238 141,495Loans Held for Sale — — 0 0Loans and Leases 633,458 692,927 675,443 697,685 Unearned Discount — — 0 0 Allowance for Loan Losses -31,602 -32,266 -23,641 -19,186Net Loans and Leases 601,856 660,661 651,802 678,499
Premises & Equipment, Net 11,118 13,355 13,847 14,374Premises & Equipment, Gross 11,118 13,355 13,847 14,374 (Accumulated Depreciation) — — 0 0Interest Receivables 67,427 70,147 73,654 77,337Goodwill 48,357 48,854 48,854 48,854Identifiable Intangibles 4,621 4,039 3,274 2,595Deferred Tax Assets — — 0 0Other Non-Earning Assets (Other Real Estate 122,622 118,940 124,887 131,131Owned etc.)Total Assets 2,031,989 2,117,605 2,212,488 2,334,004
Liabilities Dec 2009 Dec 2010 Dec 2011 Dec 2012
Total Deposits 938,367 930,369 981,539 1,035,524 Customer Deposits 938,367 930,369 981,539 1,035,524Federal Funds Purchased and Securities Loaned 261,413 276,644 296,009 316,730or Sold under Agreements to RepurchaseBrokerage Payables — — 0 0Trading Liabilities 125,071 146,166 149,767 160,251Financial Instruments Sold, but not yet pur- — — 0 0chased at Fair ValueOther Payables 162,696 170,330 178,847 187,789 Short-Term Debt 97,534 92,672 91,268 95,796 Long-Term Debt 266,318 247,669 243,917 256,017 Additional Debt — — 0 0Total Short-Term, Long-Term 363,852 340,341 335,185 351,813and Other DebtDeferred Tax Liabilities — — 0 0Other Liabilities (bank acceptance outstanding, 15,225 77,649 81,531 85,608accrued expenses, etc.)Total Liabilities 1,866,624 1,941,499 2,022,878 2,137,714
Common Stock 4,105 4,105 4,105 4,105Paid-in Capital 97,982 97,415 97,415 97,415Retained Earnings 62,481 73,998 88,594 95,274Preferred Equity 8,152 7,800 7,800 7,800Treasury Stock -7,196 -8,160 -8,160 -8,160Accumulated Other Comprehensive Income -91 1,001 -91 -91Other Equity -68 -53 -53 -53Shareholders¡¯ Equity 165,365 176,106 189,610 196,290
Total Liabilities & Shareholders¡¯ Equity 2,031,989 2,117,605 2,212,488 2,334,004(including Minority Interest)
Morningstar Analyst Forecasts
Balance Sheet (USD Mil)
Non-Earning Assets Equity
Forecast Forecast
Page 12 of 16
Balance Sheet (USD Mil)
Business Risk Stress Test Solvency Score Distance To Default Economic Moat™ Industry Group Sector
Good Fair Fair Fair Narrow Banks Financial Services
JPMorgan Chase & Co JPM (NYSE) | A+
Morningstar Corporate Credit Research
© Morningstar. All Rights Reserved. Unless otherwise provided in a separate agreement, you may use this report only in the country in which its original distributor is based. The information contained herein is not represented or warranted to beaccurate, correct, complete, or timely. This report is for information purposes only, and should not be considered a solicitation to buy or sell any security. Redistribution is prohibited without written permission. To order reprints, call +1 312-696-6100.To license the research, call +1 312-696-6869.
© Morningstar. All Rights Reserved. Unless otherwise provided in a separate agreement, you may use this report only in the country in which its original distributor is based. The information contained herein is not represented or warranted to beaccurate, correct, complete, or timely. This report is for information purposes only, and should not be considered a solicitation to buy or sell any security. Redistribution is prohibited without written permission. To order reprints, call +1 312-696-6100.To license the research, call +1 312-696-6869.
Page 9 of 12
Morningstar Equity Research
© Morningstar. All Rights Reserved. Unless otherwise provided in a separate agreement, you may use this report only in the country in which its original distributor is based. Data as originally reported. The information contained herein is notrepresented or warranted to be accurate, correct, complete, or timely. This report is for information purposes only, and should not be considered a solicitation to buy or sell any security. Redistribution is prohibited without written permission. Toorder reprints, call +1 312-696-6100. To license the research, call +1 312-696-6869.
Last Price Fair Value Consider Buy Consider Sell Uncertainty Economic Moat™ Moat Trend™ Stewardship Morningstar Credit Rating Industry Group
40.45 USD 61.00 USD 36.60 USD 103.70 USD High Narrow Stable A A+ Banks
JPMorgan Chase & Co JPM (NYSE) | QQQQ
Company/Ticker Revenue (Mil) 2009 2010 2011(E) 2012(E) 2009 2010 2011(E) 2012(E) 2009 2010 2011(E) 2012(E)
Wells Fargo & Co WFC US 84,755 USD 4.2 4.1 3.8 4.0 55.3 59.5 62.2 60.6 47.7 47.2 47.4 47.5Citigroup Inc C US 85,601 USD 2.9 3.2 2.8 3.0 58.9 55.3 61.5 58.3 39.7 36.2 39.4 37.9Bank of America Corp DE BAC US 108,661 USD 2.9 2.9 2.7 2.8 55.0 63.5 69.9 64.8 60.0 52.6 53.9 53.2Average 3.3 3.4 3.1 3.3 56.4 59.4 64.5 61.2 49.1 45.3 46.9 46.2JPMorgan Chase & Co JPM US 99,729 USD 2.8 2.8 2.5 2.8 51.7 60.4 62.9 60.2 48.5 48.9 51.3 47.9
Company/Ticker Total Debt (Mil) 2009 2010 2011(E) 2012(E) 2009 2010 2011(E) 2012(E) 2009 2010 2011(E) 2012(E)
Wells Fargo & Co WFC US 212,384 USD 11.1 10.0 10.0 10.2 6.4 7.5 7.5 7.5 9.3 11.2 NA NACitigroup Inc C US 459,973 USD 12.2 11.7 10.9 12.3 6.5 6.9 7.6 6.5 11.7 12.9 NA NABank of America Corp DE BAC US 508,393 USD 9.6 9.9 9.3 8.8 4.5 5.9 6.5 7.2 10.4 11.2 NA NAAverage 11.0 10.5 10.1 10.4 5.8 6.8 7.2 7.1 10.5 11.8 NA NAJPMorgan Chase & Co JPM US 340,341 USD 12.3 12.0 11.7 11.9 5.3 5.6 6.0 6.0 11.1 12.1 NA NA
Company/Ticker Market Cap (Mil) 2009 2010 2011(E) 2012(E) 2009 2010 2011(E) 2012(E) 2009 2010 2011(E) 2012(E)
Wells Fargo & Co WFC US 148,465 USD 92.0 86.6 82.8 81.5 3.5 4.9 4.2 3.9 22.8 25.5 26.3 26.4Citigroup Inc C US 121,207 USD 66.5 72.0 70.3 68.5 4.1 4.5 4.4 4.1 54.5 56.0 55.9 56.4Bank of America Corp DE BAC US 112,881 USD 87.0 88.9 84.6 81.8 3.5 2.9 2.7 2.4 36.9 38.7 38.4 39.3Average 81.8 82.5 79.2 77.3 3.7 4.1 3.8 3.5 38.1 40.1 40.2 40.7JPMorgan Chase & Co JPM US 160,736 USD 64.1 71.0 66.4 65.5 5.2 4.8 4.5 4.5 57.9 50.9 52.6 53.1
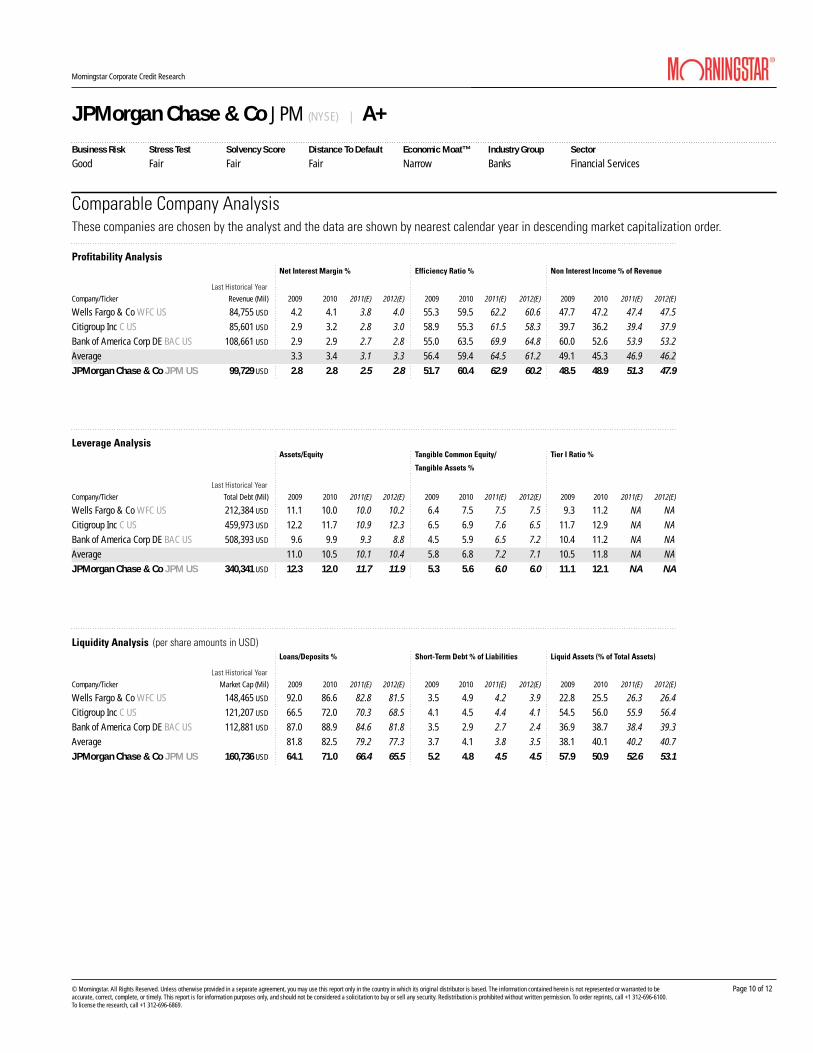
Comparable Company AnalysisThese companies are chosen by the analyst and the data are shown by nearest calendar year in descending market capitalization order.
Profitability Analysis
Leverage Analysis
Liquidity Analysis (per share amounts in USD)
Net Interest Margin % Efficiency Ratio % Non Interest Income % of Revenue
Assets/Equity Tangible Common Equity/
Tangible Assets %
Tier I Ratio %
Loans/Deposits % Short-Term Debt % of Liabilities Liquid Assets (% of Total Assets)
Last Historical Year
Last Historical Year
Last Historical Year
Page 14 of 16
Business Risk Stress Test Solvency Score Distance To Default Economic Moat™ Industry Group Sector
Good Fair Fair Fair Narrow Banks Financial Services
JPMorgan Chase & Co JPM (NYSE) | A+
Morningstar Corporate Credit Research
© Morningstar. All Rights Reserved. Unless otherwise provided in a separate agreement, you may use this report only in the country in which its original distributor is based. The information contained herein is not represented or warranted to beaccurate, correct, complete, or timely. This report is for information purposes only, and should not be considered a solicitation to buy or sell any security. Redistribution is prohibited without written permission. To order reprints, call +1 312-696-6100.To license the research, call +1 312-696-6869.
© Morningstar. All Rights Reserved. Unless otherwise provided in a separate agreement, you may use this report only in the country in which its original distributor is based. The information contained herein is not represented or warranted to beaccurate, correct, complete, or timely. This report is for information purposes only, and should not be considered a solicitation to buy or sell any security. Redistribution is prohibited without written permission. To order reprints, call +1 312-696-6100.To license the research, call +1 312-696-6869.
Page 10 of 12

Morningstar Corporate Credit Rating
3 Offers a proprietary measure of the credit qual-ity of companies on our coverage list.
3 Encapsulates our in-depth modeling and quantitative work in one letter grade.
3 Allows investors to rank companies by each of the four underlying com- ponents of our credit ratings, including both analyst-driven and quantitative measures.
3 Provides access to all the underlying forecasts that go into the rating, available through our insti-tutional service.
MethodologyWe feel it’s important to perform credit analysis through different lenses—qualitative and quantitative, as well as fundamental and market-driven. We therefore evaluate each company in four broad categories.
Business RiskBusiness Risk captures the fundamental uncertainty around a firm’s business operations and the cash flow generated by those operations. Key components of the Business Risk rating include the Morningstar Economic Moat™ Rating and the Morningstar Uncertainty Rating.
Stress Test Score™
Morningstar’s Bank Stress Test Score™ evaluates a bank’s ability to handle additional losses in its loan and securities portfolios. While based on the stress tests conducted under the Supervisory Capital Assessment Program, the Stress Test Score differs in two important ways. First, it is conducted on a rolling basis each quarter. Thus, it continually measures a bank’s ability to handle additional stress beyond any already recognized losses.
3
3
3
3
3
3
PurposeThe Morningstar Corporate Credit Rating measures the ability of a firm to satisfy its debt and debt-like obligations. The higher the rating, the less likely we think the company is to default on these obligations.
The Morningstar Corporate Credit Rating builds on the modeling expertise of our securities research team. For each company, we publish:
Five years of detailed pro-forma financial statements
Annual estimates of free cash flow
Annual forecasts of return on invested capital
Scenario analyses, including upside and downside cases
Forecasts of leverage, coverage, and liquidity ratios for five years
Estimates of off balance sheet liabilities
These forecasts are key inputs into the Morningstar Corporate Credit Rating and are available to subscribers at select.morningstar.com.
Morningstar’s Credit Methodology for Banks
Morningstar Research Methodology for Determining Corporate Credit Ratings
Competitive Analysis
Cash-Flow Forecasts
ScenarioAnalysis
Quantitative Checks
RatingCommittee
AAA
BBBC
D
BB
BCC
CCC
Analyst conducts company and industry research:
• Management interviews• Conference calls• Trade show visits• Competitor, supplier, distributor, and customer interviews• Assign Economic Moat™ Rating
Analyst considers company financial statements and competitive dynamics to forecast future free cash flows to the firm.
Analyst derives estimate of Stress Test Score™
Analysts run bull and bear cases through the model to derive alternate estimates of enterprise value.
Based on compet- itive analysis, forecasts, and scenario analysis, the analyst assigns Business Risk.
We gauge a firm’s health using quantitative tools supported by our own backtesting and academic research.
• Morningstar Bank Solvency Score™
• Distance to Default
Senior personnel review each company to determine the appropriate final credit rating.
• Review modeling assumptions• Approve company-specific adjustments
AAA Extremely Low Default Risk AA Very Low Default Risk A Low Default Risk BBB Moderate Default Risk
BB Above Average Default Risk B High Default Risk CCC Currently Very High Default Risk CC Currently Extreme Default Risk
C Imminent Payment Default D Payment Default
UR Under Review UR+ Positive Credit Implication UR- Negative Credit Implication
AAA
© Morningstar. All Rights Reserved. Unless otherwise provided in a separate agreement, you may use this report only in the country in which its original distributor is based. The information contained herein is not represented or warranted to beaccurate, correct, complete, or timely. This report is for information purposes only, and should not be considered a solicitation to buy or sell any security. Redistribution is prohibited without written permission. To order reprints, call +1 312-696-6100.To license the research, call +1 312-696-6869.
Page 11 of 12

Overall Credit RatingThe four component ratings roll up into a single prelim-inary credit rating. To determine the final credit rating, a credit committee of at least five senior research per-sonnel reviews each preliminary rating.
We review credit ratings on a regular basis and as events warrant. Any change in rating must be approved by the Credit Rating Committee.
Investor AccessMorningstar Corporate Credit Ratings are available on Morningstar.com. Our credit research, including detailed cash-flow models that contain all of the components of the Morningstar Corporate Credit Rating, is available to subscribers at select.morningstar.com.
Second, the Bank Stress Test Score utilizes Morningstar analysts’ forecasts of future pre-tax, pre-provision earnings and expenses for individual banks. Morningstar analysts also account for differences in underwriting standards and credit quality between banks by adjusting loss rates based on their assessments. The Stress Test Score is then based on a bank’s expected capital position at the end of a two-year period of elevated losses. As an absolute measure of capital, the average Bank Stress Test Score across our coverage universe will increase as total banking system capital increases, and will decrease when financial companies add leverage.
Bank Solvency Score™
The Morningstar Bank Solvency Score™ is a quantitative assessment of a bank’s health based on bank-specific accounting metrics. Much like the CAMELS rating utilized by bank regulators, the Bank Solvency Score measures a bank’s most recent performance in four key areas: capital adequacy, asset quality, earnings power, and liquidity.
Distance to DefaultThe Distance to Default rating is a quantitative, market-based measure of a company’s current financial health. (Distance to Default serves as the basis for Morningstar’s Financial Health Grade.) The underlying model treats the equity of a firm as a call option on that firm’s assets. Based on estimates of asset volatility and the Black-Scholes option-pricing model, we can estimate the likelihood that the value of the company’s assets falls below the value of its liabilities, implying likely default.
For each of these four categories, we assign a score, which we then translate into a descriptive rating along the scale of Very Good / Good / Fair / Poor / Very Poor.
Morningstar Corporate Credit Rating
Morningstar’s Credit Methodology for Banks
© Morningstar. All Rights Reserved. Unless otherwise provided in a separate agreement, you may use this report only in the country in which its original distributor is based. The information contained herein is not represented or warranted to beaccurate, correct, complete, or timely. This report is for information purposes only, and should not be considered a solicitation to buy or sell any security. Redistribution is prohibited without written permission. To order reprints, call +1 312-696-6100.To license the research, call +1 312-696-6869.
Page 12 of 12