jp1.15 advanced-tovs (a tovs) sound ing product s …
TRANSCRIPT

1
JP1.15 ADVANCED-TOVS (ATOVS) SOUNDING PRODUCTS
FROM NOAA POLAR ORBITING ENVIRONM ENTAL SATELLITES
Anthony L. Reale and Michael W. Chalfant
NOAA/NESDIS
Washington D.C.
Americo S. Allegrino, Franklin H. Tilley, Michael P. Ferguson and M ichael E. Pettey
Raytheon Technical Services Company/ITSS
Lanham, Maryland
1. INTRODUCTION
The National Oceanic and Atm ospheric
Administration deploys a fleet of civilian, polar
orbiting environmental satellites which provides
users and researchers with a suite of operational
atmospheric and environmental data. On May 13,
1998, the Advanced TIROS Operational Vertical
Sounder (ATOVS) instrument configuration
(Goodrum et al., 2000) onboard NOAA-15 was
successfully deployed into a m orning orb it,
followed by NOAA-16 into an afternoon orbit, on
Septem ber 21, 2000. The ATOVS sounders
consists of the 15-channel Advanced Microwave
Sounding Unit-A (AMSU-A), the 5-channel AMSU-
B, the 20-channel High-resolution Infrared
Radiation Sounder (HIRS/3), and the 6-channel
Advanced Very High Resolution Radiometer
(AVHRR/3). The following report summ arizes the
latest series of upgrades and current scientif ic
status of the National Environmental Satellite Data
and Information Service (NESDIS) operational
sounding products. The report also addresses the
requirement for ground truth, radiosonde
observations concurrent with each satellite, and
future plans to better meet user requirements.
2. CURRENT SYSTEM SYNOPSIS
Scientific procedures for process ing NESDIS
operational sounding, cloud (experimental),
radiation and ozone products for ATOVS are
briefly summarized below. These are divided into
Orbital and Offline processing systems. A more
detailed discussion is found in Reale, 2001 and at
the web site: http://poes.nesdis.noaa.gov
_______________________________________
* Corresponding author address: Anthony L.
Reale, 5200 Auth Rd, Suitland Md, 20746; em ail:
The Orbital processing system provides:
C Pre-processing,
C Contamination detection,
C First guess and retrieval for soundings, and
C Cloud, Radiation, and Total Ozone products.
Pre-processing steps include instrument
calibration, quality control (QC) of the sounder
measurements, attachment of ancillary data such
as terrain designation, Sea Surface Tem perature
and Numerical Weather prediction (NW P), the
spatial interpolation of the AMSU-A measurem ents
to the HIRS/3 field-of-view (FOV), and radiance
temperature adjustments such as limb correction
(Allegrino, 1999).
Contamination detection consists of the
identification of effects due to precipitation for the
AMSU measurements, and clouds for the HIRS/3
measurements. Cloud detection (Ferguson and
Reale, 2000) is particularly critical as it constrains
the use of the HIRS in subsequent first guess and
retrieval calculations.
The first guess is uniquely determined for
each sounding using a library search technique
(Goldberg, 1988). The libraries consist of
collocated radiosonde and satellite measurements,
sorted by geographical category (see Table 2, and
also Tilley et.al 2000) and are directly accessed
during orbital processing.
The generalized form for the library search is
given in equation (1):
D = ( R - Rk )t B-1 ( R - Rk ) (1)
where the superscript t indicates the matrix
transpose, -1 the inverse, and

2
D : scalar closeness param eter,
B : sounding channel radiance covariance
matrix; dimension (35 x 35),
R : adjusted, observed radiance temperature
vector; dimension (NA,i), and
Rk : adjusted, library radiance temperature vector;
dimension (NA,i).
The dim ension “35" for the B m atrix in
Equation (1) denotes the total number of sounder
channels available from ATOVS1, even though not
all are used. The dimension (NA,i) denotes the
specific channel combination used to compute D,
and the subscript “k” denotes the collocations
searched. The channel combination for a given
sounding varies depending on whether the
sounding type is clear or cloudy, and sea or non-
sea. The actual first guess temperature, moisture
and radiance temperature profiles for a given
sounding are computed by averaging the 10
closest collocations with the smallest D.
ATOVS soundings are retrieved using a
Minimum Variance Simultaneous solution
(Fleming, 1986), which is given by equation (2):
T - Tg = S A t ( A S At + N)-1 ( R - Rg ) (2)
where the subscript t indicates the matrix
transpose, -1 the inverse, and:
T: final soundings products vector, (133),
Tg: first guess products vector, (133)
S: first guess covariance m atrix, (133 x 133),
A: sounder channel weighting matrix, (35 x
133),
N: measurem ent uncertainty matrix, (35 x 35),
R: observed radiance temperature vector, (MA,j),
Rg : first guess radiance temperature vector,
(MA,j).
The product vector (T) includes 100 levels of
atmospheric temperature (1000mb to .1mb), 31
levels of moisture (1000mb to 200mb), and
surface data. The dimension 35 for the A and N
matrices denotes the available ATOVS channels;
not all are used. The dimension (MA,j) denotes the
specific channel com bination used to com pute
retrievals, depending on the sounding type. The S,
A and N matrices of the retrieval operator are pre-
computed offline and updated weekly, with nine
unique sets of matrices combined depending on
the sounding type and latitude.
The cloud products (Chalfant and Allegrino,
2001) are computed using a CO2 Slicing algorithm,
which is a slope-radiance technique for deriving
the cloud parameters. This technique is based on
the assumption that the observed radiance for any
channel is a linear function of the effective cloud
fraction which fa lls on a line between the tota lly
clear and the cloudy radiance (Yang et. al., 1996).
The algorithm uses the triple-pass approach
described by McMillin et. al.(1994) to calculate the
cloud products. The first and second iterations
calculate products based on HIRS channels 7 and
8, with the third iteration using a HIRS channel pair
based on the cloud top pressure. In all iterations,
the cloud top temperature and corresponding
derived sounding are used to determine the cloud
top pressure, with effects due to C02 attenuation
above the cloud accounted for in the second and
third iterations.
Cloud products are available per HIRS/3
Field-of-View (FOV), per sounding, and on one
equatorial degree global, grid fields. Cloud amount
summ ary tables, similar to Menzel et.al., 2001, and
based on the grid data are also produced daily.
The ATOVS derived cloud products consists of the
following parameters:
C Cloud Am ount (%),
C Cloud Top Pressure, and
C Cloud Top Temperature
Regression coefficients are used to predict
the clear sky tem perature (i.e., at the cloud top).
These coefficients are derived offline, using
selected HIRS and AMSU-A tropospheric channels
(unaffected by clouds) from clear sky FOV
(Chalfant and Allegrino, 2001). Coefficients are
produced for five (5) latitude zones, with linear
interpolation near latitude boundaries, and updated
weekly.
NESDIS also has a long history of providing
Outgoing Longwave Radiation (OLR) and clear-sky
Layer Cooling Rates (LCR) from its polar orbiting
satellites. The ATOVS system routinely provides
the following radiation parameters at each of the
HIRS/3 FOV and on grid:
1 AMSU-B is not included in current
ATOVS system, see Section 6.

3
C All Sky and Clear Sky OLR
C Clear Sky LCR1 (1000m b to 700m b),
C Clear Sky LCR2 (700mb to 500m b),
C Clear Sky LCR3 (500mb to 240mb), and
C Clear Sky LCR4 (240mb to 10mb)
OLR and LCR parameters are computed
using a fixed set of regression coefficients as
described in Ellingson et. al., 1994a and 1994b.
ATOVS Total Ozone is the final product
produced, and are derived at each sounding
location, except for cases of very thick, cold,
clouds, using a physical, two-layer, transmittance-
radiation model (Neuendorf fer 1996).
The Offline processing system com piles and
updates the respective data sets of sounder FOV,
and the collocated satellite and radiosonde
observations used to derive coefficients.
The sounder FOV observations used to
update the cloud parameter and cloud test
coefficients primarily consist of clear-sky HIRS
FOV which are sub-sampled from each operational
satellite on a daily basis. Samples are global, and
typically span the most recent 30 to 60 days.
The collocated radiosonde and satellite
observations, also updated daily, are directly used
in orbital processing to provide first guess
information, and are also the basis for computing
the retrieval coefficients and for products validation
(Tilley et al., 2000). Their use in product
process ing, referred to as “Tuning”, attempts to
compensate for the systematic differences among
the scientific algorithms, ground truth, and satellite
measurements, including seasonal changes and
instrument drift. The primary data set of
collocations used for these purposes is referred to
as the Matchup Data Base (MDB), which is
discussed later in Section 4.1.
3. RESULTS
The motivation for all scientific upgrades
developed by NESDIS is to enhance the
information content of the derived products in the
context of NW P and Climate applications.
Upgrades typically address improved consistency
in products relative to the sounder measurem ents
and ground truth, as well as expanded products,
such as the increased coverage and accuracy of
the global cloud products which are now available
experimentally. Selected results from NESDIS
operational product systems are discussed below,
as provided through the Environmental Data
Graphical Evaluation (EDGE) system, developed
at NESDIS in support of operational products
(Brown et.al., 1992).
The panels in Figure 1 illustrate the
information content of the NOAA operational
sounding products from ATOVS in the context of
NOAA’s Environmental Modeling Center (EMC)
NW P data. The upper two panels illustrate
difference fields for SATellite (NOAA-16)
operational soundings minus EMC’s NWP (6-hour
“Aviation” forecasts) for the (500 to 300mb) layer
mean virtual temperature, with the SAT-NW P tim e
differences constrained to be within 2 hours. The
middle two panels show EMC 400m b wind fields
(m/s) corresponding to the same periods, and the
lower panels illustrate concurrent AMSU-A channel
5 radiance temperature measurements (K) which
are sensitive to m iddle tropospheric tem perature.
The region displayed is the remote South Indian
Ocean region (see EMC panels for latitude and
longitude boundaries), on March 23, 2002 (left)
and 48 hours later on March 25 (right).
The high correlation between the maximum
400mb wind and the SAT-NW P departure patterns
demonstrates the potential value of the NW P-
independent, NESDIS sounding products to assist
forecasters in identifying developing storm
systems. This is the type of information which may
be compromised in conventional NW P systems
which assimilate radiance data based on a
forecast first guess (Derber and W u 1998). These
patterns are not artifacts of the SAT minus NWP
time differences, as the wave speed in Figure 1 is
approximately 20 kph, which given the less than 2-
hour time difference in observations is insufficient
to account for the observed patterns. Such cases
warrant further study to better understand the
implications of these signature SAT-NW P
difference patterns, found mainly in the vicinity of
weather transition zones (also see Reale 1995).
Over the past few years, a number of users
have expressed an increasing interest in Southern
Hemisphere sounding products including those
over Antarctica. Given its high terrain and global
isolation, generating products over Antarctica is
very challenging and requires some special
considerations. For example, the use of infrared

4
Figure 1: (SAT-NWP) differences (deg K) for the 500 to 300mb layer (upper), NWP W ind (m/s)
Analysis at 400mb (middle), and AMSU-A channel 5 (deg K) data (lower) over the
Indian Ocean on March 23, 2002 (left) and 48 hours later on March 25. (right).

5
observations and lower peaking m icrowave
sounding channels in this region has been found to
be prohibitive, and the sparsity of collocations
(radiosondes are mainly limited to coastal regions)
makes it difficult to operate and validate the
NESDIS algorithms over inland Antarctica. Recent
changes to further constrain the use of sounder
data from Antarctica, along with increased
monitoring of this region by NESDIS has
significantly im proved the product performance in
Antarctica, particularly above the 500mb level.
An example of the improved southern
hemisphere sounding products in polar regions is
shown in the three panels of Figure 2. This
illustrates AMSU-A channel 8, which is sensitive in
the vicinity of 200mb (upper left), the NESDIS,
derived 200mb temperature data from NOAA-16
and the corresponding terrain designation for the
Antarctica region. The derived soundings and
measurements show quite good agreement2, with
a relatively smooth transition across the sea, ice
and land boundaries3. Users are encouraged to
further consider the use of these data and to
provide feedback to NESDIS on performance.
Of particular interest are the global Grid data-
sets for Clouds, which were created to facilitate
com parisons with other sources of cloud products
(i.e., Menzel et.al., 2001). Grid data sets are
provided daily, per satellite, and for the ascending
and descending orbital node data, respectively.
After sorting the products by cloud top pressure
into High, Medium and Low cloud heights, the
values in each grid cell are computed as a
weighted average with respect to the effective
cloud amount (or fraction). The Cloud Height
Categories for grid data are:
C ALL (High. Medium and Low),
C HIGH, above 440mb,
C MEDIUM, from 440m b to 680mb, and
C LOW, below 680mb.
Figure 3 shows examples of the Grid data
sets for the experimental Cloud and Radiation
products, illustrating (clockwise beginning upper
left) the derived Cloud Top Pressure, Cloud Top
Tem perature, High Cloud Top Temperature4,
Clear-Sky Layer Cooling Rate for the 1000m b to
700mb layer, Outgoing Longwave Radiation
(OLR), and AVHRR channel 4. Very good
agreement is observed, for example, where the
locations of high clouds correspond with the lower
values of cloud top pressure, temperature and
AVHRR m easurem ent va lues.
NESDIS also provides “equal-area”, Cloud-
Am ount sum mary tables, again consistent with
Menzel et.al, 2001, on a daily basis which are
generated from the Grid data sets. Separate
tables are provided for:
C 6 pre-def ined latitude bands,
C two additional areas covering the continental
U.S.,
C ascending and descending orbital node, and
C each operational satellite.
The Cloud-Amount summ ary tables report the
cloud fraction for each of the Cloud Height
Categories (above), where the cloud fraction is the
average for all grids within a given latitude band,
Height, and Thickness (or Amount) categories5
defined as:
C ALL (Opaque, Thick, and Thin),
C OPAQUE, the Cloud Am ount (fraction) is
above 90%,
C THICK, the Cloud Am ount (fraction) is
between 90% and 50% ,
C THIN, the Cloud Amount (fraction) is less
than 50%.
2 Measurement and derived temperatures
exhibit different dynamic ranges making direct
color com parisons difficult.
3 NESDIS products in the past have
typically exhibited sharp discontinuities across the
south polar sea, ice and Antarctic coastal
boundaries.
4 Black regions (other than orbit gaps)
denote areas of Medium and Low Clouds.
5 Or effective emissivity, see Menzelet.al., 2001.

6
Figure 2: AMSU-A channel 8 (upper left) and corresponding 200mb derived temperature
fields (upper right) for NOAA-16, and the corresponding terrain characteristics
across the southern polar ocean, sea-ice and Antarctic regions (lower).

7
Figure 3: Experimental Cloud and Radiation Grid Products for NOAA-16 ATOVS, illustrating
(Clockwise beginning Upper Left) the derived Cloud Top Pressure, Cloud Top
Temperature, High Cloud Top Temperature, Clear Sky Layer Cooling Rate (1000mb
to 700m b layer), Outgoing Longwave Radiation, and AVHRR channel 4.

8
CLOUD PERCENTAGES FOR (60N - 30N)
ALL HIGH MED LOW
ALL 34.7 18.8 6.2 9.7
OPAQUE 11.7 8.0 0.4 3.3
THICK 15.6 8.0 3.8 3.8
THIN 7.4 2.8 2.0 2.6
CLOUD PERCENTAGES FOR (30N - EQUATOR)
ALL HIGH MED LOW
ALL 36.0 30.0 2.8 3.2
OPAQUE 11.5 10.4 0.2 0.9
THICK 16.1 13.6 1.1 1.4
THIN 8.4 6.0 1.5 0.9
Table 1: Examples of Daily Cloud-Amount summary tables for the 60N to 30N (upper) and
30N to Equator (lower) regions showing the average cloud fraction for ALL,
OPAQUE, THICK and THIN clouds, for ALL, HIGH, MEDIUM and LOW cloud top
pressure.
Table 1 (above) provides examples of Cloud
Amount summary tables for the 60N to 30N
(upper) and 30N to the Equator (lower) latitude
bands, respectfully. The values in Table 1 are
interpreted as the average percentage of
cloudiness for a given grid cell within the latitude
belt, cloud-height, and thickness category. For
example, on average, a given grid cell in the 60N
to 30N band was 34.7 % cloudy, with 18.8 %
covered by High clouds, 11.7 % by Opaque clouds,
and 8.0 % by High, Opaque clouds on the given
day.
4. GROUND TRUTH
4.1 Applications for NESDIS Sounding
Products
The requirement for ground truth, namely the
collocated radiosonde and satellite observations
compiled in support of the NESDIS sounding
product systems, is a critical element concerning
both the process ing and QC of the m easurem ents
and derived products provided by NESDIS (Tilley
et al., 2000 and Reale, 2001). Subsequently, the
QC of the collocations, and in particular the
radiosonde observations, is a major concern. The
lack of a dedicated, global program to provide
ground truth data in support of NOAA’s operational
polar satellites has compounded this concern and
(in the opinion of the authors) contributes a
sizeable component of the current problems
inhibiting the validation and use of polar products
in NWP and climate applications.
One of the basic problems confronting
NESDIS, which operates two operational polar
satellites with a s ix-hour orbital separation, is to
maintain a consistent data base of collocations for
use in the process ing and validation of products
for each satellite. This data base is referred to as
the MDB, which contain approximately 15,000
radiosonde and satellite collocations, stratified
am ong 23 geographical categories. The MDB is
updated daily, with approximately 75% overlap in
sample from week to week, with the most recent
data stored about 12 hours old, and the oldest up
to 104 days. The MDB is archived by the National
Climatic Data Center(NCDC).

9
Unfortunately, given that a majority of
radiosonde observations launch at the 0Z and 12Z
synoptic times, the collocations in support of each
satellite are typically mutually exclusive
(particularly over land), given the time window
constraints required for reliable observations.
The three panels of Figure 4 illustrate typical
24-hour, global distributions of collocations for
NOAA-15 (Upper) and NOAA-16 (Lower), as sub-
sampled from the MDB, and the corresponding
radiosonde observations that were available
(Middle). The notable differences in the satellite
distributions, particularly over (but not restricted to)
land, underscore the need for considering at least
a partial rededication of the global radiosonde
network to insure adequate, consistent, and global
ground truth in support of “each” polar satellite.
Otherwise, the use of collocation datasets in the
processing and validation of derived products, as
well for monitor ing the perform ance of the satellite
borne radiometers will be potentially biased.
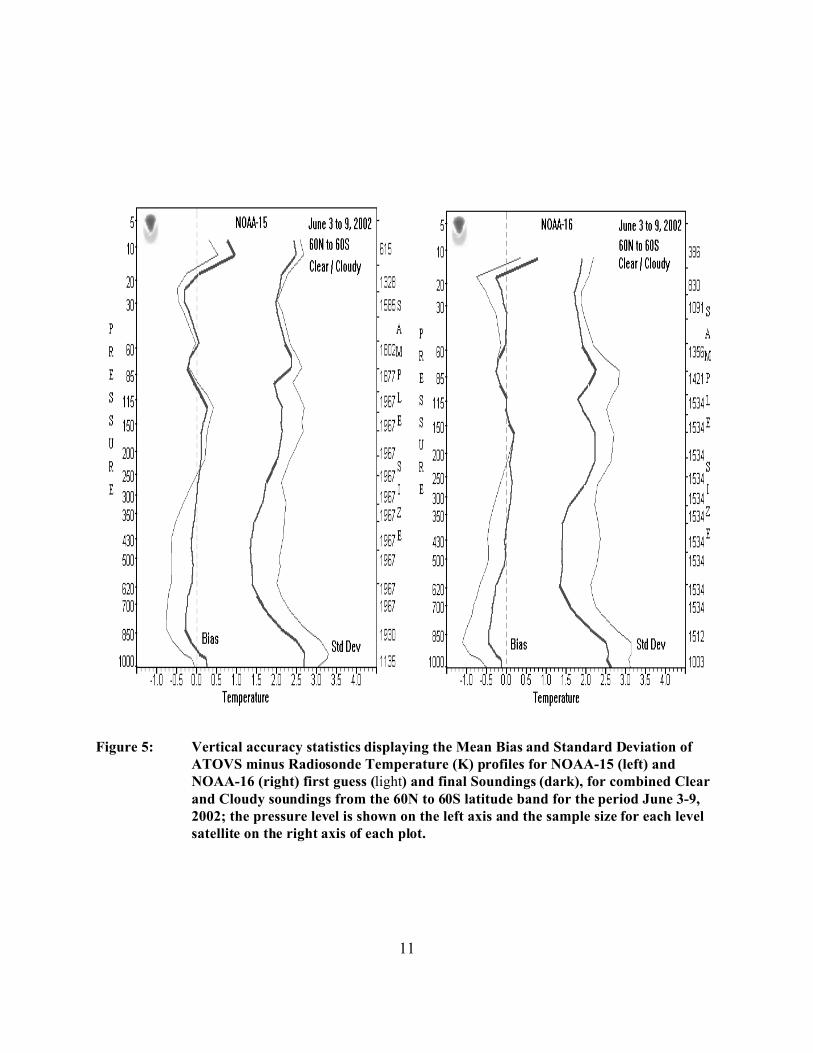
The two panels of Figure 5 illustrate the use
of the collocation data to validate the derived
sounding products for NOAA-15 (left) and NOAA-
16 (right). Each panel shows vertical plots of the
Mean and Standard Deviation of the Satellite
minus Radiosonde differences for the satellite
derived first guess (light) and sounding (heavy)
temperatures, with atmospheric pressure and
sample size indicated on the left and right vertical
axes, respectively. The collocations for computing
each set of curves are from the 60N to 60S
regions, for com bined clear and cloudy satellite
soundings and all terrains, spanning a 7-day
period in June, 2002. Although the curves for each
satellite are similar, there are some differences,
particularly near the surface and in the upper
atmosphere – likely due to sampling differences
as illustrated in Figure 4 – which ultim ately
reduces the reliability of comparing the accuracy of
the products (and measurements) from each
satellite using such statistics .
A series of actions by NESDIS over the past
few years has caused changes to QC procedures
for radiosonde data, particularly for moisture, and
adjustments of the time and distance windows
used to compile the MDB for each satellite.
The series of QC changes for the radiosonde
reports covered a range of problem areas
identified by NESDIS internal evaluations,
including the
C interpolation and extrapolation of moisture
prof iles through data gaps,
C handling of missing moisture for
temperatures below -40C,
C handling of “spikes” in observed dewpoint
depression prof iles,
C processing of reports with over 50 significant
levels, and
C the need for better diagnostics.
The radiosonde m oisture upgrades were
significant, since over 30% of the radiosonde
reports from the upper latitudes were being
screened due to incomplete moisture profiles,
even though the accompanying tem perature data
was complete into the stratosphere. Further study
indicated that in many cases there was enough
moisture information to provide a reasonable
interpolation and/or extrapolation of the radiosonde
moisture profile to 200mb, as required for the
NESDIS ATOVS soundings 6. However, it was
also noted that the resident technique for
extrapolating moisture profiles to 200mb, which
used a “constant Dewpoint Depression” approach,
was unreasonable, particularly in polar regions
where the tropopause is below 200mb. A new
extrapolation technique was developed based on a
“constant dew point temperature lapse rate”,
derived from the upperm ost levels of the moisture
report.
Programs to routinely monitor, and as
necessary to adjust the time and distance windows
used to compile the collocations for each satellite
are ongoing at NESDIS in an effort to m aintain
robust and consistent MDB sam pling distributions
per satellite over time, a challenge given the
mutually exclusive sampling tendencies as
illustrated in the upper and lower panels of Figure
4.
6 For example, groups of radiosondes stop
reporting moisture if the atmospheric temperature
falls below -40C.

10
Figure 4: Daily distributions of MDB collocations for NOAA-15 (upper) and NOAA-16 (lower),
and available Radiosondes (middle) as observed on July 28 and 29, 2002, with
collocations color coded based on the sounding type (Blue, sea; Brown, land;
Yellow, coast; Grey, ice; and White, snow), with Ship data in red.
11
Figure 5: Vertical accuracy statistics displaying the Mean Bias and Standard Deviation ofATOVS minus Radiosonde Temperature (K) profiles for NOAA-15 (left) andNOAA-16 (right) first guess (light) and final Soundings (dark), for combined Clearand Cloudy soundings from the 60N to 60S latitude band for the period June 3-9,2002; the pressure level is shown on the left axis and the sample size for each levelsatellite on the right axis of each plot.

12
CAT LAT TERR
Ascend/Descend 1 N Ice/Coast 2 Ice-45N Sea 3 45-30N Sea 4 30-15N Sea 5 15N-15S All 6 15-30S Sea 7 30-45S Sea 8 45S-Ice All 9 S Ice/Coast
NOAA-15 Clear Cloudy Samp (km) (hr) )t (km) (hr) )t
(day) (day)
350 125 3 104 70 3 56700 90 4 67 80 4 80650 70 5 59 90 5 52650 70 5 78 90 5 67650 60 3 55 60 3 34300 90 5 59 110 5 76300 100 5 97 100 5 80200 90 3 72 90 3 48200 100 3 104 90 3 65
NOAA-16 Clear Cloudy Samp (km) (hr) )t (km) (hr) )t
(day) (day)
425 90 3 88 70 3 50 600 80 4 30 80 4 42625 70 5 51 90 5 45525 80 5 53 100 5 46550 90 3 55 70 3 49400 90 5 48 100 5 66300 100 5 62 100 5 75250 110 3 97 100 3 76250 100 3 104 80 3 55
Ascending10 90-60N NonSea11 60-45N NonSea12 45-30N NonSea13 30-15N NonSea14 15-30S NonSea15 30-45S NonSea16 60-90S NonSea
225 125 3 100 60 2 55500 80 2 48 50 2 42550 50 2 34 40 2 34400 60 3 55 70 3 23150 70 3 23 100 3 34200 80 3 28 100 2 38 50 100 3 - 100 2 -
400 100 3 41 50 2 31500 60 2 27 40 2 44450 80 2 36 70 2 54400 80 3 48 100 3 63150 100 3 81 110 3 104150 110 3 100 110 3 104 25 100 3 - 100 2 -
Descending17 90-60N NonSea18 60-45N NonSea19 45-30N NonSea20 30-15N NonSea21 15-30S NonSea22 30-45S NonSea23 60-90S NonSea
225 125 3 90 80 2 48500 70 2 48 40 2 51550 60 2 34 40 2 41350 80 3 37 80 3 25125 100 3 35 100 3 76125 100 3 27 100 3 42 50 100 3 - 100 2 -
375 100 3 62 90 2 81500 60 2 48 40 2 27450 70 2 55 60 2 34350 100 3 61 100 3 60 150 110 3 104 110 3 104150 110 3 104 110 3 104 25 100 3 - 100 2 -
Table 2: Sampling characteristics of the ATOVS Matchup Data Base (MDB) showing the
geographical category (CAT), definitions (LAT and TERR), and the corresponding
sample size allocations (SAMP), time (hr) and distance (km) windows, and the time
periods ( )t ) spanned by the collocation sample w ithin each category. Data are
segregated for each operational satellite (NOAA-15 and NOAA-16) and sounding
type (Clear and Cloudy), and are a snapshot as observed on June 8, 2002.
Table 2 (above) shows the collocation
sampling constraints, consisting of the time (hr)
and distance (km) windows, and the sample size
allocations (SAMP) for compiling the radiosonde
and satellite collocations within each of the 23
geographical (LAT and TERR) categories (CAT).
Constraint criteria are separately defined for each
satellite, latitude region, sea and non-sea terrains,
and for clear and cloudy satellite soundings,
respectively.
The time periods ()t) spanned by the
collocation sample (or age of the oldest collocation
retained) in each category are also monitored and
shown7. As can be seen, the sample sizes
retained for a given category vary significantly in
proportion to the density of available radiosonde
observation, despite the significantly smaller
distance windows in the more radiosonde dense
regions. However, the corresponding time period
differences across the 23 categories is somewhat
more balanced.
7 The maximum age retained is 104days; categories indicating this age havesample sizes less than SAMP.

13
The observed sampling differences among
corresponding categories for each satellite largely
depends on the radiosonde launch (ie, typically
synoptic) versus the local satellite overpass times
(as shown in Figure 5), as well as diurnal and
regional differences in cloudiness.
4.2 Recommendations
Internationally coordinated efforts are needed
to both recognize and promote the very basic
requirement that reliable global radiosonde
observations are needed to support and validate
operational polar satellite measurement and
product programs. It is time to acknowledge that
the optimal use of radiosondes is shifting (has
shifted) from an initial requirement to provide
“synoptic” observations primarily in support of
NW P, to a evolving (m ore m odern) requirement to
provide observations collocated with the satellite
which are now providing a major component of the
data for NW P and climate applications. Such
actions m ust be taken carefully, and in full
consideration of ongoing, long-term climate
records and requirem ents for reg ional and local
weather forecasts.
Several actions are also needed to improve
the consistency of radiosonde reporting and
transmission practices across the global
comm unity. Although these issues have been
addressed in the past, m ore work is needed to
unify reporting practices around the world.
NOAA can also pave the way toward realizing
the significant benefits of a coord inated effort to
provide ground truth data for satellite observations
over the vast ocean regions of the earth. The
NOAA flagship scientif ic vessel, RONALD H
BROW N (RHB), which typically operates for over
250 days a year, provides both a radiosonde
launch and a polar satellite data reception
capability, along with other in-situ m easurem ents
capabilities (ie, for clouds, SST, etc). The RHB
represents a cost-effective and potentially valuable
resource for rem ote ocean sensing, which could
provide valuable real-time weather and c limate
research data, and greatly enhance our
understanding of ocean-atmosphere interactions
as portrayed by remote satellite observations.
5. CURRENT PRODUCTS LIST
Table 3 lists the ATOVS operational and
experimental products, with the ATOVS Product
types in column 1, beginning with the
radiometer/sounder measurements for each
AMSU-A, HIRS/3, AVHRR/3 and AMSU-B 8
channel, followed by the derived Temperature and
Moisture soundings, Outgoing Longwave
Radiation (OLR) and Layer Cooling Rates
(LCR), experimental Cloud products and Total
Ozone. The Units of measurement, product
Levels (or Layers), the nominal (at nadir)
Horizontal Resolution and additional Com ments
are tabulated for each Product.
Although the sounder measurements are not
strictly a derived product, the Calibrated
measurements, the series of radiometric
Adjustments , and the First Guess measurement
profiles computed in the NESDIS scientif ic
algorithm have become a focal point of user
interest over the past few years, along with the
First Guess profiles from which the soundings are
derived.
AVHRR channel measurements are available
on selected operational files, comprised of the 17
Global Area Coverage (Goodrum et.al. 2000)
pixels corresponding to the H IRS/3 FOV.
Many users receive and utilize secondary
derived products, that is, products derived from
the temperature and moisture soundings. The
secondary products routinely distributed by
NESDIS include the Geopotential height, Layer
Mean Virtual temperature and the Total and Layer
Precipitable Water (TPW and LPW ). Secondary
sounding products are typically computed for the
standard, mandatory pressure levels.
8 AMSU-B measurements and derived
sounding products are currently not available as
part of the ATOVS product suites, but are available
separately from NESDIS, with pending work
underway to integrate these measurem ents into
ATOVS.

14
ATOVS LEVELS HORIZONTAL
PRODUCT UNIT (LAYERS) RESOLUTION COMMENTS
AMSU-A o K 15 CHANNELS 50km Calibrated,Adjusted, andFirst Guess
HIRS/3 o K 20 CHANNELS 17km Calibrated,Adjusted, andFirst Guess
AVHRR/3 o K 6 CHANNELS 1.2km 17 Pixels @ HIRS/3
AMSU-B o K 5 CHANNELS 15km (See footnote 10)
TEMPERATURE Geopotential Virtual
o K M o K
40 @ 1000 - .1mb(18 @ 1000 -.1mb) (18 @ 1000 -.1mb)
35km Includes First Guess Secondary Secondary
MOISTURE: ATOVS AMSU-B TPW LPW
G/KG mm mm
17@ 1000 - 200mb15@ 1000 - 300mb (Total) (1000 - 700mb) ( 700 - 500mb) ( 500 - 300mb)
35km 15km
Includes First Guess
(See footnote-1) Secondary Secondary
OLR: ALL SKY CLEAR SKY
WATTS/M2 17km, GRID
CLEAR SKY LCR o K /DAY (1000 - 700mb) (700 - 500mb) (500 - 300mb) (300 - 100mb)
17km, GRID
CLOUD TOP:PRESSURETEMPERATURE
CLOUD AMOUNT
MB o K %
Low; > 680mb,Med, 440-680mb,High, < 440mb
17km, 35km, and GRID
Experimental
Opaque, > 90%Thick, 50 to 90%Thin, < 50%
OZONE DOBSON (TOTAL) 35km
Table 3: NESDIS Operational (and Experimental) Products

15
Horizontal Resolution is a diff icult
parameter to define, particularly for the ATOVS
sounders which are cross-track scanners with
variable resolution from one side of the orbit to the
other. In addition, the scientific processing
techniques typically involve spatial interpolations of
the sounder measurements (ie, for ATOVS all
measurements are interpolated to the HIRS). The
values listed for the horizontal resolution represent
estimates of nominal values (at nadir), typ ically
17km for the HIRS, 50km for the AMSU-A, FOV
(15km for AMSU-B), and 35km for derived
soundings.
Grid (GRID) data sets are also indicated for
several of the Radiation and Cloud products, these
are defined as 1 x 1 Degree fields.
All Cloud products are currently
Experimental and under evaluation for pending
operational approval. GRID data sets are also
segregated by cloud height (High, Med., Low).
6. FUTURE PLANS
A new series of scientific upgrades for
NESDIS derived sounding products are planned
for ATOVS over the next 2 years. The ultimate
goal of these upgrades is to derive products with
error characteristics that can be m ore easily
defined by potential NW P users, while remaining
independent of any particular NW P m odel.
The new upgrades planned by NESDIS
include:
C use of AMSU-B measurements in ATOVS for
the simultaneous com putation of temperature
and moisture soundings,
C replacement of the library search technique
for computing the first guess with an AMSU
based regression approach (Goldberg 1999),
C on-line use of radiative transfer (McMillin et
al., 1995) to retrieve each sounding,
C radiance bias adjustment of sounder
measurements used in retrieval,
C a convergence of “common” techniques
resident in NESDIS atmospheric and
microwave surface product programs (Grody
et al., 2001), and
C improved diagnostic capabilities to com pile
and evaluate collocated Satellite, NW P and
Radiosonde observations.
NESDIS will also be involved with the operational
implementation of ATOVS products from NOAA-17
and the efforts to prepare for the METOP and
NPOESS programs planned for 2005 and beyond.
7. SUMMARY
NESDIS provides routine sounding products
from the ATOVS sounder data onboard NOAA
operational polar sate llites. Results
demonstrating the information content of these
NESDIS weather products in the context of real-
time weather forecasting applications and global
weather analysis are presented. The report also
discusses the importance of ground truth
radiosondes collocated with polar satellite
observations in defining and maintaining both
measurements and derived product accuracy, and
problems with the current global radiosonde
network to m eet these requirements. The report
concludes with future plans, consisting of the
pending operational implementation of NOAA-M
satellite (successfully launched on June 24, 2002),
and a new series of ATOVS upgrades to utilize
AMSU-B data and to upgrade the NESDIS retrieval
approach.
8. REFERENCES
Allegrino, A., A.L. Reale, M.W. Chalfant and
D.Q.W ark, 1999: Application of limb
adjustment techniques for polar orbiting
sounding data. Technical Proceedings of the
10th International TOVS Study Conference,
Jan 26- Feb 2, Boulder, Colorado, USA., 1-
10.
Brown, C.E., Caldwell, J., Sief, K. Carey, R., and
Reale, A., 1992: EDGE: A pc based display
system for visualizing NOAA environmental
data. 8th International Conference on
Interactive Information and Processing
Systems for Meteorology, Oceanography and
Hydrology. Preprint Volume, AMS, Atlanta
Georgia.
Chalfant, M.W. and A.S. Allegrino, 2001:
Advanced TOVS (ATOVS) Experimental
Cloud Products Using HIRS/3 and AMSU-A
Measurements. Technical Proceedings of the
11th International TOVS Study Conference,
Sept 20-26, 2000, Budapest, Hungary.

16
Derber, J.C., and W .S.W u, 1998: The use of
TOVS cloud-cleared radiance in the NCEP
SSI analysis system. Mon. W ea. Rev., 126,
2287-2299.
Ellingson, R.G., D. Yanuk, H. Lee and A. Gruber,
1994a: Validation of a Technique for
Estimating Outgoing Longwave Radiation
from HIRS Radiance Observations. J.
Atmos.and Oceanic Technology, 11,357-365.
Ellingson,R.G., D. Yanuk, A. Gruber and A.J.Miller,
1994b: Development and Application of
Remote Sensing of Longwave Cooling from
the NOAA Polar Orbiting Satellites. J.
Photogramm etric Eng. Rem. Sens., 60, 307-
316.
Ferguson, M.P., and A.L. Reale, 2000: Cloud
detection techniques in NESDIS Advanced-
TOVS sounding products systems. 10th Conf.
on Satellite Meteorology and Oceanography,
9-14 January, Long Beach, CA
Fleming, H.E., D.S. Crosby, and A.C.
Neuendorf fer, 1986: Correction of sate llite
tem perature re trieval errors due to errors in
atmospheric transmittances. Journal of
Climate and Applied Meteorology, Vol 25, No.
6, 869-882.
Goldberg, M.D., 1999: Generation of retrieval
products from AMSU-A: methodology and
validation Technical Proceedings of the 10th
International TOVS Study Conf., Jan 26- Feb
2, Boulder, Colorado.
Goodrum, G, K.B. Kidwell, and W. W inston, 2000:
NOAA KLM users guide: September 2000
Revision. U.S. Department of Commerce,
NOAA, NESDIS, NCDC, Climate Services
Division, Satellite Services Branch, Suitland,
MD.
Goldberg, M, J. Daniels and H. Flem ing, 1988: A
method for obtaining an improved initial
approximation for the temperature/moisture
retrieval problem. Preprints, 3rd Conference
on satellite Meteorology and Oceanography,
Anaheim, Ca, 16-19.
Grody, N., J. Zhao, R. Ferraro, F. W eng, and R.
Boers, 2001: Determ ination of precipitable
water and cloud liquid water over ocean from
the NOAA 15 Advanced microwave sounding
unit. J. Geophysical Res. ,106, 2943-2953.
McMillin, L.M., L. Crone and T.J. Kleespies,
1995:Atmospheric transmittances of an
absorbing gas. 5. Improvements to the
OPTRAN approach. Appl. Optt., 34, 8396-
8399
McMillin, L.M., S.S. Zhou, and S.K. Yang, 1994:
An improved cloud retrieval algorithm using
HIRS2-MSU radiance measurements. J.
Appl. Meteor., Vol. 33, pp 195-211.
Menzel, W . P., D.P. W ylie and R.A. Frey, 2001:
Comparison of University of W isconsin HIRS,
MODIS and ISCCP D2 Cloud Studies.
Technical Proceedings of the 11th
International TOVS Study Conference, Sept
20-26,2000, Budapest, Hungary.
Neuendorffer, Arthur C., 1996: Ozone monitoring
with TIROS-N operational vertica l sounders .
Journal of Geophysical Research, Vol. 101,
No. D13, pp. 18,807-18,828.
Reale, A.L., 2001: NOAA operational sounding
products from advanced-TOVS polar orbiting
environmental satellites. NOAA Technical
Report NESDIS 102, U.S. Dept. of
Commerce, W ashington D.C., 61 pp.
Reale, A.L. 1995: Departures between derived
satellite soundings and numerical weather
forecasts: present and future. Tech.
proceeding of the 8th International TOVS
Study Conf., Queenstown, New Zealand, 395-
404.
Tilley, F.H., M.E. Pettey, M.P. Ferguson, and A.L.
Reale, 2000: Use of radiosondes in NESDIS
advanced-TOVS (ATOVS) soundingproducts.
10th Conference on Satellite Meteorology and
Oceanography, 9-14 January, Long Beach,
CA.
Yang,S.K.,S.S. Zhou,L. McMillin and K. Campana,
1996: Characteristics of the NOAA/NESDIS
Cloud Retrieval Algorithm Using HIRS-MSU
Radiance Measurements. J. Applied
Meteorology.