j.p. morgan global high yield & leveraged finance...
TRANSCRIPT

J.P. Morgan Global High Yield &
Leveraged Finance ConferenceFebruary 27, 2018
Gerry LadermanSenior Vice President
Finance, Procurement & Treasurer

1
Safe Harbor Statement
Certain statements included in this presentation are forward-looking and thus reflect our current expectations and beliefs with respect to certain current and
future events and anticipated financial and operating performance. Such forward-looking statements are and will be subject to many risks and uncertainties
relating to our operations and business environment that may cause actual results to differ materially from any future results expressed or implied in such
forward-looking statements. Words such as “expects,” “will,” “plans,” “anticipates,” “indicates,” “believes,” “estimates,” “forecast,” “guidance,” “outlook,”
“goals” and similar expressions are intended to identify forward-looking statements. Additionally, forward-looking statements include statements that do not
relate solely to historical facts, such as statements which identify uncertainties or trends, discuss the possible future effects of current known trends or
uncertainties, or which indicate that the future effects of known trends or uncertainties cannot be predicted, guaranteed or assured. All forward-looking
statements in this presentation are based upon information available to us on the date of this presentation. We undertake no obligation to publicly update or
revise any forward-looking statement, whether as a result of new information, future events, changed circumstances or otherwise, except as required by
applicable law. Our actual results could differ materially from these forward-looking statements due to numerous factors including, without limitation, the
following: general economic conditions (including interest rates, foreign currency exchange rates, investment or credit market conditions, crude oil prices,
costs of aircraft fuel and energy refining capacity in relevant markets); economic and political instability and other risks of doing business globally; demand for
travel and the impact that global economic and political conditions have on customer travel patterns; competitive pressures on pricing and on demand; demand
for transportation in the markets in which we operate; our capacity decisions and the capacity decisions of our competitors; the effects of any hostilities, act of
war or terrorist attack; the effects of any technology failures or cybersecurity breaches; the impact of regulatory, investigative and legal proceedings and legal
compliance risks; disruptions to our regional network; the ability of other air carriers with whom we have alliances or partnerships to provide the services
contemplated by the respective arrangements with such carriers; costs associated with any modification or termination of our aircraft orders; potential
reputational or other impact from adverse events in our operations, the operations of our regional carriers or the operations of our code share partners; our
ability to attract and retain customers; our ability to execute our operational plans and revenue-generating initiatives, including optimizing our revenue; our
ability to control our costs, including realizing benefits from our resource optimization efforts, cost reduction initiatives and fleet replacement programs; the
impact of any management changes; our ability to cost-effectively hedge against increases in the price of aircraft fuel if we decide to do so; any potential
realized or unrealized gains or losses related to any fuel or currency hedging programs; labor costs; our ability to maintain satisfactory labor relations and the
results of any collective bargaining agreement process with our union groups; any disruptions to operations due to any potential actions by our labor groups;
an outbreak of a disease that affects travel demand or travel behavior; U.S. or foreign governmental legislation, regulation and other actions (including Open
Skies agreements and environmental regulations); industry consolidation or changes in airline alliances; our ability to comply with the terms of our various
financing arrangements; the costs and availability of financing; our ability to maintain adequate liquidity; the costs and availability of aviation and other
insurance; weather conditions; our ability to utilize our net operating losses to offset future taxable income; the impact of changes in tax laws; the success of
our investments in airlines in other parts of the world; and other risks and uncertainties set forth under Part I, Item 1A., “Risk Factors,” of our Annual Report on
Form 10-K for the fiscal year ended December 31, 2017, as well as other risks and uncertainties set forth from time to time in the reports we file with the U.S.
Securities and Exchange Commission.

2
Set strong foundation in 2017
Rebanked Houston and expanded hub connectivity
Positive momentum in all regions going into 2018
Strong relative non-fuel CASM
Record breaking operational performance
2017
$6.76$7.02
Excluding special charges
Including special charges
Earnings per share, diluted1
1 For a GAAP to non-GAAP reconciliation, see Appendix A
3
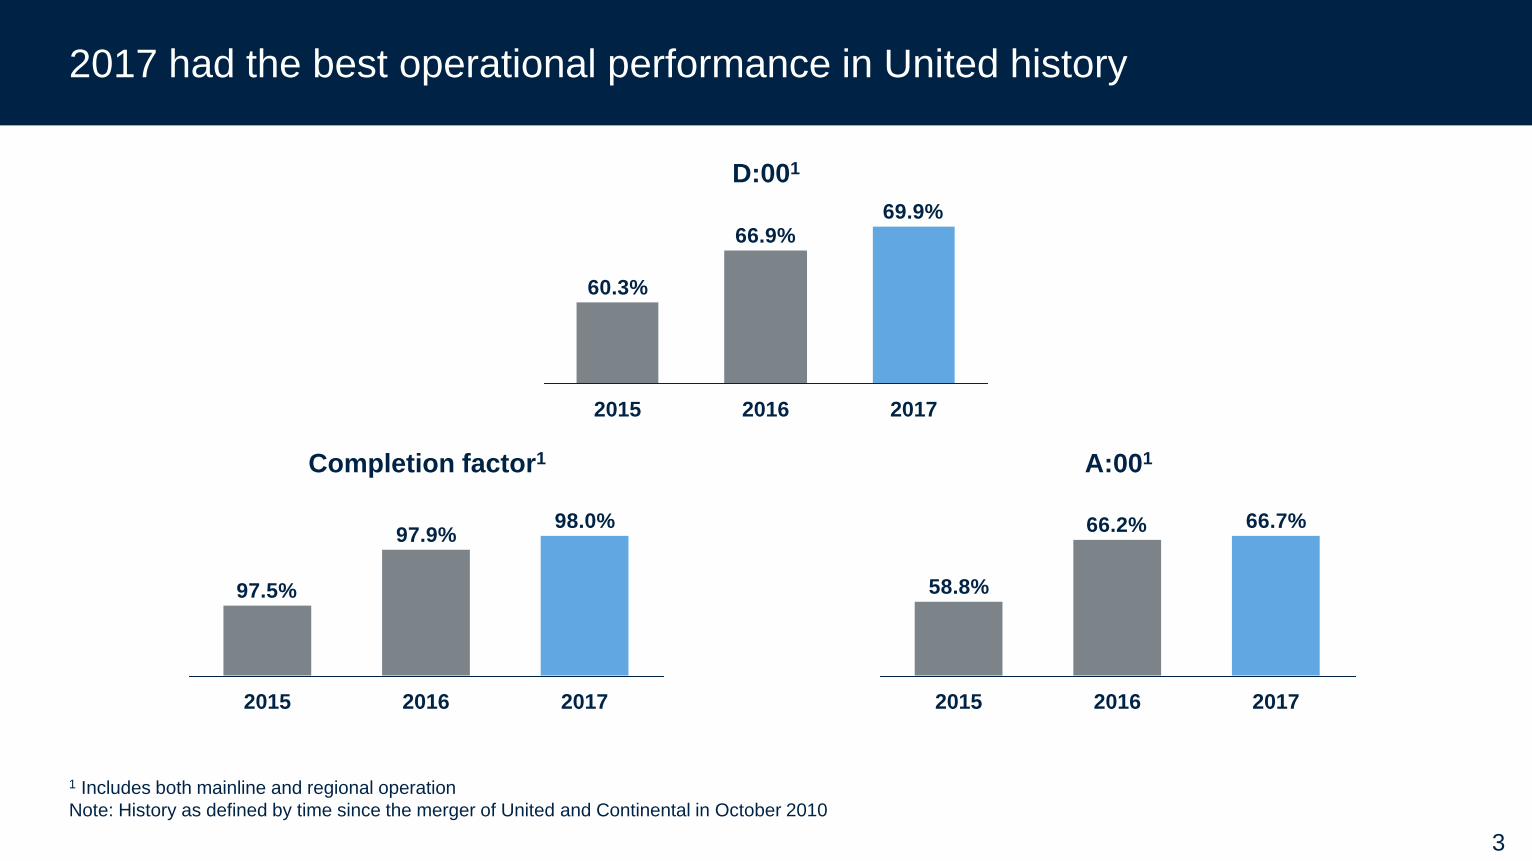
2017 had the best operational performance in United history
D:001
69.9%66.9%
60.3%
2015 2016 2017
Completion factor1
98.0%97.9%
97.5%
201720162015
1 Includes both mainline and regional operation
Note: History as defined by time since the merger of United and Continental in October 2010
A:001
66.7%66.2%
58.8%
201720162015

2018 Outlook

5
2018 priorities – continued top-tier operational reliability is the foundation
Strengthening our domestic network through growth
Driving efficiency and productivity
Continue investing in people, product and technology
Our strategy drives sustainably higher profits and margins
6
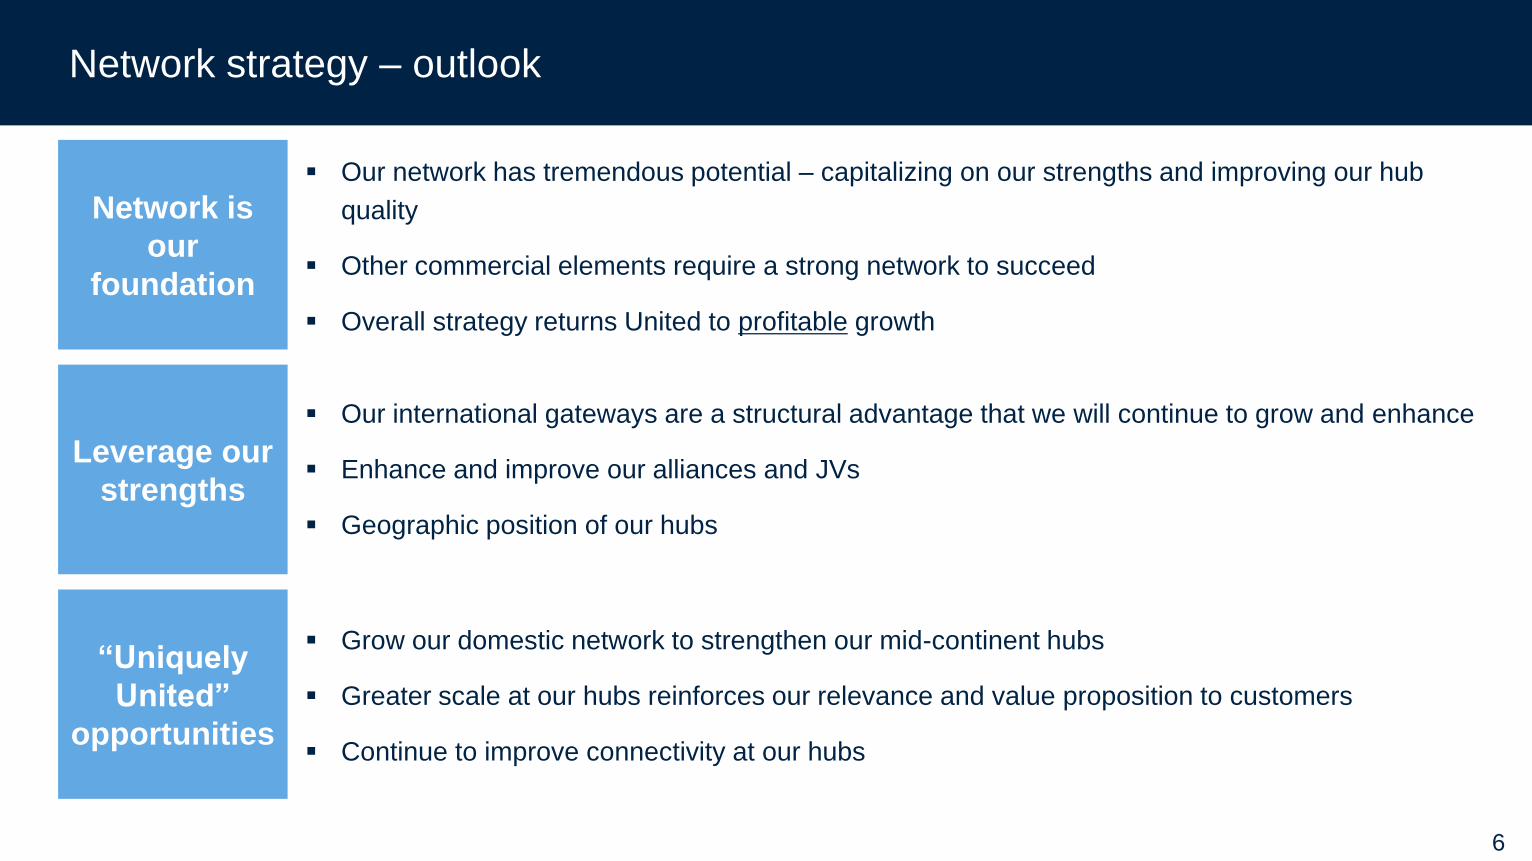
Network strategy – outlook
Network is
our
foundation
Leverage our
strengths
“Uniquely
United”
opportunities
Our network has tremendous potential – capitalizing on our strengths and improving our hub
quality
Other commercial elements require a strong network to succeed
Overall strategy returns United to profitable growth
Our international gateways are a structural advantage that we will continue to grow and enhance
Enhance and improve our alliances and JVs
Geographic position of our hubs
Grow our domestic network to strengthen our mid-continent hubs
Greater scale at our hubs reinforces our relevance and value proposition to customers
Continue to improve connectivity at our hubs
7
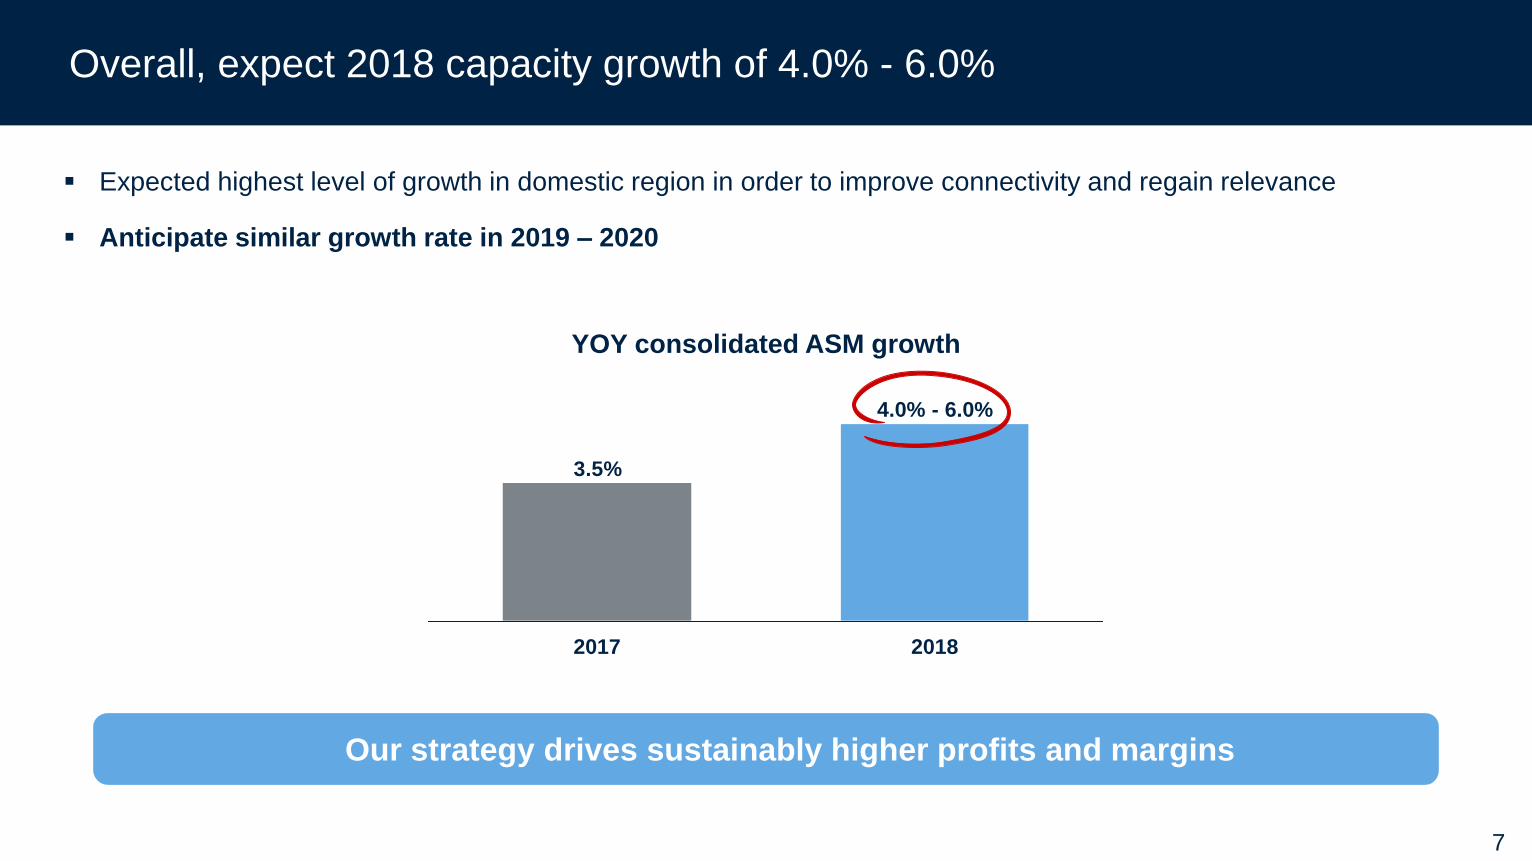
Our strategy drives sustainably higher profits and margins
Overall, expect 2018 capacity growth of 4.0% - 6.0%
Expected highest level of growth in domestic region in order to improve connectivity and regain relevance
Anticipate similar growth rate in 2019 – 2020
3.5%
2017 2018
4.0% - 6.0%
YOY consolidated ASM growth

8
Improving profitability while growing the network
Improve efficiency and productivity
Provide long-term CASM-ex1 guidance
Accountable for
higher profitability
Focus on CASM
Introduce 2018 EPS guidance
Introduce 2020 EPS target
A strong balance sheet is the foundation – maintaining $5B - $6B of liquidity
1 Non-fuel CASM (operating expense per available seat mile) excludes fuel, profit sharing, third-party business expenses and special charges, the nature
and amount of which are not determinable at this time

9
Improved asset utilization
Higher employee productivity
Aircraft lease to own
Increased operational efficiency given improved reliability
CASM and non-fuel CASM1
H/(L) YOY
Non-fuel CASM growth meaningfully lower in 2018 and beyond
Headwinds
Tailwinds
1 For a GAAP to non-GAAP reconciliation, see Appendix A
2.8%
2017 2018E
3.1%
Non-fuel CASM
CASM
(1.0%) - flat
Increased regional flying ~0.5 point 2018 headwind
Labor rate inflation
Airport costs
Technology investments
Expect 2019 and 2020 non-fuel CASM to be flat or better

10
Capital expenditures in 2018 expected to be $3.6B - $3.8B
24 scheduled aircraft deliveries in 2018
Opportunistic purchases of aircraft off-lease
Continue to invest in product, technology and
infrastructure
2019/2020 capex expected to be higher than 2018,
but below 2017
Adjusted capital expenditures1
($B)
$4.0
$4.7
$3.6 - $3.8
~($1.0)
2018E2017
1 For a GAAP to non-GAAP reconciliation, see Appendix A; 2017 GAAP capital expenditures were $4.0B
Non-GAAP
GAAP

Fleet Update

12
Fleet plan provides flexibility in an economic downturn
YE17 YE18 YE19 YE20
Fleet flexibilityBase fleet plan
Air
cra
ft c
ou
nt
Flexibility in mainline fleet(Aircraft at year-end)
Levers to manage fleet through 2020
~120
Includes:
~90 aircraft eligible to
return to lessor
Lease expirations
Used aircraft
Manage order book

13
Used aircraft are a lower risk and higher return way of supplementing growth
We can own two used A319 aircraft for less than what it costs to own one MAX 9 or MAX 10
– Lower risk profile
– Higher return on investment Ownership1
18yr NPV
Contribution1
18yr NPVIRR
One 737 MAX 9
Two used A319s2
~$48M
~$35M ~$44M
~$28M
21%
11%
H/(L) ~($13M) ~$16M ~10pts
vs.
1 Acquisition costs are based on public market data and do not represent the company’s actual costs2 Assumes two half-time aircraft

14
Airbus A350 order: turning questions into answers
As of the start of 2017, United had an order for 35 A350-1000 aircraft
This order was originally intended to replace the aging 747 fleet
First delivery had already been rescheduled once, from 2016 to 2018
In 2015, United ordered 777-300ER’s as the 747-400 replacement
- 777-300ER would deliver sooner than the A350-1000
- As a large 777-200ER operator, United was familiar with 777 capabilities
- 777-300ER offered attractive economics
Having found a 747-400 replacement, the question became: what to do with the A350-1000 order?

15
Too much range
Not
enough
range
Too small
Too big
Replacing the Boeing 777-200ER: two potential solutions
The A350-900 & 787-10 provide a solid tag-team 777-200ER replacement solution:
In terms of seat capacity, the A350-900 and 787-10 emerged as contenders
787-10 will sufficiently cover markets below 7,200sm while A350-900 will cover longer-range markets
Existing order for 35x A350-1000’s was used to fulfill this replacement need
777-300ER
A350-1000
787-10
777-200ER
777-8X
787-9
A350-900
200
220
240
260
280
300
320
340
360
380
6,500 7,000 7,500 8,000 8,500 9,000 9,500 10,000 10,500 11,000
Seats
Range (SM)

16
Airbus A350 order amendment – September 2017
Modifications to the Airbus A350 order:
Converted from the A350-1000 to the A350-900 to fulfill 777-200ER replacement needs
Increased the number of aircraft from 35 to 45 and retained flexibility to respond to changing market forces
Deferred entry into service from 2018 to 2022 – 4 year deferral aligns with ~25 year fleet age target
Improved overall economics of the aircraft & engines to be competitive on both short and long haul routes

17
Boeing 737 MAX 10 order – June 2017
United placed original order for 100 737 MAX 9 aircraft in 2012
- Order for 65 737-700 in 2016 would eventually be converted to 61 737 MAX 9 + 4 737-800
At the time of the order, the MAX 9 was the largest family variant at 179-seats in United’s configuration
In 2016, United teamed up with Boeing on the development of a stretched version of the MAX 9
- Initial concerns around takeoff performance, landing approach speeds, and range detriments
Boeing launched the MAX 10 in 2017, and United became a launch customer by converting 100 MAX 9
The MAX 10 achieves superior economics over the MAX 9
- The MAX 10 will have ~10 more seats, reducing unit costs and increasing revenue opportunities
- The MAX 10 will have similar takeoff performance, with only ~300 nm less range

18
Other anticipated upcoming fleet replacement decisions in near future
Near
term
target
Mid-long
term
target
• 737 MAX 10
• A321neo
• New Boeing product (?)
• 787-8
• A330-800neo
• Used A319 / A320
• A319neo / A320neo
• Used 737-700 / 737-800
• 737 MAX 7 / MAX 8
• E190 / 195 E2
• CS100 / CS300
Fleet to replace Replacement options
• 757-200/300
• 767-300ER
• A319/A320
• 737-700 / 737-800

Closing

20
Reaching financial targets will guide our long term network strategy
2020E
$11.00 - $13.00
2018E
$6.50 - $8.50
Target earnings per share, diluted2
1Compound annual growth rate2Excludes special charges, the nature of which are not determinable at this time. Accordingly, the company is not providing earnings guidance on a GAAP basis
Note: 2018 EPS estimates based on fuel forward curve as of January 18, 2018, with all-in fuel price of $2.11/gallon for 2018 and includes share repurchase; 2020 EPS
estimate based January 18, 2018 forward curve, with all-in fuel price of $1.94/gallon for 2020 and includes share repurchase
Target ~25% CAGR1 EPS from 2018 through 2020

21
Closing
Strengthening our hubs is a critical foundation to maximize profitability
Driving revenue improvements from all areas of business
Improving efficiency and productivity
Greater accountability and transparency
– Moving to annual guidance with 2018 EPS range
– Providing multi-year network growth strategy, underpinned by commitments on long-term costs
and 2020 EPS target
Our strategy drives sustainably higher profits and margins


23
Appendix A: reconciliation of GAAP to Non-GAAP financial measures
Year Ended
December 31,
Earnings per share, excluding special charges 2017
Diluted earnings per share $7.02
Less: special charges and hedge adjustments 0.58
Less: tax effect related to special charges and hedge adjustments (0.84)
Diluted earnings per share, excluding special charges and reflecting hedge
adjustments (Non-GAAP) $6.76
UAL evaluates its financial performance utilizing various accounting principles generally accepted in the United States of America (GAAP) and Non-GAAP financial measures including net earnings
(loss) per share excluding special charges. UAL believes that adjusting for special charges is useful to investors because special charges are non-recurring charges not indicative of UAL’s
ongoing performance. For additional information related to special charges, see the press release issued by UAL dated January 23, 2018, filed on that date with the SEC as Exhibit 99.1 to UAL’s
Form 8-K.

24
Appendix A: reconciliation of GAAP to Non-GAAP financial measures (continued)
Cost per available seat mile (CASM) is a common metric used in the airline industry to measure an airline’s cost structure and efficiency. UAL reports CASM excluding profit sharing, third-party
business expenses, fuel, and special charges. UAL believes that adjusting for special charges is useful to investors because special charges are non-recurring charges not indicative of UAL’s
ongoing performance. UAL believes that excluding third-party business expenses, such as maintenance, ground handling and catering services for third parties, fuel sales and non-air mileage
redemptions, provides more meaningful disclosure because these expenses are not directly related to UAL’s core business. UAL also believes that excluding fuel costs from certain measures is
useful to investors because it provides an additional measure of management’s performance excluding the effects of a significant cost item over which management has limited influence. UAL
excludes profit sharing because this exclusion allows investors to better understand and analyze our recurring cost performance and provides a more meaningful comparison of our core operating
costs to the airline industry.
Year Ended
December 31%
Increase/
(Decrease)Non-Fuel CASM Consolidated (¢/ASM) 2017 2016
Cost per available seat mile (CASM) 13.05 12.70 2.8
Less: Special charges (a) 0.07 0.25 NM
Less: Third-party business expenses 0.10 0.10 -
Less: Fuel expense 2.64 2.29 15.3
CASM, excluding special charges, third-party business expenses and
fuel (Non-GAAP) 10.24 10.06 1.8
Less: Profit sharing per available seat mile 0.13 0.25 (48.0)
CASM, excluding special charges, third-party business expenses, fuel,
and profit sharing (Non-GAAP) 10.11 9.81 3.1
(a) For additional information related to special charges, see the press release issued by UAL dated January 23, 2018, filed on that date with the SEC as Exhibit 99.1 to UAL’s Form 8-K.
(b) Excludes special charges. While the Company anticipates that it will record such special charges throughout the year in 2018, at this time the Company is unable to provide an estimate of these charges with reasonable
certainty.
(c) Both the cost and availability of fuel are subject to many economic and political factors and are therefore beyond the Company’s control.
Consolidated Unit Cost (¢/ASM) FY 2017 Estimated FY 2018
Consolidated CASM Excluding Special Charges (b) 12.98 13.15 - 13.37
Less: Fuel (c), Profit Sharing and Third-Party Business Expense 2.87 3.14 - 3.26
Consolidated CASM Excluding Fuel, Profit Sharing, Third-Party Business Expense and Special Charges 10.11 10.01 - 10.11

25
Appendix A: reconciliation of GAAP to Non-GAAP financial measures (continued)
UAL believes that adjusting capital expenditures for assets acquired through the issuance of debt and capital leases, airport construction financing and excluding fully reimbursable projects is
useful to investors in order to appropriately reflect the non-reimbursable funds spent on capital expenditures. UAL also believes that adjusting net cash provided by operating activities for
capital expenditures and adjusted capital expenditures is useful to allow investors to evaluate the company’s ability to generate cash that is available for debt service or general corporate
initiatives.
Year Ended
December
31,
Capital Expenditures (in millions) 2017
Capital expenditures $ 3,998
Property and equipment acquired through the issuance of debt and capital leases 935
Airport construction financing 42
Fully reimbursable projects (246)
Adjusted capital expenditures – Non-GAAP $ 4,729