j.p. morgan 8th annual global emerging markets …. morgan 8th annual global emerging markets...
TRANSCRIPT

J.P. Morgan 8th Annual
Global Emerging Markets Corporate ConferenceSouth Beach, FL.
February 27–March 1, 2017

1
2
3
EPM Highlights
Corporate Overview
Corporate Strategy
Agenda
4
5
6
Main Infrastructure Projects
Key Acquisition
Financial Highlights

1. EPM highlights
Colombia’s largest multi-services utility company with presence in Central America, Mexico and Chile.
Market leader in key segments, with an unmatched, vertically-integrated business model and an
outstanding operational track record.
Quasi-sovereign, 100% owned by the Municipality of Medellin with a strong corporate governance model.
Stable regulatory environment, transparent and supportive of market participants.
Investment grade ratings from Moody’s and Fitch (Baa3/BBB)
3

2. Corporate Overview
4
EPM has administrative and budgetaryautonomy from the municipality of
Medellin.
We are a Colombian Multi-Latin
economic group owned by the
municipality ofMedellin
We provide comprehensive solutions in the fields of:
Electricity
Water
Natural Gas
Telecommunications (as UNE shareholder)
Solid waste management
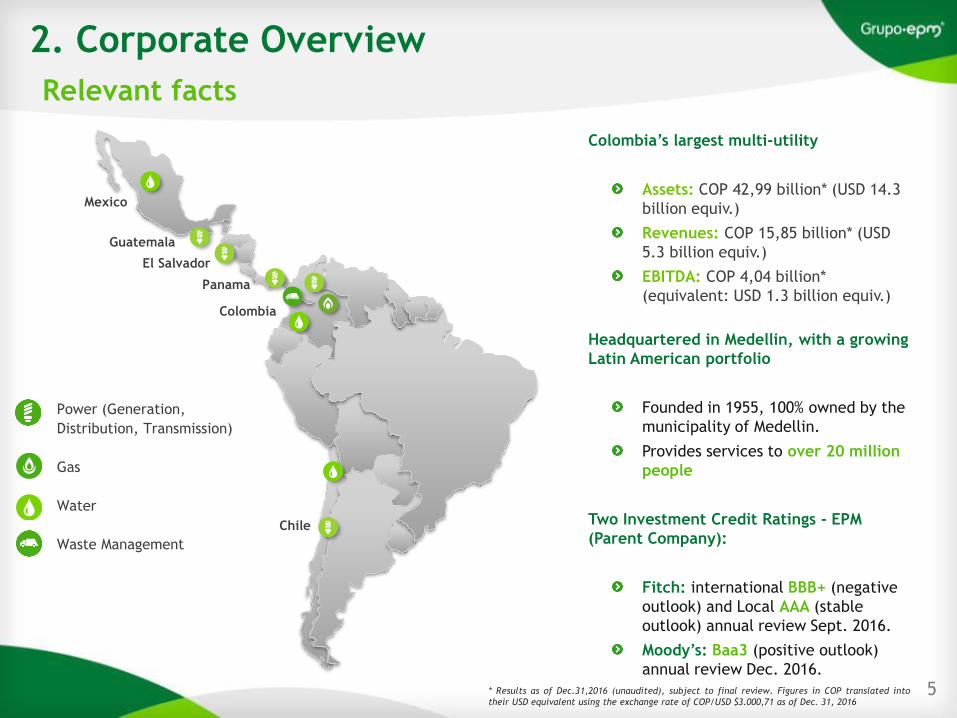
Colombia’s largest multi-utility
Assets: COP 42,99 billion* (USD 14.3
billion equiv.)
Revenues: COP 15,85 billion* (USD
5.3 billion equiv.)
EBITDA: COP 4,04 billion*
(equivalent: USD 1.3 billion equiv.)
Headquartered in Medellin, with a growing
Latin American portfolio
Founded in 1955, 100% owned by the
municipality of Medellin.
Provides services to over 20 million
people
Two Investment Credit Ratings - EPM
(Parent Company):
Fitch: international BBB+ (negative
outlook) and Local AAA (stable
outlook) annual review Sept. 2016.
Moody’s: Baa3 (positive outlook)
annual review Dec. 2016.
Colombia
Chile
El Salvador
Mexico
Guatemala
Panama
Power (Generation,
Distribution, Transmission)
Gas
Water
Waste Management
2. Corporate Overview
* Results as of Dec.31,2016 (unaudited), subject to final review. Figures in COP translated into
their USD equivalent using the exchange rate of COP/USD $3.000,71 as of Dec. 31, 20165
Relevant facts
6
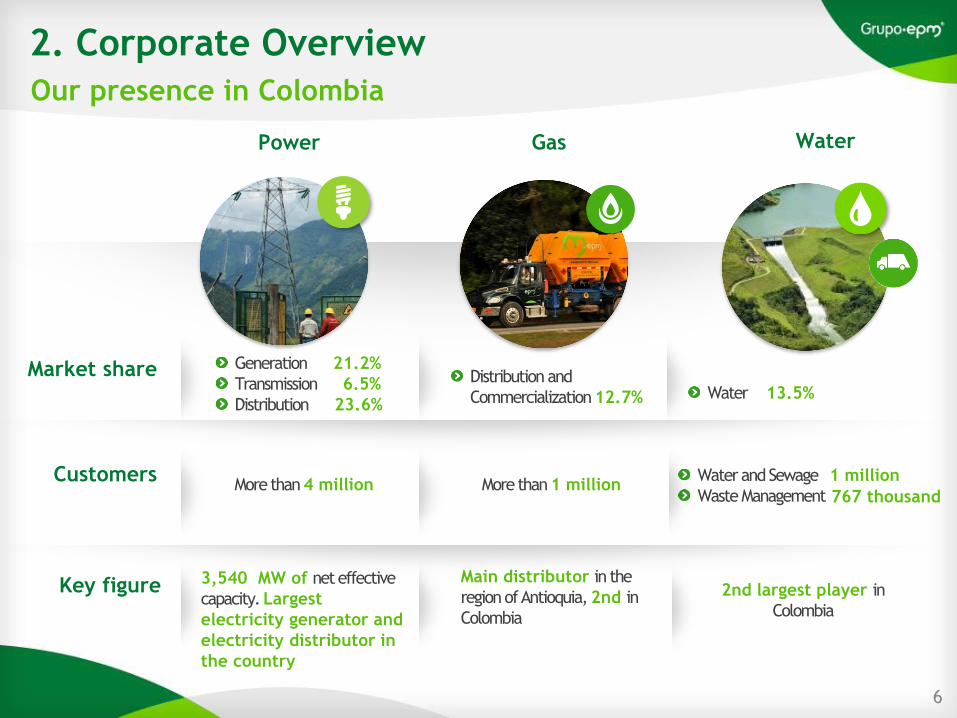
Our presence in Colombia
6
Power Gas Water
Customers
Key figure
Generation 21.2%
Transmission 6.5%
Distribution 23.6%
Market share Distribution and
Commercialization 12.7%
3,540 MW of net effective
capacity. Largest
electricity generator and
electricity distributor in
the country
More than4 million More than1 million
Main distributor in the
regionof Antioquia, 2nd in
Colombia
2nd largest player in
Colombia
Water 13.5%
Waterand Sewage 1 million
WasteManagement 767 thousand
2. Corporate Overview

7Our presence in Latin America
7
DELSUR, 2nd
power
distribution
company. Market
share: 28%.
EEGSA, COMEGSA,
TRELEC: power
distribution,
commercialization
and transmission.
1st power
distribution
company. Market
share: 44%
TICSA, wastewater
treatment, 11 plants
in operation.
ENSA, 2nd power
distribution
company. Market
share: 39.8%.
HET: hydro
generation, 30MW.
LOS CURUROS:
WindGeneration 110MW.
ADASA: 2.55 m3/seg (34%
sea water) Owns the largest
desalination plant in Latin
America,940 L/s.
Panama El SalvadorGuatemala MexicoChile
Key figure – amount invested (USD million):
116 63152
314
ENSA
HET
635238Los Cururos
ADASA 991
Total invested: USD 2.509 million
Credit ratings:
International rating:
ENSA: BBB (Fitch R.)Local rating:
AA- (Fitch R.)
ADASA local rating:
AA- (Fitch R. and Humphreys)
2. Corporate Overview
TICSADECA DELSUR

Colombia
Chile
El Salvador
Mexico
Guatemala
Panama
Power (Generation, Distribution,
Transmission)
Gas
Water
Waste Management
2. Corporate Overview
TICSA -11 wastewater
treatment plants ( 9,740 lps)
HET -Bonyic Power Plant (32 MW)ENSA - Distribution Lines (11,336 km), 15 power substations,
28,777 power distribution transformers.
Los Cururos
Wind power park (110 MW)
29 hydroelectric power plants (3,056 MW)
3 thermal power plants (544 MW)
1 wind power park (19 MW)
Potable water network (300 km)
ADASA – 2 residential water
desalination plants (945 lps)
2 potable water plants (1235 lps)
DELSUR- T&D Lines (10,607 km)
EEGSA- T&D Lines (16,271 km)
T&D Lines (193,694 km)
EPM and national subsidiaries
29 potable water plants
Potable water network (4,585 km)
Sewage networks (4,983 km)
1 wastewater treatment plant (1,800 lps)
Collection, transport and final disposal of waste
(1,800 tons per day)
1 Landfill for solid waste final disposal
125 trucks
321 Power substations
250,604 Power distribution transformers
27 Power substations
21,270 Power distribution transformers
76 Power substations
66,789 Power distribution transformers
Gas natural distribution network (7,152 km)
16 Gas service stations
Business Infrastructure
8

3. Corporate Strategy2025 EPM’s great milestone
9
By 2025, EPM Group will be growing in an efficient, sustainable and
innovative way, guaranteeing access to the services rendered by it in
the territories where it is present to 100% of the population,
protecting 137,000 new hectares of water basins, with a carbon
neutral operation, and generating EBITDA of COP 12.6 billion.

Largest hydro-generation power plant in Colombia 2.400 MW /8.563 GWh/year
17% of total Colombian installed capacity in 2022
4.Main Infrastructure ProjectsItuango Hydroelectric Generation Plant
Location
Northwestern
Antioquia
Area of influence
12 municipalities
Colombia
Antioquia
Key contracts with top construction firms
• Main civil works: Consortium: Camargo Correa SA,
Conconcreto SA and Coninsa Ramon H SA.
• Turbines, generators: Alstom.
• Transformers: Siemens Transformer Co. Ltd.
10
• Total cost: COP 11,44 billion (USD 3.8
billion equiv.)
• Start of operation:
1st Stage (1.200 MW) November 2018
2nd Stage (1.200 MW) March 2022

Ituango Hydroelectric Generation Plant
4. Main Infrastructure Projects
Total work progress as of Dec. 2016: 63.8%
The Power-House:
1st Stage -
Assembly of the
equipments
(turbines and
generators).
11
Progress in main civil works:
The Dam, 225 m high with 20 million m3 of rock
is at 47% of construction.
The Spillway, (a channel to control river floods
of more than 22,600 m3/s of water and whose
construction means excavating 14 million m3 of
rock) is at 81% of construction.
The Power house, (a 250 m long and 49 m high
cavern equivalent to a 16-story building) was
concluded.
Progress in power generation equipments:
1st Stage equipments: 4 turbines of 300 MW
each, 4 generators of 336 MVA each and 12
transformers of 112 MVA each.
• The manufacture of the equipments is at 100%, the
assembly of the turbines and generators at 33%,
and the assembly of the transformers at 60%.
The manufacture of the 2nd Stage began.The 12
transformers of
the 1st Stage are
already located at
the Transformer
Cavern.

Ituango Hydroelectric Generation Plant
4. Main Infrastructure Projects
External Civil Works: spillway and dam.
12
Financing strategy: 60% debt, 40% equity.
Financing allocated to date (including IDB-IIC loan
agreement under negotiation): COP 5.5 billion
• Represents 48% of the project's total cost.
• Represents 79% of the estimated debt.
Disbursed: COP 3.2 billion.
Details of Loans Agreements already subscribed or
under negotiation COP 5.5 billion
Local bonds: COP 867,280 million
Global COP bonds: COP 965,745 million
Club Deal: USD 450 million
BNDES: USD 111 million (subscribed on Apr.26, 2016)
EDC: USD 135 million (subscribed on Aug.4, 2016)
o IDB-IIC: USD 550 million (under negotiation)
Total cost: COP 11.4 billion (invested 2011-2016: COP 5.7 billion)
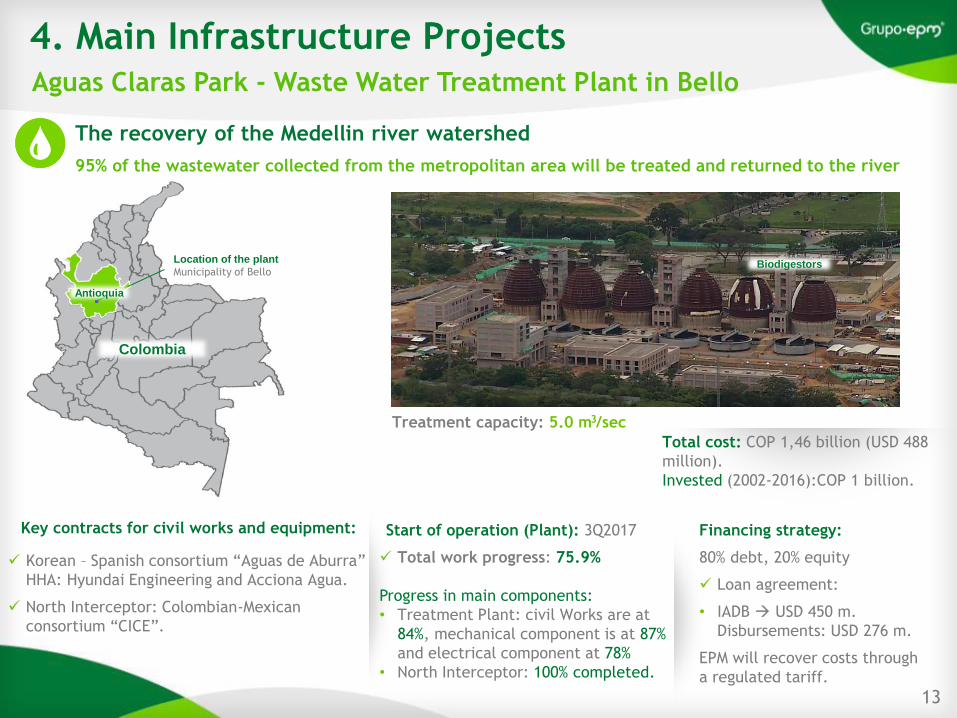
Aguas Claras Park - Waste Water Treatment Plant in Bello
Financing strategy:
80% debt, 20% equity
Loan agreement:
• IADB USD 450 m.
Disbursements: USD 276 m.
EPM will recover costs through
a regulated tariff.
Key contracts for civil works and equipment:
Korean – Spanish consortium “Aguas de Aburra”
HHA: Hyundai Engineering and Acciona Agua.
North Interceptor: Colombian-Mexican
consortium “CICE”.
Location of the plant
Municipality of Bello
Colombia
Antioquia
Treatment capacity: 5.0 m3/sec
4. Main Infrastructure Projects
13
Total work progress: 75.9%
Progress in main components:
• Treatment Plant: civil Works are at
84%, mechanical component is at 87%
and electrical component at 78%
• North Interceptor: 100% completed.
The recovery of the Medellin river watershed
95% of the wastewater collected from the metropolitan area will be treated and returned to the river
Total cost: COP 1,46 billion (USD 488
million).
Invested (2002-2016):COP 1 billion.
Biodigestors
Start of operation (Plant): 3Q2017

Nueva Esperanza
Progress as of Dec.2016: 91%
Bello - Guayabal - Ancón
Progress as of Dec.2016 : 77.3%
4. Main Infrastructure ProjectsPower transmission projects in Antioquia and Cundinamarca
14
Total cost: COP 425,853 million
Invested to date: COP 392,631 million
Financing strategy: 60% debt, 40% equity
Loan agreement:
• Banco Agrario: COP 116,000 million.
• Club Deal: USD 30 million.
Capacity: 450 MVA
Transmission lines: 500 Kv (48,5 Km.) – 230 Kv (159 Km)
Start of operation: first quarter 2017
Total cost: COP 226, 283 million
Invested to date: COP 79,573 million
Financing strategy: 60% debt, 40% equity
Loan agreement: Club Deal: USD 40 million
Capacity: 180 MVA
Transmission lines: 230 kV (44 km)
Start of operation: first quarter 2017
The Project will benefit more than 12 million
inhabitants of Cundinamarca, Meta, Guaviare and
northern Tolima.
Project of National interest that seeks to improve
the reliability of the electricity system in the
Aburrá Valley.

5. Key Acquisition
June 2015: acquisition of the Chilean company
ADASA for CLP 589.965 million*
• Represents EPM´s entry into the water
desalination sector.
Largest sea water desalination plant in LATAM, 940 L/s
Strengthens EPM´s presence in the sector of water
• More than 10 years of experience in the
design, construction and operation of
desalination treatment plants.
• Production and distribution of drinking water,
collection and disposal of wastewater
(served).
• 100% coverage in drinking water and 99.8% in
sewage.
• Local Credit Rating: AA- (Fitch Ratings and
Humphreys)
• Growth opportunities in the markets of Peru
and Chile through desalination.
15
Concession until 2033
Service coverage for 8
populations of about
623.461 inhabitants
* Final purchase price: Acquisition total cost adjusted due to previous owner expenses recognition
ADASA - Water business in Chile
Chile

5. Key Acquisition
62% of revenues come
from regulated market.
38% of revenues come
from the block sale of
water to mining
companies.
Consumption growth (m3):
4.5% in the last year.
16
439 Direct jobs
1051 Indirect jobs
2016 Financial Results
Revenues: CLP 92.031 m
EBITDA: CLP 53.713 m
Variation 2015 – 2016:
Revenues: 7.6%
EBITDA: 23.8%
1,693 1,693
660 860
2015 2016
CAPACITY (L/s)
Mountain Range Water Sea Water
72%
28%
66%
34%
39,027 39,417
12,212 14,127
2015 2016
CONSUMPTION (Thousands m3)
Regulated Market Non Regulated Market
76%
24% 26%
74%
Antofagasta Desalination Plant: supplies 65% of the consumption in Antofagasta.
200 L/s output added in Nov.2016
Milestone reached in Oct.2016: Expansion of Antofagasta Desalination Plant
Total installed capacity: 940 L/s
ADASA - Water business in Chile

6. Financial highlights - Capex, 2016
Figures in COP thousand million
17
EPM Group Investments 2015: COP 3.2 billion
EPM Group Investments 2016: COP 3.5 billion
1,284
685 641
287 274
46
1,331
865
629
337 339
21
Ituango EPM ParentCompany(excludingItuango)
International Sub. Aguas ClarasWWTP
Colombian PowerSub.
Colombian Waterand Waste
Management Sub.
2015 2016
71%
28%
79%
27%
36%
60% 76%
32%
Power
Water
Power
Water

EPM CapEx for the period 2017-2020
COP 10,627 million* (USD 3.54 billion equiv.)
73% Power, 27% Water
61% EPM Parent company, 18% Colombian subsidiaries,
21% International subsidiaries
Financing: 60% debt, 40% equity
18* Financial budget as of Dec. 2016
6. Financial highlightsConsolidated Infrastructure Investment Plan 2017-2020
Ituango, 30%
Expansion and replacement (T&D, Gas
and Water), 24%
International Subs. 21%
Colombian Subs. 18%
Operational improvements, 6%
Other 1%
COP 10,627 Aguas Claras WWTP
Ituango
Bello Guayabal Ancón Power Transmission Project

4,026 4,589
13,925
15,854
595 1,227
3,609 4,036
130 657 1,056
1,864
4Q 2015 4Q 2016 Jan - Dec 2015 Jan - Dec 2016
Revenues EBITDA Comprehensive income
6. Financial Results as of Dec.31, 2016 EPM Group Income Statement (results unaudited, subject to final review) Figures in COP thousand million
19
Var. Jan-Dec 2015 – Jan-Dec 2016
Revenues: 14 %
EBITDA: 12%
Comprehensive Income: 77%
Var. 4Q2015 – 4Q2016
Revenues: 14%
EBITDA: 106%
Comprehensive Income: 407%
The comprehensive income at COP 1.8 billion was 77% higher
than a year ago mainly as a result of higher revenues and
results mainly due to FX difference, particularly in EPM parent
company and EPM Chile.
Net margin was 11%.
15%
27% 26%27%
8%
19% 19%18%
3%
14%
8%
12%
4Q 2015 4Q 2016 Jan - Dec 2015 Jan - Dec 2016
EBITDA margin Operational margin Net Margin

57%
17%
25%
1%
EBITDA4,036
80%
12%
7%
1%
ComprehensiveIncome1,864
6. Financial Results as of Dec.31, 2016 By Colombian and International SubsidiariesFigures in COP thousand million
20
(results unaudited, subject to final review)
51%
15%
32%
2%
Revenues15,854
Guatemala42%
Chile25%
Panama21%
El Salvador8%
Mexico4%
Guatemala38%
Panama35%
El Salvador14%
Chile9%
Mexico4%

6. Financial Results as of Dec.31, 2016 By SegmentsFigures in COP thousand million
21
(results unaudited, subject to final review)
22%
1%
58%
5%
9%5%
Revenues15,854
27%
3%
49%
3%
9%
9%
EBITDA4,036
39%
3%44%
2%
12%
ComprehensiveIncome1,864
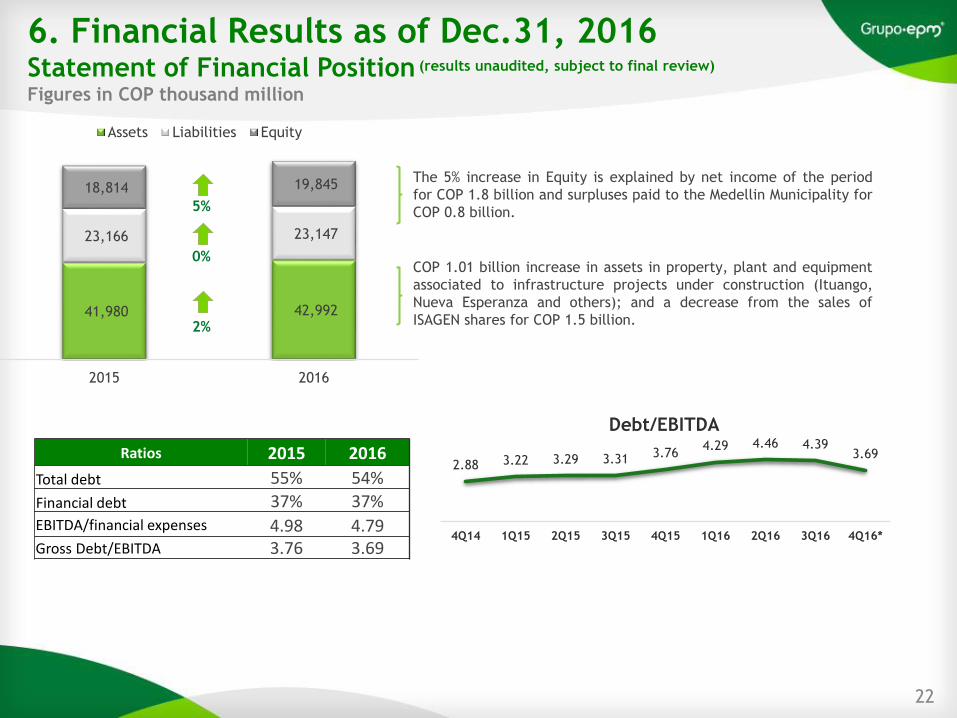
41,980 42,992
23,166 23,147
18,814 19,845
2015 2016
Assets Liabilities Equity
6. Financial Results as of Dec.31, 2016 Statement of Financial PositionFigures in COP thousand million
22
(results unaudited, subject to final review)
COP 1.01 billion increase in assets in property, plant and equipment
associated to infrastructure projects under construction (Ituango,
Nueva Esperanza and others); and a decrease from the sales of
ISAGEN shares for COP 1.5 billion.
The 5% increase in Equity is explained by net income of the period
for COP 1.8 billion and surpluses paid to the Medellin Municipality for
COP 0.8 billion.5%
0%
2%
2.88 3.22 3.29 3.31 3.764.29 4.46 4.39
3.69
4Q14 1Q15 2Q15 3Q15 4Q15 1Q16 2Q16 3Q16 4Q16*
Debt/EBITDA
Ratios 2015 2016
Total debt 55% 54%
Financial debt 37% 37%EBITDA/financial expenses 4.98 4.79Gross Debt/EBITDA 3.76 3.69

6. Financial Results as of Dec.31, 2016Debt ProfileFigures in COP thousand million
$14,865 $14,865$14,865
23
Source Currency*Companies
*After hedging
USD Bond15%
Global COPBonds 16%
Local Bonds17%
BID9%
JBIC2%
AFD6%
Local Banks6%
International Banks29%
EPM Matriz
73%
National Subsidiaries
5%
International Subsidiaries
22% USD29%
COP57%
GTQ3%
MXN2%
CLP9%

Disclaimer
o Below is a general information presentation about Empresas Públicas de Medellín ESP and its Subsidiaries, as on the date of
presentation. The materials herein contained have been summarized and do not intend to be complete.
o This presentation contains forward-looking statements which are subject to several risks, uncertainties and circumstances
relative to the operations and business environments of EPM. These factors could cause actual results to materially differ
from any future result, expressed or implied, in such forward-looking statements. Accordingly, EPM cannot guarantee any
results or future events. EPM expressly states that it will be under no obligation to update the forward-looking statements
or any other information herein contained.
o This presentation does not constitute any offer or invitation to offer, or a recommendation to enter into any transaction,
agreement or contract with EPM. This presentation is for debate only and shall be referred to considering only the verbal
information supplied by EPM, otherwise it would be incomplete. Neither this nor any of its contents may be used for any
other purpose without the prior written consent of EPM.
o Only for information matters and reader's convenience, figures in COP were translated in this presentation into their USD
equivalent using the exchange rate of COP/USD $3.000,71 as of Dec. 31, 2016, issued by the Colombian Financial
Superintendency. Such translations do not agree with US GAAP and have not been audited. Also, they shall not be
interpreted as representation of the amounts in Colombian Pesos, which could be translated into US Dollars at this or at any
other rate.

www.epm.com.co(tab inversionistas)