journal veterinary animal sciences - cvas … of veterinary & animal sciences mannuthy - 680651...
TRANSCRIPT


CHAIRMANDr. A. JalaludeenDirector (Academic & Research)
MEMBERSDr. S. RamkumarDirector of Entrepreneurship
Dr. H. SubramanianDean, College of Veterinary & Animal Sciences,Mannuthy
Dr. Leo JosephDean, College of Veterinary & Animal Sciences,Pookode
Dr. R. RajendrakumarDean, College of Dairy Science & Technology,Mannuthy
Dr. P.C. SaseendranProfessor, Livestock Production & ManagementCollege of Veterinary & Animal Sciences,Mannuthy
Dr. Jose John ChungathProfessor, Veterinary Anatomy and HistologyCollege of Veterinary & Animal Sciences,Pookode
Dr. P.I. GeevargheseProfessor, Dairy Technology, College of DairyScience & Technology, Mannuthy
Dr. M.R. SaseendranathProfessor, Veterinary Epidemiology andPreventive Medicine, College of Veterinary &Animal Sciences, Mannuthy
ANIMAL SCIENCESVolume 40 2009 Issues 1 & 2
E D I TO R I A L B O A R D
MANAGING EDITORDr. K. Devada
Professor and Head
Veterinary Parasitology
ASSISTANT EDITORSDr. Shibu Simon
Assistant Professor, Animal Reproduction,Gynaecology & Obstetrics
Dr. Indu. V. Raj Assistant Professor
Veterinary Anatomy and Histology
Dr. H. Shameem Assistant Professor
Veterinary Parasitology
KERALA VETERINARY &
ANIMAL SCIENCES UNIVERSITYOffice of Journal of Veterinary & Animal SciencesCollege of Veterinary & Animal SciencesMannuthy - 680 651, Thrissur, Kerala (India)
of and
ISSN 0971-0701
JOURNAL VETERINARY

AIM AND SCOPE
Journal of Veterinary and Animal Sciences is a half yearly publication of theKerala Veterinary and Animal Sciences University (KVASU) devoted to the publication of originalresearch papers on various aspects of Veterinary and Animal Sciences and clinical articles whichare of interest to research workers and practitioners engaged in livestock and poultry production.Research papers on wild life, laboratory animals and environmental problems affecting livestockproduction; short communications of importance in Veterinary and Animal Sciences are alsoaccepted. The editorial board look forward to continual support and co operation from all wellwishers in future for a promising and prospective venture.
SUBSCRIPTION RATE
Annual : Inland : KVASU staff/A.H. Dept. : Rs. 100/-
Inland : Other Agencies : Rs. 200/-
Foreign : US $ 75
Price per issue : Inland : KVASU staff/A.H. Dept : Rs. 50/-
Inland : Other Agencies : Rs. 100/-
Back volume : Inland : Rs. 100/-
Foreign : US $ 30
ADVERTISEMENT TARIFF
Front Cover in : Rs. 8000/-
Back Cover in : Rs. 7000/-
Colour insertion : Rs. 6000/-
Black and white full page : Rs. 4000/-
Black and white half page : Rs. 2500/-
ADDRESS FOR COMMUNICATION
The Managing Editor
Journal of Veterinary and Animal Sciences
College of Veterinary & Animal Sciences
Mannuthy - 680651, Thrissur, Kerala, India
+91-487-2370344 ext.228; 334
Mob.+91 9447418800
Fax No: +91 487 2370344
e mail : [email protected]
The Editors and the Editorial Board or the honourable referees do not assume any responsibility for theopinions offered by the authors. No material in any form can be reproduced without the permissionof the Editorial Board. The Board is also not responsible for any delay, whatsoever in publication/delivery ofperiodicals to the subscribers due to unforeseen circumstances or postal delay. Readers arerecommended to make appropriate enquiries before sending money, incurring expenses or entering intocommitments in relation to any advertisement appearing in this publication. The Editorial Board does notvouch for any claims made by the advertisers of products and services. The publisher, the editors and theeditorial Board of the publication shall not be held liable for any consequence in the event of such claims notbeing honored by the advertisers. All disputes are subject to the exclusive jurisdiction of competent courtsand forums in Thrissur, Kerala only.
(per issue)
Published by the Director of Entrepreneurship for and on behalf of the Kerala Veterinary and AnimalSciences University, Pookode, Wayanad, Kerala, India and Printed at VIVID OFFSET PRINTERS, Thrissur.

CONTENTS
RESEARCH ARTICLES
1. Molecular characterisation of Chlamydophila psittaci isolates by restrictionendonuclease analysis of DNA........................................................................................1Sreeja R. Nair, M. Mini, V. Jayaprakasan and G. Krishnan Nair
2. Toxicity of fresh juice of Mimosa invisa in rabbits...........................................................6P.T.A. Usha, N. Gopakumar and A.M. Chandrasekharan Nair
3. Age related histochemical changes of the bursa and thymus of domestic fowl..................9C. Leena, R.V. Prasad, K. Kakade and K.V. Jamuna
4. Suitability of tick tissue staining for the diagnosis of babesiosis in cattle.......................12T.S. Rejitha and K. Devada
5. Seroprevalence of PPR in goats in Kerala by cELISA....................................................15A. Janus, P. V. Tresamol, M. R. Saseendranath, K. Vijayakumar andUsha Narayana Pillai
6. Anatomical studies on the trachea in Japanese quail (Coturnix coturnix japonica).........17S. Rajathi, K.M. Lucy, S. Maya and J.J. Chungath
7. Comparison of antibody titres of Newcastle disease virus in randomly collected seraand egg yolk of layers.....................................................................................................20Nidhin Raj, Praseena Poulose, P.S. Surya, Chintu Ravishankar and Mathew Sebastian
8. Morphological studies on the infundibulum of Kuttanad duck(Anas platyrhynchos domesticus) during postnatal period...............................................22H. S. Patki, K. M. Lucy, K. R. Harshan and J. J. Chungath
9. Genetic analysis of body weights in rabbits....................................................................26P.M. Rojan, K.A. Bindu, K.V. Raghunandanan and K.C. Raghavan
10. Housing designs and its impact on micro climate of cattle sheds in Chennai city........... 29S. Meenakshisundaram, P. Tensingh Gnanaraj, M. Murugan, Ra. Murallidharanand R. Kumararaj
11. Comparative efficacy of various diagnostic tests for caprine paratuberculosis- a field study.................................................................................................................35S. Sulficar, M.R. Saseendranath, G. Krishnan Nair, P.V. Tresamol andUsha Narayana Pillai
12. Situational and psychological profile of dairy farmers of Kannur district in Kerala........37P. Vidya, C. Manivannan and N.K. Sudeep Kumar
13. Screening of dogs for rabies virus excretion...................................................................40S. Raju and M.R. Saseendranath
14. Comparative performance of Landrace and Large White Yorkshire pigs undertropical maritime monsoon climate.................................................................................42S. Ramesh, T. Sivakumar, P. Tensingh Gnanaraj, Ra. Murallidharan and M. Murugan
15. Availability, preference and frequency of utilisation of institutional programmesby dairy entrepreneurs of Thrissur district......................................................................47C.A. Pradeep and P.J. Rajkamal
16. Effect of route of administration on immune response to combined foot andmouth disease, haemorrhagic septicaemia and black quarter oil adjuvant vaccine in cattle.......50M.R. Saseendranath, K. Rajkumar and J.P. Smitha
JOURNAL OF VETERINARY AND ANIMAL SCIENCESVolume 40 2009 Issues 1 & 2

SHORT COMMUNICATIONS
17. Bacterial quality of beef carcasses in a meat processing plant........................................ 52C. Sethulekshmi and E. Nanu
18. Dystocia due to foetal ascites in a graded murrah buffalo- a case report.........................56M. Selvaraju, K. Ravikumar, M. Palanisamy, V. Prabaharan, R. Ravi,R. Ezakial Napolean and C. Chandrahasan
19. Brugia pahangi associated haemolytic jaundice in a Basset Hound................................58V.R. Ambily, Usha Narayana Pillai, P.P. Kanaran, P.V. Tresamol and K.M.Jayakumar
20. Effect of sodium bicarbonate supplementation on production performance oflactating cows.................................................................................................................60Nidhish Francis, A.D. Mercy, Renjith Gopal, S. Aravind and Rani Chacko
21. Disseminated Protothecosis in a German Shepherd Dog (GSD) – a case report...............62Usha Narayana Pillai, P.V. Tresamol, M.R. Saseendranath, P.G. Baby, R. Rajeswari,Joseph Cyrus , Abijith Thampan, Rishi Kesavan and Reji Varghese
JOURNAL OF VETERINARY AND ANIMAL SCIENCESVolume 40 2009 Issues 1 & 2

J. V
et. A
nim
.Sci
. 20
09.
40 :
1-5
1
RESEARCH ARTICLE
MOLECULAR CHARACTERISATION OFCHLAMYDOPHILA PSITTACI ISOLATESBY RESTRICTION ENDONUCLEASE ANALYSIS OF DNA *
Sreeja R. Nair1, M. Mini2,V. Jayaprakasan3 and G. Krishnan Nair4
Department of Veterinary MicrobiologyCollege of Veterinary and Animal SciencesMannuthy- 680 651, Thrissur, Kerala
Abstract
Reports on the prevalence ofabortion due to Chlamydia psittaci(Chlamydophila abortus) in Kerala haveindicated a need for the in depth study of theorganism. To unearth differences among theisolates of Chlamydia psittaci, at molecularlevel, restriction enzyme analysis of genomicDNA and plasmid profiling were carried out.Four isolates from four different sources wereused in this study. DNA extracted from theseisolates were digested by Eco RI, Hae III andBam HI. Hind III digested Lambda DNA wasused as molecular weight marker. The isolateswere screened for the presence of plasmidsalso. Characterisation of chromosomal DNA ofChlamydophila abortus by restriction enzymeanalysis revealed a near homogeneity amongthe isolates. The lack of plasmids in all isolatesalso indicates the homogeneity of their originand probably the genetic relationship. Thus,the restriction enzyme digestion analysis withother genetic tools can better resolve thesimilarity or dissimilarity among the isolates.
Key words: Chlamydophila abortus, DNAcharacterisation, restriction endonucleaseanalysis
Report on the prevalence ofChlamydiosis in this part of the country hasindicated the need for an in depth study onChlamydial species (Francis, 1988; Sulochana,1994; Mani, 2001)
Chlamydia psittaci (Chlamydophilaabortus) commonly infects a wide variety ofmammals and birds and has been implicatedin a range of disease conditions (Storz, 1971).In animals, abortion is the most commonpathological effect caused by this organism.Chlamydophila abortus causing abortion andother forms of disease exist in antigenicallydistinct forms. But the isolates of Chlamydiapsittaci from a species or locality cannot beeasily differentiated based on the usualdiagnostic methods. Hence to understand theepidemiology and epizootology of chlamydiosisin animals and to discern the phylogenicrelationship between the species, molecularcharacterisation techniques are essential.
In this context, the present study wasundertaken to compare the genomic DNA ofthe local isolates of Chlamydophila abortusemploying restriction endonuclease analysisand to elucidate the presence of extrachromosomal DNA in these isolates.
Materials and Methods
Chlamydial isolates obtained fromcaprine and bovine abortion which werepreserved in the Department of Microbiology,were used in this study (Table 1). The isolateswere revived by passaging in six to seven day-old embryonated eggs through yolk sac route.Later the isolates were propagated in McCoycell line. The elementary bodies (EB) of eachisolate prepared from infected cell cultureharvest and directly from yolk sac were purified
* Part of M.V.Sc. thesis submitted by the first author to the Kerala Agricultural University, Thrissur1. Assistant Professor2. Professor & Head3. Associate Dean (Retd.), CVAS, Pookode, Wayanad4. Professor and Head (Retd.)
Sreeja R. Nair et al.

by urografin density gradient centrifugation(McClenaghan et al., 1984). These purified EBwere used for DNA extraction. Thehomogenised EB in Tris-EDTA sucrose bufferwere treated with proteinase k, followed bySDS and then extracted with phenol –chloroform isoamyl alcohol mixture. Nucleicacid was precipitated from the aqueous phaseby addition of 1/20 V of 5M NaCl and doublevolume of ethanol. The concentration andpurity of DNA extracted from all the four isolateswere assessed by spectrophotometry.Restriction enzyme digestion of the DNAobtained from all the four isolates were doneseparately with Eco R 1, Hae 111 and Bam H1.DNA was digested for overnight in 10 µgamount with 10 x RE assay buffer of 2xconcentration and 2U of restriction enzyme perµg of DNA in eppendorf tubes containingdistilled water so that the total reaction volumein each tube was 20 µL, under the conditionsrecommended by the manufacturer. Agarosegel electrophoresis was carried out inhorizontal gels with 0.8% agarose containingethidium bromide (0.5µg/ml) in Tris –boratebuffer at 50 V till the loading dye reached threefourth of the anode end of the gel. Themolecular sizes of the restriction fragmentswere estimated by comparison of the distancemigrated by them with that of standardmolecular weight marker. Hind 111 digestedLambda DNA was used as molecular weightmarker (Fig.1).
Efforts were made to separate andcharacterise plasmids from all the isolates.Repeated attempts were made to extractplasmid DNA from purified EB by the methodof Birnboim and Dolly (1979) except that thelysozyme treatment was omitted. Forcomparison the plasmids were extracted fromE.coli V 517 with a similar procedure exceptthat the cell pellet was dissolved in lysozymeat a final concentration of five milligram permilliliter. E.coli V 517 was taken as themolecular weight standard having eightplasmids (Fig. 2).
Results and Discussion
In this study, sufficient concentrationsof purified EB of Chlamydia psittaci wereobtained from both Mc Coy cell line and yolksac membrane. The DNA extracted from thepurified EB was subjected to spectrophotometryfor assessing the purity. Ratio of OD 260/280if equal to or more than 1.8 indicated the purityof the DNA samples. It was observed to bemore than 1.8 for all the isolates. Theconcentration of DNA of M- 28, M- 430, M- 121and P- 156 were 1710 µg/ml, 1130 µg/ml, 1545µg/ml and 1475 µg/ml respectively (Table 2).
On digestion with Eco R 1, the DNAof all the isolates were cleaved into fragmentsranging from eight to ten with slight differencein fragment size (Lane 2-5 of Fig. 1). Theisolates differed mainly in size of the heavy
Table 1. Details of Chlamydia psittaci isolates
Isolate Source
M-28 Liver of an aborted caprine foetus
M-430 Lung of an aborted caprine foetus
M-121 Liver of an aborted bovine foetus
P-156 Infected yolk sac material obtained from theDepartment of Microbiology, Veterinary College, Palampur,Himachal Pradesh as reference isolate
Table 2. Concentration and purity of DNA from C. psittaci isolates
M-28 M-430 M-121 P-156
OD 260 0.342 0.226 0.309 0.295
OD 280 0.188 0.122 0.168 0.164
Concentration 1710 1130 1545 1475( µg/ml)
Purity 1.82 1.85 1.84 1.80J. V
et. A
nim
.Sci
. 20
09.
40 :
1-5
RESEARCH ARTICLE
2 Molecular Characterisation of Chlamydophila psittaci...

J. V
et. A
nim
.Sci
. 20
09.
40 :
1-5
3
RESEARCH ARTICLE
Sreeja R. Nair et al.
Table 3. Diagrammatic representation of restriction pattern of C.psittaci isolates on digestion with Eco R1
Lane 1 - λ DNA Hind III digestLane 2 - M - 28Lane 3 - M - 430Lane 4 - M - 121Lane 5 - P - 156
Fig. 1
Fig. 2
fragments where as most of the light fragmentswere similar in size (Table 3). McClenaghan etal. (1984) obtained a low number of discretefragments on Eco R 1 digestion in highermolecular weight range of 10 to 20 kbp whereas the resolution of smaller fragments werepoor. They opined that too many fragments cutby the enzymes presented difficulty in theiranalysis and identification, appearing as poorlyresolved bands on electrophoresis.
On digestion with Hae 111, thenumber of fragments ranged from seven to nine
(Lane 6-9 of Fig. 1). The caprine isolates werehaving eight fragments each but fragment sizevaried between the isolates (Table 4).Rodolakis and Souriau (1992) used thisenzyme for comparison of various Chlamydiapsittaci isolates. They observed minordifference between the fragments. Restrictionenzymes with four base recognition sequencesproduced fragments too small for effectiveresolution in low concentration agarose gels,McClenaghan et al (1984). Similar results wereobserved in the present study.

Table 5. Diagrammatic representation of restriction pattern of C. psittaci isolates on digestion with Bam H111
Lane 1 - λ DNA Hind III digest, Lane 2 - M - 28, Lane 3 - M - 430, Lane 4 - M - 121, Lane 5 - P - 156
J. V
et. A
nim
.Sci
. 20
09.
40 :
1-5
RESEARCH ARTICLE
4 Molecular Characterisation of Chlamydophila psittaci...
Table 4. Diagrammatic representation of restriction pattern of C. psittaci isolates on digestion with Hae111
Lane 1 - λ DNA Hind III digest, Lane 2 - M - 28, Lane 3 - M - 430, Lane 4 - M - 121, Lane 5 - P - 156

�
J. V
et. A
nim
.Sci
. 20
09.
40 :
1-5
5
RESEARCH ARTICLE
Sreeja R. Nair et al.
Digestion of DNA of the isolates withBam H 1 yielded eight fragments for all theisolates except M-121 wherein sevenfragments were only noticed (Lane 10-13 ofFig 1). But variation was noticed in fragmentsize among the isolates (Table 5). Rodolakisand Souriau (1992) obtained almost similarfragments with Bam H 1 and hence recommendedits use in the discrimination of strains ofChlamydophila abortus.
In this study, efforts were made toseparate and characterise plasmids fromChlamydophila abortus. Repeated attemptsemploying the techniques, which had provedfruitful for the isolation of plasmids from gram-negative bacteria including Chlamydia, failedto detect the presence of plasmids in allisolates (Fig. 2). McClenaghan et al. (1988)carried out a broad survey to detect plasmidsin mammalian strains of Chlamydia psittaci. Heobserved that certain mammalian isolates werefree of plasmids. Everett (2000) also reportedthe absence of plasmids in abortion strains ofChlamydia psittaci.
Acknowledgement
The authors are thankful to the ICARfor funding the project on ‘Chlamydiosis inlivestock with special reference to abortion inlivestock’.
References
Everett, K. D. E. 2000. Chlamydia andChlamydiales more than meets theeye. Vet. Microbiol., 75: 109-126
Francis, R. 1998. Prevalence of Chlamydialagents in livestock in Kerala. M.V.Sc.thesis. Kerala Agricultural University.
Mani, B. K. 2001. Isolation andcharacterization of Chlamydia psittaciwith special emphasis on proteinprofile. M. V.Sc. thesis. KeralaAgricultural University.
McClenaghan, M., Herring, A. J. and Aitken,I.D. 1984. Comparison of Chlamydiapsittaci isolates by DNA restrictionendonuclease analysis. Infect.Immun., 45 : 384 -389.
McClenaghan, M., HoneyCombe, J.R., Bevan,B.J., Herring, A. J. 1988. Distributionof plasmid sequences in avian andmammalian strains of Chlamydiapsittaci. J. Gen. Microbiol., 134: 559-565
Rodolakis, A.and Souriau, A. 1992. Restrictionendonuclease analysis of DNA fromruminant Chlamydia psittaci and itsrelation to mouse virulence. Vet.Microbiol., 31: 263-271.
Storz, J. 1971. Chlamydia induced diseases.In: Thomas C., (Ed.) Chlamydia andChlamydia induced diseases.Springfield, Illinois. pp. 146-246
Sulochana, S. 1994. Personal communication.

TOXICITY OF FRESH JUICE OF MIMOSAINVISA IN RABBITS*
P. T. A. Usha1, N. Gopakumar2 andA. M. Chandrasekharan Nair3
Department of Veterinary Pharmacology and ToxicologyCollege of Veterinary and Animal SciencesMannuthy– 680 651, Thrissur, Kerala
Abstract
An experiment was conducted tostudy the toxic dose of Mimosa invisa in rabbits.Six adult rabbits were administered with freshjuice of M. invisa @ 15,20,25 & 30g/kg orally.It was revealed that a dose of 25g/kg of M.invisa was toxic to rabbits and that a dose of30g/kg produced acute toxicity resulting indeath of rabbits. There was also an increasein the levels of serum creatinine and urea withdamages to the liver, kidney and heart.
Key words: Mimosa invisa, toxic dose, rabbits.
Mimosa invisa is a shrubbyherbaceous annual plant. It is a native oftropical America and it was imported byneighbouring tea garden from East Asiain1960s as a nitrogen fixer prior to planting tea.Mimosa invisa toxicity is common in Keraladuring rainy season when there is luxuriousgrowth of this plant. Poisoning is reportedfrequently in cattle and goats. The phytotoxinpresent in the plant affect mainly kidneys(Rajan et al., 1986). The main clinicalsymptoms reported were reduced feed andwater intake (Alex et al., 1991). As a detailedtoxicity study of this plant is lacking a studywas undertaken to assess the toxicity of freshjuice of M. invisa in rabbits.
Materials and Methods
A pilot study was conducted to derivethe toxic dose of Mimosa invisa fresh juice.Eight adult rabbits were divided into four groups
of two animals each. Four dose levels ofM. invisa (15, 20, 25, 30 g/kg) as fresh juicewas administered to these rabbits for 20 days.Levels of Urea, Creatinine, ALT and AST weretaken as toxicity criteria. Toxic dose derivedfrom the pilot study was used for detailedtoxicological investigation.
Twelve adult rabbits were divided intotwo groups of six animals each. Group I wasmaintained with the control diet alone. Freshjuice obtained from toxic dose of M. invisa wasadministered to Group II for 20 days. Bloodwas collected from these animals before theadministration of juice and also on the 1st, 3rd,5th, 10th, 15th and 20th day after administration.Serum was separated and analysed for ALT,AST, GGT, CK, ALP, Creatinine and Urea. Thedata were analysed statistically by t-test(Snedecor and Cochran, 1985).
Results and Discussion
The pilot study showed that theanimals administered with M. invisa fresh juiceequivalent to 15-20 g/kg did not show anychange in biochemical parameters. Theanimals were active and taking feed and waternormally throughout the experiment. But thedose rate of 25 g/kg of M. invisa showedanorexia, dullness and lethargy. There wassignificant increase in ALT, AST, creatinine andurea on the first and third day of the experiment.Thereafter the values gradually decreased andreturned to normal by 20th day of theexperiment. The group administered with freshjuice obtained from 30 g/kg of M. invisa, killed
* Part of Ph.D. thesis submitted by the first author to the Kerala Agricultural University, Thrissur1. Associate Professor & Head2. & 3. Professors and Head ( Retd.)J.
Vet
. Ani
m.S
ci.
2009
. 40
: 6
-8RESEARCH ARTICLE
6 Toxicity of Mimosa invisa......

all the animals within 12 to 24 h of administration.Thus the pilot studies revealed that 25 g/kg ofM. invisa was toxic to rabbits and 30 g/kgproduced acute toxicity resulting in death ofanimals. Hence the dose 25 g/kg of M. invisawas selected for further study.
The results of the toxicity study arepresented in the table. The treatment group(Mimosa invisa, 25 g/kg) showed reduction infeed and water intake, the animals were dulland lethargic. Similar observation was madeby Alex et al. (1991). The serum ALT levelsshowed significant increase (P<0.01) followedby gradual decrease from the third dayonwards. Elevated levels of serum ALT levelswere observed by feeding flower stem ofNarthecium ossifragum which indicatedintrinsic hepatotoxicity of the plants (Flaoyenet al., 1997). Burtis and Ashwood (1996)reported that serum ALT levels will beincreased in parenchymal liver diseases. Theysuggested that increase in serum AST levelsobserved may be associated with hepaticnecrosis.
The serum GGT levels showedmaximum increase on third day even thoughthe increase was observed from first day
Table. Effect of toxic dose of Mimosa invisa on serum biochemistry in rabbits
n – 6 *P<0.05 **P<0.01 Group I – Control Group II – Treatment
onwards. Flaoyen et al. (1995) also noted anincrease in serum GGT activity indicatinghepatic dysfunction after feeding N. ossifragum.GGT present in the serum appears to originatefrom hepatobiliary system and it is elevated inall forms of liver diseases (Burtis and Ashwood,1996). The serum creatine kinase (CK) levelswere found to be significantly increased on thethird day of the experiment followed by adecrease. A substantial increase in creatinekinase was observed in all types of musculardystrophies. The serum ALP showed asignificant increase (P<0.05) in treatmentgroup which indicated liver damage. Highlysignificant (P<0.01) increase in serumcreatinine and urea was observed in treatmentgroup. Ferriera et al. (1991) reported increasedlevels of urea and creatinine in amaranthuspoisoning in cattle. When urea is measuredalong with creatinine, it is a clear indicator ofrenal failure (Burtis and Ashwood, 1996). Allthe parameters except CK showed significantincrease from first day onwards which isfollowed by a decrease and returned to normalvalues by 20th day. The increase in biochemicalparameters indicated damages to liver, kidneyand heart but the tendency to normalize the J.
Vet
. Ani
m.S
ci.
2009
. 40
: 6
-8
7
RESEARCH ARTICLE
P.T.A. Usha et al.

References
Alex, P.C., Rajankutty, K., Valsala, K.V. andNair, K.N. 1991. Mimosa poisoningin a heifer. J. Vet. Anim. Sci., 22: 134-136
Burtis, C.A. and Ashwood, E.R. 1996. TietzFundamentals of Clinical Chemistry.4th ed., W.B. Saunders Co., London.881 p.
Ferreira, J. L. M., Riet-Correa, F., Schild, A. L.and Mendez, M.D.C. 1991. Poisoningof cattle by Amaranthus species(Amaranthaceae) in Rio Grande deSul, Southern Brazil. PrequisaVeterinaria Brasileira., 11: 49-54
Flaoyen, A., Bratberg, B. and Gronstol, H.1995. Nephrotoxicity in lambapparently caused by experimentalfeeding with Narthecium ossifragum.Vet. Res. Comm., 19: 75-79
Flaoyen, A., Bratberg, B., Froslie, A., Gronstol,H., Langseth, W., Mantle, P.G. andKrogh, A.V. 1997. Nephrotoxicity ingoats caused by dosing with a waterextract from stems of Nartheciumossifragum plants. Vet. Res. Comm.,21: 499-506
Flaoyen, A., Houe, K. and Wilkins, A.L. 2001.Tolerance to nephrotoxic componentof Narthecium ossifragum in sheep.The effects of repeated oral doses ofplant extracts. Vet. Res. Comm., 25:127-136.
Rajan, A., Manomohan, C.B, Valsala, K.V.,Sreekumaran, T., Lalitha, C.R.,Ramachandran, K.M. and Nair, N.D.1986. Experimental studies on thetoxicity of the plant Mimosa invisa incalves. Kerala J. Vet. Sci., 17: 91-98
Snedecor, G.W. and Cochran, W.G. 1985.Statistical Methods. 8th ed., Oxfordand IBH Publishing Company,Calcutta. 534 p
Fig. 2. Liver – Fresh juice of M. invisa - fattychange and necrosis H & E x 400
Fig.1. Kidney - Fresh Juice of M. invisa - tubulardegeneration, necrosis and hyalinisation H & E x 100
Fig.3. Heart - Fresh Juice of M. invisa -intermuscular haemorrhage H & E x 100.
�J. V
et. A
nim
.Sci
. 20
09.
40 :
6-8
RESEARCH ARTICLE
8 Toxicity of Mimosa invisa......
values indicated tolerance acquired by theanimal due to repeated administration of thetoxic dose of M. invisa. Histopathologicalobservations support the biochemical changes.The histopathological examination revealeddegenerative and necrotic lesions in kidney(Fig.1). The liver showed fatty changes andnecrosis (Fig.2). Intermuscular haemorrhagescould be observed in heart (Fig.3). Thehistopathological changes were observed withhigher dose (30mg/kg) of M. invisa. Flaoyenet al. (2001) observed tolerance to nephrotoxiccomponent of N. ossifragum in sheep. Thus it
is inferred that the fresh juice of M. invisaequivalent to 25 g/kg produced toxicity inrabbits but exhibited tolerance due to repeatedadministration. Higher dose (30 g/kg) ofM. invisa produced acute toxicity resulting indeath of rabbits.

AGE RELATED HISTOCHEMICAL CHANGESOF THE BURSA AND THYMUS OF DOMESTICFOWL*
C. Leena1, R. V. Prasad2, K. Kakade3 andK. V. Jamuna4
Department of Veterinary Anatomy and HistologyVeterinary College, Hebbal, Bangalore
Abstract
Histochemical changes of bursa andthymus of Giriraja birds from day old to 24weeks of age was studied. Intense acidphosphatase and mild alkaline phosphataseactivity was seen in lining epithelium of bursa.The follicle associated epithelium showedpositive PAS and alcial blue reaction.Medullary cysts of bursa and intracellular cystsof thymus also stained positive. Lipids wereseen from 14th week onwards in thymus.
Key words: Histochemistry, thymus, bursa,involutary
Birds possess a unique lympho-epithelial gland, the bursa of Fabricius, locateddorsal to the cloaca (Hodges, 1974), whilethe thymus gland consists of three to eightirregular shaped lobes, and is situated oneither side of the neck close to the jugular vein(King and McLelland,1981). Bursa and thymusare primary lymphoid organs where B and Tcells differentiate and participate in humoraland cell mediated immune responserespectively. While elaborate studies havebeen undertaken on immune system ofchicken, not much work has been done onage-related histochemical changes of thelymphoid organs of Giriraja birds.
Giriraja is a disease resistant birdwith body weight and egg production threetimes than the local bird. In the present workan attempt has been made to study the
*Part of M.V.Sc. thesis submitted by the first author to U.A.S., Bangalore1. Assistant Professor, CVAS, Pookode, Wayanad2. Associate Professor and Head3. Professor(Retd.)4. Associate Professor
histochemistry of the bursa and thymus invarious age groups of Giriraja birds.
Materials and Methods
A total of 72 birds were rearedseparately at the UAS poultry farm, Bangalorefrom day old to 24 weeks. Bursa and thymuswere collected from six birds each everyalternate week
Cryostat sections of 12µm thicknesswere obtained from fresh tissues and werestained by Gomori’s alkaline phosphatasecobalt method, Gomori’s acid phosphatasemethod and Oil red ‘O’ in propylene glycolmethod for lipids (Singh and Sulochana, 1978).The sections were also subjected to Periodicacid Schiff’s reaction (Singh and Sulochana,1978), Alcian blue method for mucosubstancesat pH 2.5, Toluidine blue method formetachromasia (Luna, 1968).
Results and Discussion
Bursa
1. Cortex and Medulla- Medulla at theinvoluting stage presented acid phosphatasereaction (Fig. 1) which may be indicative ofdegenerative changes. The cortex andcorticomedullary junction showed very mildreaction throughout the period of the study.Alkaline phosphatase activity was seen in afew isolated areas of follicular cortex which wassuggestive of intracellular metabolism anddifferentiation of bursal cells.
J. V
et. A
nim
.Sci
. 20
09.
40 :
9-1
1
9
RESEARCH ARTICLE
C. Leena et al.

2. The Corticomedullary Border- Itwas PAS positive while the reticuloepithelialnetwork became slightly alcian blue positiveat the terminal stages of involution.
3. The Lining Epithelium- of the bursashowed intense acid phosphatase till about18 weeks after which it became non specific.Interfollicular epithelium (IFE) and theepithelium lining the follicles (FAE) duringinvolution showed intense reaction. Mildalkaline phosphatase activity was observedin the bursal epithelium of all age groups (Fig.2), being strong initially during the first weekand decreasing with the advancement of age.The reaction was variable from 18th weekonwards.
The lining epithelium of bursalmucosa showed PAS positive reaction and wasAlcian blue positive in all the age groupsstudied (Fig. 3). The reaction was distinctlyabsent in the FAE (Follicle associatedepithelium) and was intense in the IFE andassociated crypts of IFE. The interfollicularepitheium released mucin into the bursallumen, which was indicated by the alcian bluepositive reaction in this region in agreementwith the observations of Farner et al. (1983)
Fig. 1. Acid Phosphatase positive reaction inmedulla of bursa Acid Phosphatase X 100
Fig. 3. Alcian blue positive reaction in liningepithelial cellsof bursa Alcian Blue X 100
Fig. 2. Alkaline Phosphatase positive reaction in liningepithelial cells of bursa Alkaline Phosphatase X 100
Fig. 4. Diffuse lipid droplets in involuting bursaOil Red O X 100
4. Follicles- The infolded epitheliumand those lining follicles during involutionstages were also positive which indicated thepresence of acid mucopolysacharides. Thisalong with intense acid phosphatase reactionwas an indication of the presence ofglycoprotein which were the basis forantibodies biochemically (Sabiha, 1993). Thebursal epithelium, mast cells and cystic fluidstained metachromatically with toluidine blue.
5. Cysts- Large cysts lined by simplesquamous epithelium enclosing a central coreof mucoid substances were found in themedulla at 8 weeks and were formed by theepithelialisation of follicles and secretion ofmucoud matter into the lumen formed. Theirnumber increased with age. The cystic fluidstained metachromatically with toluidine blue.Simple tubular glands lined by columnar cellswere noticed from 10 weeks of age closelyassociated with the cysts. These findingsconcurred with those observed by Scala et al.(1989) in the involuted bursa of duck. Theseglands stained positive for alcian blue and weresuggestive of mucous secreting glands.
6. Lipids- The gradual replacement ofthe follicles by lipids was seen from 8th weekonwards (Fig. 4). The lipid substances were
J. V
et. A
nim
.Sci
. 20
09.
40 :
9-1
1RESEARCH ARTICLE
10 Histochemical changes of the bursa and thymus...

�
localized in the lamina propria between the10th and 18th week while masses of adiposetissue in follicles and huge random depositswere seen by 22nd to 24th week of age.
Thymus
Mild alkaline phosphatase activity wasnoticed in the thymus of all age groups studied.Cortex showed slight reaction from 8th to 16th
week. Pale reaction was seen in the Hassal’scorpuscle associated areas. Capsule showedstrong reaction initially. Endothelium whereverpresent showed positive reaction.Circumscribed areas with central reactivemasses probably germinal centres were seenin the 16th, 22nd and 24th week.
1. Stroma- Mild alkaline phosphataseactivity as well as acid phosphatase activitywas recorded by the thymic reticuloepithelialcells and stroma, which were in accordancewith the findings of Fennel and Pearse (1961).Acid phosphatase activity was noticed in thethymic medulla at 10 weeks and in stromabetween 14 to 16 weeks of age. Perivascularspaces wherever present gave positivereaction.
Macrophages showed Alcian bluepositive material in their cytoplasm.Macrophages were also present in the cortexand medulla, supported by the observationsof Riddell (1987). They were found to haveslightly alcian blue positive material. Kendall(1980) found the macrophage contents to bePAS positive confirming their secretory nature.
Toluidine blue staining showed mastcells with characteristic metachromaticgranules in the parenchyma of most agegroups studied.
2. Lipids- Lipid substances were seenas faint diffuse, droplets by 8th week,widespread and homogenous by 12th week andlocalizing in connective tissue septa by 14th
week onwards. Focal depositions and widespread lipid accumulations were seen in the22nd and 24th week respectively.
3. Cysts- Some cells of the medulla,probably the reticuloepithelial cells, appearedcystic and were alcian blue positive, which inturn might be the intracellular cysts noted byRiddel (1987).
Acknowledgements
The authors are thankful to the IndianCouncil of Agricultural Research, New Delhi,for providing financial support for the work.
References
Farner, B.S., King, J.R. and Pakes, K.C. 1983.Avian biology. Vol. VII. AcademicPress.
Hodges, R.D. 1974. The Histology of Fowl.Academic press, London.
Kendall, M.D. 1980. Avian thymus gland, Areview. Dev. Comp. Immunol., 4 : 191-210.
King, A.S. and Mc Lelland, J. 1983. Form andfunction in birds. Vol 2. Academicpress. pp352-359
Luna, I.G. 1968. Manual of HistologicalStaining Methods of the Armed ForcesInstitute of Pathology, 3rd ed. McGrawHill Book Co., New York.
Riddel, C. 1987. Avian histopathology. TheAmerican Association of AvianPathologists. Allen Press Inc.,Lawrence, Kansas.
Sabiha, H.B. 1993. Histomorphological andHistochemical study of the thymusand the bursa of Fabricius inJapanese Quail. M.V.Sc.Thesis. TamilNadu Veterinary and Animal SciencesUniversity, Chennai.
Scala, G., Caputo, G., Paio, G. and Pelagutti,G.V. 1989. The vascularization of thebursa cloacalis of Fabricius in theduck. Anat. Hist . Emb., Vet. Bull.59(10): 877 18 : 66-75.
Singh, U.B. and Sulochana, S. 1978. ALaboratory Manual of Histological andHistochemical techniques. KothariMedical Publishing house, Bombay.
J. V
et. A
nim
.Sci
. 20
09.
40 :
9-1
1
11
RESEARCH ARTICLE
C. Leena et al.
SUITABILITY OF TICK TISSUE STAINING FORTHE DIAGNOSIS OF BABESIOSIS IN CATTLE*
T. S. Rejitha1 and K. Devada2
Department of Veterinary ParasitologyCollege of Veterinary and Animal SciencesMannuthy-680 651, Thrissur, Kerala
Abstract
In the present study, an attempt wasmade to identify the cattle with clinical orsubclinical babesiosis by demonstrating thedevelopmental stages of Babesia bigemina inthe tissues of ticks collected from suspectedanimals. Ticks collected from 50 cattle presentedat various Veterinary Hospitals of Thrissur andErnakulam districts of Kerala and thosebelonging to University Livestock Farm,Mannuthy and Cattle Breeding Farm,Thumburmuzhi were subjected to study.Salivary glands, gut and ovaries wereseparated from the ticks and stained withmethyl green pyronine. Considering the ticksas positive on detection of developmentalstages of the parasite in any of the threetissues, ticks from 27 (54 per cent) out of total50 animals were interpreted as positive.Examination of tick tissues was found aseffective for detecting the clinical andsubclinical forms of babesiosis in cattle andfound as a suitable epidemiological tool.
Key words: Babesia bigemina, Boophilusannulatus, Methyl green pyronine
The identification of organisms in thinand thick blood films is a true evidence ofinfection, however a negative result does notrule out the possibility of infection. Besides,animals which recover from an acute infectionbecome carriers of the haemo-parasite incourse of time making diagnosis difficult. Thedetection of parasitic stages in the vectorbecomes essential, as this forms a component
for assessing the infection rate in vectors andalso helps to curtail the risk of babesiosis inenzootic areas. Sundar et al. (1993) usedmethyl green pyronine to stain salivary glandsof Hyalomma anatolicum anatolicum anddetected the developmental stages of Theileriaannulata in the acini. This paper reports thediagnosis of babesiosis in cattle by tick tissueexamination.
Materials and Methods
Collection of ticks
Partially engorged ticks werecollected manually from the body of animalssuspected for babesiosis. These animals werethose that were either presented at theVeterinary Hospitals or maintained at theLivestock Farms of the KAU. The ticks werecarried to the laboratory in clean glass vialscovered with a piece of muslin cloth andidentified before dissection. About two hundredticks were collected from a total of 50 animals.Blood smears from these animals were alsoexamined with Giemsa’s stain.
Dissection and staining
Dissection of ticks and staining of ticktissues was done as per the method devisedby Irvin et al. (1981) with a few modifications.
The cleaned ticks were held inbetween the thumb and forefinger with thedorsal side up and dissected with a sharp bladefrom the posterior boarder proceedinganteriorly to expose the viscera. Dissected ticksin phosphate buffered saline were examined
* Part of M.V.Sc. thesis submitted by the first author to the Kerala Agricultural University, Thrissur1. Veterinary Surgeon, AHD, Kerala2. Professor & HeadJ.
Vet
. Ani
m.S
ci.
2009
. 40
: 1
2-14
RESEARCH ARTICLE
12 Tick Tissue Staining...

under a dissecting microscope (10 x 15X).Paired salivary glands visible anteriorly oneither side of trachea were removed carefullywith a teasing needle and transferred with adrop of the medium to microscopic slides forfurther examination. Gut that appeared asbrownish strands in the central area and theovaries visible as a bunch of grapes towardsthe posterior part were separated and spreadon different glass slides in PBS. Care wastaken to complete the teasing and separationof tick tissues, before the preparations driedup.
The preparations on the slides werethen air dried and fixed for two to five minutesin Carnoy’s fixative. They were then rinsed fortwo min in 70 per cent alcohol, followed by arinse in distilled water for another two minutes.Then the slides were immersed in two percentmethyl green pyronine for seven to nineminutes. After staining, the slides were rinsedin distilled water, air dried and mounted in DPXmountant.
Slides were scanned at 100X and400X of a light microscope to detect thedevelopmental stages of Babesia, if any.
Results and Discussion
Ticks recovered from the cattle wereidentified as Boophilus annulatus.Rajamohanan (1980) opined that B. annulatuswas the most important vector of babesiosisin Kerala.
Since the literature on methyl greenpyronine staining of salivary glands, gut andovaries of Boophilus sp. was scarce, reportspertaining to Theileria sp. in other Ixodid tickswere referred to in this study.
Distribution of parasitic stages indifferent tissues had a tendency to vary. Henceit was necessary to examine the salivaryglands, gut and ovaries before interpreting theconclusive results.
A tick was interpreted as positive ifany one of the three tissues revealed parasiticstages. Accordingly, 27 (54 per cent) out of 50animals with tick infestation were designatedas positive for Babesia organisms. In thepresent study, none of the ticks maintained theparasitic stages in the ovaries alone.
Infected salivary gland acini appearedhypertrophied with pink acinar cell cytoplasmand the blue nucleus. Deep blue colouredmass indicative of the parasite was also
detected (Fig. 1). In the gut, the presence ofparasitic stages was indicated by thehypertrophy of infected epithelial cells andvacuolations in the cell cytoplasm (Fig. 2). Theoocytes in the ovaries also revealed bluecoloured spherical masses denoting thedevelopmental stages of the parasite (Fig. 3).
Fig. 1 - Infected tick salivary gland:Hypertrophied acini with parasitic mass
Fig. 2. Infected tick gut-cells: Hypertrophy andvacuolation of cytoplasm
Fig. 3. Infected tick ovary: Infected oocytes withparasitic mass
Five animals out of 50, which werepositive for babesiosis by tick examination,were also positive for the organisms in theblood smear. Meanwhile, 22 animals werenegative for the organisms in blood smear aswell as in the ticks collected from them. Another J.
Vet
. Ani
m.S
ci.
2009
. 40
: 1
2-14
13
RESEARCH ARTICLE
T. S. Rejitha and K. Devada

22 of the total animals which rendered negativeresults by blood smear examination, wereactually detected as positive upon tickexamination. There was only one animal fromwhich infected ticks were not recovered, thatrendered a positive smear.
All the animals that exhibited acutesymptoms of the disease were found positivefor the parasitic stages in ticks where as only20 animals with a sub clinical infection carriedinfected ticks.
This study agrees with Walker et al.(1983) who found tick collection and stainingmethods as suitable for the infections of H.anatolicum with Theileria annulata. Asdissection of ticks and identification of parasiticstages is fraught with difficulties, this methodmay be combined with other diagnostic testsfor eventually coming to a conclusion.However, examination of ticks in studies relatedto the epidemiology of babesiosis, lookspromising, as subclinical infections could bedetected by this method.
�
References
Gautam, O.P. and Chhabra, M.B. 1983.Babesiosis – Recent advances withspecial reference to India. Trop. Vet.Anim. Sci. Res., 1: 201-207.
Irvin, A.D., Boarer, C.D.H., Dobbelaere, D.A.E.,Mahen, S.M., Masake, R. and Ocana,J.G.R. 1981. Monitoring Theileriaparva infection in adult Rhipicephalusappendi-culatus ticks. Parasitology,82: 137-147
Rajamohanan, K. 1980. Studies on thecommon ticks in livestock in Kerala.Ph.D. thesis. Kerala AgriculturalUniversity, Thrissur. 218p
Sundar, N., Balasundram, S. and Anandan,R. 1993. Intensity of Theileriaannulata infections with salivaryglands of Hyalomna anatolicumanatoli-cum. Cheiron, 22:2-4
Walker,A.R., Latif, A.A., Morzaria, S andJongejan. F. 1983. Natural infectionrates of Hyalomma anatolicumanatolicum with Theileria in Sudan.35:87-90
J. V
et. A
nim
.Sci
. 20
09.
40 :
12-
14RESEARCH ARTICLE
14 Tick Tissue Staining...
SEROPREVALENCE OF PPR IN GOATSIN KERALA BY cELISA*
A. Janus1, P. V. Tresamol2,M. R. Saseendranath3, K. Vijayakumar4 andUsha Narayana Pillai5
Department of Veterinary Epidemiology andPreventive MedicineCollege of Veterinary and Animal SciencesMannuthy- 680 651, Thrissur, Kerala
Abstract
Seroprevalence of PPR in goats ofKerala was studied using competitive ELISA.Four hundred and twelve samples werecollected from all districts of Kerala and weresubjected to cELISA for detecting antibodiesagainst PPR infection. Sixty four samples(15.05 per cent) were found positive for PPRantibodies, which could be due to the increasedmovement of animals from neighbouringstates.
Key words : PPR, cELISA, goat
Peste des petits ruminants (PPR) isone of the economically important diseases ofsheep and goats. It is a severe, fast spreadingviral disease mainly of domestic smallruminants. The disease is characterised by thesudden onset of depression, fever, dischargesfrom the eyes and nose, sores in the mouth,dyspnoea, cough, foul smelling diarrhoea anddeath. Laboratory diagnosis of PPR can bedone by virus isolation or by the detection ofantigen or antibody. Sensitivity and specificityof ELISA in detecting antibodies is more thanthat of other serological tests. The presentpaper describes the use of competitive ELISA(cELISA) for the detection of antibodies of PPR.
Materials and Methods
Competitive ELISA for detection ofPPR antibodies was performed as per themethod of Singh et al. (2004) using
*Part of M.V.Sc. thesis submitted by the first author to the Kerala Agricultural University, Thrissur1. Academic Consultant2. & 4. Associate Professors3. Professor & Head5. Associate Professor, Dept. of Clinical Veterinary Medicine
Competitive ELISA kit purchased from IVRI,Mukteswar. The cELISA test is based on theinhibition of binding of monoclonal antibody toantigen in the presence of PPR antibodypresent in field sera.
Procedure: Fifty microlitres each ofdiluted PPR antigen (1: 100) was added to allthe wells of a 96 well microtitre ELISA plate forcoating and incubated at 37oC for one hour inan orbital shaker. After one hour of incubationthe plates were washed three times with washbuffer. Then 40 µl each of blocking buffer wasadded to all the wells, 20 µl to monoclonalantibody control wells and 60 µl to theconjugate control wells and added 20 µl ofeach test serum sample in a set of two wells.Added 20 µl of each of strong positive serum,weak positive serum and negative serum tothe respective control wells. Added 40 µl ofdiluted monoclonal antibody to each well of theplate except the conjugate control wells.Incubated the plates at 37oC for one hour inan orbital shaker.
After one hour of incubation andrepeated washing, added 50 µl each of dilutedantimouse conjugate (1: 1000) to all the wells.Repeated the washing step after one hour ofincubation and added 50 µl of orthophenylenediamine and hydrogen peroxide mixture in eachwell of the plate.
Incubated the plates for 10 to 20 minat 37oC without shaking. After the colourdevelopment in the control wells, added 50 µl
J. V
et. A
nim
.Sci
. 20
09.
40 :
15-
16
15
RESEARCH ARTICLE
A. Janus et al.

of stopping solution to each well of the plate.
Test sera demonstrating meanPercentage Inhibition (PI) values of 40 per centor greater were considered as positive
Results and Discussion
The results revealed a seroprevalenceof 15. 05 per cent for PPR in goats of Kerala.Out of 412 sera samples tested 64 sampleswere positive by cELISA. Sreeramulu (2000)reported a high specificity (99 per cent) andsensitivity (90 per cent) of cELISA fordifferential diagnosis of Rinderpest and PPR.The preliminary serological study of PPR inKerala by Sunilkumar et al. (2005), usingcELISA, revealed a prevalence rate of 0.93 percent among 536 goat sera samples tested. Thehigh prevalence rate reported in the presentstudy could be attributed to the increasedanimal movement from neighbouring states.Krishna et al. (2001) and Dorairajan et al.(2006) reported significant seroprevalence ofPPR in small ruminants of Andhra Pradesh andTamil Nadu respectively. As reported by Kumaret al. (1999) natural focus of PPR infectioncontinues to be in the southern states of India.The high prevalence rate reported in thepresent study indicates the need for a regularmonitoring and vaccination programme for thisdisease in Kerala.
Acknowledgement
We are grateful to the Dean, Collegeof Veterinary and Animal Sciences, Mannuthyfor providing the facilities for the study and thestaff, RP eradication scheme, Palakkad forproviding the facilities for cELISA.
References
Dorairajan, N., Malmarugan, S., and Geetha,M. 2006. Seroprevalence of PPR ingoats by cELISA test in Tamil Nadu.Indian Vet. J., 83: 232-233.
Krishna, S.V., Rao, M. V. S. and Shaila, M. S.2001. Neutralising antibodies to pestedes petits ruminants in AndhraPradhesh- a serological survey.Indian J. Anim. Sci., 71: 228-230.
Kumar, G. S., Rathore, B. S. and Mehrotra,M. L. 1999. Epidemiologicalobservations on peste des petitsruminants in North India. Indian J.Anim. Sci., 69: 365-368.
Singh, R.P., Sreenivasa, B.P., Dhar, P., Shah,L.C. and Bandopadhyay,S.K. 2004.Development of monoclonal antibodybased cELISA for detection andtitration of antibodies to PPR virus.Vet. Microbiol., 98:3-15.
Sreeramulu, P, 2000. Epidemiologicalobservations in an outbreak of PPRin an organized sheep farm in AndhraPradesh. Indian Vet. J., 77: 840-842.
Sunilkumar, N. S., Ravishankar, C.,Jayaprakasan, V., Mini, M and Nair,G.K. 2005. Seroprevalence of pestedes petits ruminants in Kerala. IndianVet. J., 82: 570-571.
�
J. V
et. A
nim
.Sci
. 20
09.
40 :
15-
16RESEARCH ARTICLE
16 PPR in goats...

ANATOMICAL STUDIES ON THE TRACHEA INJAPANESE QUAIL (Coturnix coturnix japonica)
S. Rajathi1, K.M. Lucy2, S. Maya3 andJ. J. Chungath4
Department of Veterinary Anatomy and HistologyCollege of Veterinary and Animal SciencesMannuthy-680 651, Thrissur, Kerala
Abstract
The trachea was made up of 110-116complete hyaline cartilaginous rings, whichextended from cranial larynx to syrinx. Thecraniocaudal width of the rings progressivelyincreased along the cranial third of the tracheaand then decreased caudally. Histologically itwas lined by a pseudostratified ciliatedcolumnar epithelium. Lamina propria wasmade up of loose connective tissue andcontained alveolar mucous glands. Thesubmucosa was continuous with theperichondrium of the cartilaginous rings andpresented elastic fibres. The overlappingcartilaginous rings were flattened triangular inlongitudinal section. Externally, there was a thintunica adventitia. Trachealis muscle wasabsent. Sternotrachealis muscle was of striatedtype.
Key words: Histomorphology, Japanese quail,trachea
Respiratory organs of birds differ fromthose of mammals in many features, which areassociated partly with the requirements of flightand partly with the voice production. Trachealcartilages formed complete rings in birds,which overlapped and interlocked with adjacentrings (Dellmann and Eurell, 1998). Literatureavailable on gross anatomical and histologicalstudies on the trachea in Japanese quail islimited. To bridge this deficiency, the presentstudy was undertaken.
*Part of M.V.Sc. thesis submitted by the first author to the Kerala Agricultural University, Thrissur1. VAS, Kancheepuram, Tamil Nadu2. & 3. Associate Professors4. Professor & Head, CVAS, Pookode, Wayanad
Materials and Methods
The trachea was collected from 20apparently healthy adult Japanese quails fromUniversity Poultry Farm, Mannuthy and studiedfor their gross and histological details. Thetrachea was cut across into small pieces andwas processed conventionally. Paraffinsections of 4 to 5 ìm thickness were taken andstained using Haematoxylin and Eosin,Mallory’s phosphotungstic acid haematoxylinfor striated muscle fibres, Van Gieson’s methodfor collagen fibres, Verhoeff’s haematoxylin forelastic fibres and Gomori’ s one step trichromemethod for connective tissue and muscle fibres(Luna, 1968). Micrometrical parameters likeheight of the lining epithelium and width of thelamina propria, cartilaginous rings and tunicaadventitia were recorded using ocularmicrometer.
Results and Discussion
Trachea extended from the craniallarynx to the syrinx or caudal larynx. Theanterior end of the trachea was placed in themidline ventral to the oesophagus. It wasattached to the oesophagus by connectivetissue. The average length of the trachea was4.05 ± 0.08 cm. In chicken, the length rangedfrom 17.0 to18.0 cm in males and 15.5 to 16.5cm in females (Mc Lelland, 1975). Distal to alength of 1.5 to 2 cm, the trachea was directedslightly towards the right of the median planewith the oesophagus on its left side. The
J. V
et. A
nim
.Sci
. 20
09.
40 :
17-
19
17
RESEARCH ARTICLE
S. Rajathi et al.

trachea was related to the cervical vertebraedorsally and to the skin of the cervical regionventrally. It entered the thoracic cavity betweenthe two rami of the furcula. At the thoracic inlet,it was related to the crop on the right side. Oneither side of the trachea was the sternotrachealismuscle. In chicken, King and Molony (1971)reported that sternotrachealis muscle wasresponsible for the oscillation of the tracheaand syrinx rostrocaudally in and out of thethoracic inlet.
The trachea had a skeleton ofcomplete cartilaginous rings. Number of ringsranged from 110 to 116. Nickel et al. (1977)reported the presence of 100 to 130 rings inthe trachea of fowl. These rings were ofdifferent sizes in the present study. The largerrings almost touched each other and thesmaller rings were inside halfway between theopenings of the larger rings forming a doubletube. Similar observations were made indomestic birds by Mennega (1962). In WhitePekin ducks, Mennega (1962) found that thetracheal rings were complete and bony withfour notches, two on each side, which allowed
them to interlock so that one half of each ringlay on the outside, while the other half wasinside. This also formed a double tube, whichprovided good protection to the air passages.Mathey (1965) reported that the ossification oftracheal rings occurred earlier in the goose andduck than in the chicken and turkey. Thetracheal rings were connected with each otherby narrow annular ligaments.
The last few tracheal rings precededthe tympanum of the syrinx. The maximummean width recorded in the cranial third of thetrachea was 4.01 ± 0.05 mm. In the caudalthird, the mean diameter was 1.95 ± 0.08 mm.The corresponding values in the trachea ofchicken were reported to be 6.0 to 7.0 mm and2.0 to3.0 mm, respectively (Hodges, 1974).The tracheal rings were oval in cross section.In fowl, King and Molony (1971) reported thatthe rings of the cranial third of the trachea wereoval transversely and the rest were circular incross section.
Histological section through thecartilaginous ring of the trachea showed thefollowing layers from inner to the outer surface:
Fig. 1. Longitudinal Section of the tracheashowing mucosa1) Mucosa 2) Blood vessel 3) Lamina propria 4) Mucous gland
Fig. 2. Longitudinal Section of the trachea showing theoverlapping cartilages1) Tracheal cartilage 2) Tunica adventitia 3) Sternotrachealis4) Adipose tissue 5) Blood vessel 6) Perichondrium
Fig. 3. Longitudinal Section of the tracheal cartilage1) Perichondrium 2) Lacunae 3) Chondrocyte4) Intercellular Matrix 5) Tunica adventitia 6) Adipocyte
Fig. 4. Tunica adventitia showing large blood vessel1) Blood vessel 2) Sternotrachealis 3) Adipose tissueJ.
Vet
. Ani
m.S
ci.
2009
. 40
: 1
7-19
RESEARCH ARTICLE
18 Trachea in Japanese Quail...

the mucosa, submucosa with cartilage ringsand adventitia. The mucosa was lined bypseudo stratified ciliated columnar epithelium.Similar observations were also reported inmammals by Rizzo (2006). The mean heightof the epithelial cells ranged from 9.38 to 15.00ìm. The basal cells were smaller and had roundnuclei, while the ciliated columnar cells showedoval nuclei. The lamina propria was 234 to 325ìm wide and showed loose connective tissuewith mucous glands, which were lined withpyramidal cells (Fig.1). The nucleus was ovaland placed towards the base of the cell. Theapical portion showed foamy cytoplasm.Lamina propria contained collagen and elasticfibres, blood vessels and nerve fibres. Similarobservations were made in chicken by Hodges(1974) and Aughey and Fyre (2001). Diffuselymphocytes were also noticed in the laminapropria.
The cartilaginous rings were flattenedtriangular in longitudinal section with a meanwidth of 143 ìm in the centre and 57 ìm towardsthe ends (Fig.2). It was made up of hyalinecartilage (Fig. 3) as reported by Dellmann andEurell (1998) in chicken. The adjacentcartilaginous rings overlapped in this stage.The smaller and larger rings were arrangedalternatively. Externally there was a very thinadventitia of 9.38 to 22.5 ìm width. It was madeup of connective tissue, which showednumerous blood vessels and some adipocytes(Fig.4). The longitudinal section ofsternotrachealis muscle is shown in fig. 2. Itwas made up of striated muscle fibres. Thepresence of this muscle has also been reportedby Hodges (1974) in fowl. Banks (1993)reported that in chicken longitudinally orientedstriated muscle was located at the peripheryof the trachea in a lateral position. Trachealismuscle seen in the case of animals was absentas reported by Dellmann and Eurell (1998).
References
Aughey, E. and Fyre, L.F. 2001. ComparativeVeterinary Histology with ClinicalCorrelates. Iowa State UniversityPress, Ames. pp. 82-96
Banks, W.J. 1993. Applied VeterinaryHistology. 3rd ed., Mosby Year Book,St. Louis. pp. 404 - 407
Dellmann, H. D. and Eurell, J. 1998. Textbookof Veterinary Histology. 5th ed.,Williams and Wilkins, Baltimore. pp.162-163
Hodges, R. D. 1974. The Histology of the Fowl.Academic Press, London. 572 p
King, A. S. and Molony, V. 1971. The anatomyof Respiration. In.: Bell, D.J. andFreeman, B.M (Eds). Physiology andBiochemistry of the domestic fowl.Academic press, London. pp. 93-164.
Luna, L. G. 1968. Manual of Histolog icalStaining Methods of the Armed ForcesInstitute of Pathology. 3rd ed., Mc.Graw-Hill Book Company, New York.p. 258 .
Mathey, W. J. 1965. Avian tracheal rings. Poult.Sci., 44: 1465-1467.
Mc Lelland, J. 1975. Aves Respiratory System.In: Getty, R. (Ed.). Sisson andGrossman’s The Anatomy of theDomestic Animals, Vol. II. W.B.Saunders Co., Philadelphia. pp.2063-2095
Mennega, A. 1962. The tracheal rings indomestic birds. Poult. Sci., 43: 1279.
Nickel, R., Schummer, A. and Seiferle, E. 1977.Anatomy of the Domestic Birds.Verlag Paul Parey, Berlin. 202 p
Rizzo, D.C. 2006. Fundamentals of Anatomy andPhysiology. 2nd ed., Thomson DelmarLearning, United States. 518 p
�
J. V
et. A
nim
.Sci
. 20
09.
40 :
17-
19
19
RESEARCH ARTICLE
S. Rajathi et al.

COMPARISON OF ANTIBODY TITRES OFNEWCASTLE DISEASE VIRUS IN RANDOMLYCOLLECTED SERA AND EGG YOLK OF LAYERS
Nidhin Raj1, Praseena Poulose1,Surya P. S.1, Chintu Ravishankar2
and Mathew Sebastian3
Department of Veterinary MicrobiologyCollege of Veterinary and Animal SciencesPookode, Wayanad, Kerala - 673 576
Abstract
A study was conducted to comparethe Newcastle Disease (ND) virus antibody titrein randomly collected sera and egg yolk oflayers using haemagglutination inhibition (HI)test. The mean log2 HI titre values detected insera and egg yolk were 4.50 and 5.68respectively. Statistically there was significantdifference between the two means (p < 0.03).Egg yolk samples may be used as a testmaterial for detection of titre of ND virusantibodies in layers. But when egg yolk is thetest material, the HI titre detected tends to besignificantly higher.
Key words Newcastle Disease, haemag-glutination inhibition test, serum, egg yolk.
Newcastle disease (ND) is a viraldisease of birds caused by ND virus (NDV) ofGenus Avulavirus of Family Paramyxoviridae.Antibody titre against this virus is commonlyassessed in bird sera by haemagglutinationinhibition (HI) test. Though studies to comparethe HI titres of NDV antibodies in birds andtheir corresponding eggs have beenconducted, those on randomly collected birdsera and eggs are scarce. If the levels of theantibodies in randomly collected sera and eggsare comparable, then eggs can be preferredover sera for assessment of the antibody titreespecially in farms. Hence a study wasconducted to compare the NDV antibody titresin sera and egg yolk of layers collected atrandom from an organised farm.
1. Veterinary Graduates2. Assistant Professor( On study leave)3. Associate Professor (Statistics), College of Fisheries, KUFOS, Panangad P.O., Kochi- 682 506
Materials and Methods
A total of 24 blood samples and 29egg samples were collected at random frombirds maintained at the University Poultry Farm,College of Veterinary and Animal Sciences,Pookode. All the birds had been vaccinatedagainst ND using a commercial vaccine fivemonths back. Blood was collected asepticallyfrom the wing vein using sterile technique,allowed to clot and serum separated bycentrifugation and stored at -20°C until tested.Eggs were collected on the same day andstored at room temperature. The eggs werebroken and the contents gently transferred toseparate filter papers. One ml of the yolk wascollected and diluted in nine ml of sterile normalsaline (1:10 dilution), mixed well andcentrifuged at 2000 x g for 20 min. From thesupernatant, 0.2 ml was collected and used inthe HI test. Sera (0.2 ml) were used withoutany dilution.
A field isolate of NDV obtained fromthe Department of Veterinary Microbiology,College of Veterinary and Animal Sciences,Mannuthy was used in the study. The isolatewas passaged in 9 to 11 day old embryonatedchicken eggs by the allantoic route ofinoculation. The allantoic fluid was collectedfrom the inoculated eggs and used as sourceof virus in the HI test. The HI test (â method)was performed as described by Allan andGough (1974). Briefly the HI test wasconducted as follows. Initially ahaemagglutination (HA) test was performed bymaking serial two fold dilutions of the virus
J. V
et. A
nim
.Sci
. 20
09.
40 :
20-
21RESEARCH ARTICLE
20 Antibody Titres of Newcastle Disease Virus...

(allantoic fluid) in a perspex HA plate andadding a fixed quantity of 0.5 per cent chickenRBC (cRBC) suspension to all the wells andincubating at room temperature for 30 to 45min. A c RBC control without any virus was alsokept. The HA titre was recorded as thereciprocal of the highest dilution of the virusshowing complete HA. After the HA test wasconducted, the HI test was performed bymaking serial two fold dilutions of the sera ordiluted yolk and adding 4HA units of the virusto all the wells and incubating for 30 minutesfor neutralisation to occur. Then a fixed quantityof 0.5 percent cRBC was added to all the wellsand incubated at room temperature for 30 to45 min. Suitable virus, serum and cRBCcontrols were also included in the test. The HItitre was recorded as the reciprocal of thehighest dilution of sera or yolk showingcomplete inhibition of HA. The HI titre obtainedwas expressed as log2 values. In case of eggyolk, the HI titre obtained was multiplied by 10and then converted to log values to account
for the dilution (for example a HI titre of four inthe test was converted to 40 and a log value offive; a titre of eight was converted to 80 andlog value of six etc.). The mean log2 HI titrevalues in sera and egg yolk were calculatedand compared using t test (Zar, 2003).
Results and Discussion
The results of the study are given inthe table . The mean log2 HI titre values in seraand egg yolk were 4.50 and 5.68 respectively.Statistical analysis of the data showedsignificant difference between the two means(P < 0.03). This indicates that the antibody titredetected in egg yolk is significantly higher thanthat in sera. Reports on comparison of HI titrein randomly collected sera and egg yolk arelimited. Yeo and Choi (1979) and Yeo et al.(2003) compared the NDV HI titres in hens andtheir corresponding eggs and reported that HItitres in egg yolk tend to be slightly higher thanthat in sera which is in accordance with ourfindings.
Acknowledgement
The authors thank the AssociateDean, College of Veterinary and AnimalSciences, Pookode, for providing the facilitiesfor conduct of the study.
References
Allan, W. H. and Gough, R. E. 1974. A standardhemagglutination inhibition test forNewcastle disease. A comparison ofmacro and micro methods. Vet. Rec.,95: 120-123
Yeo, S. G. and Choi, W.P. 1979. Immune statusof breeding hens against Newcastledisease. Korean J. Vet. Res., 19: 45–51
Yeo, S. G., Nagy, E. and Krell, P. J. 2003.Indirect method for prediction ofhemagglutination inhibition antibodytiters to Newcastle disease virus inchickens by titration of antibodies inegg yolk. J. Vet. Diagn. Invest.,15: 184–187
Zar, J. H. 2003. Biostatistical Analysis. PearsonEducation, Singapore.
�
Serum Egg
Sample size 24 29
Minimum 0 0
Maximum 8 8
Mean 4.50 5.68
Standard deviation 2.10 1.41
Standard error 0.43 0.26
Confidence interval (95%) (3.61, 5.39) (5.15, 6.21)
t value 2.26
Probability (p) < 0.03
Table . Results of comparison of log2 HI titres from egg yolk and sera
J. V
et. A
nim
.Sci
. 20
09.
40 :
20-
21
21
RESEARCH ARTICLE
Nidhin Raj et al.

MORPHOLOGICAL STUDIES ON THEINFUNDIBULUM OF KUTTANAD DUCK(Anas platyrhynchos domesticus) DURINGPOSTNATAL PERIOD
H. S. Patki1, K. M. Lucy2,K. R. Harshan3 and J. J. Chungath4
Department of Veterinary Anatomy and HistologyCollege of Veterinary and Animal SciencesMannuthy -680 651, Thrissur, Kerala
Abstract
Postnatal development of theinfundibular region of the oviduct in Kuttanadducks was studied using 78 ducklings fromday-old to 24 weeks of age. The material wascollected from six birds in each group atfortnightly intervals. Infundibulum was notdifferentiated until 10th week of age, but by 12weeks it entered into a rapid phase ofdifferentiation and the infundibulum wasdivisible into funnel and neck regions.Kuttanad duck showed a relatively shortinfundibulum similar to that of chicken andturkey. From 12th week to 24th week of age,the funnel and neck parameters ofinfundibulum showed highly significant positivecorrelation with age and weight and length ofthe oviduct. However, no significant correlationwas noticed between infundibular parametersand the body weight during postnatal period.It was observed that during the egg-layingperiod the weight-wise and length-wisecontribution of infundibulum was found to bemore than that in the pre-laying period.
Key words: Postnatal development, infundibulum,Kuttanad Duck
Kerala is the home tract of theKuttanad breed of ducks which are favouredover Khaki Campbell ducks by the farmers dueto attractive egg size and better diseaseresistance (Jalaludeen et al., 2004). In orderto ensure persistent and maximum productionand to evolve better managemental practices,
1. Teaching Assistant, UAS, Hebbal, Bangalore2. Associate Professor3. Professor (Retd.)4. Professor and Head, CVAS, Pookode, Wayanad
a sound knowledge on the developmentalaspects of the reproductive tract is essential.
Infundibulum plays key functional rolein capture and transfer of ovum and formationof chalazae. Although research works havebeen conducted on the infundibular region ofthe oviduct in domestic fowl (Aitken andJohnston, 1963; Hodges, 1974; King, 1975 andNickel et al., 1977), Japanese quail (Lucy andHarshan, 1999a), turkey and pigeon(Mohammadpour and Keshtmandi, 2008),information regarding the developmentalpattern of the infundibulum in duck is scanty.Hence, the present work was undertaken tofind out the relationship of the developmentalpattern of the infundibulum with age, bodyweight and oviductal parameters duringpostnatal period in Kuttanad ducks.
Materials and Methods
In all, 78 Kuttanad ducks were usedfor the present study. The birds were selectedrandomly from a single hatch and reared at theUniversity Poultry Farm, Mannuthy under semi-intensive system of management. Feed andwater was provided ad lib. The ducklings werenot given any vaccination. The study wascarried out in birds of different age groups,ranging from day-old to 24 weeks. The materialwas collected from six birds in each group atfortnightly intervals. The morphometry includingweight, length and diameter of the infundibulumwas recorded. The data were analysedstatistically (Snedecor and Cochran, 1994).
J. V
et. A
nim
.Sci
. 20
09.
40 :
22-
25RESEARCH ARTICLE
22 Infundibulum of Kuttanad Duck...

Results and Discussion
Two phases of growth were observedduring the developmental period in theinfundibulum of the oviduct of the Kuttanadduck i.e., phase of structural and functionalnon-differentiation and phase of completedifferentiation. The first phase was observedfrom day-old to 10th week of age, in which,infundibulum was not differentiated from themagnum and isthmus regions andmorphological development was negligible.The second phase started from 12th weekonwards and all the five segments of theoviduct including the infundibulum weredifferentiated. Subsequently the infundibulumbecame morphologically divisible into cranialfunnel and caudal neck regions. In Japanesequail different segments of the oviduct couldbe distinguished from 40 days of age (Lucyand Harshan, 1999a).
Age Weight of Funnel (g) Length of Funnel (cm) Width of Funnel (cm)
12 weeks 0.03 ± 0.00 0.70 ± 0.02 7.18 ± 0.05
14 weeks 0.08 ± 0.00 0.70 ± 0.02 8.40 ± 0.12
16 weeks 0.12 ± 0.00 0.80 ± 0.03 10.38 ± 0.14
18 weeks 0.69 ± 0.00 0.80 ± 0.02 11.15 ± 0.04
20 weeks 1.01 ± 0.02 3.10 ± 0.04 11.88 ± 0.08
22 weeks 1.35 ± 0.02 3.30 ± 0.09 12.16 ± 0.02
24 weeks 1.49 ± 0.01 3.40 ± 0.02 12.88 ± 0.10
Table. 1 Age related changes in the parameters of funnel region of infundibulum (Mean ± S.E.)
Age Weight of Neck (g) Length of Neck (cm) Width of Neck (cm)
12 weeks 0.02 ± 0.00 0.70 ± 0.03 0.40 ± 0.03
14 weeks 0.04 ± 0.00 0.80 ± 0.03 0.58 ± 0.02
16 weeks 0.05 ± 0.00 1.00 ± 0.02 0.68 ± 0.02
18 weeks 0.06 ± 0.00 1.20 ± 0.05 0.70 ± 0.01
20 weeks 0.60 ± 0.00 3.70 ± 0.05 0.74 ± 0.01
22 weeks 1.06 ± 0.00 3.80 ± 0.02 0.90 ± 0.17
24 weeks 1.16 ± 0.02 3.80 ± 0.04 1.27 ± 0.03
Table. 2 Age related changes in the parameters of neck region of infundibulum (Mean ± S.E.)
Age related parameters of the funneland neck regions of the infundibulum inKuttanad ducks are given in tables 1 and 2. At12th week of age, the weight of the funnel regionof the infundibulum was 0.03 ± 0.00 g and wasgreater than that of the neck (0.02 ± 0.00 g).This relationship remained constant for allsucceeding age groups and at 24th week ofage, funnel region weighed 1.49 ± 0.01 g which
was higher than that of the neck (1.16 ± 0.02g) (Tables 1 and 2). Length of the neck regionwas more than that of the funnel in all agegroups. The funnel was much wider than theneck throughout the postnatal period. In adultbirds (by 20 weeks onwards), the thin walledfunnel was flattened dorsoventrally and itsflared lips were in close proximity to the ovary(Fig. 1). Infundibulum contributed 11.42% ofthe oviduct length at 24 weeks of age (Fig. 2).Thus, Kuttanad duck showed a relatively shortinfundibulum similar to that of chicken andturkey (Woodard and Mather, 1964). Contraryto this, a relatively longer infundibulum,contributing 17.1% of the total oviduct length,was observed in the adult Japanese quail (Lucyand Harshan, 1999b).
From 12th to 24th weeks of age, theweight, length and width of the funnel and neckregions of the infundibulum showed highly
significant positive correlation with age (Table3). But no significant correlation was noticedbetween infundibular parameters and the bodyweight. Weight and length of the funnel aswell as the neck regions of the infundibulumshowed highly significant positive correlationwith the weight and length of the whole oviductat 1% level of significance, whereas, width ofthe infundibulum showed significant correlation
J. V
et. A
nim
.Sci
. 20
09.
40 :
22-
25
23
RESEARCH ARTICLE
H. S. Patki et al.

Fig. 2. Percentage contribution of segments of oviduct to the total length at different ages
Fig. 1. Segments of the oviduct (22 weeks)1. Ovary; 2. Funnel of infundibulum; 3. Neck of infundibulum;4. Ventral ligament; 5. Dorsal ligament; 6. Magnum;7. Magnum-isthmus junction; 8. Isthmus;9. Uterus with an egg; 10. Vagina; 11. Cloaca.
with the weight and length of the oviduct onlyat 5% level of significance (Table 3).
It was observed that during the egg-laying period the weight-wise and length-wisecontribution of infundibulum to the total lengthof oviduct was found to be more than that inthe pre-laying period. It was also found that,such difference in weight and length of theinfundibulum was positively correlated to totalweight and length of the oviduct and wasirrespective of the body weight of the bird atthat age. In domestic fowl, similar findingswere reported by Khokhlov (2008) whospeculated that the regular fluctuations inweight, length and width of the infundibulumwith respect to total weight and length of theoviduct indicated the synchronization with thefunctional stages of the oviduct.
Parameters Age Body weight Weight of Length ofOviduct (g) Oviduct (cm)
Weight of Funnel of 0.970** 0.225 NS. 0.953** 0.969**Infundibulum (g)Weight of Neck of 0.908** 0.038 NS. 0.955** 0.958**Infundibulum (g)Length of Funnel of 0.900** 0.084 NS. 0.997** 0.989**Infundibulum (cm)Length of Neck of 0.906** 0.153 NS. 0.998** 0.991**Infundibulum (cm)Width of Funnel of 0.965** 0.483 NS. 0.829* 0.884**Infundibulum (cm)Width of Neck of 0.930** 0.018 NS. 0.787* 0.844*Infundibulum (cm)
Table. 3 Correlation coefficients (r) of oviductal parameters on age, body weight and weight andlength of the oviduct
** Correlation is significant at 1% level, * Correlation is significant at 5% level,NS. Correlation is non-significant.J. V
et. A
nim
.Sci
. 20
09.
40 :
22-
25RESEARCH ARTICLE
24 Infundibulum of Kuttanad Duck...

�
References
Aitken, R. N. C. and Johnston, H. S. 1963.Observations on the fine structure ofthe infundibulum of the avian oviduct.J. Anat., 97: 87-89.
Hodges, R. D. 1974. The Histology of the Fowl.Academic Press, London, 648 p.
Jalaludeen, A., Peethambaran, P. A., Leo, J.and Manomohan, C. B. 2004. DuckProduction in Kerala. NATP on Ducks,CVAS, KAU, Mannuthy. 44 p.
Khokhlov, R. YU. 2008. Morphology ofinfundibulum of the oviduct of thesexually mature hens. Int. J. Morphol.,26:883-886.
King, A. S. 1975. Aves - Urogenital system. In:Getty, R. (Ed.). Sisson andGrossman’s the Anatomy of theDomestic Animals. Vol. 2. 5th ed., W.B. Saunders Co., Philadelphia pp.1935-1959.
Lucy, K. M. and Harshan, K. R. 1999a.Developmental pattern of oviduct inJapanese quail from postnatal toadulthood. Indian J. Poult. Sci., 34 :21-24.
Lucy, K. M. and Harshan, K. R. 1999b.Structure and development ofinfundibulum in Japanese quail.Indian J. Poult. Sci., 34 : 125-128.
Mohammadpour, A. A. and Keshtmandi, M.2008. Histomorphological study oninfundibulum and magnum in turkeyand pigeon. World J. Zool., 3 : 47-50.
Nickel, R., Schummer, A. and Sieferle, E. 1977.Anatomy of the Domestic Birds.Verlag Paul Parey, Berlin, 202 p.
Snedecor, G. W. and Cochran, W. G. 1994.Statistical Methods.7th ed., The IowaState University Press, USA, 313 p.
Woodard, A. E. and Mather, F. B. 1964. Thetiming of ovulation, movement of theovum through the oviduct,pigmentation and shell deposition inJapanese quail (Coturnix coturnixjaponica). Poult. Sci., 43: 1427-1432.
J. V
et. A
nim
.Sci
. 20
09.
40 :
22-
25
25
RESEARCH ARTICLE
H. S. Patki et al.

GENETIC ANALYSIS OF BODY WEIGHTS INRABBITS*
P. M. Rojan1, K. A. Bindu2,K. V. Raghunandanan3 andK. C. Raghavan4
Department of Animal Genetics and BreedingCollege of Veterinary and Animal SciencesMannuthy- 680 651,Thrissur, Kerala
Abstract
A complete 3 x 3 diallel cross wasperformed to study the growth performance ofrabbits belonging to three different breedsnamely White Giant (WG), Soviet Chinchilla(SC) and Grey Giant (GG) at the UniversityRabbit Farm, Centre for Advanced Studies inAnimal Genetics and Breeding, College ofVeterinary and Animal Sciences, Mannuthy,Kerala. Growth records of F1 progeny weretaken at fortnightly intervals up to fourteenweeks of age. Kits were weaned at four weeks.The data corrected for significant non-geneticeffects were used for estimating geneticparameters. Heritability, genetic andphenotypic correlations were estimated bypaternal half sib correlation method separatelyfor different breeds and for pooled population.Heritability estimates of weight at fourth, twelfthand fourteenth weeks were 0.380±0.239,0.657±0.379 and 0.727±0.407 respectively,indicating effectiveness of selection for bodyweight at weaning age. Genetic andphenotypic correlations of body weightbetween immediate age groups were greaterthan those widely separated. The genotypiccorrelation between second and eighth weekbody weight were high and positive.
Key words: Rabbit, growth performance,diallel, heritability and phenotypic correlations
In the recent years there has been arise in global awareness on the virtues of rabbitmeat, especially in developing countries,depicting it as an alternative means of
*Part of M.V.Sc. thesis submitted by the first author to the Kerala Agricultural University, Thrissur 1. Veterinary Surgeon, AHD, Kerala 2. Associate Professor, CVAS, Pookode, Wayanad3. Professor (Retd.)4. Director
alleviating world food shortages. In developingcountries, there exist a tremendous potentialfor rabbits based on economic traits like highrate of reproduction, early maturity, rapidgrowth rate and efficient feed utilisation.
India faces enormous shortages inmeat supply and has the greatest chance totap the potentials of rabbit production. Thepopulation of valuable pure bred rabbits in thestate of Kerala is facing a rapid decline due toadoption of indiscriminate breedingprogramme. In this context it is essential tostudy the performance of these breeds in ourdiversified environmental conditions. Toprovide quality breeding stock to farmers, abasic study on heritability, genetic, phenotypicand environmental correlations affectinggrowth traits is warranted.
Materials and MethodsThe experiment was carried out at the
University Rabbit Farm under the Centre forAdvanced Studies in Animal Genetics andBreeding, College of Veterinary and AnimalSciences, Mannuthy, Thrissur between March2007 and July 2008. White Giant (WG), SovietChinchilla (SC) and Grey Giant (GG) breedsof rabbits formed the foundation stocks in thisprogram. A complete three x three diallel crosswas performed with a total of 44 does and ninebucks of three purebreds of WG, SC and GGin two different seasons. The data weregenerated from first filial generation (F1) kitsproduced by crossing in all possiblecombinations of the three parental groups with
J. V
et. A
nim
.Sci
. 20
09.
40 :
26-
28RESEARCH ARTICLE
26 Genetic Analysis of Body Weights...
minimum of four full sib groups in each set ofcrosses. Weaning of bunnies was done at theage of four weeks and housed together ingroups there after. Daily ration consisted of adlibitum green fodder and 50 to 200g ofconcentrates consisting of 15 to 20 percentcrude protein depending on the age and size.The animals had access to drinking waterround the clock. Body weight of each animalwas recorded from birth to fourteenth week ofage at fortnightly intervals. The litter size wasrecorded within 24 h of kindling. Theexperiment was scheduled in two seasons viz.cold and hot seasons. In the course of theexperiment, the period from May to Septemberwas considered as cold season and theremaining period as hot season. Body weightof dam was recorded in kilograms within 24 hof kindling. The animals were divided into threegroups based on their body weights as 2 to2.5, 2.5 to 3 and above 3 kg. The age of damat kindling was recorded and the animals werecategorized into three groups as dam agedbelow 1000, 1000 to 2000 and above 2000days.Estimation of heritability, genetic and phenotypiccorrelations
The data on body weights wereanalysed by least squares technique (Harvey,1960) using SPAB 2.0- Software Statisticalpackage for animal breeding (Sethi, 2002) tostudy the influence of genetic and non-geneticfactors. The data adjusted for non-geneticfactors like sex, season of birth, litter size atbirth, age and weight of dam at kindling, wereused for genetic analysis. Heritability wasestimated by paternal half sib correlationmethod (Sethi, 2002). The model used was
Yij = µ + Si+ eij
Yij - Observation of jth progeny of ith sire
µ - Effect common to all individuals
Si – Effect due to ith sire with E(Si)= 0 and V(Si)=ó2
si
eij – Random effect due to error with E(ei)= 0and V(ei)= ó2
ei
Genetic, phenotypic andenvironmental correlations were calculated byusing paternal half sib method with help ofSPAB 2.0 (Sethi, 2002).
Results and DiscussionHeritability estimates of body weights at differentages
The heritability estimates of bodyweights at different ages of rabbits from thepooled data are presented in Table. Heritability
estimates for body weights at birth, two, four,six, eight, ten, twelve and fourteen weeks ofage were 0.193±0.165, 0.355±0.229,0.380±0.239, 0.499±0.287, 0.089±0.141,0.644±0.358, 0.657±0.379 and 0.727±0.407,respectively in rabbits under study. Heritabilityestimates for body weights of WG at birth,second, fourth, sixth, eighth, twelfth andfourteenth weeks stood at 0.2235±0.3942,0.3381 ± 0.4837, 0.3489 ± 0.4918, 0.0701 ±0.2696, 0.0769 ± 0.2944, 0.0479 ± 0.3112 and0.4774 ± 0.6386 respectively. Value for tenthweek was below zero. For SC, high estimatesof heritability were obtained for tenth(0.8017±0.7859), twelfth (0.6558±0.7673) andfourteenth (0.7138±0.7993) week’s bodyweight. Corresponding values for other agegroups were medium and a few were negative.Heritability estimates for body weights for GGat fourth, sixth and fourteenth weeks were0.2211 ± 0.3490, 0.4227 ± 0.5307 and 0.2571± 0.5876, respectively. In rabbits, heritabilityestimate component showed an increasingtrend from birth to fourteenth week of ageexcept for eighth week. This might be areflection of the fact that as age advanced thegenetic make up or the additive genetic effectsbecame more pronounced than environmentaleffects. Heritability estimates were higher forten, twelve and fourteen week age groups. Forhigh values of heritability, trait’s phenotype isgood indicator of underlying breeding values(Farghaly and El-Mahdy, 1999). So phenotypicselection will be effective for higher age bodyweights. At fourteenth week of age heritabilityestimate was 0.7138 ±0.7993 in SC similar tothe reported heritability estimates in SC byBhushan et al. (1998) and Kasiviswanathan(2000). Some heritability estimates arrived atwas found to be above one which may be dueto low sample size. Discrepancies between theestimates, heritability values depend on thegenetic make up of the stocks, managementand climatic conditions and period of study aswell as differences in data size, models of datacorrection and method of analysis (Khalil et al.,1986).
Genetic and phenotypic correlation among bodyweights at different ages
The genetic correlation estimatesamong body weights for the pooled data arepresented above the diagonal in Table andphenotypic correlation estimates below thediagonal. High genetic correlation between J.
Vet
. Ani
m.S
ci.
2009
. 40
: 2
6-28
27
RESEARCH ARTICLE
P. M. Rojan et al.

body weights indicates the synergestic controlof the same additive gene. Genetic correlationobserved between second and eighth weekweight was high, indicating that selection ofbody weight at second week also improves theeighth week body weight. Phenotypiccorrelation ranged from 0.140±0.074 (betweenbirth and eighth weeks of age) to 0.885±0.042(between twelfth and fourteenth weeks of age).Phenotypic correlations values with respect tobody weight between age groups of minimal
separation was found to be higher than thosethe widely separated. Similar observationswere made by Bhushan and Ahlawat (1999).Singh et al. (2007) reported positive correlation(0.68) between sixth and twelfth weeks bodyweight.
AcknowledgementAuthors are grateful to the Dean,
College of Veterinary and Animal Sciences,Mannuthy for the facilities provided for thisresearch work.
ReferencesBhushan, B. and Ahlawat, S. P. S. 1999.
Estimation of genetic parameters forpost-weaning body weights in NewZealand White rabbits reared underagroclimatic conditions of Sikkim.Indian J. Anim. Sci., 69: 511-513.
Bhushan, B., Gaur, G. K. and Ahlawat, S. P. S.1998. Genetic parameters of growthin New Zealand White rabbitsadjusting different planes of feeds.Indian J. Anim. Sci., 68: 187-188.
Farghaly, H. M. and El-Mahdy, M. R. M. 1999.Genetic and non genetic factorsaffecting live, carcass and noncarcass traits of New Zealand Whiterabbits in Egypt. Indian J. Anim. Sci.,69: 596-603.
Harvey, W. R. 1960. Least squares analysis ofdata with unequal subclass numbers.U. S. Department of Agriculture, ARS,20-8.
Kasiviswanathan, D. 2000. Genetic factorsinfluencing feed efficiency in pure andcrossbred broiler rabbits. M.V.Sc.thesis, Kerala Agricultural University,Thrissur. 69 p.
Khalil, M. H. E., Owen, J. B. and Afifi, E. A.1986. A review of phenotypic andgenetic parameters associated withmeat production traits in rabbits.Anim. Breed. Abstr., 54: 726-749.
Sethi, I. C. 2002. Project Report: StatisticalPackage for Animal Breeding. IndianAgricultural Statistics ResearchInstitute, New Delhi. 57 p.
Singh, U., Sharma, S. R., Bhatt, R. S., Bhasin,V. and Risam, K. S. 2007. Growth andreproductive performance of GreyGiant rabbits under sub temperateconditions in Himachal Pradesh.Indian J. Anim. Sci., 77: 328-330.
�
Table. Heritability, genetic and phenotypic correlations of body weights from pooled data
Diagonal values are heritability, above diagonal genetic correlations and below diagonal phenotypic correlations
J. V
et. A
nim
.Sci
. 20
09.
40 :
26-
28RESEARCH ARTICLE
28 Genetic Analysis of Body Weights...
/ cannot be estimated

HOUSING DESIGNS AND ITS IMPACT ONMICRO CLIMATE OF CATTLE SHEDS INCHENNAI CITY*
S. Meenakshisundaram1,P. Tensingh Gnanaraj2, M. Murugan³,Ra Murallidharan4 and R. Kumararaj5
Department of Livestock Production and ManagementMadras Veterinary College, Chennai-7
Abstract
A study on housing designs and itseffect on microenvironment were carried outin 17 randomly selected cattle sheds (ownedby private milkmen) of Chennai city and itssuburbs. The cow houses were classified aspoor and good types based on score andvalues. The mean values were 46.00 and 67.71per cent for poor and good types respectively.The poor type cow houses were located in thecrowded areas of the city, with high rise wallsand poor ventilation with a floor spaceallowance of 2.61 m2 per cow. The good typecow houses located in less crowded areas ofthe city and suburbs and had optimum floorspace allowance of 3.84 m2 per cow. The meanair temperature and relative humidity inside thepoor type houses remained significantly(P<0.01) higher than outside both in morningand evening whereas in the good type housesthey remained the same. The air velocityinside poor type houses remained significantly(P<0.01) lower both in mornings and eveningsthan good type houses, though the air velocityoutside both the housing types remained thesame. The air velocity showed a significant(P<0.01) negative correlation with relativehumidity indicating that the built up of humidityin poor type houses was due to poor ventilation.
Key words : Housing designs, microenvironment,cattle sheds
*Part of M.V.Sc. thesis submitted by the first author to the Tamil Nadu Veterinary and Animal Sciences University, Chennai-511. Assistant Professor2. & 3. Associate Professors4. Professor (Retd.)5. Professor and Head
The micro-environment is affected toa considerable extent by the meteorologicalfactors of the external environment, the typeof construction of animal house, themanagement practices and the animalshoused in time. Knowledge on housing designis essential in understanding the problems ofanimal comfort. Little information is availableon the micro-climate in different types of animalsheds. Some of the work reported in this aspectis confined to animal houses in organisedfarms and not on farmer’s field level. Hencean attempt is made in this work to study thehousing designs and its effect on the micro-environment of cattle sheds in Chennai city.
Materials and Methods
The study was conducted in thecowsheds owned by private milkmen inChennai city and its suburbs. Seventeen farmswere randomly selected out of which 12 werewithin city, three in suburban areas and two inrural areas. All the cowsheds were individuallyexamined, judged and scored using score cardmethod. They were classified as good and poorfor scores >50 and <50 respectively. Climaticvariables viz., air temperature and air velocity(Anemotherm air meter) and relative humidity(Whirling Psychrometer) were, recorded atweekly intervals both in the morning (7.00 AM)and evening (2.00 PM) in the selected farms.The data obtained were statistically analysed(Snedecor and Cochran, 1967).
J. V
et. A
nim
.Sci
. 20
09.
40 :
29-
34
29
RESEARCH ARTICLE
S. Meenakshisundaram et al.

Results and Discussion
It was seen that 12 out of 17 cowhouses selected for the study fell under thecategory of poor housing design (Table 1).They were mainly located in the crowded areasof the city. In these locations, the cow ownersdid not seem to pay much attention to properhousing of their cows. The mean floor spaceallowance given in these poor housing designswas only 2.61 m2 per cow which was muchbelow the standard requirements. In a largescale sample survey conducted in the ICDPareas of Maharashtra State in 1970, Raut(1982) could find that the floor space allowancegiven to the milch cows had a definite bearingon their milk production. He recommended afloor area of 4.37 m2 per cow, an ideal design,and a score of 17 out of 20 to be necessary.Stergarrdoe et al. (1986) stated that restrictionof floor area adversely affected the behaviourof cows. In France, even under the temperateconditions, Brouillet and Raguet (1990)suggested a floor space allowance of 6 m2 percow.
It was also seen that only one cowhouse fell under the category of good designwithin the crowded city limits. The rest of thefarms were located either in less crowdedareas like Kilpauk or in the suburbs and rural
areas. The mean score given to this group ofhouses was 67.71 per cent which was only alittle less than the optimum. The cow housesthat have scored above 70 per cent were calledas ideal housing with open sides all aroundwith reasonably high roof to suit the needs ofthe cows under the stressful tropical climate.The optimum floor space allowance givenunder the classification of good housing designwas 3.84 m2.
The mean air temperature (Table 2)inside the poor type of housing was significantly(P<0.01) higher than that of outside air, bothat 7.00 AM and at 2.00 PM. The mean airtemperature inside the good type of house washigher than that of the outside environment andthis difference was not found to be statisticallysignificant. This indicated that the poor type ofhousing design greatly influenced thetemperature of the ambient air to a great extent,resulting in built up of unwanted temperaturein the vicinity of the housed animals puttingthem to stress. In a study conducted at IVRI,Izatnagar (Khub Singh et al., 1977) comparingthe micro-environment, it was found that themean daily temperature and the meanminimum temperature in closed type of shedswas significantly higher (P<0.01) than that ofthe macro-environment.
Cow house No. Location Score values Classification Floor space per cent per cow m2
1 Choolai 49 Poor 3.32
2 Choolai 48 Poor 1.97
3 Choolai 43 Poor 2.78
5 Mint 41 Poor 2.42
6 Mint 43 Poor 3.37
7 Broadway 49 Poor 1.93
8 Broadway 46 Poor 2.62
9 Broadway 49 Poor 2.30
10 Broadway 49 Poor 2.66
12 Nungabakkam 43 Poor 2.73
Mean 46.99 2.61
4 Mint 58 Good 2.59
11 Ningambakkam 84 Good 5.07
13 Kilpauk 59 Good 3.38
14 Kilpuak 57 Good 2.57
15 Tambaram 66 Good 2.5
16 Guduvanchery 70 Good 4.93
17 Thailavaram 80 Good 5.88
Mean 67.71 3.84
Table 1. Scores of cattle sheds
J. V
et. A
nim
.Sci
. 20
09.
40 :
29-
34RESEARCH ARTICLE
30 Housing Designs and Impact...

It is concluded that open type shedshas many advantages over the closed type inthe tropical North Indian climate of Izatnagar.The most common measure taken by theJapanese farmers to reduce the temperatureeffect on dairy farms was to improve thebuilding construction (Nomiyama et al., 1981)since it is proved beyond doubt that high
temperature and high humidity is deleteriousto milk production (Lurdi, 1982). Thiagarajanand Thomas (1990) also found that properhousing helped in reducing the extremes inmaximum and minimum air temperatures.Even though gross differences were noticedboth in the air temperature recorded inside andoutside, between the poor type and good type
Table 2. Means (± SE of air temperature 0C recorded in the cow houses.
Table 2a. Analysis of air temperature between the poor and good type of housing
** Significant at one per cent level (P<0.01)
J. V
et. A
nim
.Sci
. 20
09.
40 :
29-
34
31
RESEARCH ARTICLE
S. Meenakshisundaram et al.

of houses, with the poor type remaining at ahigher range, this difference was not found tobe statistically significant.
The relative humidity (Table 3) insidethe poor type of housing was significantly
(P<0.01) higher than that of outsideenvironment both at 7.00 AM and at 2.00 PM.The relative humidity inside the good type ofhousing was higher than that of outsideenvironment and this difference was not foundto be significant statistically. This indicated that
Table 3. Means (± SE) of relative humidity per cent recorded in the cow houses.
Table 3a. Analysis of relative humidity between the poor and good type of housing
** Significant at one per cent level (P<0.01)
J. V
et. A
nim
.Sci
. 20
09.
40 :
29-
34RESEARCH ARTICLE
32 Housing Designs and Impact...

poor type of housing design greatly influencedthe relative humidity of the ambient air to agreat extent, resulting in the built up of moistureinside the animal house adding stress to thealready overheated micro-environment. Undergood type of housing design, due to betterventilation there was proper exchange ofoutside air with the air inside the animal house.Khubsingh et al. (1988) studied the micro-
environment in three types of animal sheds viz.,closed facing west, closed facing east andopen, in relation to macro-environment. Theyfound that the closed type shed aggravatedand prolonged the heat stress of housedanimals in comparison to open type shed, byincreasing the overall temperature -humiditycomplex.
Table 4. Means (± SE) of the air velocity m/sec recorded in the cow houses
Table 4a. Analysis of air velocity between the poor and good type of housing
*Significant at five per cent level (P<0.05)** Significant at one per cent (P<0.01)
J. V
et. A
nim
.Sci
. 20
09.
40 :
29-
34
33
RESEARCH ARTICLE
S. Meenakshisundaram et al.

The relative humidity inside andoutside the poor type of houses was at a higherrange than that of good type of housing at 7.00AM, the difference being not statisticallysignificant. Similarly the relative humidity insidepoor type of housing was at a higher rangethan that of good type of housing at 2.00 PM,the difference being highly significant (P<0.01)reiterating the earlier findings that poor housingstructure interfered with elimination of moistureproduced by the heat stressed animals throughperspiration and evaporation.
The air velocity inside the poor typeof housing was significantly lower (P<0.01)than that of outside both at 7.00 AM and at2.00 PM (Table 4). The air velocity inside goodtype of housing was lower than that of outside
�
References
Brouillet, P. and Raguet, Y. 1990. Housing andenvironment of dairy cows and milkquality. Bulletin. des. G.T.V., 4 : 13-35.
Gatenby, R. M., Handayani, S. W.,Martaghidjela, M. and Waldraon, M.C. 1987. Modification to theenvironment by animal houses in ahot humid climate. Vet. Bull., 57 :4650.
Khub Singh, Joshi, B. C. and Bhattacharyya,N. K., 1977. A study on the nature ofmicro – climate in open and closedsheds in relation to macro -climate.Indian J. Anim. Sci., 47 : 403 – 409.
Khub Singh., Puneetkumar, Saini, A. L. andBhattacharyya , N. K. 1988. Micro-climate within three types of lite roofsheds in hot semiarid zone. Indian J.Anim. Sci., 59 : 997 – 1005.
Lurdi, I. S. 1982. Effect of hot humid and coldclimate conditions on milk production,nutrient conversion efficiency andwater requirement of crossbred cows.Indian J. Anim. Sci., 53 : 812-817.
Nomiyama, K., Masumitsu, Y., Taekmoto, M.and Fukue, Y. 1981. A survey ofmethods for reducing the temperatureon dairy farms. Dairy Sci. Abstr.,45 : 6893.
Raut K C. 1982. Management indicators inrespect of housing of buffaloes formilk production. Indian J. Anim. Sci.,52 : 1012 – 1018.
Snedecor, C. W. and Cochran, W. G. 1967.Statistical Methods 6th ed., Oxford andIBH publishing co., 330p
Stergarrdoe, V., Munkrgadd, L. and Hennebery,U. 1986. Housing density in cubiclehousing and its importance for thewelfare of dairy cows and for theeconomics of production. Dairy Sci.Abstr., 50 : 4828.
Thiagarajan, M. and Thomas, C, K. 1990.Housing effects on crossbred cows ina hot humid climate : Physiologicalresponses. Indian J. Anim. Sci., 62:1077 – 1082.
environment, the difference being notsignificant statistically. This indicated that poortype of housing design considerably cut downthe air flow, thus depriving the housed animalsfrom the beneficial effects of the good windvelocity. In a study conducted at West Java byGatenby et al. (1987), to measure the windspeeds in sheep and goat houses, it was foundthat houses with platforms and many openwalls had higher internal wind speeds thanenclosed sheds. The air velocity inside the poortype of housing was significantly lower than thatof inside of good type of housing at 7.00 AMand at 2.00 PM. The air velocity outside thepoor type of housing was lower than that ofoutside of good type of housing, the differencebeing not significant statistically.
J. V
et. A
nim
.Sci
. 20
09.
40 :
29-
34RESEARCH ARTICLE
34 Housing Designs and Impact...

COMPARATIVE EFFICACY OF VARIOUSDIAGNOSTIC TESTS FOR CAPRINEPARATUBERCULOSIS - A FIELD STUDY*
S. Sulficar1, M. R. Saseendranath2,G. Krishnan Nair3, P. V.Tresamol4 andUsha Narayana Pillai5
Department of Veterinary Epidemiology & Preventive MedicineCollege of Veterinary and Animal SciencesMannuthy-680 651, Thrissur, Kerala
Abstract
Comparative efficacy of acid faststaining of faecal smear, single intradermalJohnin test and IS900 faecal PCR wasinvestigated in fifty goats for detection ofMycobacterium avium subspeciesparatuberculosis (MAP). Out of the fifty goatsscreened for paratuberculosis from field, onegoat (2 per cent), three goats (6 per cent) andtwelve goats (24 per cent) were found positivefor the organism by Ziehl-Neelsen acid faststaining of faecal smear, single intradermalJohnin test and by IS900 PCR respectively.Results of present study indicate thatamplification of the IS900 insertion elementwas the most suitable diagnostic detectionmethod analysed in this study. The strategicuse of PCR can provide a means for earlyidentification of MAP infected goat and thusensuring their removal from an infected herd.
Key words: Caprine paratuberculosis, faecalPCR
Paratuberculosis (Johne’s disease) isa chronic debilitating infection of ruminantscaused by Mycobacterium avium subspeciesparatuberculosis (MAP). The disease is beingrecognised with increased frequency in goatsand when established in goat flocks can causeheavy loss to the farmers. Recently theorganism was reported to be associated withenteric infection in humans and hence thedisease is of public health importance (Ibrahimet al., 2004). The present paper reports the useof three diagnoctic test for (MAP) in goats andtheir efficacy.
*Part of M.V.Sc. thesis submitted by the first author to the Kerala Agricultural University, Thrissur1. Ph.D Scholar, VC & RI, Namakkal2. Professor & Head3. Professor (Retd.) Dept. of Veterinary Microbiology4. Associate Professor5. Associate Professor, Dept. of Clinical Veterinary Medicine
Materials and Methods
Fifty Malabari crossbred goats abovesix months of age of either sex from Tanoorpanchayath of Malappuram district, Keralawere used for the study. Weak emaciatedanimals and animals in late gestation were notincluded in the study. All the goats weremaintained under standard feeding and goodmanagemental conditions. Fifty goats weresubjected to single intradermal Johnin test(OIE, 2004) by injecting 0.1 ml of Johninpurified protein derivative (PPD) procured fromIVRI, Izatnagar. Injection was given on midneck area and skin thickness was measuredimmediately before and 72 h after injection. Anincrease in skin thickness of 4 mm and aboveand oedema and pain on palpation of the siteof injection were considered as positivereaction. Faecal smears from fifty goats werestained by Ziehl-Neelsen acid fast stain(Paliwal et al., 1984) and examined under oilimmersion objective of microscope to detectthe presence of clumps of acid fast bacilli.Deoxyribonucleic acid was separated from fiftyfaecal samples using QIAamp DNA stoolminikit, and subjected to polymerase chainreaction (PCR) using primers specific for IS900and subsequently performed submarineagarose gel electrophoresis to detectamplification of 279 bp bands specific for MAP(Halldorisdottir et al., 2002). The significantdifference of the above three tests undercomparison was calculated as per the methodrecommended by Rangaswamy (1995).
J. V
et. A
nim
.Sci
. 20
09.
40 :
35-
36
35
RESEARCH ARTICLE
S. Sulficar et al.

�
positive animals could be rated as the mosteffective test for early diagnosis of Johne’sdisease in goats. Huntley et al. (2005)recorded that direct PCR based detection ofMAP insertion sequence IS900 from faeceswas highly specific and sensitive. Polymerasechain reaction was found to have moresensitivity than bacterial culture and smearexamination for diagnosis of Johne’s disease(Sivakumar et al., 2005). Result of the presentstudy was also in agreement with the findingsof previous workers.
It is concluded that IS900 PCR is auseful tool for early diagnosis ofparatuberculosis in goats.
Acknowledgement
The authors acknowledge the Dean,College of Veterinary and Animal Sciences,Mannuthy for facilities provided during thework.
5th ed., OIE, Paris, France. (Johne’sdisease) Chapter 2. 2.6.
Paliwal, O.P., Laikrishna and Kulshrestha, S.B.1984. Diagnosis of Johne’s diseasein sheep by faecal smear examinationand intradermal test. Indian J. Comp.Microbiol. Immunol. Inf. Dis., 5: 73-75.
Rangaswamy, R. 1995. A text book ofAgricultural Statistics. New ageInternational Publishers Ltd., NewDelhi. pp. 105-120.
Sivakumar, P., Singh, N. and Tripathi, B.N.2005. Pathology and diagnosis ofparatuberculosis in water buffaloes.Proc. Eighth ICP 2005 Theme 2:Immunology, Pathology andPathogenesis. 160 p.
Zimmer, K., Drager, K. G., Klawonn, W. and Hess,R.G. 1999. Contribution to the diagnosisof JD in cattle. Comparative studies onthe validity of Ziehl-Neelsen staining,faecal culture and a commerciallyavailable DNA probe test in detectingMycobacterium paratuberculosis infaeces from cattle. Zentralbl Veterinarmed., B. 46: 137-140.
Results and Discussion
Results of comparative efficacy of thethree tests is given in the Table. IS900 faecalPCR was found to be the best test, among thethree tests used for comparison and it wassignificantly different from acid fast staining andsingle intradermal Johnin test. Proportion testfor acid fast staining and single intradermalJohnin test did not yield any significantdifference. But single intradermal Johnin testwas comparatively better than acid fast stainingof faecal smear in early diagnosis ofparatuberculosis in goats and it ranked second.This finding contradicts that of Paliwal et al.(1984) but agrees with that of Kandavel andNedunchelliyan (1987). Zimmer et al. (1999)opined that Ziehl-Neelsen staining had thelowest detection rate and it proved unreliablein diagnosing Johne’s disease. Similar resultsupporting the findings of Zimmer was obtainedin this study. The IS900 PCR which diagnosedthe maximum number of paratuberculous
ReferencesHalldorsdottir, S., Englund, S., Nilsen, S.F. and
Olsaker, I. 2002. Detection ofMycobacterium avium subsp.paratuberculosis by buoyant densitycentrifugation, sequence capturePCR and dot blot hybridization. Vet.Microbiol., 87:327-340
Huntley, J. F. J., Whitlock, R. H., Bannantine,J. P. and Stabel, J. R. 2005.Comparison of diagnostic detectionmethods of Mycobacterium aviumsubsp. paratuberculosis in NorthAmerican bison. Vet. Pathol., 42: 42-51.
Ibrahim, A., ElSanousi, S. and Aradaib, I. 2004.Detection of Mycobacterium aviumsubsp. paratuberculosis using nestedpolymerase chain reaction. Vet.Archiv., 74:27-35.
Kandavel, E. and Nedunchelliyan, S. 1987.Diagnosis of Johne’s disease in cattleby allergic test and microscopy.Indian J. Vet. Med., 7: 66-67.
Office International des Epizooties, 2004.Manual of diagnostic tests andvaccines for terrestrial animals.
J. V
et. A
nim
.Sci
. 20
09.
40 :
35-
36RESEARCH ARTICLE
36 Diagnostic Tests for Caprine Paratuberculosis...
Test Number of Number positive Percent Positiveanimals tested for MAP
Acid Fast Staining 50 1 NS 2Johnin SID 50 3 NS 6PCR IS900 50 12** 24
Table. Comparative results of three tests
**Chi-square (x2) value for field is 14.14 (significant) P<0.01

SITUATIONAL AND PSYCHOLOGICALPROFILE OF DAIRY FARMERS OF KANNURDISTRICT IN KERALA*
P. Vidya1, C. Manivannan2 andN. K. Sudeepkumar3
Department of Veterinary and Animal HusbandryExtension and EntrepreneurshipMadras Veterinary College, Chennai – 600 007
Abstract
A study was carried out to know thesituational and psychological characteristics ofdairy farmers of Kannur district in Kerala. Sixtydairy farmers were selected as respondentsfor the study by proportionate random samplingtechnique amongst the member dairy farmersof four milk co-operative societies identified inKannur block. The findings of the studyrevealed that majority of the respondentspossessed small herd size, medium level ofmilk production (3.66 to 11.2 litres per day),medium contact with extension agency,innovation proneness, economic motivationand decision making behaviour withconsiderable yeasr of experience in dairyfarming. Their mass media exposure wasmedium to high and most of them were oldaged with primary to secondary education.
Key words: Profile, dairy farmers
India’s milk production registered aquantum jump from 22.5 million tonnes in1970-71 to 76.87 million tonnes in 1998-99 andthus reached the envious position of largestmilk producer of the world (Mathur, 2001).Themilk business of dairy co-operatives in Indiacomes from more than 13 million smallproducers with an average herd size of justabout two animals. Small and marginal farmers(< 2 hectares) together with the landless,account for more than 75 per cent of those 13million rural milk producers who raise 60 percent of the cattle in India (Ghanekar, 2008).
* Part of M.V.Sc. thesis submitted by the first author to Tamil Nadu Veterinary and Animal Sciences University, Chennai-511. Academic Consultant, Dept. of Veterinary & Animal Husbandry Extension, CVAS, Pookode, Wayanad2. Assistant Professor (SS), Directorate of Extension Education, TANUVAS3. Associate Professor
Improved productivity of milchanimals and higher returns of dairyentrepreneurs crucially depend on the qualityof extension services. The focus of extensionis on improving the capacity of the people. Thiscapacitating calls for providing access toinformation, innovation and appropriatetechnologies, skill and knowledge buildingwhich requires integrated, need-based andtimely delivery of services as close to thepeople as possible (Campbell and St.Clair,1997). A clear understanding of the situationaland psychological realities of the dairy farmersis of paramount importance in designing needbased and farmer centered extensionprogrammes to improve their knowledge andskill in bringing about better productivity of themilch animals. Considering these facts, thepresent study was conducted with the specificobjective of knowing the situational andpsychological profile of dairy farmers in Kannurdistrict of Kerala.
Materials and Methods
The study was carried out in Kannurblock of the district, selected on the basis ofhigher milk handling capacity. From the six milkco-operative societies of the block, four viz.,Mayyil, Kannur, Chirakkal andKannadiparamba societies were selectedbased on daily milk procurement. From the listof member dairy farmers in each of the dairyco-operatives selected, sixty dairy farmerswere selected by proportionate random
J. V
et. A
nim
.Sci
. 20
09.
40 :
37-
39
37
RESEARCH ARTICLE
P. Vidya et. al

sampling technique which constituted thesample for the study. A total of 10 independentvariables viz., age, education, experience indairy farming, mass media exposure, contactwith extension agency, milk production, herdsize, innovation proneness, economicmotivation and decision making behaviourwere selected for the study considering theobjectives set, through the judges ratingmethod. The selected characteristics weremeasured through appropriate scales andschedules.
Results and Discussion
Distribution of respondents accordingto their situational and psychologicalcharacteristics is furnished in the table.
The study revealed that majority(41.67 %) were old aged, nearly one-third(31.67 %) young and just over one-fourth(26.67 %) middle aged. 56.67 % belongedeither to primary, middle or secondaryeducation group, whereas 11.67 % possessedhigher secondary education. A meagre 8.33 %each belonged to ‘can read and write’ and‘graduation and above’ category. One-tenth(10.00 %) of the dairy farmers were illiterate.This is in agreement with the findings ofSudeepkumar (1992) who stated that most ofthe respondents belonged to old age group.
With regard to dairy farmingexperience, 56.67 % of respondents had morethan 12 years of practice in dairy farming, 26.67
Table. Distribution of respondents according to their situational & psychological characteristics
J. V
et. A
nim
.Sci
. 20
09.
40 :
37-
39RESEARCH ARTICLE
38 Profile of Dairy Farmers...

respectively. Around 70.00 % of respondentshad medium decision - making behaviour,16.67 % fell in low and the rest (13.33 %) inhigh category. The trend showed that the dairyfarmers preferred better standards of living andwere interested in earning more income byadopting scientific dairy farming practices.They were decisive and determined with regardto the actions that were concerned with efficientmanagement of dairy enterprise to obtain betterproductivity and higher profit.
Acknowledgement
The authors extend their gratitude tothe Dean, Madras Veterinary College,Chennaifor having provided the facilities to conduct theresearch.
References
Campbell, A. D. and St.Clair Barker. 1997.Selecting appropriate content andmethods in programme delivery.Improving Agricultural extension- AReference Manual, pp. 340-344.
Ghanekar, D.V. 2008. Taxing dairy coops: ACase study for reconsideration.XXXVI Dairy Industry Conference.Indian Dairyman, 60: 108-111.
Manivannan, C. 2003. Management efficiencyof dairy farmers. Ph.D. Thesis, IndianVeterinary Research Institute,Izatnagar, Uttar Pradesh.
Mathur, B.N. 2001. Dairy scenario: India todayand tomorrow. All India DairyBusiness Directory. 2nd ed., SadanaPublishers, Ghaziabad, 29-34.
Sudeepkumar, N.K. 1992. Effectiveness oftraining on dairy farming technology.M.V.Sc. Thesis. TANUVAS, Chennai.
�
% possessed 6 to 12 years experience andthe rest (16.67 %) had less than six years offarm experience. These findings are also inagreement with Sudeepkumar (1992) whoreported that more than a half of therespondents had high level of farm experience.
Seventy five percent of respondentspossessed medium exposure to mass media,16.67 % & 8.33% having high and low exposurerespectively. Contact with extension agencywas medium in 56.67 % of the respondents,one–fourth (25 %) had low contact while therest (18.33 %) maintained good contact withextension agency. Higher literacy rate amongthe respondents, availability of more numberof satellite televisions, better newspaperreading habits, etc., might be the reasons formedium to high level of mass media exposureamong the respondents.
Regarding herd size, a high majority(88.33 %) possessed small herd and the rest(11.67 %) had large herd. Daily milk productionin majority (71.67 %) ranged between 3.66 and11.2 litres, and 18.88 % attained over 11.2 litresper day while one-tenth (10.00 %) had low milkproduction.
Majority (63.33 %) exhibited mediuminnovation proneness while 21.67 % and 15.00% had high and low innovation pronenessrespectively. The findings were in agreementwith those of Manivannan (2003), who reportedthat majority of the dairy farmers in urban, peri-urban and rural areas of Thanjavur district inTamil Nadu exhibited medium level ofinnovation proneness. This character signifiedthat the dairy farmers were willing to try newand recent developments in scientific dairyingto achieve higher production and productivityfrom their animals.
Economic motivation was medium in73.33 % respondents, while 15.00 % and 11.67% belonged to low and high category
J. V
et. A
nim
.Sci
. 20
09.
40 :
37-
39
39
RESEARCH ARTICLE
P. Vidhya et. al

SCREENING OF DOGS FOR RABIES VIRUSEXCRETION
S. Raju1 and M. R. Saseendranath2
Department of Veterinary Epidemiology andPreventive MedicineCollege of Veterinary and Animal SciencesMannuthy-680 651, Thrissur, Kerala
Abstract
Five hundred dogs, belonging tovarious categories viz., healthy (vaccinatedand non-vaccinated), sick (vaccinated andnon-vaccinated) and stray, were screened forthe possible excretion of rabies virus in anenzootic area in Thrissur, Kerala. These dogswere screened by detecting rabies viral antigenin salivary smears and corneal impressionsmears using direct fluorescent antibody test.The study revealed no non fatal, chronic orabortive rabies infections in dogs. No dogscould be detected with persistent rabies viralexcretion without succumbing to rabies.
Key words: Rabies virus excretion, dogs,screening
Rabies is fatal, non-suppurative, viralencephalitis of all warm blooded animals. Inendemic areas, the infection is maintained inanimal population and transmitted to peopleprimarily by bite or rarely throughcontamination of abraded skin or mucousmembranes. In India alone, 17,800 humandeaths occur annually which accounts to 40percent of global report. Up to 96.2 per cent ofthe human rabies in India is transmitted bydogs and the rest by cats and other animals(WHO, 2004).
Documented cases of dogs outlivingtheir victims in India and other developingcountries suggest a possible chronic excretorystate for the virus, which complicates thestandard management. Veeraraghavan (1970)
* Part of M.V.Sc. thesis submitted by the first author to the Kerala Agricultural University, Thrissur1. Veterinary Surgeon, AHD (On leave)2. Professor and Head
isolated rabies virus on 14 occasions from thesaliva of a dog that remained healthy afterbiting a man, who died of rabies. Since humandeaths are reported from such ‘prolongedexcretors’, the possibility of a chronic carrierstate for fatal strains of rabies virus need to beinvestigated (Dutta and Dutta, 1994).
The present study was undertaken toassess rabies virus excretion, if any, inapparently healthy and sick dogs suffering fromother diseases.
Materials and Methods
The study was conducted at theDepartment of Veterinary Epidemiology andPreventive Medicine, College of Veterinary andAnimal Sciences, Mannuthy, Thrissur. Cornealimpression and salivary smears were obtainedfrom 407 healthy dogs and 93 sick dogsshowing symptoms like fever, anorexia,vomiting and diarrhoea brought to UniversityVeterinary Hospitals, Kokkalai and Mannuthy,Kerala Agricultural University. Theseimpressions were subjected to fluorescentantibody test (FAT) (CDC, 2003). Out of the500 dogs, 41 were stray dogs and 151 wereimmunised and were at different levels ofimmunity. The detailed clinical history andprophylactic anti-rabies vaccination statuswere collected.
The validity of the procedures wastested by screening dogs showing symptomssuggestive of rabies like salivation, droppedjaw and behavioural changes. Twelve dogs
J. V
et. A
nim
.Sci
. 20
09.
40 :
40-
41RESEARCH ARTICLE
40 Screenig for Rabies Virus...

ReferencesAdeiga, A. A. and Audu, R. A. 1996. Detection
of rabies virus in saliva of apparentlyhealthy dogs. Biomed. Lett., 54: 207-212
Aghomo, H. O., Oduye, O. O., Tomori, O. andIbe, M. M. 1989. Isolation of rabiesvirus from clinically healthy andpreviously unvaccinated dogs. Bull.Anim. Health Prod. Afr. 37: 131-135
Bell, J. F., Gonzalez, M. A., Diaz, A. M. andMoore, G. J. 1971. Nonfatal Rabiesin Dogs: Experimental studies andresults of a survey. Am. J. Vet. Res.,2: 2049-2058
Center for Disease Control (CDC), Viral andRickettsial Zoonoses Branch (VRZB),2003. Protocol for PostmortemDiagnosis of Rabies in Animals byDirect Flourescent Antibody Testing.22 p.
Dutta, J. K. and Dutta, T. K. 1994. Rabies inendemic countries. Bio. Med.. J., 308:488-489
Fekadu, M. 1975. Asymptomatic non-fatalcanine rabies. Lancet, 1: 569
Vaughn, J. B., Gerhardt, P. and Newell, K. W.1965. Excretion of street rabies virusin the saliva of dogs. J. Am. Med.Assoc., 193: 113-118
Veeraraghavan, N. 1970. Annual reports of theDirector, Pasteur Institute of SouthernIndia, Coonoor, Diocesan Press,Madras. 65 p.
World Health Organization sponsored nationalmulticentric rabies survey - 2003.2004. Assessing burden of rabies inIndia. Association for prevention andcontrol of rabies in India. pp. 1- 4
�
(control group) with definite history of rabid dogbite were thus examined. The saliva andcorneal impression smears from these dogswere taken and subjected to FAT. After death,the brain samples were collected forconfirmation.
Results and Discussion
All the five hundred dogs werenegative for rabies virus excretion and noincidence of recovery, abortive or chronic formof the disease was observed in the controlgroup. All the control animals were positive forrabies on FAT. These findings were not inagreement with those of Veeraraghavan(1970), Fekadu (1975), Aghomo et al. (1989)and Adeiga and Audu (1996), but concurredwith those of Bell et al. (1971) who conductedstudies to test whether apparently normal dogsexcreted rabies virus in the Federal District ofBeunos Aires where rabies was endemic. Noneof the 579 salivary samples from 129 dogstested for excretion of rabies virus was positiveby FAT. The present result also concurred withthat of Vaughn et al. (1965) wherein they couldnot detect the presence of rabies viral antigenamong randomly screened dogs.
J. V
et. A
nim
.Sci
. 20
09.
40 :
40-
41
41
RESEARCH ARTICLE
S. Raju and M. R. Saseendranath

COMPARATIVE PERFORMANCE OF LANDRACEAND LARGE WHITE YORKSHIRE PIGS UNDERTROPICAL MARITIME MONSOON CLIMATE*
S. Ramesh1, T. Sivakumar 2,Tensingh Gnanaraj 3 , Ra Murallidharan4
and M. Murugan5
Department of Livestock Production and ManagementMadras Veterinary College, Chennai-600 007
Abstract
A study was conducted to assess andcompare growth performance of Landrace andLarge White Yorkshire weaned pigs undermaritime monsoon climate. Body weights andbody measurements were recorded at fortnightintervals. The final body weight at 180 days ofage was significantly (P<0.01) higher in Landracecompared to Large White Yorkshire. The overallaverage daily gain was significantly (P<0.01)higher in Landrace. No significant difference infeed conversion efficiency between Landrace(4.09 ± 0.12) and Large White Yorkshire (4.17 ±0.13) was noticed. The body length wassignificantly (P<0.01) higher in Landrace but theheart girth and height at withers were significantly(P<0.05) higher in Large White Yorkshire. Thepost weaning growth performance in terms ofbody weight and average daily gain wassubstantially better in Landrace over that of LargeWhite Yorkshire pigs.
Key words: Body weight, linear bodymeasurements, feed efficiency, Large WhiteYorkshire, Landrace pigs
Exotic breeds of pigs have higher feedconversion efficiency and faster growth rate andhave higher growth potential than indigenousbreeds (Mishra et al., 1989). Due to theintroduction of pure-bred exotic stock of pigs inrecent years, pork industry is expected to play asignificant role in the economy of our country. Atpresent Large White Yorkshire (LWY) breed has
*Part of M.V.Sc. thesis submitted by the first author to the Tamil Nadu Veterinary and Animal Sciences University, Chennai-511. M.V.Sc. Scholar2. Professor & Head3. Associate Professor4. Professor (Retd.)5. Associate Professor, LRS, Kattupakkam
been utilised widely for commercial porkproduction in India. Landrace is another exoticpig breed native to Denmark noted for its fastergrowth rate and mothering ability that has beenintroduced in Tamil Nadu. Therefore, there is aneed to study the performance of Landrace incomparison to LWY pigs.
Materials and Methods
Eight numbers each of weanedLandrace and LWY piglets consisting of fourmales and four females in each breed wererandomly selected based on body weight andwere used for this study. The males werecastrated .The randomly selected piglets weredivided into two groups. Group I (T1) comprisedof Landrace piglets and Group II (T2) Large WhiteYorkshire piglets. The piglets were housed in twoseparate pens in the same building with concretefloor. The piglets in each group were fed adlibitumconcentrate feed with the following ingredients.Maize -35, Cumbu -10, Ground Nut Cake -15,Wheat bran - 6, Deoiled Ricebran -26.5, Dryfish -5 , Mineral mixture -2 and common salt -0.5. Feed given was increased by 100 g every 3to 4 days depending on the intake to minimisefeed refusals (Ravi et al., 1999b). The piglets hadfree access to water. The piglets were maintainedunder identical management condition androutine health cover was provided to them. Thepiglets were reared up to 180 days of age. Linearbody measurements namely body length, chestgirth and height at withers were measured usinga standard measuring tape at the time of
J. V
et. A
nim
.Sci
. 20
09.
40 :
42-
46RESEARCH ARTICLE
42 Performace of Landrace and Large White Yorkshire Pigs...

weighment (Singh et al., 2001). Data on fortnightlybody weight, body measurements and daily feedintake were recorded and analysed statisticallyfor interpretation (Snedecor and Cochran, 1994).
Results and Discussion
Landrace pigs had significantly(P<0.01) higher body weight (66.31 ± 1.41 kg)compared to L W Y (60.88 ± 1.10 Kg) at the endof the experiment (Table1). This was inaccordance with the observation made bySharma et al. (1990), who observed thatLandrace pigs were superior to LWY pigs ingrowth performance at almost all ages. On thecontrary, Varadarajulu and Rao (1982) noticedthat LWY pigs were superior to Landrace in bodyweights.
The growth performance of Landracepigs in the present study was better than thoseobserved by Goswami and Raina (1983) who
observed a body weight of 56.73 ± 0.51 kg at 6months of age, whereas Sharma et al. (1990)observed a low body weight of 41.81 ± 0.49 kgat the end of 30th week in Landrace. Theperformance of LWYwas far better (60.88 ± 1.10kg) than those reported by Sharma et al. (1990)who observed a body weight of 33.72 ± 0.43 kgat the end of 30th week. (Table 2)
The body length was significantly(P<0.01) higher in Landrace (106.75 ± 2.13 cm)compared to LWY pigs (92.49 ± 1.22 cm) (Table2). It was observed that LWY had significantly(P<0.01) higher heart girth and height (81.94 ±0.90 cm and 57.89 ± 1.00 cm) compared toLandrace pigs (77.87 ± 1.53 and 53.73 ± 0.89cm). Similar linear measurements were noticedby Sinha et al. (1993) in LWY pigs. In the presentstudy it was noted that heart girth and height atwithers was higher in LWY piglets compared toLandrace (Table 3 and 4). This was in tune with
Table 1. Mean ± SE of fortnightly body weight (kg) of Landrace and LWY pigs
NS- Non-significant* -Significant at five per cent level (P<0.05)**- Significant at one per cent level (P<0.01)
Table 2. Mean ± SE of fortnightly body length (cm) of Landrace and LWY pigs
**- Significant at one per cent level (P<0.01) J. V
et. A
nim
.Sci
. 20
09.
40 :
42-
46
43
RESEARCH ARTICLE
S. Ramesh et. al

Table 3. Mean ± SE of fortnightly heart girth (cm) of Landrace and LWY pigs
NS- Non-significant* -Significant at five per cent level (P<0.05)**- Significant at one per cent level (P<0.01)
NS- Non-significant* -Significant at five per cent level (P<0.05)
Table 4. Mean ± SE of fortnightly height at withers (cm) of Landrace and LWY pigs
Table 5. Mean ± SE of fortnightly average daily gain (g) of Landrace and LWY pigs
Means bearing different superscript in a row differ significantly (P<0.01)J. V
et. A
nim
.Sci
. 20
09.
40 :
42-
46RESEARCH ARTICLE
44 Performace of Landrace and Large White Yorkshire Pigs...

Table 6a. Analysis of variance on feed conversion efficiency
NS- Non-significant**- Significant at one per cent level (P<0.01)
Table 6. Mean ± SE of fortnightly feed conversion efficiency
Sukh deo and Raina (1983) who indicated thatpigs taller at withers had greater heart girth. Thebody length was higher in Landrace, as it isknown for its higher body length among thebreeds.
The post weaning average daily gainwas significantly (P<0.01) higher in Landrace(388.99 ± 38.86 g) compared to LWY piglets(354.58 ± 37.16 g) (Table 5).The present findingwas in accordance with Rohilla et al. (2000), whonoticed a growth rate of 335.45 ± 7.45 g /day inLWY pigs. This finding was also in accordancewith Goswami and Raina (1983).
The average daily gain obtained in thestudy was better than those reported by Goswamiand Raina (1983) whereas it was lessercompared to the finding of Albar and Marouby(1983) in German Landrace, De Haer and DeVries (1993) in Dutch Landrace, De Haer andDe Vries (1993) in Yorkshire and Hyun et al.(2001) in LWY. The difference in performancebetween the breeds might be due to differencein metabolism.
No significant difference in feedconversion efficiency between Landrace (4.09 ±0.12) and LWY (4.17 ± 0.13) piglets was noticed(Table 6). The feed conversion efficiency in LWYin the present study was in agreement with Singhet al. (1990) In contrast, Dash and Mishra (1986)observed feed efficiency of Large White Yorkshire
pigs at 24 weeks of age to be 5.39, which washigher than those obtained (Table 3) in presentstudy for LWY pigs. Similarly Varadarajulu andRao (1982) showed that pure bred Landrace pigsutilised feed (gain/feed) better than purebredYorkshire pigs. On contrary, De Haer and De Vries(1993) observed that Dutch Landrace pigs hada significantly higher feed to gain ratio comparedto Great Yorkshire pigs.
References
Albar, J. and Marouby, H. 1983. Technical andeconomic performance of pig farms inthe German federal Republic. Anim. Br.Abstr., 51 : 821.
Dash, P and Mishra, M.1986. Performance ofLarge White Yorkshire and itscrossbreds with indigenous pigs inOrissa. Indian. J.Anim. Sci., 56: 144-146.
De Haer, L. C. M and De Vries, A. G.1993. Effectsof genotype and sex on the feed intakepattern of group housed growing pigs.Livestock Prod. Sci., 36: 223-232.
Goswami, R. N. and Raina, B. L.1983.Bodyweight, daily weight gain andgrowth curve in Landrace pigs. Indian.J. Anim. Sci., 53 : 97-100. J.
Vet
. Ani
m.S
ci.
2009
. 40
: 4
2-46
45
RESEARCH ARTICLE
S. Ramesh et. al

�
Hyun, Y. and Ellis, M. 2001. Effect of group sizeand feeder type on growth performanceand feeding patterns in growing pigs.J. Anim. Sci., 79: 803-810.
Mishra, R. R., Shiva Prasad and Krishan Lal.1989. Studies on carcass traits of LargeWhite Yorkshire pigs. Indian J. Anim.Prod. Mgmt., 5: 130-133.
Ravi, A., Srinivasa Rao, D and Krishna Reddy,K.1999. Effect of sex on voluntary feedintake and growth performance incrossbred pigs. Indian J. Anim. Nutr.,16: 56-59.
Rohilla, P.R., Bujarbaruah, K. M., Kumar, M andSingh, G.(2000). Carcass traits of LargeWhite Yorkshire, Hampshire and Nagalocal pigs. Indian J. Anim. Sci., 70 :307-308.
Sharma, B.D., Dubey, C. B and Singh, S. K.1990.A comparative study of growth in pureand crossbred pigs. Indian J. Anim. Sci.,60 : 492-495.
Singh, K. I., Singh, R. L., Singh, S. K., Sharma, B.D and Dubey, C. B.1990. Body weight
and efficiency of feed utilization in pigs.Indian J. Anim. Sci., 60: 605-608.
Singh, S.K., Pandey, R.N and Sharma, B.D.(2001). Prediction of body weight fromlinear body measurement in pigs.Indian J. Anim. Res., 35: 15-20.
Sinha, S. K., Singh, R. A and Sharma, B. D. 1993.Carcass and economic traits of Swineproduction on culinary waste. Indian. J.Anim. Sci., 63: 787 789.
Snedecor, G.W and Cochran, W.G. 1994.Statistical methods. IOWA StateUniversity Press, Ames, IOWA, USA.330 p
Sukh Deo and Raina, B. L. 1983. Genetic andphenotypic correlations among bodyweights and body measurements inLandrace and Landrace X Large Whitepigs. Indian. J. Anim. Sci., 53: 451-454.
Varadarajulu, P and Rao, R. S.1982. Acomparative study of growth of pure-bred and cross-bred swine. Indian. Vet.J., 59 : 623-627.
J. V
et. A
nim
.Sci
. 20
09.
40 :
42-
46RESEARCH ARTICLE
46 Performace of Landrace and Large White Yorkshire Pigs...

AVAILABILITY, PREFERENCE AND FREQUENCY OFUTILISATION OF INSTITUTIONAL PROGRAMMES BYDAIRY ENTREPRENEURS OF THRISSUR DISTRICT*
C. A. Pradeep1 and P. J. Rajkamal2
Department of Veterinary and Animal Husbandry ExtensionCollege of Veterinary and Animal SciencesMannuthy- 680 651, Thrissur, Kerala
Abstract
A study was undertaken to focus onthe dairy entrepreneurs to analyse theavailability, preference and frequency ofutilization of institutional programmes fordairying. It was found that the low availabilityof training programmes, symposium and farmclinics resulted in their low utilisation. Sinceseminars, farm visits and vaccination campswere the most preferred institutionalprogrammes, they should be organisedperiodically.
Key words: Dairy entrepreneurs, availability,utilisation, institutional programmes
The development of dairy sector in astate like Kerala with serious resourceconstraints depends on how best the merit ofscientific research is being applied. As a groupof motivated and dedicated people who havetaken up dairying as a commercial venture,dairy entrepreneurs have a big role. It is timethat institutional programmes should focus onthese forward looking people and analyse theavailability, preference and frequency ofutilisation of institutional programmes by them.The present study was undertaken with theabove objectives.
Materials and Methods
The locale of study was OllukkaraRural Development Block of Thrissur districtin Kerala. Ten milk co-operative societies
*Part of M.V.Sc. thesis submitted by the first author to the Kerala Agricultural University, Thrissur1. Veterinary Surgeon, AHD, Kerala2. Professor and Head
were selected at random from 32 societiesin this block. Six dairy entrepreneurs wereselected again at random from each society.Thus in all 60 dairy entrepreneurs constitutedthe sample. The data were collected with thehelp of a structured interview schedule.
Availability of institutionalprogrammes meant the extent of availabilityof various programmes to the respondents.Based on the review of literature anddiscussion with scientists and extensionpersonnel, 11 major extension programmeswere identified as given in Table 1. The scoringprocedure employed was as readily available,available to some extent and not available withrespective scores of 3, 2 and 1. A total scorefor each programme, over all the respondents,was worked out. Since the total score of all 11programmes ranged from 60 to 180, threeclass intervals were fixed as low, medium andhigh availability with scores 60 to 100, 101 to140 and 141 to 180 respectively.
Frequency of utilization of institutionalprogrammes meant how frequently the dairyentrepreneurs attended these programmes.The scoring procedure employed was mostlyutilised, occasionally utilised and never utilisedwith respective scores of 3, 2 and 1. A totalscore for each programme, over all therespondents, was worked out. Since the totalscore of all 11 programmes ranged from 60 to180, three class intervals were fixed as low,medium and high frequency of utilization with
J. V
et. A
nim
.Sci
. 20
09.
40 :
47-
49
47
RESEARCH ARTICLE
C. A. Pradeep and P. J.Rajkamal

scores of 60 to 100, 101 to 140 and 141 to 180respectively.
Preference for institutionalprogrammes meant the choice of programmesby the respondents. Each respondent wasasked to rank the selected eleven programmesfrom one to eleven by giving first rank to themost preferred programme and last rank to theleast preferred one. Ranks were thenconverted into scores by giving a score of 13to first ranked programme and a score of 1 tothirteenth ranked one. A total score of eachprogramme over all the respondents, wasworked out and depending on the programme-wise total score, the programmes studied wereranked from one to eleven.
Results and Discussion
Data revealed that vaccination campwas a highly available programme.
Symposium, training and farm clinic were lowin availability while farm visit, seminar, healthcare camp, infertility camp, exhibition, calf rallyand cattle show were available to a mediumlevel.(Table 1). The fact that vaccination campwas relatively a highly available programmeindicated the importance given to diseaseprevention by institutions.
Table 2 revealed that vaccinationcamp was in the highly utilised categorywhereas symposium, training and farm clinicwere in low utilisation category and farm visit,infertility camp, health care camp, exhibition,calf rally, cattle show and seminar, were inmedium utilisation category. Dairyentrepreneurs utilised vaccination campfrequently probably because of the awarenesscreated by institutional agencies about diseaseprevention. The programmes which were
Table 3. Preference for institutional programmes
Sl. No. Programmes Score Rank
1. Seminar 512 I
2. Farm visit 425 II
3. Vaccination camp 412 III
4. Farm clinic 395 IV
5. Training 380 V
6. Symposium 353 VI
7. Exhibition 335 VII
8. Healthcare camp 315 VIII
9. Cattle show 304 IX
10. Infertility camp 290 X
11. Calf rally 239 XI
Table 1. Availability of institutional programmes
Availability Institutional programmes
Low(60-100) Symposium, training programme, farm clinic
Medium (100-140) Farm visit, seminar, healthcare camp, infertility camp,exhibition, calf rally, cattle show
High(140-180) Vaccination camp
J. V
et. A
nim
.Sci
. 20
09.
40 :
47-
49RESEARCH ARTICLE
48 Utilisation of Institutional Programmes...
Table 2. Frequency of utilisation of institutional programmes
Frequency Institutional programmes
Low(60-100) Symposium, training programme, farm clinic
Medium (100-140) Farm visit, infertility camp, healthcare camp,exhibition, calf rally, cattle show, seminar
High(140-180) Vaccination camp

�
References
Dey, P. K. 1981. Channels preference foragricultural messengers. Indian J.Extn. Edn., 17: 17-21.
Nataraju, M. S. and Channegowda, M. B. 1985.Sources of information utilized foradoption of improved dairymanagement practices by small,marginal farmers and agriculturallabourers. Indian J. Extn. Edn., 21:97-100.
Natikar, K.V. and Jayaramiah, K. M. 1988.Information sources consulted byextension personnel of T&V system.Indian J. Extn. Edn., 24: 79-81
Pushkaran, P. S. 1975. A study on preferentialchoice of information sources bypoultry farmers. M.V.Sc. thesis.Agricultural College and ResearchInstitute, Coimbatore.
Singh, R. and Tyagi, K. C. 1993. Channels ofcommunication utilised in scientificdairy farming practices. Indian J.Anim. Res., 27: 88-92.
medium or lowly utilised were also availableto them only at medium and low levels. Thisindicated that availability had some relationwith frequency of utilisation.
Table 3 revealed that seminar was themost preferred institutional programme by therespondents which was followed by farm visit,vaccination camp, farm clinic, training,symposium, exhibition, healthcare camp, cattleshow, infertility camp and calf rally. The findingthat seminar, farm visits and vaccination campswere the first three most preferred institutionalprogrammes was a guidepost that theseprogrammes were needed periodically. Hence,they should be given due emphasis byextension agencies.
Acknowledgement
The authors wish to thank the Dean,College of Veterinary and Animal Sciences,Mannuthy for providing necessary facilities tocarry out the research work.
J. V
et. A
nim
.Sci
. 20
09.
40 :
47-
49
49
RESEARCH ARTICLE
C. A. Pradeep and P. J.Rajkamal

EFFECT OF ROUTE OF ADMINISTRATION ONIMMUNE RESPONSE TO COMBINED FOOTAND MOUTH DISEASE, HAEMORRHAGICSEPTICAEMIA AND BLACK QUARTER OILADJUVANT VACCINE IN CATTLE
M. R. Saseendranath1, K. Rajkumar²,and J. P. Smitha³Department of Veterinary Epidemiology andPreventive MedicineCollege of Veterinary and Animal SciencesMannuthy- 680 651, Thrissur, Kerala
Abstract
The immune response to combinedFoot and Mouth Disease (FMD), HaemorrhagicSepticaemia (HS) and Black Quarter (BQ) oiladjuvant vaccine subsequent to subcutaneousand intramuscular route of administration wasconducted in twenty unvaccinated calves atfour months of age. Both routes of vaccinationproduced satisfactory level of immuneresponse on the 21st day post vaccination. Nosystemic reaction was observed in both theroutes except for a mild swelling at the injectionsite observed in subcutaneous route.
Key words: Immune response, oil adjuvantvaccine, cattle
Infectious disease like Foot andMouth Disease, Haemorrhagic Septicaemiaand Black Quarter are of major economicimportance to the Indian farmers. Regularprophylactic vaccination against thesediseases can reduce the incidence as well asthe intensity of the disease in endemic areas.The immune response of cattle to combinedFMD, HS and BQ oil adjuvant vaccineadministered by different routes are studied inthe present work.
Materials and Methods
Twenty unvaccinated four month oldcalves of either sex were selected randomlyfrom the University Livestock Farm, Mannuthyand were divided into two groups (Group I andII) of ten animals each. Raksha “Triovac’”vaccine at a dose of three ml was administeredsubcutaneously for group I animals and
1. Professor and Head2. Assistant Professor, Dept. of Veterinary Epidemiology and Preventive Medicine, RGCOVAS, Puducherry3. Academic consultant, CVAS, Pookode, Wayanad
intramuscularly for group II animals. Serumsamples were collected from all the animalsbefore vaccination. LPB ELISA was employedto assess neutralising antibody titres againstO, A, C and Asia-I FMD virus antigens as perHamblin et al. (1986). Indirect ELISA test wasperformed to determine the serologicalresponse to HS and BQ as per Natalia et al.(1993).
Results and Discussion
On subcutaneous injection, nosystemic reaction was observed but there wasa local swelling at the injection site, whichremained for four days in all the ten animals.Immune response to subcutaneousadministration on day zero and on 21st day isgiven in Table 1. The level of immune responseon 21st day post vaccination for all antigens ofFMDV, Pasteurella multocida and Clostridiumchauvoei were above the protective titre.
The immune responses tointramuscular trials on day zero and on 21stday are furnished in Table 2. No systemic orlocal reaction was observed in the animals afterinjection. All the animals produced protectivelevel of immune response on 21 st day to 0, A,C, Asia I, HS and BQ antigens. These findingscorrelate with the findings of Rao et al. (1993)who reported satisfactory antibody responseto FMD oil adjuvant vaccine on 21 st day postvaccination. It could be concluded that thecombined FMD, HS and BQ oil adjuvantvaccine can be used subcutaneously orintramuscularly as both the routes producedsatisfactory level of immune response on 21 st
day.
J. V
et. A
nim
.Sci
. 20
09.
40 :
50-
51RESEARCH ARTICLE
50 Effect of Route of Administration...

References
Hamblin, C., Barnett, I. T and Crowther,J. R. 1986. A new enzyme-linkedimmunosorbent assay (ELISA) for thedetection of antibodies against foot-and-mouth disease virus. II-Application. J. Immunol. Methods, 93:123-129.
Natalia, L and Patten, B. E. 1993. The responseof animals to Pasteurella multocida
Table 1. Antibody titre to FMD Virus type 0, A, C, Asia 1, HS and BQ by subcutaneous route.
(For the protection of FMDV type ‘0’ the titre of 1.5 and above is taken as protective,For the protection of FMDV type ‘A’ and type ‘C’ the titre of one and above is taken as protective,For the protection of FMDV type Asia 1 the titre of 1.4 and above is taken as protective,For the protection of Pasteurella multocida and Clostridium chauvoei the titre of 50 and above is taken as protective)
Table 2. Antibody titre to FMD virus type 0, A, C, Asia - 1, HS and BQ by intramuscular route.
vaccination as measured by PMPTand ELISA. Proc. ELISA applicationin Veterinary Science. Indonesia, Oct.27-28, 1992.
Rao, A. K., Palanisamy, R., Kalanidhi, A. P.,Azad, H. M and Srinivasan, V. A.1993. Use of oil adjuvant foot andmouth disease vaccine in cattle.Indian Vet. J., 70: 493-497.
�
J. V
et. A
nim
.Sci
. 20
09.
40 :
50-
51
51M.R. Saseendranath et. al
RESEARCH ARTICLE

BACTERIAL QUALITY OF BEEF CARCASSESIN A MEAT PROCESSING PLANT
The safety and hygienic quality of thecarcasses are largely determined by thepresence of microorganisms, which areubiquitous in nature. During slaughter anddressing of animals, the carcass getscontaminated with microorganisms fromvarious sources such as hide, hair andintestinal contents and from the environmentin which they are handled. Thus knowledge ofthe overall bacterial load on the carcasses andslaughtering areas will help to develop a beefcarcass monitoring system to evaluate thebacterial quality of the carcass in a processingplant.
During the investigation, a total of 40beef carcasses were randomly selected froma meat processing plant located at Kochi inKerala during a period from April to June 2002.The factory procures the carcasses from twosources (A and B) located at Tamil Nadu forfabrication and production of meat and itsproducts. From each randomly selectedcarcass surface, 500 cm2 area was swabbed,which consisted of 100 cm2 each from neck,brisket, loin, flank and outer round .Thesamples were collected and brought to thelaboratory in thermo cool containers andprocessed immediately to evaluate thebacterial quality by estimating total viable count(TVC), coliform count (CC), E. coli count (ECC)and faecal streptococcal count (FSC)according to the procedures described by
Swansson et al. (2001); Anon (1968), Anon(1973) and BIS (1980), respectively. Thesamples were identified by the cultural,morphological and biochemical characteristicsdescribed by Barrow and Feltham (1993).Samples such as pond water, tap water, iceand processing equipments were collected andprocessed for estimation of bacterial counts.Hand wash of personals were taken at end ofprocessing hours on each of six visits. Thecount obtained was expressed as log 10 cfu/ml. The examination of water samples and icesamples was repeated during six visits.
Swab contact method described byEvancho et al. (2001) was followed to collectsamples from the meat cutting board, meatcutting tables, knife and steel for the estimationof bacterial count. The bacterial count of thecutting board, and cutting table was expressedas colony forming units (cfu) per cm2 and knifeand steel was expressed as cfu/ml. Hand washof the personnel was mixed and further ten foldserial dilutions of samples were made asprescribed in the ISI (1978). The bacterialcount of the samples was estimated asdescribed in the carcass swab sampleexamination and the count was expressed ascfu/ml. The data obtained in the study weresubjected to statistical analysis as per theprocedure described by Rangaswamy(1995).
Table 1. Mean bacterial counts of the samples
N=40, 20 each from source A and BFigures bearing the same superscript differ significantly*P<0.05
J. V
et. A
nim
.Sci
. 20
09.
40 :
52-
55RESEARCH ARTICLE
52 Bacterial Quality of Beef Carcasses...

faecal contamination, as these organisms aretrue commensals of the alimentary tract of manand animals. At times, the organisms areassociated with “sours” or “bone taint” on thecarcasses (Jay, 1996).
Bacterial load in different processingequipments, ice, water and hand washings ofpersonnel are given in table 2.
Highest mean total viable count wasobserved in pond water. The observation ofthe study indicates that the ice, pond water andtap water contributed significantly in thecontamination of beef carcasses. The meanTVC in the tap water was much higher thanthe reported 10 cfu/ml (Rao and Ramesh,1992) and 2.07 log10 cfu/ml (Tarwate et al.,1993). Coliform count was observed in allsamples except in packaging material. Thehighest count of the organisms was observedin ice samples. Cutting board, cutting table andknife showed presence of faecal streptococci.Escherichia coli count was present only in handwash samples. Hand wash also showed thepresence of coliform and faecal streptococcalcount. Therefore the personals engaged invarious operations during the processing ofcarcasses played a significant role in thecontamination of carcasses.
Table 2. The mean bacterial load of processing equipment, ice, water and hand washings
The mean total viable count, coliformcount, Escherichia coli count and faecalstreptococcal count of carcasses belonging tothe sources A and B are given in Table.1
Statistical analysis of the data usingpaired t-test revealed a significant and positiveassociation between the mean total viablecount and faecal streptococcal count (P<0.05).The high TVC and CC observed in the presentstudy could be suggestive of lack of hygienicpractices followed during slaughter anddressing of cattle and subsequenttransportation. This also confirms theobservation of Lasta et al. (1992), who reportedthat carcasses produced from very goodabattoirs had coliform count lower than one cfu/cm2. Escherichia coli is a mesophilic, gram-negative organism found in the intestinal tractof man and animals. The organism isassociated with spoilage of meat and theirpresence on the carcasses indicates that thecontamination might have occurred from theintestinal contents of the animal and from thecontaminated water used for various activitiesduring slaughter and dressing of carcasses.All samples revealed the presence of faecalstreptococcal organisms in large numberswhich could be attributed to direct or indirect J.
Vet
. Ani
m.S
ci.
2009
. 40
: 5
2-55
53C. Sethulekshmi and E. Nanu
RESEARCH ARTICLE
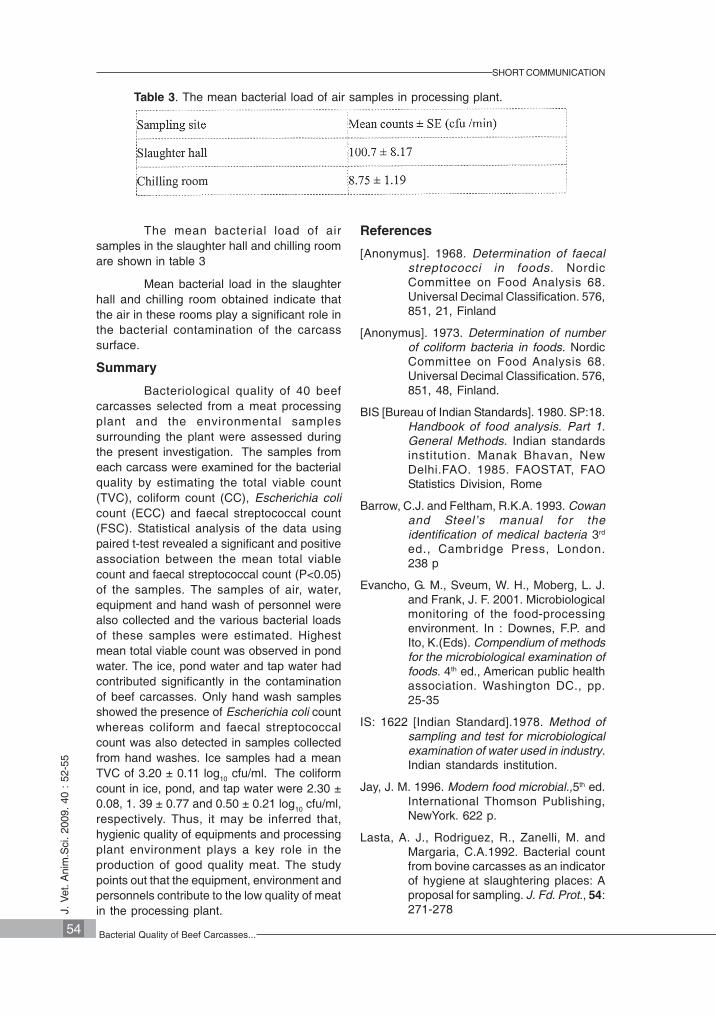
SHORT COMMUNICATION
The mean bacterial load of airsamples in the slaughter hall and chilling roomare shown in table 3
Mean bacterial load in the slaughterhall and chilling room obtained indicate thatthe air in these rooms play a significant role inthe bacterial contamination of the carcasssurface.
Summary
Bacteriological quality of 40 beefcarcasses selected from a meat processingplant and the environmental samplessurrounding the plant were assessed duringthe present investigation. The samples fromeach carcass were examined for the bacterialquality by estimating the total viable count(TVC), coliform count (CC), Escherichia colicount (ECC) and faecal streptococcal count(FSC). Statistical analysis of the data usingpaired t-test revealed a significant and positiveassociation between the mean total viablecount and faecal streptococcal count (P<0.05)of the samples. The samples of air, water,equipment and hand wash of personnel werealso collected and the various bacterial loadsof these samples were estimated. Highestmean total viable count was observed in pondwater. The ice, pond water and tap water hadcontributed significantly in the contaminationof beef carcasses. Only hand wash samplesshowed the presence of Escherichia coli countwhereas coliform and faecal streptococcalcount was also detected in samples collectedfrom hand washes. Ice samples had a meanTVC of 3.20 ± 0.11 log10 cfu/ml. The coliformcount in ice, pond, and tap water were 2.30 ±0.08, 1. 39 ± 0.77 and 0.50 ± 0.21 log10 cfu/ml,respectively. Thus, it may be inferred that,hygienic quality of equipments and processingplant environment plays a key role in theproduction of good quality meat. The studypoints out that the equipment, environment andpersonnels contribute to the low quality of meatin the processing plant.
References
[Anonymus]. 1968. Determination of faecalstreptococci in foods. NordicCommittee on Food Analysis 68.Universal Decimal Classification. 576,851, 21, Finland
[Anonymus]. 1973. Determination of numberof coliform bacteria in foods. NordicCommittee on Food Analysis 68.Universal Decimal Classification. 576,851, 48, Finland.
BIS [Bureau of Indian Standards]. 1980. SP:18.Handbook of food analysis. Part 1.General Methods. Indian standardsinstitution. Manak Bhavan, NewDelhi.FAO. 1985. FAOSTAT, FAOStatistics Division, Rome
Barrow, C.J. and Feltham, R.K.A. 1993. Cowanand Steel’s manual for theidentification of medical bacteria 3rd
ed., Cambridge Press, London.238 p
Evancho, G. M., Sveum, W. H., Moberg, L. J.and Frank, J. F. 2001. Microbiologicalmonitoring of the food-processingenvironment. In : Downes, F.P. andIto, K.(Eds). Compendium of methodsfor the microbiological examination offoods. 4th ed., American public healthassociation. Washington DC., pp.25-35
IS: 1622 [Indian Standard].1978. Method ofsampling and test for microbiologicalexamination of water used in industry.Indian standards institution.
Jay, J. M. 1996. Modern food microbial.,5th ed.International Thomson Publishing,NewYork. 622 p.
Lasta, A. J., Rodriguez, R., Zanelli, M. andMargaria, C.A.1992. Bacterial countfrom bovine carcasses as an indicatorof hygiene at slaughtering places: Aproposal for sampling. J. Fd. Prot., 54:271-278
Table 3. The mean bacterial load of air samples in processing plant.
J. V
et. A
nim
.Sci
. 20
09.
40 :
52-
55
54 Bacterial Quality of Beef Carcasses...

SHORT COMMUNICATION
Tarwate, B. G., Sherikar, A. T. and Murugkar,H.V. 1993. Microbiological analysisof environmental sources ofcontamination in Deonar abattoir. J.Fd. Sci. Technol., 30: 127-129.
C. Sethulekshmi¹ and E. Nanu²Department of Veterinary Public HealthCollege of Veterinary and Animal SciencesMannuthy - 680 651, Thrissur, Kerala
�
1. Assistant Professor2. Dean (Retd.)
Rangaswamy, R. 1995. A text book ofAgricultural Statistics. New AgeInternational publishers Ltd., NewDelhi. 495 p.
Rao, D. N. and Ramesh, B. S. 1992. Themicrobiology of sheep carcassesprocessed in a modern Indianabattoir. Meat Sci. 32: 425-436
Swansson, K. M. J., Petran, R. L. and Hankin, J.H. 2001. Culture methods forenumeration of microorganism. In:Downes, F.P. and Ito, K (Eds.)Compendium of methods for themicrobiological examination of foods. 4th
ed., American public health association.Washington DC. pp. 53-62
C. Sethulekshmi and E. Nanu
J. V
et. A
nim
.Sci
. 20
09.
40 :
52-
55
55
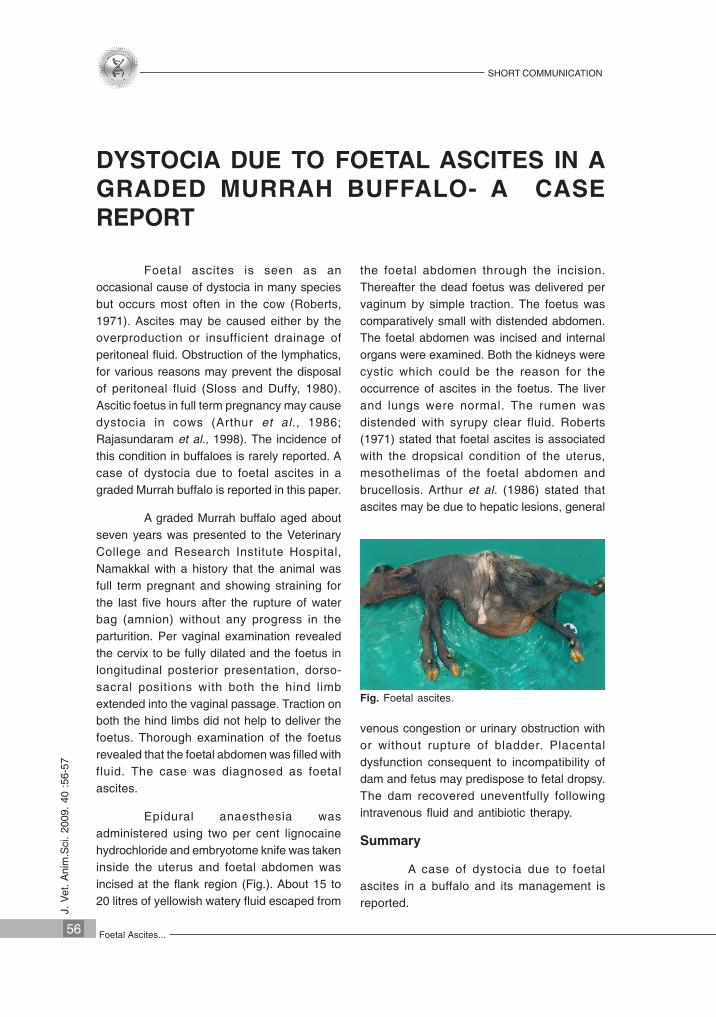
SHORT COMMUNICATIONJ.
Vet
. Ani
m.S
ci.
2009
. 40
:56
-57
56 Foetal Ascites...
DYSTOCIA DUE TO FOETAL ASCITES IN AGRADED MURRAH BUFFALO- A CASEREPORT
Foetal ascites is seen as anoccasional cause of dystocia in many speciesbut occurs most often in the cow (Roberts,1971). Ascites may be caused either by theoverproduction or insufficient drainage ofperitoneal fluid. Obstruction of the lymphatics,for various reasons may prevent the disposalof peritoneal fluid (Sloss and Duffy, 1980).Ascitic foetus in full term pregnancy may causedystocia in cows (Arthur et al., 1986;Rajasundaram et al., 1998). The incidence ofthis condition in buffaloes is rarely reported. Acase of dystocia due to foetal ascites in agraded Murrah buffalo is reported in this paper.
A graded Murrah buffalo aged aboutseven years was presented to the VeterinaryCollege and Research Institute Hospital,Namakkal with a history that the animal wasfull term pregnant and showing straining forthe last five hours after the rupture of waterbag (amnion) without any progress in theparturition. Per vaginal examination revealedthe cervix to be fully dilated and the foetus inlongitudinal posterior presentation, dorso-sacral positions with both the hind limbextended into the vaginal passage. Traction onboth the hind limbs did not help to deliver thefoetus. Thorough examination of the foetusrevealed that the foetal abdomen was filled withfluid. The case was diagnosed as foetalascites.
Epidural anaesthesia wasadministered using two per cent lignocainehydrochloride and embryotome knife was takeninside the uterus and foetal abdomen wasincised at the flank region (Fig.). About 15 to20 litres of yellowish watery fluid escaped from
the foetal abdomen through the incision.Thereafter the dead foetus was delivered pervaginum by simple traction. The foetus wascomparatively small with distended abdomen.The foetal abdomen was incised and internalorgans were examined. Both the kidneys werecystic which could be the reason for theoccurrence of ascites in the foetus. The liverand lungs were normal. The rumen wasdistended with syrupy clear fluid. Roberts(1971) stated that foetal ascites is associatedwith the dropsical condition of the uterus,mesothelimas of the foetal abdomen andbrucellosis. Arthur et al. (1986) stated thatascites may be due to hepatic lesions, general
venous congestion or urinary obstruction withor without rupture of bladder. Placentaldysfunction consequent to incompatibility ofdam and fetus may predispose to fetal dropsy.The dam recovered uneventfully followingintravenous fluid and antibiotic therapy.
Summary
A case of dystocia due to foetalascites in a buffalo and its management isreported.
Fig. Foetal ascites.

SHORT COMMUNICATION
J. V
et. A
nim
.Sci
. 20
09.
40 :
56-5
7
57M. Selvaraju et al.
M. Selvaraju1, K. Ravikumar2,M. Palanisamy3, V. Prabaharan4,R. Ravi5, R. Ezakial Napolean6 andC. Chandrahasan7
Department of Animal Reproduction, Gynaecology and ObstetricsVeterinary College and Research Institute Namakkal – 637 002
Sloss,V. and Duffy, J. H.1980. Handbook ofbovine obstetrics. Williams andWilkins, Baltimore, USA. 121 p.
�
References
Arthur, G. H., Noakes, D. E., Pearson, H andParkinson, T. J. 1996. Veterinary
Reproduction and obstetrics. 7th ed., W.B.Saunders Co., Ltd., Philadelphia, pp.302-307.
Rajasundaram, R. C., Selvaraju, S. andAyyappan, S.1998. Dystocia due tofoetal ascites in cow-a case report.Indian Vet. J., 75:165-167.
Roberts, S.J. 1971. Veterinary obstetrics andGenital diseases, 2nd ed., CBSPublishers and distributors, NewDelhi.
1. Associate Professor and Head2. Assistant Professor, Dept. of Clinics3 & 4. Assistant Professors5. Junior VAS, AHD,Tamil Nadu6. Associate Professor and Head, Dept. of Clinics7. Dean

SHORT COMMUNICATIONJ.
Vet
. Ani
m.S
ci.
2009
. 40
:58
-59
58 B. pahangi Associated Jaundice...
BRUGIA PAHANGI ASSOCIATED HAEMOLYTICJAUNDICE IN A BASSET HOUND
Jaundice is a clinical sign caused bythe accumulation of bilirubin in plasma andtissues leading to yellowish discolouration ofmucous membranes. Normalserum bilirubinlevels in dogs and cats is below 0.4 mg/dl.Hyperbilirubinaemia is clinically evident whenbilirubin level exceeds 2mg/dl. Jaundice maybe prehepatic, hepatic or post hepatic.Prehepatic causes accounts for haemolyticjaundice as in case of babesiosis,haemobartenellosis etc. The present casedeals with Brugia pahangi associatedhaemolytic jaundice in a four year old BassetHound.
A four year old male imported BassetHound was presented to the UniversityVeterinary hospital, Mannuthy with a history offever, anorexia, lethargy, dark coloured urineand abdominal pain since five days. In spite oftherapy with antibiotics and fluids the conditionof the animal deteriorated.
On clinical examination the animalhad haemoglobinuria, icteric conjunctival andpenile mucous membranes. The temperature,pulse and respiration were 102.6ºF, 110/minand 24/min respectively. On wet blood filmexamination, motile microfilariae (++++) couldbe detected. Dark field microscopy of the urinesample did not reveal any leptospires.Ultrasonography revealed hepatospleenomegalyand distended gall bladder. Blood smears were
prepared for detailed study. Giemsa stainedblood smears revealed the presence ofsheathed microfilaria (Fig.1). Haematobiochemicalabnormalities included mild leucocytosis withthrombocytopaenia and anaemia, elevatedserum levels of alanine amino transferase(ALT) (212 IU/L), alkaline phosphatase (ALP)(459 IU/L) and total bilirubin (4.5 mg/dl),hypoalbuminaemia with altered albuminglobulin ratio.
The case was diagnosed ashaemolytic jaundice due to microfilariaemia.Despite treatment with antibiotics, ivermectinand haematinics, the animal died on the verynext day of presentation.
Further the blood smears weresubjected to histochemical staining using acidphosphatase leucocyte kit (Far Diagnostics,Italy), being the most reliable method for thedifferentiation of even closely related species(Chalifoux and Hunt,1971., Lee et al., 2004).Histochemical staining revealed microfilariaewith intense acid phospshatase enzyme activityuniformly through out the body of the organism(Fig.2 ).The mean length of the microfilaria was280 µm. Based on micrometry and stainingcharacters, the microfilariae were identified asBrugia pahangi (Kelly, 1979 and Kobasa et al.,2004 ).
Fig. 1. Brugia pahangi microfilaria on giemsa stained smear. Fig. 2. Brugia pahangi microfilaria on histochemical stainingshowing intense acid phosphatase enzyme activitythroughout the body of the organism.

SHORT COMMUNICATION
J. V
et. A
nim
.Sci
. 20
09.
40 :
58-5
9
59V. R. Ambily et al.
In the present case, anaemia andhaemoglobinuria might be due to haemolysisas a result of destructive motility of microfilariaeas observed by Kitagawa et al.(1989) resultingin haemolytic jaundice. In dogs with haemolyticjaundice, reduced oxygen supply due toanaemia may induce irreversible damage tocentrilobular zone of liver resulting in hepaticcentrilobular necrosis which in turn resultingin cholestasis and further aggravateshyperbilirubinaemia. Thrombocytopaenia mayresult from immune mediated plateletdestruction due to the parasite (Anuchai et al.,2006).
The increased serum levels of ALTand ALP in microfilariosis revealed liverdysfunction secondary to circulatorydisturbance (Hashem and Badawy, 2008) ordue to localization of large number ofcirculating microfilariae in the hepatic portalvein (Ananda and D’souza, 2006).
Canine filariosis is mainly caused byfilarial parasite belonging to Dirofilaria,Dipetalonema and Brugia species. Brugiapahangi is a natural parasite of dogs and catsof Africa and Far East (Kelly, 1979). Earlierreports revealed the presence of only Dirofilariarepens in dogs of Kerala (Sabu et al., 2005).This is the first report of detection ofmicrofilariae of Brugia pahangi in dogs in India.
Summary
A case of Brugia pahangi associatedhaemolytic jaundice in a four year old BassetHound is reported.
References
Ananda, K. J. and D’souza, P. E. 2006.Haemato-biochemical changes indogs infected with microfilariosiscaused by Dirofilaria repens. IndianJ. Vet. Med., 26:139-140.
Anuchai, N., Sukullaya, A., Somporn, T., Siram,S. and Morakot, K. 2006. Caninedirofilariasis and concurrent tick bornetransmitted diseases in Bangkok,Thailand. J. Comp. Clin. Pathol., 15:249-253.
Chalifoux, L., Hunt, R.D. 1971. Histochemicaldifferentiation of Dirofilaria immitis
and Dipetalonema reconditum. J. Am.Vet. Med. Assoc., 158: 601-605.
Hashem, M., Badawy, A. 2008. Haematologicaland biochemical studies on filariasisof dogs. The Internet J. Vet. Med., 4: 1-12.
Kelly, J.D.1979. Canine heartworm disease. In:Kirk, R.W. (Ed.). Current VeterinaryTherapy VII: Small Animal Practice.W.B. Saunders, Philadelphia. pp.1526-1527.
Kitagawa, H., Sasaki, Y., Ishihara, K. 1989.Clinical studies on canine dirofilarialhaemaglobinurea: measured andcalculated serum osmolatities andosmolar gap. Jap. J. Vet. Sci., 51:703-710.
Kobasa, T., Thammapalo, S., Suvannalabha,S., Armesombun, A., Loymak, S.,Leeming Sawat., Choochite, W. 2004.Identification of Brugia malayi likemicrofilaria in naturally infected catsfrom Narathivat Province, SouthThailand. J. Trop. Med. Parasitol.,27:21-25.
Lee, S. E., Song, H. K., Liu, J., Kim, M. C.,Park, B. K., Cho, K.W., Hasegawa, A.and Kim, D. H. 2004. Comparison ofthe Acid-phosphatase staining andPolymerase Chain Reaction fordetection of Dirofilaria repensinfection in dogs in Korea. J. Vet. Med.Sci., 66:1087-1089.
Sabu, L., Devada, K., Subramanian, H. 2005.Dirofilariosis in dogs and humans inKerala. Indian J. Med. Res., 121:691-693.
1. Veterinary Surgeon, AHD, Kerala2. Associate Professor3. Senior Veterinary Surgeon, AHD, Kerala4. Associate Professor, Dept. of Veterinary Epidemiology & Preventive Medicine5. Associate Professor and Head, UVH, Kokkalai
V. R. Ambily.1, Usha Narayana Pillai2,P. P. Kanaran3, P. V. Tresamol4 andK. M. Jayakumar5
Department of Clinical Veterinary MedicineCollege of Veterinary and Animal SciencesMannuthy - 680 651, Thrissur, Kerala
�

SHORT COMMUNICATION
EFFECT OF NICOTINIC ACID SUPPLEMENTATIONON PRODUCTION PERFORMANCE OFLACTATING COWS
Nicotinic acid in its co-enzyme forms,NAD and NADP are involved in many metabolicreactions especially important for thosereactions that provide energy to the animal.There are reports showing that nicotinic acidsupplementation can improve milk productionand reduce occurrence of ketosis in cattle(Fronk and Schultz, 1979). Hence this studywas undertaken to assess the effect ofsupplementation of nicotinic acid in the diet oflactating cows on milk production and milk fatpercentage.
Twelve cross-bred lactating cowswere selected from University Livestock FarmMannuthy and were divided into two groupsas uniformly as possible with regard to parityand days in milk. They were allotted randomlyto two dietary treatments T1 and T2. All animalswere fed commercial concentrate mixture usedin the farm and green fodder to meet theirnutritive requirements. Animals of the groupT2 were fed with 10g nicotinic acid per animalper day. Records of daily milk yield weremaintained through out the experimental periodof one month. Milk samples were collected inthe beginning and towards the end of theexperiments and were analysed for fat content,using Gerber’s method (IS:1224, 1977). Dataon average milk production and fat percentagewere analysed using analysis of covarianceand students‘t’ test (Snedecor and Cochran,1994) respectively. The animals of the groupsT1 and T2 consumed on an average 5.58 and5.42 kg of concentrates respectively. Thegreen fodder was fed ad libitum.
Weekly average of daily milkproduction for control and experimental groupsare given in the table. Average initial yield was9.47 and 9.55 kg for T1and T2 respectively,and the final milk yield was 8.84 and 9.96 kgrespectively. There was no significantdifference between the two groups. Averagemilk yield of the animals which receivednicotinic acid showed a numerical increase inmilk production while there was a gradualdecline in milk yield in those fed with the control
diet. The final yield was 0.63 kg lower for thecontrol, while it was 0.41kg higher in T2 whencompared to that of the initial yield.
Initial fat percentage was 3.2 forcontrol and 3.38 percent for the treatmentgroup. The final values were 3.31 and 3.85percent respectively for groups T1 and T2. Fatpercentage also showed a numerical increasein both groups but the increase was higher forT2. However statistical analysis did not revealany significant difference between two groups.The milk yield was 7.94 and 9.68 kgrespectively for the control and experimentalgroup, with fat content corrected to fourpercent.
Results of the present study are inagreement with that of Riddell et al. (1981) whoobserved only numerical increase in milkproduction when early lactating cows weresupplemented with nicotinic acid. Dufva et al.(1982) also could not observe any significanteffect on milk yield or milk composition whensupplemented with nicotinic acid. SimilarlyCostanzo et al. (1997) reported no significantincrease in milk production but observeddecreased skin temperature during mild orsevere heat stress.
Fronk and Schultz (1979) on the otherhand observed a significant increase in milkproduction in dairy cows suffering from ketosiswhen supplemented with nicotinic acid.Similarly increased milk production was alsoreported by Jaster and Ward (1990) whennicotinic acid was supplemented to lactatingcows.
From overall assessment of theresults obtained it could be concluded thatnicotinic acid supplementation in the ration oflactating cows did not significantly improve themilk yield or milk fat percentage. But there wasa numerical increase in average daily milkyield, fat percentage and 4 per cent fatcorrected milk yield in cows supplemented withnicotinic acid.J.
Vet
. Ani
m.S
ci.
2009
. 40
: 6
0-61
60 Effect of Nicotinic Acid Supplementation...

Summary
The effect of dietary supplementationof nicotinic acid on milk yield and milk fatpercentage was studied in twelve lactatingcows allotted at random to treatments T1 andT2. All animals were fed concentrate mixtureand green grass to meet their nutritiverequirements. Animals of T2 were given 10gof nicotinic acid / head / day. Result of thestudy showed an increase in milk yield and milkfat percentage, though not statisticallysignificant, in nicotinic acid supplementedgroup.
References
Costanzo, A. DI., Spain, J. N. and Spiers, D. E.1997. Supplementation of nicotinicacid for lactating Holstein cows underheat stress condition. J. Dairy Sci.,80:1200-1206
Duvfa, G. S., Bartley, E. E., Dayton, A. O. andRiddel, D. O. 1983. Effect of niacinsupplementation on milk productionand ketosis of dairy cattle. J. DairySci., 66:2329-36
Table. Weekly average of daily milk production (kg) of experimental cows
Fronk, T. J. and Schultz, L. H. 1979. Oralnicotinic acid as a treatment forketosis. J. Dairy Sci., 62:1804
Jaster, E.H. and Ward, N.E. 1990.Supplementation of nicotinic acid ornicotinamide for lactating dairy cows.J. Dairy Sci., 73:2880-2887
Riddell, P. O., Bartley, E. E. and Dayton, A. D.1981. Effect of nicotinic acid onmicrobial protein synthesis in vitroand on dairy cattle growth and milkproduction. J. Dairy Sci., 64: 782-791
Snedecor, G.W. and Cochran, W.G. 1985.Statistical Methods. 8th ed., The IowaState University Press, USA. 313 p.
1, 3, 4 & 5 Veterinary Graduates2. Professor and Head, Dept. of Animal Nutrition
Renjith Gopal1, A. D. Mercy2, NidhishFrancis3, S. Aravind 4 and Rani Chacko 5College of Veterinary and Animal SciencesMannuthy 680 651, Thrissur, Kerala
�
J. V
et. A
nim
.Sci
. 20
09.
40 :
60-
61
61Renjith Gopal et al.
SHORT COMMUNICATION

J. V
et. A
nim
.Sci
. 20
09.
40 :
62-
64
62 Disseminated Protothecosis...
SHORT COMMUNICATION
DISSEMINATED PROTOTHECOSIS IN AGERMAN SHEPHERD DOG (GSD) – A CASEREPORT
Protothecosis is an uncommondisease of man and animals caused byunicellular colourless algae of genusPrototheca. It is considered as an emergingthreat to the AIDS patients (Woolrich et al.,1994). Infection occurs in the colon followingingestion of the organisms with subsequentdissemination via blood and lymph (Migaki etal., 1982). However prognosis for thecanine disseminated form of protothecosis isgrave. In this article a case of disseminatedprotothecosis in a German Shepherd dogwhich was presented with unresponsivechronic haemorrhagic colitis is discussed. Asper the available literature this is the first caseof disseminated canine protothecosis reportedin India.
A two year old female GSD wasreferred to College of Veterinary and AnimalSciences, Mannuthy with a history ofintermittent watery brownish diarrhoea sinceeight weeks. The condition had shown someinitial response to antidiarrhoeal medicationsbut recurred each time when treatment wasstopped. At the time of presentation to theUniversity Veterinary Hospital, Mannuthy theanimal had haemorrhagic diarrhoea withmucus, tenesmus, weight loss, occasionalvomiting, polyuria, ataxia, circling, head tilt,nystagmus, apparent blindness and deafness.Body condition was very poor and the coat wasdry and harsh. Faeces was extremely watery,bright orange-yellow in colour with blood andwith a putrid odour. Ophthalmic examinationshowed exudative retinal detachment,chorioretinitis, hyphema and vitreous opacitiesof both eyes. All the clinical data were withinnormal range.
Blood picture showed severeleucocytosis(24000/cc) with neutrophilia (90%)and other blood values were within normal range.Serum biochemical analysis revealed normalplasma protein, albumin, albumin globulin ratioand ALT level with elevated creatinine (4.0 mg%) and blood urea (118 mg %). Contrast
radiography of abdomen with barium revealedonly some thickening of the wall of the intestine.Ultrasonographic examination showed dilatedintestinal loops with anaechoic content andrenomegaly with lack of corticomedullarydistinction. Faecal flotation technique wasnegative for ova of endoparasites and Giardiaspp. Microscopic examination of faecal samplerevealed a large number of unidentifiedpleomorphic unicellular organisms with severalendospores within them. Culture of bowel swabproduced a light growth of gram negative bacillisensitive to ciprofloxacin. Faecal smearsstained with Wrights stain revealed largenumber of organisms with thick cell wall andmetachromatic cytoplasmic granules and smallcentrally placed nucleus, which were tentativelyidentified as Prototheca sp. (Fig. 1). Culturalexamination of faecal sample in blood agar andSDA free of cyclohexamide yielded white to tancolonies on third day and characteristicorganism in all stages of development wereidentified by staining the smear from colonywith gram’s stain. The morphologic featureswere compatible with those reported forPrototheca sp. The dog’s condition wasdeteriorated rapidly over the next 5 days anddied on 7th day of admission inspite of thetreatment with antibiotics, fluids, styptics etc.Cultural examination of CSF, vitreous humourand pericardial fluid on SDA yielded same typeof organism. The organisms were seen in largenumbers in faeces but were not identified untilcultural examination was performed, sospecific therapy was not attempted in this case.
Post mortem examination revealedthickened caecal and colonic mucosa withpetechiations and pinpoint foci of necrosis. Thecontents were haemorrhagic, mucoid and foulsmelling. White to gray nodules of 1 to 3 mmdiameter were diffusely scattered throughoutvarious organs like kidney, heart and liver whichcorresponded to the dense accumulation oforganisms (Fig.2). Histopathologicalexamination of these tissues revealed large

J. V
et. A
nim
.Sci
. 20
09.
40 :
62-
64
63Usha Narayanan Pillai et al.
al., 2005). To our knowledge, this may be thefirst case reported having all the clinical signsof systemic protothecosis viz., gastro intestinal,ocular, cochlear, neurological and renal failure.The white firm nodules seen grossly in manytissues were identified as granulomascomposed mostly of aggregations ofprototheca (Imes et al., 1977).
The diagnosis of the case was basedonly on cultural examination of faecal swab,CSF, pericardial fluid and fluid from vitreoushumor and also by histopathologicalexamination of heart, kidney and colon.Successful treatment will depend on earlydiagnosis and aggressive chemotherapy.Canine cases reported in the literature wereunresponsive to all antibiotics, corticosteroidand Amphotericin B (Moore et al., 1985). Thefailure of animals to respond to therapy isprobably attributed to the advanced stage ofthe disease by the time the dog was broughtfor treatment. So any animal brought to thehospital with history of protracted bloodydiarrhoea coupled with ocular lesions shouldbe suspected for protothecosis.
SummaryA four year old German Shepherd
dog was presented to the University VeterinaryCollege hospital with history of chronichaemorrhagic diarrhoea, tenesmus andblindness. Cultural/stained faecal smearexamination revealed the presence oforganism with morphologic featurescompatible to those reported for Protothecaspp. Dog’s clinical condition deterioratedand died on 7th day of hospitalization.Histopathological evaluation revealed largenumber of organisms of varying morphologywith slightly refractile capsules.
number of organisms varying in theirmorphology i.e., varying in size (5-15 µm),shape, slightly refractile capsules withendospores forming several sporangiospores(Fig.3).
Prototheca are ubiquitous in theenvironment. Three species are currentlyrecognized as P. stagnors, P. wickerhami andP. zopfii of which the last two have beenincriminated as pathogens (Migaki et al., 1982).The signs of colitis with which this dogpresented may have been related to invasionof the colon by prototheca organisms since thecolonic mucosa appears to be the main site ofprototheca replication (Rallis et al., 2002).Similar to what has been reported in otherdogs, this dog had bloody diarrhoea andprominent ocular, cochlear and neurologicabnormalities (Thomas and Preston, 1990). Ina retrospective study, 20 of 26 dogs withsystemic protothecosis were presented withophthalmic signs (Amanda et al., 2006) and twoof 13 dogs with acute renal failure (Pressier et
Fig.3: Photomicrograph of myocardial tissuewith protothecal organism – Several of whichhave typical endosporulation (H&E x 1000x)
Fig.2: Numerous small granulomas of themyocardium with disseminated protothecosis.
Fig.1. Wright stained faecal smear. Notice thevariable size of the organism (1000x)
SHORT COMMUNICATION

Acknowledgement
The authors are thankful to the Dean,College of Veterinary and Animal Sciences,Mannuthy for providing necessary facilities tocarry out this study.
References
Amanda, M., Bain, P. J., Latimer, K. S., LeRoy,B., Rakieh, P. M. 2006. Canineprotothecosis. Lecture notes,Department of Pathology and AthensVeterinary Diagnostic Laboratory,College of Veterinary Medicine, TheUniversity of Georgia,Athens, GA.30602-7388
Imes, G. P., Lloyd, J. C., Brightman, M. P. 1977.Disseminated protothecosis in a dog.Ondersteport J. Vet. Res., 44:1-5
Moore, F. M., Schmidt, G. M. and Desai, D.1985. Unsuccessful treatment ofdisseminated protothecosis in a dog.J. Am. Vet. Med. Assoc., 186: 705-708.
Migaki, G., Font, R. L., Sauer, R. M., Kaplan,W., Miler, R. L. 1982. Canineprotothecosis: Review of the literature
1. Associate Professor , Dept. of Clinical Veterinary Medicine2. Associate Professor, Dept. of Veterinary Epidemiology& Preventive Medicine3. Professor & Head, Dept. of Veterinary Epidemiology& Preventive Medicine4. Professor (on leave)5,7, & 9.Veterinary Surgeons, AHD, Kerala6. Ph.D. Scholar8. Assistant Professor, Madras Veterinary College, Chennai
Usha Narayana Pillai1, P. V. Tresamol2,M. R. Saseendranath3, P. G . Baby4,R. Rajeswari5, Joseph Cyrus6 ,Abijith Thampan7, Rishi Kesavan8 andReji Varghese9
College of Veterinary and Animal SciencesMannuthy-680 651, Thrissur, Kerala
�
and report of an additional cases. J.Am. Vet. Med. Assoc., 181: 794-797
Pressier, B. M., Gookin, J. L., Sykes, J. E., Wolf,A. M., Vaden, S. L. 2005. Urinary tractmanifestation of protothecosis indogs. J. Vet. Intern Med., 19: 115-119
Rallis, T. S., Tontis, D., Moraitou, K. K.,Mylonakis, M. E., Papazeoglou, L. G.2002. Protothecal colitis in a GermanShepherd Dog. Aust. Vet. J., 80: 406-408
Thomas, J. B., Preston, N. 1990. Generalisedprotothecosis in a collie dog. Aust.Vet. J., 1990; 67:25-27
Woolrich, A.., Koestenblatt, E., Don, P. 1994.Cutaneous protothecosis and AIDS.J. Am. Acad Dermatol., 31:920-924
J. V
et. A
nim
.Sci
. 20
09.
40 :
62-
64
64 Disseminated Protothecosis...
