journal of the association for research in otolaryngology · pdf filejournal of the...
TRANSCRIPT

Supporting Cell Division Is Not Required for Regenerationof Auditory Hair Cells After Ototoxic Injury In Vitro
JIALIN SHANG1, JON CAFARO
1, RACHEL NEHMER1, AND JENNIFER STONE
1
1Department of Otolaryngology/Head and Neck Surgery, The Virginia Merrill Bloedel Hearing Research Center, University ofWashington School of Medicine, Seattle, WA 98195-7923, USA
Received: 7 August 2009; Accepted: 22 December 2009; Online publication: 18 February 2010
ABSTRACT
In chickens, nonsensory supporting cells divide andregenerate auditory hair cells after injury. Anatomicalevidence suggests that supporting cells can also trans-differentiate into hair cells without dividing. In thisstudy, we characterized an organ culture model tostudy auditory hair cell regeneration, and we usedthese cultures to test if direct transdifferentiationalone can lead to significant hair cell regeneration.Control cultures (organs from posthatch chickensmaintained without streptomycin) showed completehair cell loss in the proximal (high-frequency) regionby 5 days. In contrast, a 2-day treatment withstreptomycin induced loss of hair cells from allregions by 3 days. Hair cell regeneration proceededin culture, with the time course of supporting celldivision and hair cell differentiation generally resem-bling in vivo patterns. The degree of supporting celldivision depended upon the presence of streptomy-cin, the epithelial region, the type of culture media,and serum concentration. On average, 87% of theregenerated hair cells lacked the cell division markerBrdU despite its continuous presence, suggesting thatmost hair cells were regenerated via direct trans-differentiation. Addition of the DNA polymeraseinhibitor aphidicolin to culture media prevented
supporting cell division, but numerous hair cells wereregenerated nonetheless. These hair cells showedsigns of functional maturation, including stereociliarybundles and rapid uptake of FM1-43. These observa-tions demonstrate that direct transdifferentiation is asignificant mechanism of hair cell regeneration in thechicken auditory after streptomycin damage in vitro.
Keywords: hair cell, supporting cell, regeneration,basilar papilla, BrdU, aphidicolin, directtransdifferentiation, proliferation
INTRODUCTION
Mechanosensitive hair cells (HCs) are required forhearing. HCs are injured by ototoxic drugs, intensesound stimuli, and changes associated with aging.Mature mammals cannot replace auditory HCs, butmature birds can. Avian HC regeneration occurs viadivision of progenitor cells within the auditory epi-thelium (basilar papilla, BP; Corwin and Cotanche1988; Ryals and Rubel 1988; Raphael 1992; Hashinoand Salvi 1993; Stone and Cotanche 1994). Theseprogenitor cells, called supporting cells (SCs), arequiescent unless HCs are injured (Corwin andCotanche 1988; Ryals and Rubel 1988; Lippe et al.1991; Warchol and Corwin 1996). Upon HC loss, SCsdivide and progeny differentiate into HCs or SCs.Normal numbers of HCs return within 2–3 weeks(reviewed in Stone and Cotanche 2007). Restorationof normal structure and function, including cellularmaturation and reinnervation, takes several weeks(reviewed in Bermingham-McDonogh and Rubel 2003).
Several observations suggest that some HCs in thechicken BP may be regenerated by a process calleddirect transdifferentiation, which is the phenotypic con-
Correspondence to: Jennifer Stone & Department of Otolaryngology/Head and Neck Surgery, The Virginia Merrill Bloedel HearingResearch Center & University of Washington School of Medicine &
Seattle, WA 98195-7923, USA. Telephone: +1-206-6164108; fax: +1-206-2215685; email: [email protected]
Electronic supplementary material The online version of this article(doi:10.1007/s10162-009-0206-7) contains supplementary material,which is available to authorized users.
JARO 11: 203–222 (2010)DOI: 10.1007/s10162-009-0206-7D 2010 Association for Research in Otolaryngology
203
JAROJournal of the Association for Research in Otolaryngology

version of SCs into HCs without cell division (reviewedin Morest and Cotanche 2004; Stone and Cotanche2007). This process contributes to HC regeneration incultured saccules of frogs and salamanders afteraminoglycoside-induced injury (Baird et al. 1996,2000; Taylor and Forge 2005). In chickens, someregenerated auditory HCs are unlabeled for a pro-liferation marker (3H-thymidine or bromodeoxyuri-dine (BrdU)) despite its continual perfusion into theinner ear after damage (Roberson et al. 1996, 2004).Cells with features of both HCs and SCs were seen inregenerating BPs, suggesting such cells were SCsconverting into HCs (Adler et al. 1997; Cafaro et al.2007). Also, attenuation of SC division did not preventthe reemergence of HCs in the BP (Adler andRaphael 1996). While this latter finding suggestsHCs can be regenerated independent of SC division,inhibition of division in this study was incomplete.Therefore, despite substantial evidence for directtransdifferentiation in the chicken BP, further studiesare warranted.
Here, we describe an organotypic culture systemfor the chicken BP that has allowed us to examine thecontribution of direct transdifferentiation to auditoryHC regeneration after drug damage. Three studieshave previously described patterns of auditory HC lossin control and drug-treated organ cultures (Oesterleet al. 1993; Frenz et al. 1998; Cheng et al. 2003).Oesterle et al. (1993) also showed that limited SCdivision occurs in organ cultures maintained withoutototoxic drugs for 2 days. Other studies showed thatsubstantial SC division occurs in organ cultures afterdrug damage (Navaratnam et al. 1996; Daudet et al.2009) or HC ablation (Warchol and Corwin 1996),with some mitotic events leading to production of newHCs (Navaratnam et al. 1996). In the current study,we examined the time course, levels, and spatialpatterns of SC division and HC regeneration incultured chicken BPs treated with streptomycin. Wefound that high numbers of HCs regenerated afterdrug damage were formed by direct transdifferentia-tion, even when SC division was completely blocked.
METHODS
Chicken housing
Fertile eggs of chickens (Gallus domesticus) of theWhite Leghorn variety were purchased from HylineInternational (Graham, WA, USA) and maintained ina standard incubator until hatching. Hatchlings werehoused in heated brooders with free access to waterand food until the initiation of experiments, betweenposthatch days 5 and 10. All methods were approvedby the University of Washington’s IACUC and con-formed to AALAC standards.
Preparation of uncultured tissue
In some studies, comparisons were made between BPsthat had been cultured and uncultured BPs that hadbeen dissected from control or gentamicin-treatedchickens and immediately fixed. For these experi-ments, chickens received a single subcutaneous injec-tion of gentamicin (Sigma-Aldrich, St. Louis, MI,USA) at a dose of 250 mg/kg, administered on twoconsecutive days, and survived for various periodsafter gentamicin treatment. Chickens were eutha-nized by Nembutal overdose (100 mg/kg, intraper-itoneal injection) and decapitation. The tympanicmembrane and columella were dissected away, creat-ing a hole into the inner ear. The head was thenimmersion-fixed in 4% paraformaldehyde for 1 to1.5 h. Tissue was rinsed in phosphate-buffered saline(PBS). The cochlear duct was removed from thetemporal bone, and the tegmentum vasculosum andtectorial membrane were mechanically removed fromthe cochlear duct.
Organ cultures
Chickens were euthanized by rapid decapitation.Following brief immersion in 70% ethanol, cochlearducts were removed via a lateral approach throughthe middle ear and placed in ice-cold sterile Hanksbuffered saline solution (HBSS; Sigma-Aldrich). Thetegmentum vasculosum was dissected off the cochlearduct, and the remaining tissue of the cochlear ductwas cultured free-floating in 500 µl of media per wellin 48-well plates. The remaining tissues (auditory endorgans) were incubated at 37°C in 95% air/5% CO2.For comparison, two culture media (Sigma-Aldrich)were used: Dulbecco’s Modified Eagle’s Medium(DMEM) or basal minimal Eagle’s (BME)/Earle’sbuffered salt solution (EBSS; a mixture of one partBME and two parts EBSS; Oesterle et al. 1993). Noagitation of tissue was performed during the cultureperiod.
Cultures were maintained for periods ranging from1 to 12 days. For each experiment, at least threeculture runs were performed, with five to eight organsper run. In every experiment, culture media weresupplemented with glucose (4.5 g/l in DMEM and3.9 g/l in BME/EBSS) and fetal bovine serum at 0%,1%, 5%, or 10% (Atlantic Biologicals, Atlanta, GA,USA). In some experiments, the following drugs(from Sigma-Aldrich) were also added to culturemedia: penicillin/streptomycin solution (workingconcentration of 200 penicillin units per milliliterand working concentration of 78 µM streptomycin),BrdU (0.1 or 1 µM), dimethyl sulfoxide (DMSO) at0.5% or 1%, and/or aphidicolin (3 µM, 10 µM, or25 µM).
204 SHANG ET AL.: Hair Cell Regeneration In Vitro

At the end of the culture period, the tectorialmembrane was removed from the sensory epitheliumusing a combination of enzymatic and mechanicalmethods (Stone et al. 1996). Tissue was fixed with 4%buffered paraformaldehyde for 30 min to 1 h at roomtemperature and then rinsed in PBS.
Live labeling with FM1-43-FX
Uptake of the fixable styryl dye FM1-43-FX (MolecularProbes, Eugene, OR, USA) into live HCs was examinedin two experiments. In the first experiment, aimed tolabel and trace original HCs during streptomycintreatment, cochlear ducts were isolated as describedabove; the tegmentum vasculosum was dissected off,and the tectorial membrane was removed mechan-ically after treatment with thermolysin (3 mg/ml).Organs were placed in room-temperature HBSS for3 min and were transferred to FM1-43-FX for 2 min at37°C. Organs were transferred to culture media, withor without streptomycin, at 37°C and were fixed10 min, 2 days, or 5 days later. In the second experi-ment, aimed to determine if regenerated HCs rapidlyincorporate FM1-43, organs that had been cultured for10 or 12 days were rinsed in warmed HBSS and thenplaced in 37°C FM1-43-FX for 20 s. Organs weretransferred to culture media for 30 min and fixed.For both experiments, FM1-43-FX was dissolved inDMSO to make a 1-mM stock solution. The dye wasthen diluted to 5 µM in HBSS, with the final concen-tration of DMSO at 0.5%.
Labeling of fixed tissues
To assess stereociliary bundle morphology, auditoryend organs were labeled for 1.5 h with rhodaminephalloidin (Molecular Probes) diluted to 200 unitsper milliliter in PBS plus 0.05% triton X100 detergent(PBT). To label cell nuclei, organs were immersed in10 µg/ml propidium iodide (from Sigma-Aldrich anddissolved in PBT) for 1 min.
Standard indirect immunofluorescence or immu-nohistochemistry was used to detect proteins in whole-mount preparations (see Stone et al. 1996). Thefollowing primary antibodies were used: mouse anti-BrdU (Becton Dickinson, Franklin Lakes, NJ, USA),rat anti-BrdU (clone BU1/75; Sera Laboratories, WestSussex, UK), rabbit antiphosphohistone H3 (anti-pH3; Upstate Biotechnology, Lake Placid, NY, USA),rabbit anti-myosinVI (purchased from University Cal-ifornia San Diego, San Diego, CA, USA or fromProteus Biosciences, Ramona, CA, USA), mouse anti-hair-cell antigen (gift from Dr. Guy Richardson,University of Sussex, UK), mouse anti-class III ß-tubulin (gift from Dr. Anthony Frankfurter, Universityof Virginia), and mouse anticalmodulin (Sigma-
Aldrich). Secondary antibodies conjugated to fluoro-phores (Cy3, Alexa 488, Alexa 594, Cy5) werepurchased from Molecular Probes or Jackson Labo-ratories (West Grove, PA, USA). Secondary antibodiesconjugated to biotin were purchased from VectorLaboratories (Burlingame, CA, USA). Diaminobenzi-dine (DAB) labeling was performed using the horse-radish-peroxidase-conjugated ABC reagent fromVector Laboratories (Stone et al. 1996).
The terminal deoxynucleotidyl transferase dUTPnick end labeling (TUNEL) reaction with fluorescentdetection (Chemicon, Temecula, CA, USA) was usedaccording to manufacturer’s instructions to detectdying cells in whole mounts.
For all fluorescent labeling, auditory end organswere whole-mounted onto microscope slides in Vecta-shield (Vector Laboratories) and coverslipped. DAB-labeled organs were whole-mounted onto microscopeslides in 90% glycerol in PBS and coverslipped.Others were processed for plastic sectioning, asdescribed in Stone et al. (1996).
Analysis
Qualitative analyses.Qualitative analyses were performedwith a Zeiss Axioplan microscope or with a confocallaser scanning microscope (Bio-Rad MRC 1024 orOlympus Fluoview 1000). For qualitative analysis oflabeling for FM1-43-FX, various antibodies, or TUNEL,12-16 BPs from at least two different culture runs wereexamined per group.
Quantitative analyses. Although each experiment wasrepeated at least two times, with six to eight BPs perrun, we performed quantitative analyses only on BPsthat were fully intact. Therefore, Ns varied acrossexperiments, as described below.
Nonfluorescent labels. To quantify cumulative BrdU/DABlabeling in the BP, organs were cultured for 3 days ineither DMEM or BME/EMSS, with or withoutstreptomycin, with 1 µM BrdU present the entireperiod. Images of the BP were captured on a LeicaAristoplan microscope at ×10 using a SPOT DigitalCamera and digital software (Diagnostic InstrumentsInc., SterlingHeights, MI, USA). Amontage of the entireBP was generated for each sample using NationalInstitutes of Health (NIH) Object Image. The BP wassubdivided into tenths, lengthwise (proximal/highfrequency to distal/low frequency), and four sites werechosen in which to count BrdU-labeled nuclei: 10%from the distal tip (called distal), 30% from the distal tip(called middistal), 60% from the distal tip (calledmidproximal), and 90% from the distal tip (calledproximal; Fig. 1A). At each site, two 9,359-µm2 regionswithin the BP were analyzed with a ×100 oil objective
SHANG ET AL.: Hair Cell Regeneration In Vitro 205

with ×1.25 zoom, one along the neural edge of the BP(called neural) and one along the abneural edge (calledabneural). BrdU labeling densities (numbers of BrdU-labeled nuclei per 10,000 µm2) were determined in bothregions in a given site (except for the proximal site,where only the neural region was analyzed because ofthe narrowness of the epithelium there). A total of sevenfields were sampled per BP, constituting approximately10% of each BP’s area. Only strongly labeled cellslocated within the BP (sensory epithelium) werecounted. Three analyses were performed to obtaingroup data. First, we computed an average overallBrdU labeling density by averaging densities across allseven sites for all BPs in a group. These data arepresented in Figure 5 and Tables 2 and 3. Second, weperformed an analysis of widthwise gradients in BrdUlabeling density in which data for all lengthwise sites
(distal, middistal, midproximal, and proximal) for agiven widthwise region (neural or abneural) werecombined and averaged. For this analysis, the proximalregion was omitted, since we had designated it as havingonly a neural region. Third, we performed an analysis oflengthwise gradients in BrdU labeling density, in whichboth widthwise regions (neural and abneural) for agiven lengthwise site (distal, middistal, midproximal, andproximal) were combined and averaged. Data onwidthwise and lengthwise gradients are presented inTable 2. Numbers of organs used for each analysis arelisted in Table 1.
To estimate the percentage of BP cells that wereBrdU positive after 3 days of culture in streptomycin-free media (shown in Tables 2 and 3), we performedthe following analysis. First, we estimated the averagedensity of HCs per 10,000 µm2 in a normal BP to be130, based on data shown in Figure 3. Second,assuming an HC/SC ratio of 1:2 (Goodyear andRichardson 1997), we estimated that there are nor-mally around 260 SCs per 10,000 µm2. By dividing theBrdU labeling density for each region by 260, weestimated the percentage of SCs that divided duringthe 3-day culture period. These numbers only repre-sent rough estimates, since they do not take intoaccount regional variations in HC and SC densitiesthroughout the BP.
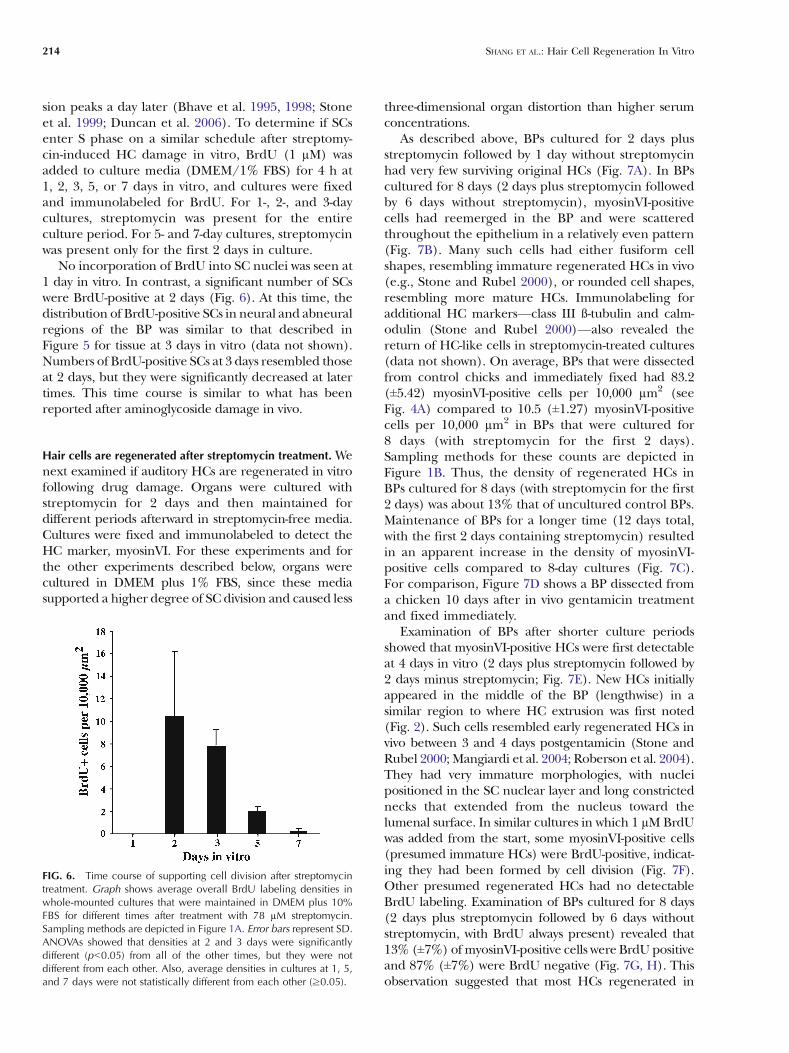
To quantify SCs in S phase at different times afterdamage, streptomycin-treated cultures maintained inDMEM with 10% fetal bovine serum (FBS) were pulse-labeled for 4 h with 1 µM BrdU on days 1, 2, 3, 5, or 7 invitro and fixed. BrdU labeling densities were assessedusing the samemethods described above for cumulativeBrdU labeling. Overall BrdU labeling densities areshown in Figure 6. For each time point, we analyzedfour BPs (with the exception being for 2 days in vitro, forwhich five BPs were analyzed).
FIG. 1. Sampling methods used for quantitative analyses. Thesedrawings depict the regions analyzed for quantitative examination ofBrdU and myosinVI labeling densities. A Sampling method used forcounts of BrdU labeling graphed in Figures 5 and 6 and presented inTables 2 and 3. B Sampling method used for counts of myosinVI andBrdU labeling (discussed in text with Fig. 7 and graphed in Fig. 11). CSampling method used for counts of myosinVI and BrdU labelinggraphed in Figure 9. D Sampling method for counts of propidium-iodide-positive nuclei, discussed in the text after Figure 11.
TABLE 1
Numbers of auditory end organs analyzed for cumulativeBrdU labeling densities for 3-day cultures with or without
streptomycin
Media [Serum] Streptomycin? Number
DMEM 10% Y 115% Y 41% Y 6
10% N 125% N 31% N 3
BME/EBSS 10% Y 105% Y 31% Y 4
10% N 165% N 41% N 4
Y yes, N no
206 SHANG ET AL.: Hair Cell Regeneration In Vitro

Fluorescent labels. Images for quantification of fluorescentlabels were generated using confocal laser scanningmicroscopy (Bio-Rad MRC 1024 or Olympus Fluoview1000).
To measure rhodamine phalloidin labeling densities,we took images from similar regions as described abovefor cumulative BrdU labeling (90%, 60%, 30%, and
10% lengthwise; neural and abneural widthwise) on aZeiss Axioplan epifluorescence microscope. The area ofeach region was 10,000 µm2. Phalloidin-positive bun-dles were counted using ImageJ Cell Counter in threeBPs for each group. Data were converted to bundlesper 10,000 µm2. Overall averages for each treatmentgroup are shown in Figure 3.
TABLE 2
BrdU labeling densities at 3 days in vitro
No StreptomycinOverall Analysis Width-wise Gradient Analysis
DMEM BME/EBSS DMEM BME/EBSSN AN N AN
5.55±8.872.1%
6.16±12.82.4%
3.78±6.261.45%
3.92±7.751.5%
0.51±1.430.2%
4.30±8.521.7%
p=0.711 p=0.934 p=0.003Length-wise Gradient Analysis
DMEM BME/EBSS90% (P) 60% 30% 10% (D) 90% (P) 60% 30% 10% (D)
15.5±12.056.0%
10.1±8.853.9%
1.21±2.850.5%
0.10±0.450%
28.7±18.011%
6.42±9.352.5%
0.74±3.420.3%
0.06±0.270%
Plus StreptomycinOverall Analysis Width-wise Gradient Analysis
DMEM BME/EBSS DMEM BME/EBSSN AN N AN
11.6±10.34.4%
6.11±9.062.4%
9.23±7.833.6%
12.3±10.84.7%
0.67±1.360.3%
7.09±8.612.7%
p=0.000 p=0.213 p=0.000Length-wise Gradient Analysis
DMEM BME/EBSS90% (P) 60% 30% 10% (D) 90% (P) 60% 30% 10% (D)21.7±11.6
8.4%13.3±8.39
5.1%10.3±6.87
4.0%8.72±12.3
3.35%19.5±9.20
7.5%7.65±9.52
2.9%2.94±5.63
1.1%1.07±1.39
0.4%
The average number of BrdU-labeled nuclei per 10,000 μm2±S.D. is shown for BPs cultured with either no streptomycin (top) or plus streptomycin (bottom) and ineither DMEM or BME/EBSS containing 10% FBS. Data are also expressed as a percentage of total SCs (assumed to be 260 SCs per 10,000 μm2). For the OverallAnalysis, all regions were combined to obtain an average. For the Width-wise Gradient Analysis, data from the proximal (90%) region were omitted, and data fromthe remaining three length-wise regions were combined to obtain an average for each width-wise region. For the Length-wise Gradient Analyses, data from the twowidth-wise sites were combined to obtain an average for each length-wise site. N = neural, AN = abneural. P = proximal, D = distal. p values apply to ANOVA
TABLE 3
Effects of serum concentration on BrdU labeling density
Drug condition Media No FBS (serum-free) 1% FBS 5% FBS 10% FBS
No Strept (control) DMEM – 8.21±11.5 6.73±12.0 5.55±8.873.2% 2.6% 2.1%
BME/EBSS – 5.13±9.02 4.62±9.31 6.16±12.82.0% 1.8% 2.4%
Plus Strept DMEMa 20.2±11.0 7.8% 17.6±16.2 19.1±16.5 11.6±10.36.8% 7.4% 4.4%
BME/EBSS – 6.33±8.35 8.30±14.2 6.11±9.062.4% 3.2% 2.4%
The average number of BrdU-labeled nuclei per 10,000 µm2 ± SD is shown for each type of culture media and each level of serum concentration. In addition, dataare also expressed as a percentage of total SCs (assumed to be 260 SCs per 10,000 µm2)
– not analyzedaThis media type alone showed statistically significant differences across serum concentration by ANOVA (p≤0.05); 0% FBS (no serum, N=7 BPs), 1% FBS, and 5%
FBS were significantly different from 10%, but they were not different from one another
SHANG ET AL.: Hair Cell Regeneration In Vitro 207

For studies in which SC division was inhibited longterm with aphidicolin (Fig. 11), we quantified myo-sinVI-positive and/or BrdU-positive cells in BPs cul-tured for 8 days (2 days plus streptomycin/6 dayswithout streptomycin) with 1 µM BrdU in either DMEMalone (n=4 BPs), DMEM plus DMSO (n=3 BPs), orDMEM plus aphidicolin (n=4 BPs), with 1% FBSpresent in all cases. For each organ, we captured a Z-series stack image (×60 oil objective, 41,209 µm2 areaper field, 1-µm steps) in 10–12 sites along the length ofthe BP (Fig. 1B), sampling 65–78% of the BP’s area.Each stack extended from the lumenal surface to thebasilar membrane. The first stack was collected at theproximal tip, and subsequent stacks were collected everyother field, until the distal end was reached. Stacks werecollected only in the widthwise middle region (halfwaybetween the neural and abneural edges of the BP).Using NIH ImageJ Cell Counter, we counted cells thatwere myosinVI positive, BrdU positive, or double-labeled within the stack. Data from all sites were pooledto obtain average densities (number of cells per10,000 µm2) for each label in each BP. Data werethen averaged across BPs. To be considered BrdUpositive, strong discrete nuclear labeling had to bepresent; to be considered myosinVI positive, cells hadto have strong labeling throughout the cytoplasm.
To quantify myosinVI-positive or BrdU-positive cellsin 8-day cultures (2 days plus streptomycin/6 dayswithout streptomycin) grown in DMEM supple-mented with 1% FBS and BrdU at different concen-trations (Fig. 9), we analyzed six BPs at 0 µM BrdU,five BPs at 0.10 µM BrdU, and four BPs at 1 µM BrdU,each of which was double-labeled for myosinVI andBrdU. For each BP, we generated a Z-series stack (×60oil objective, 41,209 µm2 area per field, 1-µm steps) inthree lengthwise sites (proximal tip, middle, distaltip), with each site located about midway between theneural and abneural edges of the BP (Fig. 1C). Eachstack extended from the lumenal space through thebasilar membrane. Using NIH ImageJ Cell Counter,we counted cells that were myosinVI positive, BrdUpositive, or double-labeled in each stack. Data fromthe three sites were pooled to obtain average densitiesfor each label for each BP (numbers of labeled cellsper 10,000 µm2).
All phosphohistone-H3-positive cells per BP werecounted in 8-day cultures (2 days plus streptomycin/6 days without streptomycin) grown in DMEM supple-mented with 1% FBS and either DMSO or aphidicolinby systematically scanning the entire BP. Data fromfour BPs were averaged for each group.
We estimated the percentage of directly transdiffer-entiated HCs that incorporated FM1-43 in BPs culturedfor 12 days (2 days plus streptomycin followed by 10 dayswithout streptomycin) with 10 µM AraC present thewhole time.We randomly selected two regions in each of
three BPs for analysis at ×40 magnification and scoredmyosinVI-positive cells as FM1-43 positive or negative.Strong perinuclear FM1-43 signal was required forassignment as FM1-43 positive.
To estimate the density of propidium iodide-labelednuclei in BPs cultured for 8 days (2 days plus strepto-mycin/6 days without streptomycin) in DMEM and 1%FBS plus either DMSO or aphidicolin, we created a Z-series stack using 0.2-µm steps in the middle region ofthe BP using a ×60 oil objective (Fig. 1D). Each stackextended from the lumenal space through the basilarmembrane. Each field was centered on the samelandmark—the abneural edge of the superior cartilagi-nous plate. Using NIH ImageJ, five different 5-µm-thickoptical vertical sections were generated through eachvolume, and brightest point projections were created.Propidium-iodide-positive nuclei in the BP (HCs andSCS) were counted in each slice; each slice’s volume wasoriginally 14,210 µm3. For each BP, data were averagedacross the five slices. Data were then averaged acrossBPs (n=4 per group) and converted to derive thenumber of propidium-iodide-labeled cells per10,000 µm3.
Statistical Analyses. All data were expressed as averagesplus or minus one standard deviation (SD). For allstatistical analyses, data were subjected to analyses ofvariance with Fishers’ protected least significantdifference (Statview, Abacus Concepts). Differenceswere considered statistically significant when p≤0.05.
RESULTS
Patterns of in vitro hair cell loss in controland streptomycin-treated organ cultures
In initial experiments, cultures were maintained inBME/EBSS or DMEM plus 10% FBS for variousperiods. Stereociliary bundles were assessed usingrhodamine phalloidin, a label for filamentous actin.In control BPs (not cultured), bundles appearedevenly distributed in all regions (Fig. 2A–C). Averagedensities of phalloidin-positive bundles varied acrossregions, with lowest levels proximally and highestlevels distally (Fig. 3A). In BPs cultured for 1 daywithout streptomycin, there was significant loss ofbundles from proximal and midproximal regions(Fig. 3B). After 2 days of culture without streptomy-cin, significant bundle loss was evident in all regions,except the distal region (Figs. 2D–F and 3D). After5 days of culture without streptomycin, nearly allbundles had been lost from the proximal region, butmany bundles were retained in middle and distalregions (Fig. 2G–I). These trends were observed inBPs cultured in either media type. However, bundle
208 SHANG ET AL.: Hair Cell Regeneration In Vitro

loss appeared to be slower and less extensive in BPsmaintained in BME/EBSS compared to DMEM.
To assess the pattern and timing of HC bundle lossafter in vitro treatment with the aminoglycoside,streptomycin, auditory end organs were cultured inBME/EBSS or DMEM plus 10% FBS, with 78 µMstreptomycin (plus penicillin) for different periods. Asabove, phalloidin labeling was used to assess HCbundles. After 1 day of streptomycin treatment, therewas bundle disruption and decreased bundle densitiesin all regions (Fig. 3C). After 2 days of streptomycintreatment, virtually all HC bundles were lost from the
middle region, while some bundles were retained inproximal and distal regions (Figs. 2J–L and 3E). Inorgans cultured with streptomycin for 2 days followedby 1 day without streptomycin in either media type,no original bundles remained in the entire BP(Fig. 2M–O). We detected no clear widthwise (neu-ral–abneural) gradients in HC loss in BPs cultured ineither media type. These trends were observed in BPscultured in either media type.
To determine if the disappearance of HC bundlesreflected complete extrusion of HC bodies from theBP, auditory end organs were immunolabeled to
FIG. 2. Spontaneous and streptomycin-induced loss of stereociliary bundles inculture. This figure shows fluorescenceimages of rhodamine phalloidin labelingtaken from three regions of the BP(proximal A, D, G, J, M; middle B, E, H,K, N; and distal C, F, I, L, O). Control BPs(not cultured) are shown in A–C. Alsoshown are BPs cultured in DMEM plus10% FBS, without streptomycin (Strept)for 2 (D–F) or 5 days in vitro (div; G–I),and BPs cultured in DMEM plus 10% FBSwith 78 µM streptomycin for 2 div (J–L) orwith 78 µM streptomycin for 2 days (d)followed by 1 day without streptomycin(M–O). Note the complete loss of rhod-amine phalloidin-labeled bundles in cul-tures lacking streptomycin from theproximal BP by 5 div (G) and thecomplete loss of bundles in culturescontaining streptomycin from all regionsof the BP by 3 div (M–O). In all images,proximal is toward the left and abneural(AN) is down. Scale bar in A=50 µm forall panels.
SHANG ET AL.: Hair Cell Regeneration In Vitro 209

detect the HC-specific antigen, myosinVI. In organsdissected from control chicks and fixed withoutculturing, strong myosinVI labeling normally occursin HC cytoplasm and stereocilia but not in nonsensorySCs (Duncan et al. 2006; Fig. 4A, C). In organscultured for 2 days with 78 µM streptomycin followedby 1 day without streptomycin in DMEM plus 10%FBS, the BP was either devoid of myosinVI labeling orcontained only small myosinVI-positive HC fragments(Fig. 4B, D). A similar result was obtained usingantibodies to class III ß-tubulin or calmodulin (datanot shown), which are additional HC-selectivemarkers (Stone et al. 1996). A similar degree of HC losswas seen in cultures grown in BME/EBSS, 10% FBS, andstreptomycin for a similar period (data not shown).
In theory, streptomycin treatment could causechanges leading to reduced immunolabeling for someHC markers and give the false impression of HC loss.
To address this, we examined the fate of original HCsusing the vital fixable dye, FM1-43-FX. Short in vitroexposures to this dye result in its selective uptake byHCs (Gale et al. 2001; Meyers et al. 2003; Si et al.2003). BPs loaded with FM1-43-FX for 2 min andmaintained in culture for 10 min in DMEM/10% FBSwithout streptomycin showed strong labeling in HCs(Fig. 4E) but no significant labeling in SCs (data notshown). HC-specific FM1-43 labeling was retained whencultures were grown for an additional 2 days withoutstreptomycin (Fig. 4F), although labeling became morecondensed. Strong FM1-43-FX labeling was alsoretained after 5 days of growth in streptomycin-freemedia after loading (data not shown). These findingsdemonstrate that 2-min exposures to FM1-43-FXlead to selective uptake in HCs, and FM1-43-FX isretained when tissue is not exposed to ototoxicdrugs. BPs were loaded with FM1-43-FX as just
FIG. 3. Quantitative analysis of stereociliary bundle loss in culture.Average densities of HC bundles are graphed for control (uncultured)BPs (A), BPs cultured for 1 day with no streptomycin in DMEM or BME/EBSS (B), BPs cultured for 1 day plus streptomycin in DMEM or BME/EBSS (C), BPs cultured for 2 days with no streptomycin in DMEM orBME/EBSS (D), and BPs cultured for 2 days plus streptomycin in DMEM
or BME/EBSS (E). Four different regions were analyzed for these counts:proximal (90% distance from distal tip), midproximal (60% distancefrom distal tip), middistal (30% distance from distal tip), and distal (10%distance from distal tip). Asterisks indicate significant difference fromcorresponding region in control (A) at p≤0.05, as assessed by ANOVAwith Fisher PLSD. Error bars represent SD.
210 SHANG ET AL.: Hair Cell Regeneration In Vitro

described and cultured in DMEM/10% FBS for2 days with 78 µM streptomycin. This treatmentresulted in near-complete loss of FM1-43 signal fromthe HC layer (Fig. 4G), although some diffusepunctate signal was sometimes seen, perhaps indying HCs or HC remnants. The SC layer continuedto show negligible FM1-43 labeling (Fig. 4H).
Collectively, these experiments indicate that 2-day invitro treatments with 78 µM streptomycin cause near-complete loss of auditory HCs by 1 day later. Given theadvantage of ridding the BP of all original HCs forregeneration studies, we used 2–3-day treatments with78 µM streptomycin to induce auditory HC loss in mostexperiments described below. However, we also per-formed some experiments with brief, 2-h treatments of78 µM streptomycin, using phalloidin to mark HCbundles (Supplementary Fig. 1). These shorter treat-ments caused a proximal-to-distal gradient of bundleloss, which resembled what has been reported afteraminoglycoside administration in vivo (e.g., Janas et al.1995) or short aminoglycoside exposures in vitro (e.g.,Cheng et al. 2003). Bundles from original HCs wereretained in middle and proximal regions as late as5 days after brief streptomycin treatments.
Supporting cell proliferation occurs in basilarpapillae cultured without streptomycin
To determine if spontaneous HC loss in culturesgrown without streptomycin triggers SC division, weexamined uptake of the nucleoside analog bromo-deoxyuridine (BrdU), a marker of cells that enter theDNA synthesis (S) phase of the cell cycle (Gratzner1982). BrdU (1 µM) was included in cultures grown ineither BME/EBSS or DMEM plus 10% FBS for 3 dayswithout streptomycin. After fixation, BPs were immu-noreacted to detect BrdU.
BrdU-positive nuclei were detected in BPs grown instreptomycin-free cultures in DMEM (Fig. 5A, B) orBME/EBSS (image not shown) plus 10% FBS. Wecounted BrdU-positive nuclei in seven fields across theBP, and we performed statistical analyses to assess thefollowing features of these data: overall average BrdUlabeling densities, widthwise gradients of average BrdUlabeling densities, and lengthwise gradients of averageBrdU labeling densities (see “Methods” for descrip-tions). In addition, we estimated the percentage of SCsthat were BrdU-labeled. These data are presented inTable 2. Average BrdU labeling densities (nuclei per
FIG. 4. Streptomycin treatment in cul-ture causes loss of all hair cells from theepithelium. Panels A–D show images ofmyosinVI labeling in control BPs (notcultured, A, C) and in BPs cultured for2 days in DMEMwith 10% FBSwith 78 µMstreptomycin followed by 1 day in the samemedia without streptomycin (B, D). Imageswere taken midway between the proximaland distal tips of the BP in whole-mountpreparations (A, B) and plastic cross sec-tions (C, D). Note the virtually completeloss of myosin VI immunoreactivity fromthis region in streptomycin-treated BPs (B,D). One remainingmyosinVI-positive cell isevident in B (arrow), and a single myosinVI-positive cell in the process of extrusion isshown in D (arrow). Panels E–H showimages of FM1-43-FX incorporation in thecontrol BP (E), in a BP cultured for 2 dayswithout streptomycin (F), and in a BPcultured for 2 days plus streptomycin (G,H). Whole mounts from the middistalregion are shown. The plane of focus is inthe HC layer (HCL) in E–G and in the SClayer (SCL) inH. Note the retention of FM1-43-FX-positive HC after 2 days of culture instreptomycin-free conditions (F) comparedto the complete loss of FM1-43-FX-positiveHCs after 2 days of culture with streptomy-cin (G). FM1-43-FX-positive cells were notpresent in the SCL in either culture con-dition (H). AN abneural; Lu lumen. Scalebar in A=50 µm for A and B and 20 µm forC–H.
SHANG ET AL.: Hair Cell Regeneration In Vitro 211

10,000 µm2) for each lengthwise site and widthwiseregion in each media type are graphed in Figure 5C.
We found no statistically significant differencebetween BPs cultured in DMEM and BPs cultured inBME/EBSS with respect to overall BrdU labelingdensities (Table 2). Analysis of widthwise gradients (withproximal data omitted) showed that, in BPs grown inDMEM, average BrdU labeling densities were similar inneural and abneural halves of the BP, while in BPsgrown in BME/EBSS, they were significantly higher inthe abneural half. Analysis of lengthwise gradientsrevealed that, for both media, average BrdU labelingdensity was highest in the proximal end and lowest inthe distal end. Based on the overall analysis, we
estimated that approximately 2% of SCs cultured ineithermedia type entered the cell cycle during the 3-dayculture period in streptomycin-free conditions.
Supporting cell proliferation is upregulatedafter streptomycin treatment in vitro,with different responses in the two media types
Next, we examined rates of SC division in streptomycin-treated cultures, in which complete HC loss wastriggered. BrdU (1 µM) and streptomycin (78 µM) wereadded to DMEM plus 10% FBS for 3 days. Cultures werefixed, and cumulative SC division was assessed by BrdUimmunolabeling, similar to above. Averaged data are
FIG. 5. Supporting cells divide in cultures with and withoutstreptomycin. Digital images (A, B, D, E, G, H) show BrdUimmunohistochemistry in different regions of the whole-mount BPafter three continuous days of culture in DMEM/10% FBS or BME/EBSS/10% FBS, with or without streptomycin (at 78 µM) and withBrdU (1 µM) in the media. All images are focused on the sensoryepithelium. The black lines demarcate the neural and abneural limitsof the BP. In cultures maintained without streptomycin (A, B), severalBrdU-positive nuclei (black dots) were present in the proximal end ofthe BP (A), but fewer BrdU-positive nuclei were present in the distalhalf (B). Average BrdU labeling densities for cultures grown without
streptomycin in either DMEM or BME/EBSS (10% FBS) are graphed inC (see Fig. 1A for sampling methods and Table 1 for Ns). Error barsrepresent SD. In cultures maintained in DMEM (D, E) or BME/EBSS(G, H) plus 78 µM streptomycin and 10% FBS, significantly moreBrdU-positive nuclei were noted than in controls, particularly inmiddle and distal regions. BrdU labeling densities for streptomycin-treated cultures are graphed in F. Error bars represent SD. In allimages, proximal is toward the left, and abneural is down. Arrowspoint to the neural region of the BP, and arrowheads point to theabneural region. Scale bar in A= in 50 µm for A, B, D, E, G, and H.
212 SHANG ET AL.: Hair Cell Regeneration In Vitro

presented in Table 2, and average BrdU labelingdensities for each lengthwise site and widthwise regionin each media type are graphed in Figure 5F.
In contrast to streptomycin-free conditions, overallBrdU labeling densities varied according to culturemedia when streptomycin was present; BPs culturedin DMEM had statistically higher average BrdU label-ing densities than BPs cultured in BME/EBSS(Table 2; compare Fig. 5D, E with Fig. 5G, H).Therefore, subsequent analyses of BrdU labeling foreach media type are discussed independently.
For BPs cultured in DMEM, the overall BrdUlabeling density was twofold higher in streptomycin-treated BPs than in untreated BPs (11.6±10.3 versus5.55±8.87 labeled cells per 10,000 µm2, pG0.0001; seeTable 2; compare Fig. 5D, E with Fig. 5A, B). Weestimated that 4.4% of SCs entered the cell cycleduring the culture period.
Organs cultured in DMEM plus streptomycin hadtwo areas of high BrdU labeling density that ran instripes along the abneural and neural edges of the BP.These foci were easily distinguished in the middle anddistal portions of the epithelium, but they were lessevident in the proximal portion, which is thinner inwidth. This pattern was different from BPs cultured instreptomycin-free conditions, in which BrdU uptakewas largely confined to SCs in the proximal region.The presence of two distinct foci of SC division in a largeexpanse of a lesion was surprising, since SC entry intothe cell cycle generally mirrors HC loss (e.g., Stone andCotanche 1994), and streptomycin-induced HC loss waswidespread and not limited to just the neural andabneural edges. This was also surprising because noclear widthwise (neural–abneural) gradients werenoted in the temporal progression of HC loss afterstreptomycin treatment. Statistical analysis of widthwisegradients showed that, in streptomycin-treated BPsgrown in DMEM, the average BrdU labeling density inthe neural region was not significantly different fromthe density in the abneural region (Table 2). Analysis oflengthwise gradients showed that average BrdU labelingdensities varied significantly between the proximal siteand all other sites (pG0.05; Table 2), but they weresimilar between the distal and middistal sites (p=0.605),the middistal and middle sites (p=0.146), and themiddle and midproximal sites (p=0.344).
When we analyzed BPs cultured in BME/EBSS, wefound no significant difference in the overall BrdUlabeling densities between untreated BPs and strepto-mycin-treated BPs (6.16±12.8 versus 6.11±9.06labeled cells per 10,000 µm2; p=0.977; see Table 2;compare Fig. 5A, B with Fig. 5G, H). This observationwas not anticipated, since streptomycin-treated BPsshowed significantly more HC loss throughout the BPthan streptomycin-free cultures. Analysis of widthwisegradients revealed that BrdU uptake in BPs cultured
in BME/EBSS was mostly confined to SCs along theabneural edge (Table 2). This is in contrast to BPscultured inDMEM,which had both neural and abneuralfoci of SC division. This observation was also surprising,since HCs had been lost throughout the entire BP.
Analysis of BPs cultured in BME/EBSS plus strep-tomycin showed significant variation in average BrdUlabeling densities in different lengthwise sites, whichwas similar to that seen in BPs cultured in DMEM plusstreptomycin (Table 2). For BME/EBSS, averageBrdU labeling densities were significantly differentbetween all sites (pG0.05), except for between thedistal and middistal sites (p=0.392).
In drug-damaged cultures, higher serum levelsare associated with decreased supporting celldivision and altered organ growth
To determine effects of serum concentration on SCdivision, we compared cumulative BrdU labelingduring 3 days of culture in DMEM or BME/EBSScontaining 1%, 5%, or 10% FBS, BrdU (1 µM), andstreptomycin. We performed this analysis for controlBPs and for BPs treated with streptomycin, and wedetermined average overall BrdU labeling densitiesfor each serum concentration. BrdU-positive nucleiwere detected using DAB immunohistochemistry, asshown in Fig. 5. Data are presented in Table 3.
In control cultures without streptomycin, there wasno significant effect of serum concentration on overallBrdU labeling densities in either media type (p90.2 forall comparisons). Similarly, serum concentration had noeffect on SC division in BPs cultured with streptomycinin BME/EBSS (p90.3 for all comparisons). In contrast,BrdU labeling densities tended to be inversely correlatedwith serum concentration in BPs cultured with strepto-mycin in DMEM. Differences were statistically signifi-cant between cultures grown in 1% and 10% (p=0.013)and cultures grown in 5% and 10% (p=0.014), butthere was no significant difference between culturesgrown in 1% and 5% FBS (p=0.635). We observed thatany cultures grown in 5% or 10% FBS had significantthree-dimensional distortion, which included twisting ofthe organ into a spiral configuration. In contrast,cultures grown in 1% FBS showed little or no distortion.
Collectively, these results indicate that low serumlevels are beneficial for studies of hair cell regener-ation following streptomycin treatment, due toincreased SC division and reduced tissue distortion.
Supporting cell reentry into cell cycleafter aminoglycoside treatment is similar in vitroand in vivo
In vivo, a few SCs in the BP enter S phase around2 days after aminoglycoside treatment, and SC divi-
SHANG ET AL.: Hair Cell Regeneration In Vitro 213
sion peaks a day later (Bhave et al. 1995, 1998; Stoneet al. 1999; Duncan et al. 2006). To determine if SCsenter S phase on a similar schedule after streptomy-cin-induced HC damage in vitro, BrdU (1 µM) wasadded to culture media (DMEM/1% FBS) for 4 h at1, 2, 3, 5, or 7 days in vitro, and cultures were fixedand immunolabeled for BrdU. For 1-, 2-, and 3-daycultures, streptomycin was present for the entireculture period. For 5- and 7-day cultures, streptomycinwas present only for the first 2 days in culture.
No incorporation of BrdU into SC nuclei was seen at1 day in vitro. In contrast, a significant number of SCswere BrdU-positive at 2 days (Fig. 6). At this time, thedistribution of BrdU-positive SCs in neural and abneuralregions of the BP was similar to that described inFigure 5 for tissue at 3 days in vitro (data not shown).Numbers of BrdU-positive SCs at 3 days resembled thoseat 2 days, but they were significantly decreased at latertimes. This time course is similar to what has beenreported after aminoglycoside damage in vivo.
Hair cells are regenerated after streptomycin treatment. Wenext examined if auditory HCs are regenerated in vitrofollowing drug damage. Organs were cultured withstreptomycin for 2 days and then maintained fordifferent periods afterward in streptomycin-free media.Cultures were fixed and immunolabeled to detect theHC marker, myosinVI. For these experiments and forthe other experiments described below, organs werecultured in DMEM plus 1% FBS, since these mediasupported a higher degree of SC division and caused less
three-dimensional organ distortion than higher serumconcentrations.
As described above, BPs cultured for 2 days plusstreptomycin followed by 1 day without streptomycinhad very few surviving original HCs (Fig. 7A). In BPscultured for 8 days (2 days plus streptomycin followedby 6 days without streptomycin), myosinVI-positivecells had reemerged in the BP and were scatteredthroughout the epithelium in a relatively even pattern(Fig. 7B). Many such cells had either fusiform cellshapes, resembling immature regenerated HCs in vivo(e.g., Stone and Rubel 2000), or rounded cell shapes,resembling more mature HCs. Immunolabeling foradditional HC markers—class III ß-tubulin and calm-odulin (Stone and Rubel 2000)—also revealed thereturn of HC-like cells in streptomycin-treated cultures(data not shown). On average, BPs that were dissectedfrom control chicks and immediately fixed had 83.2(±5.42) myosinVI-positive cells per 10,000 µm2 (seeFig. 4A) compared to 10.5 (±1.27) myosinVI-positivecells per 10,000 µm2 in BPs that were cultured for8 days (with streptomycin for the first 2 days).Sampling methods for these counts are depicted inFigure 1B. Thus, the density of regenerated HCs inBPs cultured for 8 days (with streptomycin for the first2 days) was about 13% that of uncultured control BPs.Maintenance of BPs for a longer time (12 days total,with the first 2 days containing streptomycin) resultedin an apparent increase in the density of myosinVI-positive cells compared to 8-day cultures (Fig. 7C).For comparison, Figure 7D shows a BP dissected froma chicken 10 days after in vivo gentamicin treatmentand fixed immediately.
Examination of BPs after shorter culture periodsshowed that myosinVI-positive HCs were first detectableat 4 days in vitro (2 days plus streptomycin followed by2 days minus streptomycin; Fig. 7E). New HCs initiallyappeared in the middle of the BP (lengthwise) in asimilar region to where HC extrusion was first noted(Fig. 2). Such cells resembled early regenerated HCs invivo between 3 and 4 days postgentamicin (Stone andRubel 2000; Mangiardi et al. 2004; Roberson et al. 2004).They had very immature morphologies, with nucleipositioned in the SC nuclear layer and long constrictednecks that extended from the nucleus toward thelumenal surface. In similar cultures in which 1 µM BrdUwas added from the start, some myosinVI-positive cells(presumed immature HCs) were BrdU-positive, indicat-ing they had been formed by cell division (Fig. 7F).Other presumed regenerated HCs had no detectableBrdU labeling. Examination of BPs cultured for 8 days(2 days plus streptomycin followed by 6 days withoutstreptomycin, with BrdU always present) revealed that13% (±7%) ofmyosinVI-positive cells were BrdU positiveand 87% (±7%) were BrdU negative (Fig. 7G, H). Thisobservation suggested that most HCs regenerated in
FIG. 6. Time course of supporting cell division after streptomycintreatment. Graph shows average overall BrdU labeling densities inwhole-mounted cultures that were maintained in DMEM plus 10%FBS for different times after treatment with 78 µM streptomycin.Sampling methods are depicted in Figure 1A. Error bars represent SD.ANOVAs showed that densities at 2 and 3 days were significantlydifferent (pG0.05) from all of the other times, but they were notdifferent from each other. Also, average densities in cultures at 1, 5,and 7 days were not statistically different from each other (≥0.05).
214 SHANG ET AL.: Hair Cell Regeneration In Vitro

culture were formed by direct transdifferentiation of SCsrather than by SCmitosis. This interpretation was furtherexplored (described below). We found that 5% of BrdU-positive cells were myosinVI-positive, indicating that, at8 days in culture, only a small percentage of postmitoticcells had begun to differentiate as HCs.
To explore the extent to which HC features differ-entiate in culture, we counter-labeled 8-day cultureswith antibodies to hair cell antigen (HCA). HCA is aglycoprotein present in developing and mature ster-eociliary bundles of avian HCs (Bartolami et al. 1991).It is expressed at a later stage of differentiation duringin vivo regeneration than myosinVI (Stone and Rubel2000). HCA labeling was evident atop some myosinVI-positive/BrdU-negative cells (Fig. 7H), but it wasdetected rarely on myosinVI-positive/BrdU-positivecells. Of 426 myosinVI-positive cells examinedthroughout three BPs, apical HCA labeling wasdetected in 365 BrdU-negative cells, but it wasdetected in only one BrdU-positive cell.
In a few experiments, we examined HC regenerationin BPs cultured in BME/EBSSwith 1%FBS for 2 days plusstreptomycin followed by 6 days without streptomycin.Wenoted that HCs were also regenerated under theseconditions, but further analyses were not performed.
Hair cells are regenerated in serum-free media
To investigate if HC regeneration occurs in the absenceof serum, we cultured organs in DMEM plus streptomy-cin and 1 µMBrdU for 3 days, with no FBS present at anytime. Analysis of BrdU immunohistochemical labelingshowed that SCs continued to enter S phase in theabsence of serum, in a spatial pattern resembling thatseen in organs cultured with 1–10% FBS present(Fig. 8A, compare with Fig. 5D, E). There was nostatistically significant difference in the overall BrdUlabeling densities of BPs grownwithout FBS compared toBPs grown with 1% or 5% FBS (Table 3). However, BPscultured without FBS had significantly higher overall
FIG. 7. Hair cells are regenerated in culture. Panels A–C showmyosinVI immunolabeling in the midproximal region of whole-mount BPs that were cultured in DMEM and 1% FBS for 2 days with78 µM streptomycin (Strept) followed by periods in the same mediawithout streptomycin, for a total of 3 days (A), 8 days (B), or 12 days(C) in vitro. The arrow in A indicates an original HC that remained inthe epithelium after streptomycin treatment. Panel D shows myo-sinVI labeling in a similar region at 10 days after gentamicin (Gent)treatment in vivo. In A–D, proximal is toward the left, and abneural isdownward. Panels E and F are images taken from one field located inthe middle of a BP after 4 days of culture (including an initial 2 daysof streptomycin). MyosinVI labeling is shown in E, and bothmyosinVI (cytoplasmic label) and BrdU (nuclear label) labeling are
shown in F. The nuclei of two regenerated HCs are indicated by anarrow and an arrowhead in each panel. In both cells, long myosinVI-positive necks extend upward, toward the lumen. The arrow pointsto a cell that has a BrdU-negative nucleus; the arrowhead points to acell with a BrdU-positive nucleus. Panels G and H are images takenfrom one field in the middle of the BP after 8 days of culture, withmyosinVI labeling in G and with myosinVI (cytoplasmic label) andBrdU (nuclear label) labeling shown in H. Arrowheads point tomyosinVI-positive cells that are BrdU-positive, while arrows point tomyosinVI-positive cells that are BrdU-negative and also have HCA-positive bundles (small dots) atop them. Scale bar in A=50 µm for A–D and 15 µm for E–H.
SHANG ET AL.: Hair Cell Regeneration In Vitro 215

BrdU labeling densities compared to BPs cultured with10% FBS. Mitotic figures were evident in the sensoryepithelium (Fig. 8A, inset), indicating that SCs were ableto complete the cell cycle in the absence of serum. Inaddition, myosinVI-positive cells that were either BrdU-positive (Fig. 8B) or BrdU-negative (Fig. 8C) reemergedin serum-free cultures maintained for 2 days withstreptomycin followed by 4 days without streptomycin(with BrdUpresent the entire time), indicating that bothnonmitotic and mitotic HC regeneration had occurred.
Hair cell differentiation is inhibited by BrdU
In other tissues, BrdU can hamper cellular differ-entiation, due to its inhibition of transcription ofcertain genes (Levitt and Dorfman 1972; Tapscott etal. 1989). To test if BrdU concentration affects differ-entiation of regenerated HCs in vitro, we determined
the average density of regenerated myosinVI-positivecells in 8-day cultures (2 days plus streptomycin then6 days without streptomycin) grown with either 0, 0.1,or 1 µM BrdU for the entire culture period.
We found no statistically significant difference inmyosinVI labeling densities between BPs cultured with 0or 0.1 µM BrdU, but there was a significant decrease inmyosinVI labeling densities in BPs cultured in 1 µMcompared to the other two groups (pG0.05; Fig. 9).These findings suggested that the higher concentrationof BrdU either prevented or delayed differentiation ofregenerated HCs, as measured by myosinVI immuno-reactivity. BPs cultured with 1 µM BrdU had statisticallyhigher average BrdU labeling densities than BPscultured with 0.10 µM BrdU (pG0.05; Fig. 9). Thisobservation most likely reflects the need for a minimumnuclear accumulation of BrdU for its detection viaimmunofluorescence. These findings serve as an impor-tant reminder that estimates of SC proliferation and HCdifferentiation are largely influenced by the amount ofBrdU present in culture media.
Supporting cell division is drastically inhibitedwith aphidicolin treatment
Our observation that a large proportion of HCsformed in culture lacked nuclear BrdU labelingsuggested that direct transdifferentiation (i.e., con-version of SCs into HCs without cell division) is amajor mode of new HC production in chicken BPsin vitro. If this were true, then large numbers ofHCs should be regenerated, even when SC divisionis inhibited. To address this, we examined the ability
FIG. 8. Supporting cell division and hair cell differentiation proceed inserum-free conditions. All panels show BPs cultured in serum-freeDMEMand 1 µMBrdU for thewhole culture period.AThis panel showsBrdU labeling in the middle region of a BP cultured for 3 days with78 µM streptomycin prior to fixation. Distal is toward the right, andabneural is downward. The edges of the BP are demarcated by blacklines. In the inset, BrdU-positive cells are shown at higher magnification,including twomitotic figures (arrows). B, CMyosinVI and BrdU labelingin a BP cultured for 2 days with 78 µM streptomycin followed by 4 dayswithout streptomycin. Arrowhead in B points to a cell that is myosinVIpositive and BrdU positive; arrowhead in C points to a cell that ismyosinVI positive and BrdUnegative. Scale bar inA=30 µm forA, 5 µmfor inset in A and for B and C.
FIG. 9. BrdU inhibits differentiation of hair cells. The average densityof BrdU-positive cells (white bars) or myosinVI-positive cells (black bars)is shown for 8-day cultures grown inDMEMplus 1% FBS for 2 dayswith78 µM streptomycin followed by 6 days in the same media withoutstreptomycin, with different concentrations of BrdU present. Thesampling method for these counts is depicted in Figure 1C. Asteriskssignify significant differences between indicated groups (p≤0.05,ANOVAwith Fisher’s PLSD). Error bars represent SD.
216 SHANG ET AL.: Hair Cell Regeneration In Vitro

of the DNA polymerase inhibitor, aphidicolin, toprevent SC division. Aphidicolin blocks a wide rangeof cell types from progressing past the G1/S borderof the cell cycle (Pedrali-Noy et al., 1980). At 25 µM,aphidicolin has also been shown to block SCdivision in newt saccules (Taylor and Forge 2005)and frog saccules (Baird et al. 1996, 2000; Gale etal. 2002).
In pilot experiments, we tested whether aphidico-lin has noticeable toxic effects on mature HCs byculturing organs for 3 days with 25 µM aphidicolin(dissolved in 1% DMSO) or 1% DMSO withoutstreptomycin. After culture, BPs were labeled todetect myosinVI. We found no qualitative differencein the density or appearance of myosinVI-positivecells between the two culture conditions (data notshown), suggesting that aphidicolin itself is not toxicto HCs.
To test if aphidicolin prevents SCs from dividing,organs were dissected and cultured for 3 days withstreptomycin and either 1%DMSOor 25 µM aphidicolin.For the last day in culture, 1 µM BrdU was included tolabel dividing cells. Media were replenished daily.Organs were fixed and immunolabeled to detectBrdU. In DMSO-treated BPs, nuclei with strongBrdU labeling were abundant and appeared smalland round (Fig. 10A), similar to cultures describedin Figure 5. Some BrdU-positive mitotic figures wereevident (Fig. 10A, inset). In contrast, BrdU-positivenuclei were rare in aphidicolin-treated BPs, and theyappeared very different than in DMSO-treatedcultures; they were larger in size and much morelightly labeled with BrdU (Fig. 10B). Similar obser-vations were made in the cartilage for each group ofBPs (see insets Fig. 10A, B). Further, we found thattreatments of aphidicolin as short as 6 h preventedsignificant BrdU uptake (data not shown).
The paucity of BrdU-labeled nuclei in aphidicolin-treated BPs suggested that, at least during the thirdday in culture, many SCs were unable to progress intoS phase. To test if SCs that did make it to S phase wereable to complete the cell cycle, we immunolabeledBPs in each group for pH3, a marker specific for cellsin mitosis, and counter-labeled them with propidiumiodide, a dye for nucleic acids (Fig. 10C, D). Theentire BP was scanned using confocal microscopy forpH3-positive cells. On average, each DMSO-treatedBP had 28.8 (± 6.80) pH3-positive cells, but eachaphidicolin-treated BP lacked pH3-positive cells,confirming that 25 µM aphidicolin prevented allSCs from reaching mitosis and dividing. We per-formed similar experiments with aphidicolin atlower doses (2.5 and 10 µM), but we found theypermitted significantly more SC division (data notshown). Therefore, these lower doses were not usedin subsequent experiments.
Hair cells continue to be regenerated despiteblockade of supporting cell division
Next, we examined if HCs are regenerated when SCdivision is drastically attenuated. Organs were cul-tured in streptomycin for 2 days and in streptomycin-free media for six additional days. In half of thecultures, 25 µM aphidicolin was added to media forthe whole culture period. The remaining cultureswere treated for the whole culture period with 1%DMSO or with nothing (controls). BrdU (1 µM) wasincluded for the entire culture period to assesscumulative SC division. Media were replenished daily.Cultures were fixed and triple-labeled to detectmyosinVI, HCA, and BrdU.
Numerous BrdU-positive nuclei were detected in BPscultured in control media (Fig. 11A) or with DMSO(Fig. 11B). In both cases, BrdU-labeled nuclei werepresent in myosinVI-positive cells (presumed regener-
FIG. 10. Aphidicolin prevents supporting cell division. All panelsshow whole-mounted BPs cultured for 3 days in DMEM plus 1% FBSand 78 µM streptomycin, supplemented with either 1% DMSO (A, C)or 25 µM aphidicolin (B, D). Thin white lines in A and B show theneural and abneural borders of the BP (neural is toward the right).The midproximal region is shown in all panels. In A, a portion of theinferior cartilage plate (ICP) covers the abneural edge of the BP. ADMSO controls had numerous BrdU-positive cells in the BP and themiddle of the ICP (inset). BrdU labeling in interphase nuclei (arrow)and in mitotic chromatin (arrowhead) was evident. B Aphidicolin-treated BPs showed dramatic reduction in the number of BrdU-positive cells and the intensity of BrdU labeling, in both the BP(arrow) and the ICP (inset). DMSO-treated BPs had numerous pH3-positive mitotic figures (C), while aphidicolin-treated BPs (D) hadnone. Propidium iodide (PI) labeling (nuclear label in C and D)indicates location of all nuclei. Scale bar in A=30 µm for A and B(and insets) and 15 µm for C and D.
SHANG ET AL.: Hair Cell Regeneration In Vitro 217

ated HCs) as well as in myosinVI-negative cells (pre-sumed regenerated SCs). In contrast, no BrdU-positivenuclei were seen in aphidicolin-treated BPs (Fig. 11C),although tiny fragments of BrdU labeling were some-times evident (Fig. 11C, inset). Numbers of BrdU-positive nuclei were also drastically reduced in tissuesoutside the SE, such as the cartilage (data not shown).
Despite the lack of BrdU-positive SCs in aphidico-lin-treated BPs, a significant number of myosinVI-positive cells had reemerged in all regions (Fig. 11C).These cells had morphologies resembling regener-ated HCs in control and DMSO-treated cultures.Similar results were seen with antibodies to the HC-selective protein, calmodulin (data not shown). Wenoted that some regenerated HCs in cultures thatincluded DMSO appeared to be fused (Fig. 11B,inset); such cells were not noted in control cultures.
Counts of myosinVI-labeled and/or BrdU-labeledcells in the three culture groups are shown inFigure 11D. MyosinVI labeling densities were signifi-cantly different between all three groups (pG0.05), withcontrols having the highest densities and aphidicolin-
treated BPs having the lowest. Densities of new HCsformed without SC division (myosinVI-positive/BrdU-negative) were significantly higher in controls than inDMSO-treated cultures (p=0.009) or aphidicolin-treated cultures (p=0.003), although there was nosignificant difference between DMSO- and aphidi-colin-treated cultures (p=0.656). DMSO-treated BPshad significantly more BrdU-positive nuclei thancontrols (p=0.000; Fig. 11E). However, the densityof myosinVI-positive/BrdU-positive cells was notsignificantly different between controls and DMSO-treated BPs (p=0.075), suggesting that DMSO didnot affect the rate of differentiation of HC-likefeatures among postmitotic cells.
We examined whether myosinVI-positive cells regen-erated in the absence of SC division are able todifferentiate advanced HC features, including stereo-ciliary bundles and functional mechanotransductionchannels, if maintained for longer periods in culture.Organs were cultured for either 10 days (2 days plusstreptomycin followed by 8 days without streptomycin)or 12 days (2 days plus streptomycin followed by 10 days
FIG. 11. Regeneration of differentiatedhair cells proceeds when supporting celldivision is blocked. A–C show BPs cul-tured for 8 days (2 days plus 78 µMstreptomycin followed by 6 days withoutstreptomycin) in control media (DMEM/1% FBS; A), media plus 1% DMSO (B), ormedia plus 25 µM aphidicolin (C). BPswere immunolabeled for myosinVI (cyto-plasmic label) and BrdU (nuclear label).The arrowhead in B inset points to twofused myosinVI-positive cells with propi-dium-iodide (PI)-labeled nuclei. The insetin C shows BrdU-positive cell fragments(arrowheads). Average labeling densitiesfor myosinVI-positive cells for each treat-ment group cultures are graphed in D.MyoVI myosinVI, DTD direct transdiffer-entiation, Post-M postmitotic. Averagelabeling densities for BrdU-positive cellsfor each treatment group are graphed inE. The sampling method for counts in Dand E is depicted in Figure 1B. Error barsin both graphs represent SD. F and G showthe same field from a 10-day culture,double-labeled for myosinVI and HCA.Arrows in G point to HCA-positive stereo-ciliary bundles atop myosinVI-positive cellsin F. H shows a 12-day culture double-labeled for myosinVI (label throughoutcytoplasm) and FM1-43-FX (punctate labelin cytoplasm). Arrowheads point to twodouble-labeled cells. Scale bar inA=25 µmfor A–C, 15 µm for B and C insets, and10 µm for F–H.
218 SHANG ET AL.: Hair Cell Regeneration In Vitro
without streptomycin), with 25 µM aphidicolin and1 µM BrdU present for the entire culture period. BPswere fixed and immunoreacted to detect the stereociliamarker HCA, or they were live-labeled with FM1-43 for avery short period. This latter measure has been shownto reflect differentiation of mechanotransduction byHCs in other studies (Géléoc and Holt 2003; Si et al.2003). In 10-day cultures treated with aphidicolin, manymyosinVI-positive cells had begun to develop bundles ofstereocilia, as reflected by colabeling for HCA (Barto-lami et al. 1991; Fig. 11E, F). In 12-day cultures, 39%(±10%) of myosinVI-positive cells also showed significantuptake of FM1-43-FX (Fig. 11G), suggesting they hadoperational mechanotransduction channels.
The finding that HCs are regenerated in theabsence of SC division strongly suggests that SCs areable to directly convert into HCs (i.e., to undergodirect transdifferentiation). If this were true, weshould be able to detect cells in the process ofconversion that possess features of both SCs andHCs, as has been demonstrated in the chicken BPafter in vivo HC damage (Cafaro et al. 2007). To testthis hypothesis, we labeled BPs that were cultured withstreptomycin for 3 days with antibodies to Sox2 or ß-tectorin precursor, both of which are selectivemarkers for SCs (Goodyear et al. 1996; Cafaro et al.2007; Daudet et al. 2009), and antibodies to Atoh1, anearly marker of differentiating HCs (Cafaro et al.2007). In these cultures, we indeed found examples ofcells that labeled for Atoh1 and either Sox2 or ß-tectorin precursor, suggestive of cells transferringfrom an SC to an HC state (Supplementary Fig. 2).
Collectively, our results demonstrate that a significantnumber of new HCs regenerated in vitro are formed bydirect transdifferentiation, a nonmitotic process. Theyalso show that HCs formed via direct transdifferentiationcould be functional, since they develop stereocilia andthey rapidly incorporate FM1-43.
Epithelial cells are reduced in numberafter aphidicolin treatment
Treatment with aphidicolin in cultures incubated withstreptomycin should result in depletion of SCsbecause (1) it prevents mitotic replacement of SCsthat directly transdifferentiate into HCs and (2) someSCs that enter S phase may undergo cell death. To testwhether SCs are in fact depleted in aphidicolin-treated BPs compared to DMSO controls, organs werecultured with streptomycin for 2 days followed by6 days without streptomycin. Organs were labeled forthe nuclear dye, propidium iodide, and the density ofnuclei in the middle region of the BP was calculated.
On average, BPs treated with 1% DMSO had 39.6±3.98 nuclei per 10,000 µm3, and BPs treated with 25 µMaphidicolin had 28.5±2.38 nuclei per 10,000 µm3
(pG0.001). This represents an approximate 28%decrease in HC and/or SC density in aphidicolin-treated BPs compared to DMSO controls. Based onthis analysis alone, we are unable to state whether thisdecrease represented fewer HCs, SCs, or both.
Aphidicolin-treated basilar papillae lack evidencefor cell death
Our finding that a few BrdU-labeled SCs were presentafter 3 days of treatment with aphidicolin but absentafter 8 days of treatment suggests that some cells thatenter the cell cycle in the presence of aphidicolin maydie and get extruded from the epithelium. To addressthis, organs were cultured with streptomycin for 3 daysand were treated with 25 µM aphidicolin for either 6or 24 h, with 1 µM BrdU present. Tissue was fixed andreacted to detect the TUNEL reaction, a marker ofdying cells. We found no evidence for increasedTUNEL-positive cells in aphidicolin-treated BPs rela-tive to controls (data not shown), although it ispossible that cell death occurred in a more rapid ordelayed manner than for which we tested.
DISCUSSION
Patterns of HC loss vary in controland streptomycin-treated cultures
Hair cells are highly susceptible to oxidative stress andto ototoxic agents, such as aminoglycoside antibioticslike streptomycin. In control cultures lacking strepto-mycin, substantial extrusion of HCs from the proximalBP was evident by 2 days in vitro; after this, HC lossspread toward the middle region. This was true fororgans cultured in DMEM or BME/EBSS. Similarresults were reported by Frenz et al. (1998) usingmedium 199 and by Oesterle et al. (1993) and Chenget al. (2003) using BME/EBSS. Spontaneous HC losswas likely caused by the explantation process ordeficiencies in culture conditions. HC death mightbe prevented by inhibiting molecules in the apoptoticpathway, such as caspases, as has been accomplishedin cultures of whole utricles from chickens (Matsui etal. 2002) and mice (Cunningham et al. 2002).
In cultures treated with streptomycin, clear evi-dence for HC loss was detected a day earlier than incontrol cultures. Acceleration of HC loss in culturedchicken BPs by aminoglycosides has been described inother studies (Frenz et al. 1998; Cheng et al. 2003).With 2-day streptomycin treatments, we first detectedHC loss in the middle BP (halfway between theproximal and distal tip), and it spread proximallyand distally over time, until complete HC loss wasseen around 3 days in vitro. This pattern was distinctfrom the proximal-to-distal gradient in HC loss seen
SHANG ET AL.: Hair Cell Regeneration In Vitro 219

in our control cultures or described after shorter invitro exposures with neomycin or gentamicin (Frenzet al. 1998; Cheng et al. 2003). A proximal-to-distalgradient more closely resembles what is seen in vivoafter systemic treatment with aminoglycosides, such asgentamicin (e.g., Hashino et al. 1991; Janas et al.1995). Experiments using brief (2-h) exposures dem-onstrated that these differences were not specific tostreptomycin. Rather, the odd pattern of HC loss seenwith 2-day exposures would appear to reflect adysregulation of normal ototoxicity mechanisms dueto the prolonged streptomycin treatment. Extendedexposure to streptomycin may offset normal druguptake mechanisms, and additional factors associatedwith culture conditions may bias middle HCs towardearlier extrusion. Despite these differences, a patternof complete HC loss has significant advantages formolecular analyses that require large amounts ofuniform starting tissue. It has additional advantagesfor studies addressing HC regeneration in general,since it eliminates the possibility that repair of injuredHCs could account for a return in HC number, whichhas been raised in other studies of drug-treated innerear epithelia (e.g., Gale et al. 2002).
Patterns of SC proliferation vary in controland streptomycin-treated cultures
In the posthatch avian BP, the SC population isnormally quiescent but reenters the cell cycle follow-ing HC damage (Ryals and Rubel 1988; Corwin andCotanche 1988; Raphael 1992; Hashino and Salvi1993; Stone and Cotanche 1994). Subsequently, post-mitotic cells differentiate into either HCs or SCs.Previous studies demonstrated that SCs from thechicken BP reenter the cell cycle in organ cultures(Oesterle et al. 1993; Navaratnam et al. 1996; Warcholand Corwin 1996) and in pure SC cultures (Stone et al.1996) followingHC loss. In this study, the distribution ofdividing SCs was different in streptomycin-treatedcultures than in control cultures. In control cultures,SC division was largely confined to the proximal end ofthe BP, while in streptomycin-treated cultures, SCsdivided throughout the BP. Further, significantly fewerdividing SCs were seen in control cultures than in drug-treated cultures. These differences generally reflectedthe different patterns and degrees of HC loss seen incontrol and drug-damaged organs. However, dividingSCs were focused in two stripes—along the neural andabneural edges—that did not reflect the widespread lossof HCs in a given region. A neural stripe of SC divisionwas described for the chicken BP after in vivo gentami-cin treatment (Cafaro et al. 2007), although thesignificance of this pattern is not understood. It isunclear if the abneural stripe of SC division is a cultureartifact or a normal phenomenon that is amplified by
culture conditions. This pattern was similar in culturesgrown in the absence of serum, suggesting that it is notcontrolled by components present in serum.
Culture media also influenced the pattern of SCdivision in both control and drug-treated cultures. BPscultured in BME/EBSS consistently showed less totalBrdU uptake than BPs cultured in DMEMwithmatchingserum concentration. In addition, while SC division wasevident in the abneural region in both media types,substantial cell division in the neural region was onlynoted in BPs cultured in DMEM. These findings suggestthat BME/EBSS lacks a component that promotes orpermits SC division in the neural region. Seruminhibited SC division at the highest concentration usedin this study—10%. SC division and HC regenerationwere robust in serum-free cultures, similar to what hasbeen described for avian vestibular SC cultures (Warcholand Corwin 1993). This property enables the use ofdefined media for future studies.
Hair cells are regenerated by mitoticand nonmitotic means
Many HCs were regenerated in streptomycin-treatedBPs after 8 days in culture, but the majority of newHCs were not labeled for BrdU despite its continualpresence in culture. Significant numbers of new HCswere regenerated when SC division was blocked, andthere was an accompanying decrease in cell density inthe BP. These observations suggest many HCs wereregenerated by direct transdifferentiation, duringwhich an SC converts phenotypically into an HCwithout dividing. Further evidence for this phenom-enon, which was proposed in the mid-1990s (Baird et al.1996; Adler and Raphael 1996; Roberson et al. 1996),was recently provided by the observation that SCsupregulate the HC-specific protein Atoh1 shortly afterHC damage is initiated in chickens in vivo (Cafaro et al.2007). We provide additional evidence for “transitional”cells here. However, it remains possible that some newHCs arise from migration of precursor cells fromnonsensory regions into the region containing HCsand SCs. Cotanche et al. (1995) showed that hyalinecells, which are located outside the BP along its abneuraledge, migrated into the BP following extreme noisedamage, but these cells did not differentiate into newHCs. Hyaline cells, or some other as-of-yet identifiedpopulation of epithelial cells located outside the BP,maycontribute to the formation of some newHCs after drugdamage.
It was somewhat surprising that most HCs regen-erated after 8 days in culture lacked BrdU labeling.This may occur because HCs formed by mitosisemerge and differentiate later in culture than thoseformed by direct transdifferentiation. In support ofthis, we found that BrdU-negative HCs appeared more
220 SHANG ET AL.: Hair Cell Regeneration In Vitro

highly differentiated (had developed stereociliarybundles) at 8 days than BrdU-positive HCs. In addition,during in vivo avian auditory HC regeneration, directtransdifferentiation precedes cell division by 24–48 h(Roberson et al. 2004; Cafaro et al. 2007). Alternativeexplanations for these findings are that differentiationof postmitotic cells into HCs is delayed in culture and/or that incorporated BrdU specifically delays orinhibits HC differentiation. In support of this latterpossibility, we found that relatively high concentrationsof BrdU inhibit differentiation of myosinVI immunor-eactivity in HCs, in a dose-dependent manner. Asimilar finding has been reported in other tissue types(e.g., Levitt and Dorfman 1972; Tapscott et al. 1989).The mechanism by which BrdU suppresses cellulardifferentiation is not well understood. BrdU treatmenthas early effects on gene transcription (e.g., Minagawaet al. 2004), and inhibition of key regulatory geneswould have a profound effect on differentiation of somecellular features (e.g., Tapscott et al. 1989).
We have shown that higher BrdU concentrationsare more effective reporters of SC division than lowerconcentrations, yet they inhibit HC differentiation.These findings demonstrate that BrdU is a flawed toolfor quantifying HC differentiation and cellular pro-liferation in a single experiment. Therefore, toaccurately determine the relative contributions ofmitotic regeneration and direct transdifferentiationto HC regeneration, different measures of cell divi-sion or differentiation must be selected.
Contribution of direct transdifferentiation towardmorphological and functional recovery
Basilar papillae in which SC division was blockedformed fewer new HCs than BPs in which SC divisionoccurred freely. This suggests that the rate of directtransdifferentiation could not be increased so as tomaintain the rate of HC regeneration at normal levelsand that SC division was also required. A 28%depletion of epithelial cells accompanied HC regen-eration in the absence of SC division, which may beone factor preventing a compensatory increase indirect transdifferentiation. Nonetheless, HCs regen-erated by direct transdifferentiation showed advancedsigns of maturation, including development of stereo-ciliary bundles and rapid uptake of FM1-43, suggest-ing that they likely contribute significantly tofunctional recovery. Although this has not been testedin live chickens, a study by Izumikawa et al. (2005)supports this interpretation. Misexpression of atoh1 inSCs of the damaged organ of Corti in mature guineapigs appears to trigger the reappearance of HCsinside and outside the organ of Corti, independentof SC division, and to a partial recovery of auditorythresholds compared to control mice.
Summary
Media type, streptomycin treatment, and serum con-centration have significant effects on SC division inthe chicken BP in organotypic cultures. Large num-bers of new HCs are formed and reach advancedstages of differentiation in streptomycin-treated cul-tures, demonstrating that this culture method is wellsuited to study factors regulating avian HC regener-ation. However, an important caveat to consider isthat high concentrations of BrdU inhibit differentia-tion of new HCs. Large numbers of HCs areregenerated in streptomycin-treated cultures despiteblockade of SC division, demonstrating that directtransdifferentiation is a significant mechanism of newHC production in the injured BP.
ACKNOWLEDGMENTS
We would like to thank Glen MacDonald for assistance withimaging and quantitative analyses, Kevin Whitham andBrandon Warren for assistance with computing, and Dr.Edwin Rubel for sharing laboratory facilities. We areappreciative of Drs. Jane Johnson (Southwestern TexasMedical University) and Guy Richardson (University ofSussex) for sharing antibodies to Atoh1 and HCA, respec-tively. We are also thankful toward Drs. Elizabeth Oesterleand Allison Coffin (at the UWA) for critical comments onthe manuscript. This work was supported by the Otolaryn-gology/Head and Neck Surgery Department and theVirginia Merrill Bloedel Hearing Research Center at theUWA, NIDCD grants DC03696 (R01) and DC04661 (P30),NICHD grant HD002274 (P30), the Deafness ResearchFoundation, the National Organization for HearingResearch, and the Hearing Regeneration Initiative.
REFERENCES
ADLER HJ, RAPHAEL Y (1996) New hair cells arise from supporting cellconversion in the acoustically damaged chick inner ear. Neuro-sci Lett 205:17–20
ADLER HJ, KOMEDA M, RAPHAEL Y (1997) Further evidence forsupporting cell conversion in the damaged avian basilar papilla.Int J Dev Neurosci 15:375-385
BAIRD RA, STEYGER PS, SCHUFF N (1996) Mitotic and nonmitotic haircell regeneration in the bullfrog vestibular otolith organs. Ann NY Acad Sci 781:59–70
BAIRD RA, BURTON MD, FASHENA DS, NAEGER RA (2000) Hair cellrecovery in mitotically blocked cultures of the bullfrog saccule.Proc Natl Acad Sci USA 97:11722–11729
BARTOLAMI S, GOODYEAR R, RICHARDSON G (1991) Appearance anddistribution of the 275 kD hair-cell antigen during developmentof the avian inner ear. J Comp Neurol 314:777–788
BERMINGHAM-MCDONOGH O, RUBEL EW (2003) Hair cell regeneration:winging our way towards a sound future. Curr Opin Neurobiol13:119–126
BHAVE SA, STONE JS, RUBEL EW, COLTRERA MD (1995) Cell cycleprogression in gentamicin-damaged avian cochleas. J Neurosci15:4618–4628
SHANG ET AL.: Hair Cell Regeneration In Vitro 221

BHAVE SA, OESTERLE EC, COLTRERA MD (1998) Macrophage andmicroglia-like cells in the avian inner ear. J Comp Neurol398:241–256
CAFARO J, LEE GS, STONE JS (2007) Atoh1 expression definesactivated progenitors and differentiating hair cells during avianhair cell regeneration. Dev Dyn 236:156–170
CHENG AG, CUNNINGHAM LL, RUBEL EW (2003) Hair cell death in theavian basilar papilla: characterization of the in vitro model andcaspase activation. J Assoc Res Otolaryngol 4:91–105
CORWIN JT, COTANCHE DA (1988) Regeneration of sensory hair cellsafter acoustic trauma. Science 240:1772–1774
COTANCHE DA, MESSANA EP, OFSIE MS (1995) Migration of hyalinecells into the chick basilar papilla during severe noise damage.Hear Res 9:148–159
CUNNINGHAM LL, CHENG AG, RUBEL EW (2002) Caspase activation inhair cells of the mouse utricle exposed to neomycin. J Neurosci22:8532–8540
DAUDET N, GIBSON R, SHANG J, BERNARD A, LEWIS J, STONE J (2009) Notchregulation of progenitor cell behavior in quiescent and regeneratingauditory epithelium of mature birds. Dev Biol 326:86–100
DUNCAN LJ, MANGIARDI DA, MATSUI JI, ANDERSON JK, MCLAUGHLIN-WILLIAMSON K, COTANCHE DA (2006) Differential expression ofunconventional myosins in apoptotic and regenerating chickhair cells confirms two regeneration mechanisms. J CompNeurol 499:691–701
FRENZ DA, YOO H, LIU W (1998) Basilar papilla explants: a model tostudy hair cell regeneration-repair and protection. Acta Otolar-yngol 118:651–659
GALE JE, MARCOTTI W, KENNEDY HJ, KROS CJ, RICHARDSON GP (2001)FM1-43 dye behaves as a permeant blocker of the hair-cellmechanotransducer channel. J Neurosci 21:7013–7025
GALE JE, MEYERS JR, PERIASAMY A, CORWIN JT (2002) Survival ofbundleless hair cells and subsequent bundle replacement in thebullfrog’s saccule. J Neurobiol 50:81–92
GÉLÉOC GS, HOLT JR (2003) Developmental acquisition of sensorytransduction in hair cells of the mouse inner ear. Nat Neurosci6:1019–1020
GOODYEAR R, RICHARDSON G (1997) Pattern formation in the basilarpapilla: evidence for cell rearrangement. J Neurosci 17:6289–6301
GOODYEAR R, KILLICK R, LEGAN PK, RICHARDSON GP (1996) Distribu-tion of beta-tectorin mRNA in the early posthatch and develop-ing avian inner ear. Hear Res 96:167–178
GRATZNER HG (1982) Monoclonal antibody to 5-bromo- and 5-iododeoxyuridine: a new reagent for detection of DNA repli-cation. Science 218:474–475
HASHINO E, SALVI R (1993) Changing patterns of DNA replication inthe noise-damaged chick cochlea. J Cell Science 105:23–31
HASHINO E, TANAKA Y, SOKABE M (1991) Hair cell damage andrecovery following chronic application of kanamycin in thechick cochlea. Hear Res 52:356–368
IZUMIKAWA M, MINODA R, KAWAMOTO K, ABRASHKIN KA, SWIDERSKI DL,DOLAN DF, BROUGH DE, RAPHAEL Y (2005) Auditory hair cellreplacement and hearing improvement by Atoh1 gene therapyin deaf mammals. Nat Med 11:271–276
JANAS JD, COTANCHE DA, RUBEL EW (1995) Avian cochlear hair cellregeneration: stereological analyses of damage and recovery from asingle high dose of gentamicin. Hear Res 92:17–29
LEVITT D, DORFMAN A (1972) The irreversible inhibition of differ-entiation of limb-bud mesenchyme by bromodeoxyuridine. ProcNatl Acad Sci USA 69:1253–1257
LIPPE WR, WESTBROOK EW, RYALS BM (1991) Hair cell regeneration inthe chicken cochlea following aminoglycoside toxicity. Hear Res56:203–210
MANGIARDI DA, MCLAUGHLIN-WILLIAMSON K, MAY KE, MESSANA EP,MOUNTAIN DC, COTANCHE DA (2004) Progression of hair cell
ejection and molecular markers of apoptosis in the avian cochleafollowing gentamicin treatment. J Comp Neurol 475:1–18
MATSUI JI, OGILVIE JM, WARCHOL ME (2002) Inhibition of caspasesprevents ototoxic and ongoing hair cell death. J Neurosci22:1218–1227
MEYERS JR, MACDONALD RB, DUGGAN A, LENZI D, STANDAERT DG,CORWIN JT, COREY DP (2003) Lighting up the senses: FM1-43loading of sensory cells through nonselective ion channels. JNeurosci 23:4054–4065
MINAGAWA S, NAKABAYASHI K, FUJII M, SCHERER SW, AYUSAWA D (2004)Functional and chromosomal clustering of genes responsive to5-bromodeoxyuridine in human cells. Exp Gerontol 39:1069–1078
MOREST DK, COTANCHE DA (2004) Regeneration of the inner ear as amodel of neural plasticity. J Neurosci Res 78:455–460
NAVARATNAM DS, SU HS, SCOTT SP, OBERHOLTZER JC (1996) Proliferationin the auditory receptor epithelium mediated by a cyclic AMP-dependent signaling pathway. Nat Med 2: 1136–1139
OESTERLE EC, TSUE TT, REH TA, RUBEL EW (1993) Hair-cellregeneration in organ cultures of the postnatal chicken innerear. Hear Res 70:85–108
PEDRALI-NOY G, SPADARI S, MILLER-FAURÈS A, MILLER AO, KRUPPA J,KOCH G (1980) Synchronization of HeLa cell cultures byinhibition of DNA polymerase alpha with aphidicolin. NucleicAcids Res 8:377–387
RAPHAEL Y (1992) Evidence for supporting cell mitosis in response toacoustic trauma in the avian inner ear. J Neurocytol 21:663–671
ROBERSON DW, KREIG CS, RUBEL EW (1996) Light microscopicevidence that direct transdifferentiation gives rise to new haircells in regenerating avian auditory epithelium. Aud Neuro-science 2:195–205
ROBERSON DW, ALOSI JA, COTANCHE DA (2004) Direct transdiffer-entiation gives rise to the earliest new hair cells in regeneratingavian auditory epithelium. J Neurosci Res 78:461–471
RYALS BM, RUBEL EW (1988) Hair cell regeneration after acoustictrauma in adult Coturnix quail. Science 240:1774–1776
SI F, BRODIE H, GILLESPIE PG, VAZQUEZ AE, YAMOAH EN (2003)Developmental assembly of transduction apparatus in chickbasilar papilla. J Neurosci 23:10815–10826
STONE JS, COTANCHE DA (1994) Identification of the timing of Sphase and the patterns of cell proliferation during hair cellregeneration in the chick cochlea. J Comp Neurol 341:50–67
STONE JS, COTANCHE DA (2007) Hair cell regeneration in the avianauditory epithelium. Int J Dev Biol 51:633–647
STONE JS, RUBEL EW (2000) Temporal, spatial, and morphologicfeatures of hair cell regeneration in the avian basilar papilla. JComp Neurol 417:1–16
STONE JS, LEAÑO SG, BAKER LP, RUBEL EW (1996) Hair cell differ-entiation in chick cochlear epithelium after aminoglycosidetoxicity: in vivo and in vitro observations. J Neurosci 16:6157–6174
STONE JS, CHOI YS, WOOLLEY SM, YAMASHITA H, RUBEL EW (1999)Progenitor cell cycling during hair cell regeneration in the vestibularand auditory epithelia of the chick. J Neurocytol 28:863–876
TAPSCOTT SJ, LASSAR AB, DAVIS RL, WEINTRAUB H (1989) 5-Bromo-2′-deoxyuridine blocks myogenesis by extinguishing expression ofMyoD1. Science 245:532–536
TAYLOR RR, FORGE A (2005) Hair cell regeneration in sensoryepithelia from the inner ear of a urodele amphibian. J CompNeurol 484:105–120
WARCHOL ME, CORWIN JT (1993) Supporting cells in avian vestibularorgans proliferate in serum-free culture. Hear Res 71:28–36
WARCHOL ME, CORWIN JT (1996) Regenerative proliferation in organcultures of the avian cochlea: identification of the initialprogenitors and determination of the latency of the proliferativeresponse. J Neurosci 16:5466–5477
222 SHANG ET AL.: Hair Cell Regeneration In Vitro