journal of structural geology - programs in geology
TRANSCRIPT

Magnitude of weakening during crustal-scale shear zone development
Christopher Gerbi a,*, Nicholas Culshaw b,1, Jeffrey Marsh a,2
aDepartment of Earth Sciences, University of Maine, Orono, ME 04469, United StatesbDepartment of Earth Sciences, Dalhousie University, Halifax B3H 3J5, Canada
a r t i c l e i n f o
Article history:Received 17 January 2009Received in revised form4 September 2009Accepted 5 October 2009Available online 13 October 2009
Keywords:Shear zoneStrain weakeningGrenville ProvinceRheology
a b s t r a c t
We describe and apply a field-based approach for calculating the bulk strength of a heterogeneousmaterial to a crustal-scale shear zone defining the margin of the Ma Parry Sound domain in the GrenvilleProvince of southeastern Ontario. Using a numerical method, we calculate bulk strength, defined aseffective viscosity, as the ratio between the surface traction needed to deform a square block in simpleshear and the velocity gradient across that block. We use natural shear zone geometries to define theinternal block structure and assign internal relative viscosities based primarily on textural criteria. Themargin of the Parry Sound domain developed into the km-scale Twelve Mile Bay shear zone, accom-modating several tens of km of transport, while the domain interior remained rigid. Fracturing and fluidinfiltration drove development of an amphibolite facies meter-scale shear zone network that evolvedinto the Twelve Mile Bay structure. We analyzed three sites across the w5 km-wide strain gradient fromnear the granulitic domain to the large scale shear zone. The rocks at the shear zone margin weakened byapproximately 30%. Those in the core weakened by at least 77% and probably by an order of magnitude.These values lie between but differ substantively from the isostress and isostrain-rate bounds, indicatingthat a numerical approach such as presented here markedly improves the accuracy of bulk strengthcalculations.
� 2009 Elsevier Ltd. All rights reserved.
1. Introduction
Spatial and temporal strength variation throughout the crustinfluences geodynamic processes as disparate as orogenic topo-graphic evolution (e.g., Dahlen et al., 1984; Beaumont et al., 2001;Groome et al., 2008) and post-glacial rebound (Larsen et al., 2005;Wu and Mazzotti, 2007). In addition, and more directly, strengthvariation affects or controls the strain distribution in a region. Ourunderstanding of crustal strength derives in large part from threesources: experimental deformation, geodesy, and numerical andanalogue modeling. From these sources, some general pictures ofcrustal strength emerge (e.g., Kohlstedt et al., 1995; Handy et al.,2007; Burgmann and Dresen, 2008), but considerable uncertaintyremains about the rheological structure in natural orogens (cf., forexample, Jackson, 2002; Handy and Brun, 2004). Complicatinga general description of rheological structure, processes such asmetamorphism, melting and magma migration, fluid infiltration,and deformation all operate during orogenesis. Experimental and
theoretical studies can constrain the rheological effects of some ofthese processes, but thorough understanding requires field-basedinvestigation of synorogenic strength changes. In this contribution,we employ a numerical method for calculating bulk strength basedon natural structures, documenting an effective viscosity drop ofapproximately an order of magnitude at the margins of a granuliticdomain where it developed into an upper amphibolite facies km-scale shear zone. Interpretations of spatial strength variation exist(e.g., Houseman et al., 2008), but we are not aware of any field-based study documenting the temporal strength change associatedwith the development of a shear zone network.
2. Background
2.1. Controls on and calculations of rock strength
Rock strength follows many definitions depending on thematerial type (e.g., viscous, plastic, elastic, and combinationsthereof). We frame this study around mechanics in the middle andlower orogenic crust, well below the frictional–viscous transition,so we define strength as effective viscosity: the instantaneous ratiobetween stress and strain rate. The dominant factors controlling thebulk effective viscosity of a rock include mineralogy, phase or unitgeometry (e.g., Handy, 1990, 1994; Ji, 2004; Takeda and Griera,
* Corresponding author. Tel.: þ1 207 581 2153; fax: þ1 207 581 2022.E-mail addresses: [email protected] (C. Gerbi), [email protected]
(N. Culshaw), [email protected] (J. Marsh).1 Tel.: þ1 902 494 3501.2 Tel.: þ1 207 581 2221.
Contents lists available at ScienceDirect
Journal of Structural Geology
journal homepage: www.elsevier .com/locate/ jsg
0191-8141/$ – see front matter � 2009 Elsevier Ltd. All rights reserved.doi:10.1016/j.jsg.2009.10.002
Journal of Structural Geology 32 (2010) 107–117

2006), fluid and/or melt content (e.g., Holl et al., 1997; Brown andSolar, 2000; Evans, 2005; Rosenberg and Handy, 2005), andtemperature. In general, weaker minerals, a higher degree of weak-phase interconnectivity, higher fluid or melt content, and highertemperatures reduce strength.
The strength of polyphase materials lies between the isostress(Reuss, 1929) and isostrain-rate (Voigt, 1928) bounds (e.g., Handy,1990, 1994; Handy et al., 1999; Tullis et al., 1991; Bons and Urai,1994; Ji, 2004). The former describes a state in which all phasesexperience the same stress, usually associated with strong inclu-sions in a softer matrix. The latter describes a state in which allphases deform at the same rate, usually associated with softinclusions in a stronger matrix. Handy (1990) described two char-acteristic microstructures for ductilely deforming polyphase rocks:a load-bearing framework and interconnected weak layers. Thelatter is markedly weaker, lying close to the isostress bound, andcan be stable at high strain. A load-bearing framework is stronger,lying near the isostrain-rate bound, but generally unstable and canevolve into the geometrically more stable interconnected weaklayer geometry either mechanically (Handy, 1994; Lonka et al.,1998; Handy et al., 1999), or with the presence of even a smallpercentage of melt (Rosenberg and Handy, 2005). Calculation of thetheoretical isostress and isostrain-rate bounds simply requiresknowledge of the strengths of the individual phases and theirvolume fraction; these bounding definitions take no explicitaccount of the phase distribution. But because the phase distribu-tion controls where between the strength bounds the bulk strengthlies, it is a fundamental determinant of rock strength. Ji (2004)modified the isostress and isostrain-rate formulations to includea parameter, J, to account for the phase geometry. Similarly, Bonsand Urai (1994) suggested that the distance between the bounds isproportionally constant, relative to volume fraction, for a givenmicrostructure that they defined as related to the percolationthreshold. Unfortunately, no robust a priorimethod exists to deriveeither J or the percolation threshold for complex natural structures,limiting the value of those approximations. Treagus (2002) calcu-lated the bulk viscosity of two-phase mixtures with various ideal-ized geometries based on conglomerates and concluded that bothvolume fraction and shape fabric are critical controls on theaggregate strength. Her results, however, which are based on aninclusion-matrix structure, do not directly apply to more generalstructural geometries in naturally deformed rocks. Tullis et al.(1991) developed a numerical approach to calculate bulk flowproperties based on digitizing the phase or unit distribution andproviding a flow law for each component. Their approach workswell if the individual flow laws are well-characterized, but it is alsoa time-consuming methodology. To date, analytical approaches tocalculating bulk rock strength are too imprecise for most situations,which therefore require a numerical approach such as used byTullis et al. (1991) or the one described below. Both numerical andanalytical approaches require knowing the individual phase prop-erties accurately.
2.2. Magnitude of weakening
Rocks canweaken either uniformly or through the developmentof localized high strain zones. Both mechanisms can develop forsimilar reasons, but local feedback and rate relationships influencewhich dominates at which scale. In the upper crust, faults appear tobe up to five to ten times weaker than their host rocks (Zoback,2000). Rutter (1999) has postulated up to a 50% decrease instrength at the regional scale due to shear zone development.Parallel to the factors that control rock strength, the dominantfactors that affect the degree of strength change include meta-morphic reactions (e.g., Rubie, 1983; Wintsch et al., 1995; Groome
et al., 2006; Upton and Craw, 2008), structural or textural evolution(e.g., Handy, 1994; Johnson et al., 2004), fluid flux, melting, andtemperature changes. Of these factors, melting induces the greateststrength change, as melt viscosities may be up to 14 orders ofmagnitude lower than their solid counterparts (Cruden, 1990;Pinkerton and Stevenson, 1992). During most tectonism, thestrength drop is significantly less, as the deforming rocks wouldlikely host only a small melt percentage, but still could be morethan an order of magnitude (Rosenberg and Handy, 2005).
Using the strengths of the constituent phases in addition toanalytical flow laws generated for polyphase materials andmylonites (e.g., Jordan, 1987; Hueckel et al., 1994; Handy, 1994;Handy et al., 1999; Treagus, 2002; Ji et al., 2004), some studiesestimate the strength change during shear zone formation, butwith little direct application to natural systems. For example, basedon the analytical equations of Handy et al. (1999), an analysis byPark et al. (2006) implies strength drops of approximately 25% and70% for nonmica- and mica-bearing weak layers, respectively.Modeling viscoelastic deformation of strong- and weak-phaseinterconnected geometries, Takeda and Griera (2006) track changesin bulk effective viscosity in a shearing model block. They calculatelittle weakening inmodels inwhich the initial structure includes aninterconnected weak layer. Weakening up to 50% occurs asa strong-phase-supporting framework evolves towards highlyelongate weak layers.
Experimental studies provide more robust quantitative data buttrade that improvement for greater extrapolations to naturalconditions and larger scales and therefore greater uncertaintyunder those conditions. Experiments investigating strain weak-ening (e.g., Jordan, 1987; Dell’Angelo and Tullis, 1996; Ross andWilks, 1996; Rybacki et al., 2003; Dimanov and Dresen, 2005;Bystricky et al., 2006; Holyoke and Tullis, 2006) have produceda range of results. For example, deformation of an orthopyroxenegranulite (Ross and Wilks, 1996) and an aplite (Dell’Angelo andTullis, 1996) yielded a range of 15–50% weakening between theoriginal material and the development of quasi-steady-state flow.To evaluate the role of developing an interconnected weak layerfrom a load-bearing framework, Holyoke and Tullis (2006)deformed a quartzofeldspathic gneiss and observed strength dropsof 30–60%. The degree of strength drop varied with temperatureand strain rate.
2.3. Geologic setting
The southwestern Canadian Grenville Province (Fig.1), along theshores of Georgian Bay in Lake Huron, represents the deeply eroded(to depths equivalent to w1.0–1.3 GPa) roots of an orogenic beltwith a size and tectonometamorphic history comparable to themodern Himalayan orogen. In the Georgian Bay region, km-scaleshear zones separate lithotectonic domains within the allochtho-nous portion of the orogen (Culshaw et al., 1997, 2004). The Gren-ville orogen formed between approximately 1190 Ma and 980 Ma(Rivers, 1997) and consists of a complex arrangement of tectonicblocks along its several thousand kilometers of length. The ParrySound domain, which lies within the Central Gneiss Belt of Ontario,comprises metasediments, arc-related mafic through felsicorthogneisses, and anorthosite originally formed ca. 1400–1160 Ma(Culshaw et al., 1997). Internal assembly of the tectonic stratigraphyin the Parry Sound domain and associated granulite facies meta-morphism occurred ca. 1160 Ma (van Breeman et al., 1986; Wodickaet al., 2000). The Parry Sound domain as a whole is an allochtho-nous nappe and was emplaced along the kms-wide Twelve MileBay shear zone (Davidson et al., 1982; Davidson, 1984; Culshawet al., 1997) in probably two stages, with the second stage as late as1050 Ma (Krogh and Kwok, 2005).
C. Gerbi et al. / Journal of Structural Geology 32 (2010) 107–117108

This emplacement caused the development of widespreadoutcrop-scale shear zones along the domain margins. The shearzones developed in conjunction with a retrograde transition fromgranulite to upper amphibolite facies assemblages (Wodicka et al.,2000; Culshaw et al., 2004; Culshaw and Gerbi, 2009). The trans-formation progresses from relict granulite facies textures and
mineralogy in the center of the domain to fully transposed gneiss ofthe Twelve Mile Bay shear zone at the contact with the underlyingGo Home domain. The progressive weakening occurs in thefollowing sequence (Fig. 2): (1) Due to high fluid pressure, thegranulite facies orthogneisses developed fractures, which filledwith pegmatites and fluids. (2) Fluids derived from the fractures
Fig. 1. Geology of study area. (a) The Grenville orogen in eastern North America. Box marks B. (b) Domains of the Central Gneiss Belt germane to this study. Box marks C. (c) Geologicmap of the southwestern Parry Sound domain and adjacent domains. After Culshaw and Gerbi (2009). M, D, B – Matches, Dogleg, and Boomerang Islands. Shawanaga domain: oS,sS, dS – Ojibway and Sand Bay gneiss associations, Dillion schist. Parry Sound domain: bPS, iPS, tPS, tp – basal, interior Parry Sound domains, Twelve Mile Bay assemblage, andtransposed gneiss derived from Parry sound domain (Culshaw and Gerbi, 2009). Moon River domain: bKMR, MRi1-i2 – Blackstone gneiss association, interior subdivisions of MoonRiver domain. Go Home domain: uGH, lGH – upper, lower divisions. lPSSZ – lithological boundary within lower strand of Parry Sound shear zone. uPSSZ – lithological boundary atupper margin of upper strand of Pasrry Sound shear zone. TMBSZ – Twelve Mile Bay shear zone. PB – inboard margin of transposed gneiss. RRB – boundary of substantialretrogression in Parry Sound domain. Gray shaded areas represent anorthosite.
C. Gerbi et al. / Journal of Structural Geology 32 (2010) 107–117 109
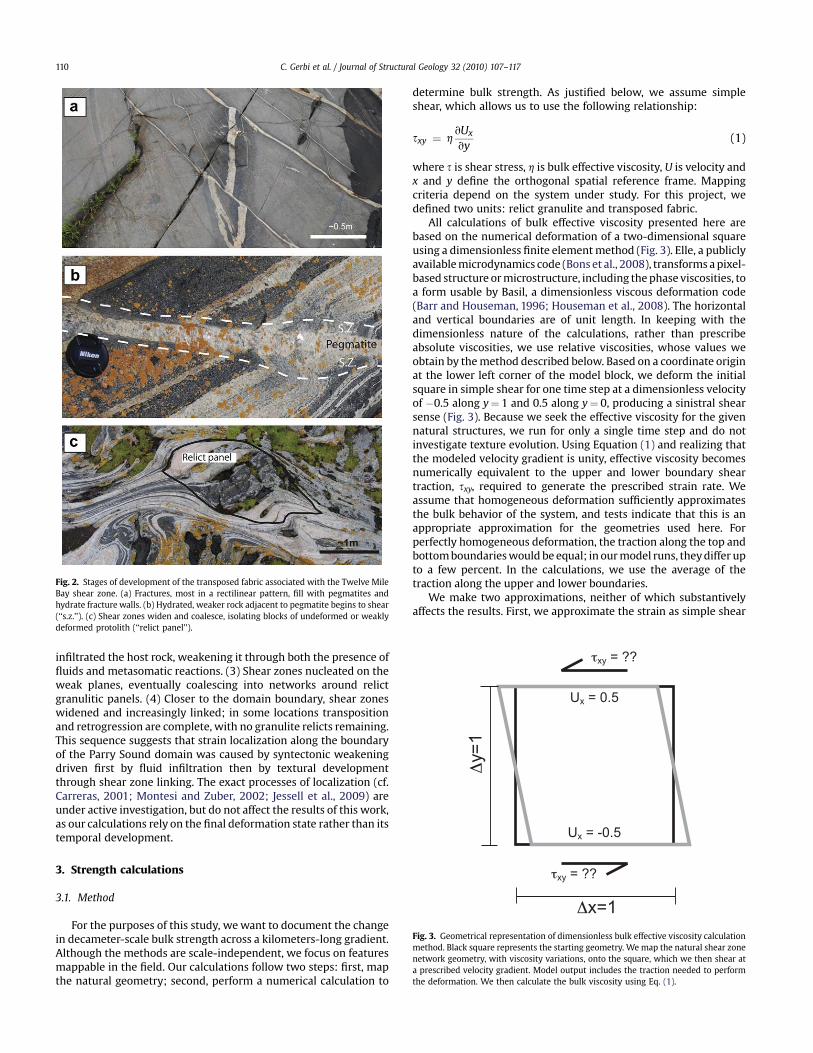
infiltrated the host rock, weakening it through both the presence offluids and metasomatic reactions. (3) Shear zones nucleated on theweak planes, eventually coalescing into networks around relictgranulitic panels. (4) Closer to the domain boundary, shear zoneswidened and increasingly linked; in some locations transpositionand retrogression are complete, with no granulite relicts remaining.This sequence suggests that strain localization along the boundaryof the Parry Sound domain was caused by syntectonic weakeningdriven first by fluid infiltration then by textural developmentthrough shear zone linking. The exact processes of localization (cf.Carreras, 2001; Montesi and Zuber, 2002; Jessell et al., 2009) areunder active investigation, but do not affect the results of this work,as our calculations rely on the final deformation state rather than itstemporal development.
3. Strength calculations
3.1. Method
For the purposes of this study, wewant to document the changein decameter-scale bulk strength across a kilometers-long gradient.Although the methods are scale-independent, we focus on featuresmappable in the field. Our calculations follow two steps: first, mapthe natural geometry; second, perform a numerical calculation to
determine bulk strength. As justified below, we assume simpleshear, which allows us to use the following relationship:
sxy ¼ hvUx
vy(1)
where s is shear stress, h is bulk effective viscosity, U is velocity andx and y define the orthogonal spatial reference frame. Mappingcriteria depend on the system under study. For this project, wedefined two units: relict granulite and transposed fabric.
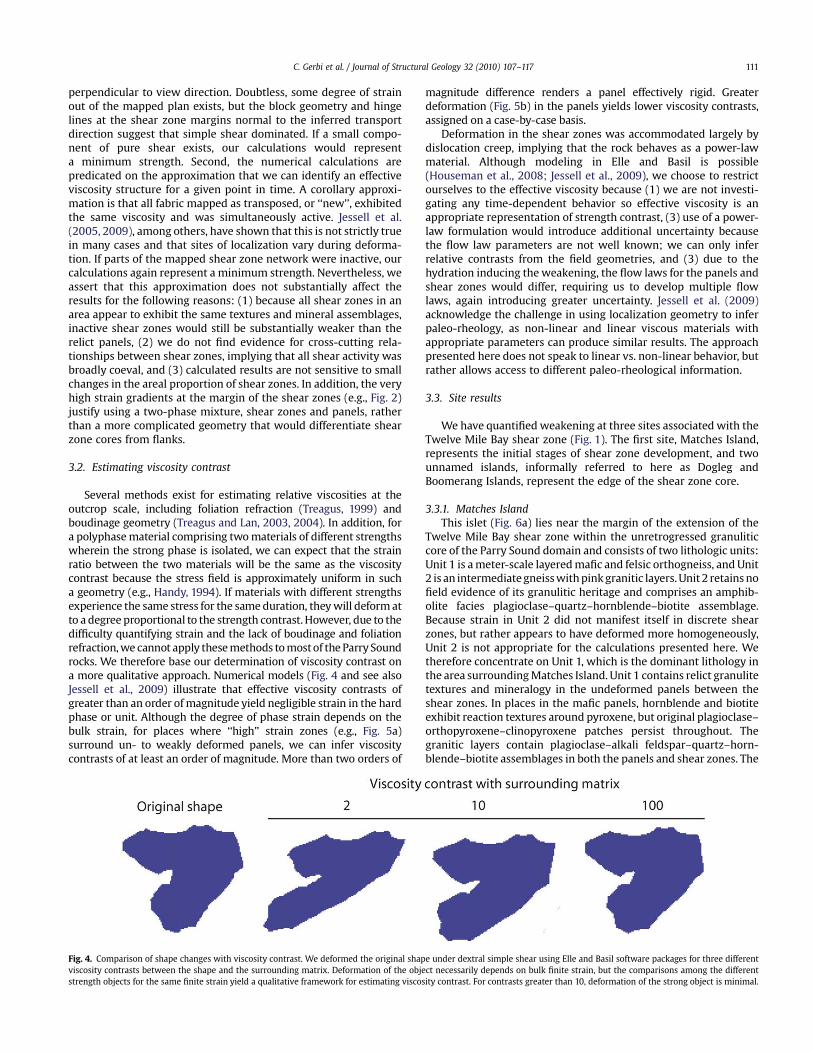
All calculations of bulk effective viscosity presented here arebased on the numerical deformation of a two-dimensional squareusing a dimensionless finite elementmethod (Fig. 3). Elle, a publiclyavailablemicrodynamics code (Bons et al., 2008), transforms apixel-based structure ormicrostructure, including thephase viscosities, toa form usable by Basil, a dimensionless viscous deformation code(Barr and Houseman, 1996; Houseman et al., 2008). The horizontaland vertical boundaries are of unit length. In keeping with thedimensionless nature of the calculations, rather than prescribeabsolute viscosities, we use relative viscosities, whose values weobtain by themethod described below. Based on a coordinate originat the lower left corner of the model block, we deform the initialsquare in simple shear for one time step at a dimensionless velocityof �0.5 along y¼ 1 and 0.5 along y¼ 0, producing a sinistral shearsense (Fig. 3). Because we seek the effective viscosity for the givennatural structures, we run for only a single time step and do notinvestigate texture evolution. Using Equation (1) and realizing thatthe modeled velocity gradient is unity, effective viscosity becomesnumerically equivalent to the upper and lower boundary sheartraction, sxy, required to generate the prescribed strain rate. Weassume that homogeneous deformation sufficiently approximatesthe bulk behavior of the system, and tests indicate that this is anappropriate approximation for the geometries used here. Forperfectly homogeneous deformation, the traction along the top andbottomboundarieswould be equal; in ourmodel runs, theydiffer upto a few percent. In the calculations, we use the average of thetraction along the upper and lower boundaries.
We make two approximations, neither of which substantivelyaffects the results. First, we approximate the strain as simple shear
Fig. 2. Stages of development of the transposed fabric associated with the Twelve MileBay shear zone. (a) Fractures, most in a rectilinear pattern, fill with pegmatites andhydrate fracture walls. (b) Hydrated, weaker rock adjacent to pegmatite begins to shear(‘‘s.z.’’). (c) Shear zones widen and coalesce, isolating blocks of undeformed or weaklydeformed protolith (‘‘relict panel’’).
Ux = 0.5
Ux = -0.5
xy = ??
xy = ??
1=y
x=1Fig. 3. Geometrical representation of dimensionless bulk effective viscosity calculationmethod. Black square represents the starting geometry. We map the natural shear zonenetwork geometry, with viscosity variations, onto the square, which we then shear ata prescribed velocity gradient. Model output includes the traction needed to performthe deformation. We then calculate the bulk viscosity using Eq. (1).
C. Gerbi et al. / Journal of Structural Geology 32 (2010) 107–117110
perpendicular to view direction. Doubtless, some degree of strainout of the mapped plan exists, but the block geometry and hingelines at the shear zone margins normal to the inferred transportdirection suggest that simple shear dominated. If a small compo-nent of pure shear exists, our calculations would representa minimum strength. Second, the numerical calculations arepredicated on the approximation that we can identify an effectiveviscosity structure for a given point in time. A corollary approxi-mation is that all fabric mapped as transposed, or ‘‘new’’, exhibitedthe same viscosity and was simultaneously active. Jessell et al.(2005, 2009), among others, have shown that this is not strictly truein many cases and that sites of localization vary during deforma-tion. If parts of the mapped shear zone network were inactive, ourcalculations again represent a minimum strength. Nevertheless, weassert that this approximation does not substantially affect theresults for the following reasons: (1) because all shear zones in anarea appear to exhibit the same textures and mineral assemblages,inactive shear zones would still be substantially weaker than therelict panels, (2) we do not find evidence for cross-cutting rela-tionships between shear zones, implying that all shear activity wasbroadly coeval, and (3) calculated results are not sensitive to smallchanges in the areal proportion of shear zones. In addition, the veryhigh strain gradients at the margin of the shear zones (e.g., Fig. 2)justify using a two-phase mixture, shear zones and panels, ratherthan a more complicated geometry that would differentiate shearzone cores from flanks.
3.2. Estimating viscosity contrast
Several methods exist for estimating relative viscosities at theoutcrop scale, including foliation refraction (Treagus, 1999) andboudinage geometry (Treagus and Lan, 2003, 2004). In addition, fora polyphasematerial comprising twomaterials of different strengthswherein the strong phase is isolated, we can expect that the strainratio between the two materials will be the same as the viscositycontrast because the stress field is approximately uniform in sucha geometry (e.g., Handy, 1994). If materials with different strengthsexperience the same stress for the sameduration, theywill deformatto a degree proportional to the strength contrast. However, due to thedifficulty quantifying strain and the lack of boudinage and foliationrefraction,we cannot apply thesemethods tomostof the Parry Soundrocks. We therefore base our determination of viscosity contrast ona more qualitative approach. Numerical models (Fig. 4 and see alsoJessell et al., 2009) illustrate that effective viscosity contrasts ofgreater than an order ofmagnitude yield negligible strain in the hardphase or unit. Although the degree of phase strain depends on thebulk strain, for places where ‘‘high’’ strain zones (e.g., Fig. 5a)surround un- to weakly deformed panels, we can infer viscositycontrasts of at least an order of magnitude. More than two orders of
magnitude difference renders a panel effectively rigid. Greaterdeformation (Fig. 5b) in the panels yields lower viscosity contrasts,assigned on a case-by-case basis.
Deformation in the shear zones was accommodated largely bydislocation creep, implying that the rock behaves as a power-lawmaterial. Although modeling in Elle and Basil is possible(Houseman et al., 2008; Jessell et al., 2009), we choose to restrictourselves to the effective viscosity because (1) we are not investi-gating any time-dependent behavior so effective viscosity is anappropriate representation of strength contrast, (3) use of a power-law formulation would introduce additional uncertainty becausethe flow law parameters are not well known; we can only inferrelative contrasts from the field geometries, and (3) due to thehydration inducing the weakening, the flow laws for the panels andshear zones would differ, requiring us to develop multiple flowlaws, again introducing greater uncertainty. Jessell et al. (2009)acknowledge the challenge in using localization geometry to inferpaleo-rheology, as non-linear and linear viscous materials withappropriate parameters can produce similar results. The approachpresented here does not speak to linear vs. non-linear behavior, butrather allows access to different paleo-rheological information.
3.3. Site results
We have quantified weakening at three sites associated with theTwelve Mile Bay shear zone (Fig. 1). The first site, Matches Island,represents the initial stages of shear zone development, and twounnamed islands, informally referred to here as Dogleg andBoomerang Islands, represent the edge of the shear zone core.
3.3.1. Matches IslandThis islet (Fig. 6a) lies near the margin of the extension of the
Twelve Mile Bay shear zone within the unretrogressed granuliticcore of the Parry Sound domain and consists of two lithologic units:Unit 1 is ameter-scale layeredmafic and felsic orthogneiss, and Unit2 is an intermediategneisswithpinkgranitic layers.Unit 2 retainsnofield evidence of its granulitic heritage and comprises an amphib-olite facies plagioclase–quartz–hornblende–biotite assemblage.Because strain in Unit 2 did not manifest itself in discrete shearzones, but rather appears to have deformed more homogeneously,Unit 2 is not appropriate for the calculations presented here. Wetherefore concentrate on Unit 1, which is the dominant lithology inthe area surroundingMatches Island. Unit 1 contains relict granulitetextures and mineralogy in the undeformed panels between theshear zones. In places in the mafic panels, hornblende and biotiteexhibit reaction textures around pyroxene, but original plagioclase–orthopyroxene–clinopyroxene patches persist throughout. Thegranitic layers contain plagioclase–alkali feldspar–quartz–horn-blende–biotite assemblages in both the panels and shear zones. The
Fig. 4. Comparison of shape changes with viscosity contrast. We deformed the original shape under dextral simple shear using Elle and Basil software packages for three differentviscosity contrasts between the shape and the surrounding matrix. Deformation of the object necessarily depends on bulk finite strain, but the comparisons among the differentstrength objects for the same finite strain yield a qualitative framework for estimating viscosity contrast. For contrasts greater than 10, deformation of the strong object is minimal.
C. Gerbi et al. / Journal of Structural Geology 32 (2010) 107–117 111

shear zones, nearly all of which are dextral, in the north and westportions of Unit 1 trend northwest–southeast and are poorly con-nected. Trends swing anticlockwise towards the east and increase innumber and connectivity in the center of the island.
In order to base our calculations on a representative geometry,we selected an area within Unit 1 that includes both strongly andweakly interconnected regions. We constructed the viscosity, orshear zone, geometry (Fig. 7a) from a dGPSmap constructed normalto the transport direction. In the model map, shear zones cover 19%of the area of Unit 1. To cover the range of possible variation, wecalculated the bulk effective viscosity using viscosity contrasts of 2,5, 10, and 50 between the shear zones and panels (Table 1).
Results (Fig. 8a) over that viscosity contrast range indicatestrength drops from 11% to 48% relative to the panel strength. Here,we take panel strength as the original strength of the unit, giventhat relict granulite textures, including lineations, and assemblagespersist and that there is no evidence of amphibolite facies defor-mation within the panels that would suggest that the panelssomehow weakened prior to or synchronously with shear zonenetwork development. For all viscosity contrasts, the calculatedbulk weakening lies approximately halfway between the isostressand isostrain-rate bounds, with the actual position varying withviscosity contrast.
To more accurately determine the degree of weakening of thesystem, we must better constrain the viscosity contrast between
panels and shear zones. The lack of deformation in the panelsadjacent to shear zones with shear strains as high as 20 (calculatedusing dGPS measurements and the a–a0 method of Ramsay andHuber, 1987) suggest that the panels were effectively rigid relativeto the shear zones. Therefore, as a conservative choice, we basefurther discussion on a viscosity contrast of 10, chosen as a point atwhich little deformation occurs in the strong material (e.g., Jessellet al., 2009) and therefore a bulk weakening of 31% relative to theoriginal rock (Table 1). The shear zones could reasonably have beenmore than an order of magnitude weaker than the panels, so weconsider a bulk weakening of 30% as a minimum for this site. Todetermine how representative the selected area is, we also per-formed calculations for a subset of the selected area and an areafurther north on the island. Results from those calculations indicatethat some heterogeneity exists but is relatively minor.
3.3.2. Dogleg and Boomerang IslandsThese two islets lie in comparable structural positions north of the
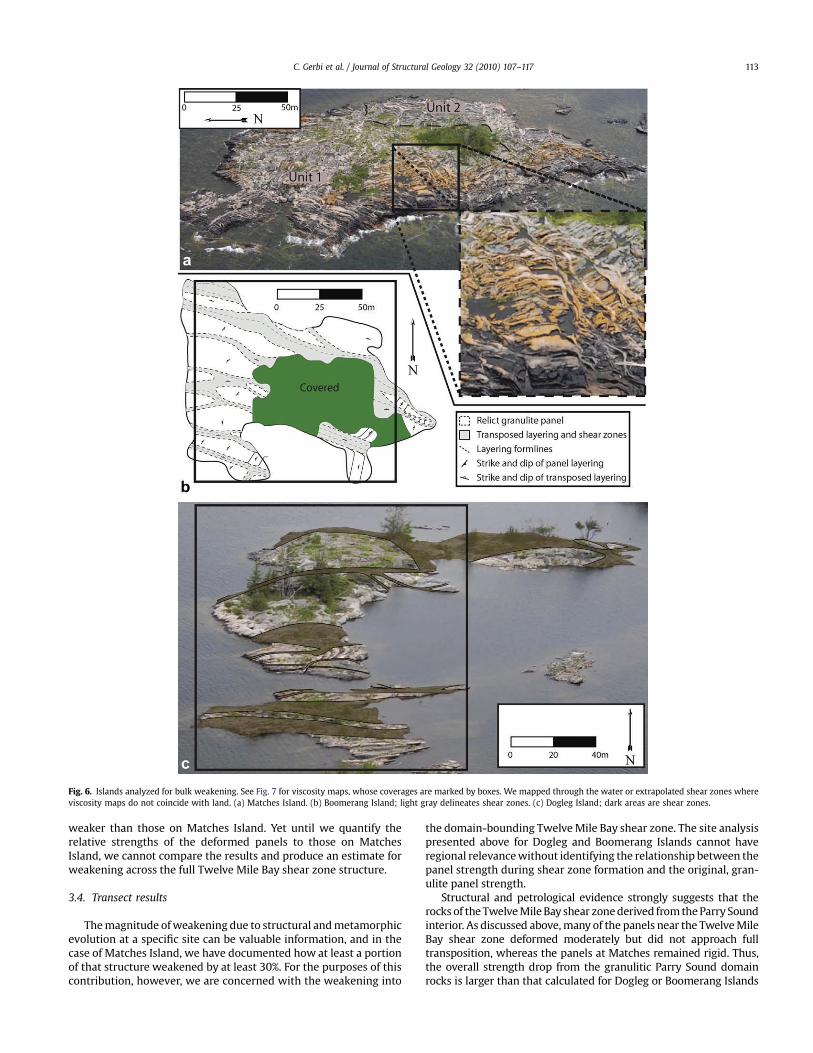
Twelve Mile Bay shear zone core, but well within the high strainportion. Both consist of wider shear zones and higher proportions oftransposed gneiss than at Matches Island (Fig. 6b,c). Nevertheless,many panels preserve granulite textures. Transposed zones are morelinked that at Matches Island, with relict panels generally morelozenge-shaped and less rectilinear. Some cm-scale shear zones cutacross panels. The granulitic protolith was not identical to that onMatches Island in that the meter-scale layering was absent, but thelithologies are generally similar. Margins of the panels exhibit highstrain gradients, similar to those on Matches Island. Units on theislands are easily divisible into transposed and untransposed gneiss.Because the features are larger than on Matches, we mapped repre-sentative areas andgeometries using aerial photographswhoseplanecontained the transport direction and was perpendicular to layering.
Because of their similar structural position and the similar bulkstrengths, we consider Boomerang and Dogleg Islands together.Shear zone areas forDogleg andBoomerang Islands are 33%and43%,respectively. This difference in coverage combinedwith thedifferentshear zone geometry (Fig. 7b,c) yields similar strength changes(Table 1): for viscosity contrasts of 2, 5, 10, and 50, the bulk weak-ening averages to 25%, 54%, 70%, and 90% relative to the panels atthose sites (Fig. 8). The proportional distance of the calculatedstrength between the isostress and isostrain-rate bounds changesmarkedly with viscosity contrast and varies between islands(Table 2). Although their bulk strengths are similar, the proportionaldifference between the bounds varies from 40% to 14% forBoomerang Island and 22% to 8% for Dogleg Island.
We have no definitive strain markers to aid in determining theappropriate panel-shear zone viscosity contrast. Given that in manylocationswecannot traceunitsacross themeter-scaleshearzones,weposit shear strains greater than 10, in accordancewith estimates fromMatches Island. Shear strainwithindeformedpanels,measuredusingthe shear angle and assuming original orthogonality between paneland shear zone (cf. Twiss and Moores, 1992), is in general less than 2(e.g., Fig. 5b). Thus, deformation observed in the panels is consistentwith that of a viscosity contrast with the shear zones of nomore than10,andprobablycloser to5.Ourpreferredestimateofbulkweakeningrelative to panel strength is therefore approximately 50%.
For a more rigorous treatment of Boomerang Island we assigneda greater viscosity to panels in the southern half of the island, assuggested by generally greater preservation of granulite texturesandmore rectilinear panels there.With a viscosity contrast of 10 forthe southern panels and 5 for the northern panels, the bulk weak-ening was nearly identical to that on Dogleg Island calculated usinga viscosity contrast of 5. The variation in panel strain on BoomerangIsland,where the stronger panels resemble those onMatches Island,suggests that deformed panels both there and at Dogleg Islandwere
Fig. 5. Examples of panel types. (a) Undeformed panels separated by shear zonesnormal to granulitic layering on Matches Island. Dotted lines demarcate shear zones.(b) Sheared panel (within dashed lines) between zones of fully transposed gneiss onDogleg Island. Solid lines are foliation form lines.
C. Gerbi et al. / Journal of Structural Geology 32 (2010) 107–117112
weaker than those on Matches Island. Yet until we quantify therelative strengths of the deformed panels to those on MatchesIsland, we cannot compare the results and produce an estimate forweakening across the full Twelve Mile Bay shear zone structure.
3.4. Transect results
Themagnitude ofweakening due to structural andmetamorphicevolution at a specific site can be valuable information, and in thecase of Matches Island, we have documented how at least a portionof that structure weakened by at least 30%. For the purposes of thiscontribution, however, we are concerned with the weakening into
the domain-bounding TwelveMile Bay shear zone. The site analysispresented above for Dogleg and Boomerang Islands cannot haveregional relevancewithout identifying the relationship between thepanel strength during shear zone formation and the original, gran-ulite panel strength.
Structural and petrological evidence strongly suggests that therocks of the TwelveMileBay shear zonederived fromtheParry Soundinterior. As discussed above,many of the panels near the TwelveMileBay shear zone deformed moderately but did not approach fulltransposition, whereas the panels at Matches remained rigid. Thus,the overall strength drop from the granulitic Parry Sound domainrocks is larger than that calculated for Dogleg or Boomerang Islands
Fig. 6. Islands analyzed for bulk weakening. See Fig. 7 for viscosity maps, whose coverages are marked by boxes. We mapped through the water or extrapolated shear zones whereviscosity maps do not coincide with land. (a) Matches Island. (b) Boomerang Island; light gray delineates shear zones. (c) Dogleg Island; dark areas are shear zones.
C. Gerbi et al. / Journal of Structural Geology 32 (2010) 107–117 113

alone. If we assign a somewhat conservative average factor of twostrength difference between Matches Island panels (i.e., originalgranulite) and thosewithin themargins of the TwelveMile Bay shearzone, then the bulk strength drop between the granulitic protolith(i.e., panels at Matches Island) and the Twelve Mile Bay shear zonemargins approaches an order of magnitude, at 77% (Table 3). In thecore of the Twelve Mile Bay shear zone, more of the gneiss is trans-posed and fewer panels are undeformed, so this strength droprepresents a minimumvalue for the viscosity factors used.
Alternatively, we could make a simple, first-order assumptionthat the shear zones preserved on Matches Island are the samestrength as the transposed gneiss of the TwelveMile Bay shear zonecore. As the panels on Matches Island are essentially undeformed,we could therefore assert that the Twelve Mile Bay shear zone is atleast an order of magnitude weaker than its granulitic protolith.This interpretation is consistent with our site-specific calculations,implying that the outcrop-scale shear zones were indeed ofcomparable strength across the study area. We have not accountedfor any possible temperature difference, but indications are thata thermal gradient sufficiently large to affect the relative strengthdid not exist (Wodicka et al., 2000; Marsh et al., 2009).
3.5. Sensitivity
The two largest uncertainties in the calculation of weakeningacross the transect are the viscosity contrast between panels andshear zones on Boomerang and Dogleg Islands and the viscositycontrast between panels on Matches and Boomerang and DoglegIslands. In the analysis above, we suggest that the deformation inthe panels within the Twelve Mile Bay shear zone core resultedfrom them being weaker than the panels on Matches. An unlikelyalternative is that the panels are of comparable strength and that
the higher bulk strains in the core caused higher strain in thosepanels. Although the petrological observation that hydration andamphibolite facies metamorphism went further towards comple-tion approaching the Twelve Mile Bay shear zone supports ourpreferred interpretation, we cannot rule out the possibility thatpanels retained similar strengths throughout. In the other direc-tion, panel weakening by much more than a factor of two wouldlikely yield only a small viscosity contrast between the panels andthe networked shear zones, contrary to the indications of thedeveloped structures. Therefore, given that the panels exist into theTwelve Mile Bay shear zone and that the original lithologies weresimilar, we infer that deformed panels on Dogleg and BoomerangIslands are approximately a factor of two, and almost certainly notmore than a factor of five, weaker than those on Matches Island.
We base our estimation of the viscosity contrast between panelsand shear zones on Boomerang and Dogleg Islands on twomeasures:comparing relative shear strains in the panels and a qualitative visualobservationof strain (Fig. 5). Thesemeasuresarenotwell constrained,and we suggest that the viscosity contrast could reasonably beconsidered to lie between 2 and 10. This range affects our aggregateresults by w20% at our preferred strength contrast of two betweenMatches and Boomerang–Dogleg Island panels (Table 3).
Considering both significant uncertainties (Table 3), we suggestthat a minimum weakening across the transect is 46%, for the casewhere thepanels inall locationsare thesamestrength. Foracaseof tentimes weaker panels, coupled with a panel-shear zone viscositycontrast of ten, weakening could be as much as 97%, or nearly twoorders of magnitude. We do not see either combination of factors asreasonable, however, given the geometrical and petrological obser-vations. Our suggested weakening value, 77%, lies near the center ofthe rangeweconsidered (Table3). Recalling that the analyzed sites arenot within the core of the Twelve Mile Bay shear zone, we concludethat the Twelve Mile Bay shear zone core approached or exceeded anorderofmagnitudeweakeningrelative to itsprotolith. Furthersupportfor the calculated strength drop lies in the first-order observation thatthe interior Parry Sound domain remained undeformed during thelong transport along the Twelve Mile Bay shear zone.
4. Discussion
4.1. Magnitude of bulk weakening along Parry Sound domainmargin compared to other weakening processes
The weakening we document as a result of tectonism andmetamorphism along the Twelve Mile Bay shear zone is greaterthan any of the processes, with the exception of melting, discussedin Section 2.2. We attribute this first to the fact that our calculations
Fig. 7. Viscosity maps of the three study sites, illustrating the pattern of weak and strong zones used in the calculation of bulk strength. We varied the viscosities to test thesensitivity of the results to the viscosity contrast (see Table 1 for values used). White represents the lower viscosity shear zones; black, the higher viscosity panels. Stepped, ratherthan smooth, boundaries are due to model digitization.
Table 1Bulk weakening with varying viscosity contrast at each study site.
Matches Island UTM (NAD83) 17T19% shear zones by area E567539 N4999439Panel-shear zone viscosity contrast 2 5 10 50% weakening relative to panel strength 12% 23% 31% 48%
Dogleg Island UTM (NAD83) 17T33% shear zones by area E570140 N4995099Panel-shear zone viscosity contrast 2 5 10 50% weakening relative to panel strength 23% 51% 68% 89%
Boomerang Island UTM (NAD83) 17T43% shear zones by area E568131 N4995980Panel-shear zone viscosity contrast 2 5 10 50% weakening relative to panel strength 28% 56% 72% 91%
C. Gerbi et al. / Journal of Structural Geology 32 (2010) 107–117114

apply to weakening across a single structure rather than theaggregate regional strength. In experiments, such as those byHolyoke and Tullis (2006), only bulk strength, combining the weakand strong components, is measurable. Second, the site weanalyzed was a major crustal shear zone and therefore must haveundergone significant weakening in order to develop. So our resultsare not surprising; rather, they demonstrate that strength changesdue to hydration-induced metamorphic and textural changes canbe substantial. Nevertheless, such weakening does not approachthat possible due to melting.
We have considered strength changes over time, during thedevelopment of the Twelve Mile Bay shear zone, with the resultbeing a spatial strength variation of approximately an order ofmagnitude. This scale of spatial variation is in good agreement withthat of Houseman et al. (2008) and Treagus (1999). Houseman et al.(2008), who investigated several shear zones in the Sierra Nevadaat centimeter, meter, and kilometer scales, suggested that an orderof magnitude or slightly more is a reasonable upper limit for theeffective viscosity contrasts there. Treagus (1999), based on her
evaluation of cleavage refraction, suggested that effective viscosityvariation between stratigraphic layers does not typically exceed anorder of magnitude.
Throughout theviscousportionof the crust, in theabsenceofmelt,temperature is usually considered as the largest control on strength.For typical flow laws (e.g., Hirth et al., 2001; Rybacki et al., 2006),a temperature change from 550 to 700 �C at a pressure of 0.8 GPayields an effective viscosity change of 1–3 orders ofmagnitude. At thelow end, the values are comparable to the results of this study.Considering that weakening due to textural and metamorphicchanges does not require any long-distance mass or heat transfer tooperate, it can rival or exceed the impact of temperature change atcertain locations within an orogen. Away from the Twelve Mile Bayshear zone core, across a transect of at least 5 km, the degree ofweakening diminishes towards the interior Parry Sound domain.Wedo not have sufficient measurements to describe that gradient, butgiven the analysis of Matches Island, which lies near the border ofTwelve Mile Bay shear zone influence we infer the weakening to begreater than 30% across much of that distance.
4.2. Affect on crustal rheology
Manyhave long recognized the influence of strength variation onorogen development (e.g., Harry et al., 1995). Recent numericalstudies have better quantified the impact of both temporal andspatial strength variation induced by structural, anatectic, andmetamorphic processes (e.g., Beaumont et al., 2001; Culshaw et al.,2006; Jamieson et al., 2007; Groome et al., 2008). The effect iscomparable to that of focused erosion driving advective masstransfer and accompanying thermal weakening (Zeitler et al., 2001;Koons et al., 2003; Barker, 2007), but occurs under different tectonic
a
b
c
d
Fig. 8. (a) Degree of bulk weakening relative to local panel strength as a function of viscosity contrast between panels and shear zones for the three study sites. (b–d) Comparison ofnumerically calculated weakening with isostress and isostrain-rate bounds for each studied location.
Table 2Proportional distance of numerically calculated strength dropa between isostressand isostrain-rate boundsb.
Viscosity contrast between panel and shear zone
2 5 10 50
Matches Is. 0.51 0.53 0.53 0.47Dogleg Is. 0.22 0.19 0.15 0.08Boomerang Is. 0.40 0.35 0.28 0.14
a Using the results shown in Table 1.b A value of 1 represents the isostrain-rate bound; 0 represents the isostress
bound.
C. Gerbi et al. / Journal of Structural Geology 32 (2010) 107–117 115

conditions. Whereas the boundary conditions related to focusederosion are rooted in fairly well-constrained data, the magnitude ofstructural-metamorphic strength variation used in the models issomewhat more speculative. Nevertheless, orogen-scale numericalmodels representative of the region surrounding the Parry Sounddomain (Jamieson et al., 2007) replicate the first-order geologicfeatures of the Parry Sound region well by using a crust with initiallateral strength variation. In comparison, our results applied at theorogen scale would likely affect second-order features.
4.3. Comparison between numerical method andtheoretical bounds
The results presented above rely on numerical calculations ofbulk strength of a two-phase material. Comparing the results withthe analytical solutions of the isostrain-rate and isostress bounds(Fig. 8, Table 2) demonstrates the importance of the phasearrangement and viscosity contrast in controlling bulk strength. ForMatches Island, the proportional distance of our results between thetheoretical bounds remains relatively constant with changingviscosity contrast. However, the proportional distance changessignificantly for Dogleg and Boomerang Islands, approaching theisostress boundwith greater viscosity contrast. A full analysis of therole of viscosity contrast and its importance relative to phaseabundance and arrangement is beyond the scope of this paper.Nevertheless, these results imply that the position of true bulkstrength relative to the isostrain-rate and isostress bounds candepend significantly on phase viscosity contrast.
5. Summary
The Twelve Mile Bay shear zone in southeastern Ontarioaccommodated many tens of kilometers of transport of the gran-ulitic Parry Sound domain over underlying amphibolite faciesdomains between ca. 1160 and 1050 Ma, during an episode ofGrenvillian orogenesis. The master shear zone formed in large partfrom Parry Sound domain rocks weakened by infiltrated fluid,metamorphism in the upper amphibolite facies, and interconnec-tion of meter-scale shear zones. The core of the Twelve Mile Bayshear zone comprises nearly fully transposed gneiss, but outsidethe core numerous protolith relicts exist. Our numerical calcula-tions, based on naturally occurring meter-scale shear zone geom-etries, indicate that the core of the Twelve Mile Bay shear zone isapproximately an order of magnitude weaker than the rocks fromwhich it formed. Moreover, weakening relative to the protolith is30% or greater several kilometers from the shear zone core.
Acknowledgments
The University of Maine, NSF award EAR-0837922, and anNSERC Discovery Grant provided funding for the project. We thankMark Jessell, Lynn Evans, and Greg Houseman for assistance in
running the Basil calculations. Paul Bons and Lori Kennedyprovided helpful reviews that allowed us to strengthen themanuscript, and we thank Cees Passchier for his editorialassistance.
References
Barker, A.D., 2007. 3D mechanical evolution of the plate boundary corner in SEAlaska. Unpublished M.S. thesis, University of Maine.
Barr, T.D., Houseman, G.A., 1996. Deformation fields around a fault embedded ina non-linear ductile medium. Geophysical Journal International 125,473–490.
Beaumont, C., Jamieson, R.A., Nguyen, M.H., Lee, B., 2001. Himalayan tectonicsexplained by extrusion of a low-viscosity crustal channel coupled to focusedsurface denudation. Nature 414, 738–742.
Bons, P.D., Koehn, D., Jessell, M.W., 2008. Microdynamics Simulation. In: LectureNotes in Earth Sciences. Springer.
Bons, P.D., Cox, S.J.D., 1994. Analogue experiments and numerical modelling on therelation between microgeometry and flow properties of polyphase materials.Materials Science and Engineering A A175, 237–245.
Brown, M., Solar, G.S., 2000. Feedback relations between deformation and melt, theevolution fromweakening to hardening in transpressive orogens. Journal of theCzech Geological Society 45, 215–216.
Burgmann, R., Dresen, G., 2008. Rheology of the lower crust and upper mantle:evidence from rock mechanics, geodesy, and field observations. Annual Reviewof Earth and Planetary Sciences 36, 531–567.
Bystricky, M., Heldelbach, F., Mackwell, S., 2006. Large-strain deformation andstrain partitioning in polyphase rocks: dislocation creep of olivine–magnesio-wustite aggregates. Tectonophysics 427, 115–132.
Carreras, J., 2001. Zooming on northern Cap de Creus shear zones. Journal ofStructural Geology 23, 1457–1486.
Cruden, A.R., 1990. Flow and fabric development during the diapiric rise of magma.Journal of Geology 98, 681–698.
Culshaw, N.G., Beaumont, C., Jamieson, R.A., 2006. The orogenic superstructure–infrastructure concept: revisited, quantified, and revived. Geology 34,733–736.
Culshaw, N.G., Corrigan, D., Ketchum, J.W.F., Wallace, P., Wodicka, N., Easton, R.M.,2004. Georgian Bay geological synthesis, Grenville Province: explanatory notesfor preliminary maps P.3548 to P.3552. In: Open File Report – OntarioGeological Survey, Report: 6143, p. 28.
Culshaw, N.G., Gerbi, C., 2009. Modes of flow in the orogenic infrastructure: theexample of the Central Gneiss. Geological Society of America Abstracts withPrograms 87, 41–43.
Culshaw, N.G., Jamieson, R.A., Ketchum, J.W.F., Wodicka, N., Corrigan, D.,Reynolds, P.H., 1997. Transect across the northwestern Grenville orogen, Geor-gian Bay, Ontario: polystage convergence and extension in the lower orogeniccrust. Tectonics 16, 966–982.
Dahlen, F.A., Suppe, J., Davis, D., 1984. Mechanics of fold-and-thrust belts andaccretionary wedges: cohesive Coulomb theory. Journal of GeophysicalResearch 89, 10087–10101.
Davidson, A., 1984. Tectonic boundaries within the Grenville, Province of theCanadian shield. Journal of Geodynamics 1, 433–444.
Davidson, A., Culshaw, N.G., Nadeau, L., 1982. A tectono-metamorphic frameworkfor part of the Grenville Province, Parry Sound region, Ontario. CurrentResearch, Geological Survey of Canada 82-1A, 175–190.
Dell’Angelo, L.N., Tullis, J., 1996. Textural and mechanical evolution with progressivestrain in experimentally deformed aplite. Tectonophysics 256, 57–82.
Dimanov, A., Dresen, G., 2005. Rheology of synthetic anorthite–diopside aggregates:implications for ductile shear zones. Journal of Geophysical Research – SolidEarth 110, B07203.
Evans, B., 2005. Creep constitutive laws for rocks with evolving structure. In:Geological Society Special Publications, vol. 245, pp. 329–346.
Groome, W.G., Johnson, S.E., Koons, P.O., 2006. The effects of porphyroblast growthon the effective viscosity of metapelitic rocks: implications for the strength ofthe middle crust. Journal of Metamorphic Geology 24, 389–407.
Groome, W.G., Koons, P.O., Johnson, S.E., 2008. Metamorphism, transient mid-crustal rheology, strain localization and the exhumation of high-grade meta-morphic rocks. Tectonics 27, TC1001.
Handy, M.R., 1990. The solid-state flow of polymineralic rocks. Journal ofGeophysical Research – Solid Earth and Planets 95, 8647–8661.
Handy, M.R., 1994. Flow Laws for rocks containing 2 nonlinear viscous phases –a phenomenological approach. Journal of Structural Geology 16, 287–301.
Handy, M.R., Brun, J.P., 2004. Seismicity, structure and strength of the continentallithosphere. Earth and Planetary Science Letters 223, 427–441.
Handy, M.R., Hirth, G., Burgmann, R., 2007. Continental fault structure and rheologyfrom the frictional-to-viscous transition downward. In: Handy, M.R., Hirth, G.,Hovius, N. (Eds.), Tectonic Faults: Agents of Change on a Dynamic Earth. MITPress, Cambridge, MA, pp. 139–181.
Handy, M.R., Wissing, S.B., Streit, L.E., 1999. Frictional–viscous flow in mylonite withvaried bimineralic composition and its effect on lithospheric strength. Tecto-nophysics 303, 175–191.
Table 3Bulk weakening on Boomerang and Dogleg Islands relative to panels on MatchesIsland for different viscosity contrasts.
Panel-shear zone viscositycontrast on Dogleg andBoomerang Islands
2 5 10
Viscosity contrastbetween panels onMatches Island andthose on Dogleg andBoomerang Islands
1 25% 54% 70%2 63% 77% 85%5 85% 91% 94%
10 93% 95% 97%
C. Gerbi et al. / Journal of Structural Geology 32 (2010) 107–117116

Harry, D.L., Oldow, J.S., Sawyer, D.S., 1995. The growth of orogenic belts and the roleof crustal heterogeneities in decollement tectonics. Geological Society ofAmerica Bulletin 107, 1411–1426.
Hirth, G., Teyssier, C., Dunlap, W.J., 2001. An evaluation of quartzite flow laws basedon comparisons between experimentally and naturally deformed rocks. Inter-national Journal of Earth Sciences 90, 77–87.
Holl, A., Althaus, E., Lempp, C., Natau, O., 1997. The petrophysical behaviour ofcrustal rocks under the influence of fluids. Tectonophysics 275, 253–260.
Holyoke III, C.W., Tullis, J., 2006. Mechanisms of weak phase interconnection andthe effects of phase strength contrast on fabric development. Journal ofStructural Geology 28, 621–640.
Houseman, G., Barr, T., Evans, L., 2008. Basil: computation of stress and deformationin a viscous material. In: Bons, P.D., Koehn, D., Jessell, M.W. (Eds.), Micro-dynamics Simulation. Lecture Notes in Earth Sciences. Springer, Berlin, pp.139–154.
Hueckel, T., Peano, A., Pellegrini, R., 1994. A thermo-plastic constitutive law forbrittle–plastic behavior of rocks at high temperatures. Pure and AppliedGeophysics 143, 483–511.
Jackson, J., 2002. Strength of the continental lithosphere: time to abandon the jellysandwich? GSA Today 12, 4–10.
Jamieson, R.A., Beaumont, C., Nguyen, M.H., Culshaw, N.G., 2007. Synconvergentductile flow in variable-strength continental crust: numerical models withapplication to the western Grenville orogen. Tectonics 26, TC5005.
Jessell, M.W., Siebert, E., Bons, P.D., Evans, L., Piazolo, S., 2005. A new type ofnumerical experiment on the spatial and temporal patterns of localization ofdeformation in a material with a coupling of grain size and rheology. Earth andPlanetary Science Letters 239, 309–326.
Jessell, M.W., Bons, P.D., Griera, A., Evans, L., Wilson, C.J.L., 2009. A tale of twoviscosities. Journal of Structural Geology 31, 719–736.
Ji, S., 2004. A generalized mixture rule for estimating the viscosity of solid–liquidsuspensions and mechanical properties of polyphase rocks and compositematerials. Journal of Geophysical Research 109, B10207.
Ji, S.C., Wang, Q., Xia, B., Marcotte, D., 2004. Mechanical properties of multiphasematerials and rocks: a phenomenological approach using generalized means.Journal of Structural Geology 26, 1377–1390.
Johnson, S.E., Vernon, R.H., Upton, P., 2004. Foliation development and progressivestrain-rate partitioning in the crystallizing carapace of a tonalite pluton:microstructural evidence and numerical modeling. Journal of StructuralGeology 26, 1845–1865.
Jordan, P.G., 1987. The deformational behaviour of bimineralic limestone–haliteaggregates. Tectonophysics 135, 185–197.
Kohlstedt, D.L., Evans, B., Mackwell, S.J., 1995. Strength of the lithosphere:constraints imposed by laboratory experiments. Journal of GeophysicalResearch 100, 17587–17602.
Koons, P.O., Norris, R.J., Craw, D., Cooper, A.F., 2003. Influence of exhumation on thestructural evolution of transpressional plate boundaries: an example from theSouthern Alps, New Zealand. Geology 31, 3–6.
Krogh, T.E., Kwok, Y.Y., 2005. The age enigma in the Moon River structure and theParry Sound domain connection, Grenville Province. Geological Association ofCanada Abstracts with Program 30, 106.
Larsen, C.F., Motyka, R.J., Freymueller, J.T., Echelmeyer, K.A., Ivins, E.R., 2005. Rapidviscoelastic uplift in Southeast Alaska caused by post-Little Ice Age glacialretreat. Earth and Planetary Science Letters 237, 548–560.
Lonka, H., Schulmann, K., Venera, Z., 1998. Ductile deformation of tonalite in theSuomusjarvi shear zone, south-western Finland. Journal of Structural Geology20, 783–798.
Marsh, J.H., Gerbi, C.C., Culshaw, N.G., 2009. On the role of fluids in deep crustalshear zones. Geological Society of America Abstracts with Program 41 (3).
Montesi, L.G.J., Zuber, M.T., 2002. Parametric analysis of localization during a varietyof geological conditions. Journal of Geophysical Research 107, B3. doi:10.1029/2001JB000465.
Park, Y., Yoo, S.-H., Ree, J.-H., 2006. Weakening of deforming granitic rocks withlayer development at middle crust. Journal of Structural Geology 28, 919–928.
Pinkerton, H., Stevenson, R.J., 1992. Methods of determining the rheological prop-erties of magmas at sub-liquidus temperatures. Journal of Volcanology andGeothermal Research 53, 47–66.
Ramsay, J.G., Huber, M.I., 1987. The techniques of modern structural geology. Strainanalysis, vol. 1, Academic Press, London.
Reuss, A., 1929. Berechnung der Fliessgrenze von Mischkristallen auf Grund derPlastizitatsbedingung fur Einkristalle. Zeitschrift fur Angewandte Mathematikund Mechanik 9, 49–58.
Rivers, T., 1997. Lithotectonic elements of the Grenville Province: review andtectonic implications. Precambrian Research 86, 117–154.
Rosenberg, C.L., Handy, M.R., 2005. Experimental deformation of partially meltedgranite revisited: implications for the continental crust. Journal of MetamorphicGeology 23, 19–28.
Ross, J.V., Wilks, K.R., 1996. Microstructure development in an experimentallysheared orthopyroxene granulite. Tectonophysics 256, 83–100.
Rubie, D.C., 1983. Reaction-enhanced ductility: the role of solid–solid univariantreactions in deformation of the crust and mantle. Tectonophysics 96, 331–352.
Rutter, E.H., 1999. On the relationship between the formation of shear zones and theform of the flow law for rocks undergoing dynamic recrystallization. Tectono-physics 303, 147–158.
Rybacki, E., Gottschalk, M., Wirth, R., Dresen, G., 2006. Influence of water fugacityand activation volume on the flow properties of fine-grained anorthite aggre-gates. Journal of Geophysical Research – Solid Earth 111, B03203.
Rybacki, E., Paterson, M.S., Wirth, R., Dresen, G., 2003. Rheology of calcite–quartzaggregates deformed to large strain in torsion. Journal of Geophysical Research– Solid Earth 108.
Takeda, Y.-T., Griera, A., 2006. Rheological and kinematical responses to flow of two-phase rocks. Tectonophysics 427, 95–113.
Treagus, S.H., 1999. Are viscosity ratios of rocks measurable from cleavage fraction?Journal of Structural Geology 21, 895–901.
Treagus, S.H., 2002. Modelling the bulk viscosity of two-phase mixtures in terms ofclast shape. Journal of Structural Geology 24, 57–76.
Treagus, S.H., Lan, L., 2003. Simple shear of deformable square objects. Journal ofStructural Geology 25, 1993–2003.
Treagus, S.H., Lan, L.B., 2004. Deformation of square objects and boudins. Journal ofStructural Geology 26, 1361–1376.
Tullis, T.E., Horowitz, F.G., Tullis, J., 1991. Flow laws of polyphase aggregates fromend-member flow laws. Journal of Geophysical Research – Solid Earth andPlanets 96, 8081–8096.
Twiss, R.J., Moores, E.M., 1992. Structural Geology. W.H. Freeman, New York.Upton, P., Craw, D., 2008. Modelling the role of graphite in development of a min-
eralised mid-crustal shear zone, Macraes Mine, New Zealand. Earth and Plan-etary Science Letters 266, 245–255.
van Breeman, O., Davidson, A., Loveridge, W.D., Sullivan, R.D., 1986. U–Pb ZirconGeochronology of Grenvillian Tectonites, Granulites and Igneous Precursors,Parry Sound, Ontario. The Grenville Province, Geological Association of Canada,Special Paper 31, pp. 191–207.
Voigt, W., 1928. Lehrbuch der Kristallphysik. Teubner, Leipzig, Germany.Wintsch, R.P., Christoffersen, R., Kronenberg, A.K., 1995. Fluid–rock reaction weak-
ening of fault zones. Journal of Geophysical Research 100, 13021–13032.Wodicka, N., Ketchum, J.W.F., Jamieson, R.A., 2000. Grenvillian metamorphism of
monocyclic rocks, Georgian Bay, Ontario, Canada: implications for convergencehistory. Canadian Mineralogist 38, 471–510.
Wu, P., Mazzotti, S., 2007. Effects of a lithospheric weak zone on postglacialseismotectonics in Eastern Canada and the Northeastern United States. SpecialPaper - Geological Society of America 425, 113–128.
Zeitler, P.K., Koons, P.O., Bishop, M.P., Chamberlain, C.P., Craw, D., Edwards, M.A.,Hamidullah, S., Jan, M.Q., Khan, M.A., Khattak, M.U.K., Kidd, W.S.F., Mackie, R.L.,Meltzer, A.S., Park, S.K., Pecher, A., Poage, M.A., Sarker, G., Schneider, D.A.,Seeber, L., Shroder, J.F., 2001. Crustal reworking at Nanga Parbat, Pakistan:metamorphic consequences of thermal–mechanical coupling facilitated byerosion. Tectonics 20, 712–728.
Zoback, M.D., 2000. Strength of the San Andreas. Nature 405, 31–32.
C. Gerbi et al. / Journal of Structural Geology 32 (2010) 107–117 117