journal of soft computing and decision
TRANSCRIPT
http://www.jscdss.com Vol.3 No.6 December 2016: 1-15 Article history: Accepted 02 October 2016 Published online 02 October 2016
Journal of Soft Computing and Decision Support Systems
The Relationship between Task Technology Fit and Individual Performance:
Case Study in Hotel Industry in Malaysia
Javad Shahreki a,*
, Hiroshi Nakanishi a
a Faculty of Malaysia – Japan International Institute of Technology (MJIIT), University Technology Malaysia (UTM),
Malaysia
* Corresponding author email address: [email protected]
Abstract
Associations require helpful performance from individual to reach their purposes. In todays of modern technology it is essential and very
important to understand performance in the information technology (IT) area. This study brings up a problem that individual performance
success could be enhanced by complementing other elements. This research examines the success of individual performance by task-
technology fit theory. This study aims to investigate which task-technology fit elements are able to explain and improve the individual
performance. The findings show that the TTF explains, improving personal performance of employees will cause higher level of
organizational performance in hotel industry. In this research from eight factors of task technology fit three factors support, which are
Quality, Authorization and Production Timeliness. Employee with high performance will provide better services for customers and this will
increase customer satisfaction. This study provides solutions for employers of hotel industry in Malaysia to improve the performance of the
operational employees, which eventually increases the performance of the hotel industry in Malaysia. As a result, the hotels will deliver
better services to the customers, in order to compete with other hotels in Malaysia. In addition, delivering high quality services provides
customer satisfaction, which significantly contributes to business performance. Moreover this will cause repeating travel to the same
destination, purchase repetition and potential increased future patronage of the hotel.
Keyword: Task-Technology Fit, Individual performance, Information technology
1. Introduction
In recent years, there is increasing permanent growth in
global investment in information technology (IT) area.
According to (Alvarez, 2013), this investment will reach to
3.7 trillion dollars in 2013, which is a 4.2% increase over
year 2012. This annual investment in IT aims to achieve the
success of organizational objectives (Petter et al., 2008),
that has positive influence on individual performance
(Bravo et al., 2015; Gable et al., 2008). With the
proliferation of information technologies, organizations
have increasingly implemented technologies to improve
their efficiency and effectiveness. Technology now plays a
critical role in supporting and facilitating work processes in
different industries and sectors (West, 2004). The use of
technologies has fostered both work independence and
collaboration. Workers are now able to work
asynchronously by accessing common databases through
intranets and extranets and connecting with others to gather
knowledge only when they encounter unanticipated
problems. In addition with proliferation of information
technologies, organizations have increasingly implemented
technologies to reorganize work tasks and facilitate
collaboration at work (Brown et al., 2004; Chan, 2010;
Morris and Venkatesh, 2010) so technologies can be
considered as instruments in carrying out individual tasks
(Goodhue and Thompson, 1995). Nowadays, the
environment of manufacturing organizations is increasingly
being complex and difficult since high standards of
performance are demand by customers. Furthermore, new
competitors make some troubles for the structures of
industry, so employees need more work, better conditions,
more incomes, and broader career paths. Government
policies and regulations also effect on changing societal
attitudes and expectations in these areas such as equal
opportunity, sustainable development, and occupational
health and safety. However, new technologies influence on
products, marketplaces, and industries (Challis et al., 2005).
At the workplace, in-role and extra-role are two dimensions
of employees‘ performance (Brief and Motowidlo, 1986;
Williams and Anderson, 1991). In-role action is an
employee‘s performance to achieve the formal necessities
of his job, and extra-role action indicates employee
activities outside the formal job descriptions under their
own pleasure (Williams and Anderson, 1991). The
performance of employees in hospitality industry has
significant contribution for countries, which have numerous
numbers of tourists every year. Malaysia, which is a very
E-ISSN: 2289-8603

Journal of Soft Computing and Decision Support Systems 3:6 (2016) 1-15
2
JSCDSS
E-ISSN: 2289-8603
touristy destination for people around the world and attracts
numerous numbers of tourists every year, is one of these
countries. Travel and tourism contribute significantly in
Malaysian GDP. This contribution was (14.9% of GDP) in
2014, and is forecast to rise by 5.3% in 2015, and to rise by
4.5% pa to (15.8% of GDP) in 2025. The hotel industry in
Malaysia has been tremendous growth due to the increasing
number of tourists who visit the country annually. The
service from the hotel must meet certain criteria and
provide services that tourists can get the best experience
and be satisfy about hotel services. As such, there is a need
for the organization to increase the quality of service, in
particular in relation to the performance of employees. The
services provided by hotels must meet the criteria.
Therefore, the organization must strive for the quality of
services, especially in terms of staff and employees
(WTTC, 2014). Recently, some strategic matters such as
frontline customer service technology attract the attentions
of many academic research and trade journals.
Investigating the relationship between usage of technology
and outcomes are very important to explore how IT helps to
achieve desirable results. The technology must be utilized
to reach IT-based productivity to achieve the desirable
results. Therefore, the recommended nomological
framework in this study is needed a theoretical
understanding of information systems or information
technology utilization and employee performance. The
review of other studies shows that many different models
have been improved to identify IT usage. The Technology
Acceptance Model (TAM) is one of the most commonly
tested models introduced by Davis et al. (1989) and this
model aims to explore how people accept using of IT and
how the use of IT supports their performance. According to
Alter (2004), customer relationship management (CRM)
and sales force automation (SFA) use have a disabling
influence on individual performance. On the other hand, Ko
and Dennis (2004) proposed that SFA use is related to
performance directly and it has greatest benefit for
individual with high technological knowledge. Making a
connection between the various types of utilization, and
their matching influence on performances of any theoretical
level (Sundaram et al., 2007). According to Kwon and
Zmud (1987), ―no clear precedence relationship exists
among use, performance, and satisfaction, it seems
reasonable to suggest that all are preceded by acceptance in
at least two cases: when use is voluntary, and when
performance is dependent on committed, rather than vapid
use.‖ Investigating the process of acceptance is not the
scope of this study but Kwon and Zmud (1992) stated that
performance is based on ―committed‖ use is different from
―vapid‖ use. Kwon and Zmud proposed the concept of
weak versus strong usage. They also stated that ―the extent
to which the expected benefits of an innovation are realized
is largely reflected in the success by which an innovation
has been incorporated within the organization‘s operational
and/or managerial work system‖ (Honeycutt et al., 2005;
Rangarajan et al., 2005; Sundaram et al., 2007).
2. Literature review
One of the models that lead technologies to better
performance is Technology to Performance Chain (TPC)
model. This model affected the individual level. Through
the review of literature, technologies should be used and be
suitable for the task affected performance. TPC model
presents precise picture of how technologies use to make
changes in performance. Individuals used technologies for
doing their tasks. Based on the IS research, technology is
computer systems such as software, hardware, and data and
it also refers to user support services such as help lines and
training. Furthermore, technology support users in their
tasks so the proposed model focus on the impacts of a
certain system or the full set of systems, services and
policies the IS department offered. Tasks are generally
defined as the actions that individuals done to turn inputs
into outputs. The task features contain individuals to trust
more on certain aspects of the IT. For instance, the
necessity of responding wide variety questions about
company operations would help a user to trust the capacity
of information system to process queries against an
operational information database. Technology may use by
each person to assist doing his/her tasks. Individual
characteristics such as computer competency, training, and
motivation could effect on how well and easily the
technology is utilized. Therefore, a degree that technology
assists an individual to do his tasks is task-technology fit
(TTF) (Aguinis et al., 2011). TTF is the interactions
between individual abilities, task needs, and the technology
functionality. The ancestors of TTF are the correspondence
between technology, task, and individual. Certain types of
tasks demand certain types of technological functionality.
For instance, interdependent tasks involving information
from many organizational units requires integrated
databases with all related data. TTF is reduced when the
gap between the task necessities and the technology
function. On the other hand, this study stated that TTF will
decrease when tasks are necessary with less functionality of
technologies, if no system suggest complete data for
complicated task needs with no effort (Chan, 2010;
Goodhue, 2006; Goodhue and Thompson, 1995).
Utilization can be defied as the action of applying the
technology to fulfil a task. It measures through the number
of use or the variety of applications that have been used. On
the other hand, the construct is doubtful, and aims to
improve the conceptualization that should be based on a
suitable reference discipline. As the lower quantity of the
TPC model is resulting from other theories on attitudes and
behavior, it can be considered as a suitable reference
discipline. Those theories define the usage of a certain
system for a single defined task. Individual make decision
whether use the system or not based on affected toward
use, social norms and viewpoints on the consequences of
use. Therefore, utilization can be conceptualized as the dual
condition of using or not using. The usage of system at
single defined task depends on the TTF of the system or the
length of use, not the chosen system. If the focus were
extended to a range of tasks in a field study of using IS, a

Journal of Soft Computing and Decision Support Systems 3:6 (2016) 1-15
3
JSCDSS
E-ISSN: 2289-8603
suitable conceptualization is the amount of time that the
individual use the system. It should be consider that this
procedure is different from conceptualizing utilization
when the frequency or amount of time is important to
choose which a system is chosen to use. It helps to figure
out if an individual choose to use a system three times
means that there are four tasks, or 20 tasks. As described,
before this, the utilization was suggested by theories on
behavior and attitudes. The model shows both mandatory
and voluntary utilization. Mandatory use can apply when
social norms of using system are overpowered and very
stronger than other thoughts such as attitudes about
expected influences and consequences. The influence of
TTF on usage can be shown through making a connection
between beliefs and task-technology fit on the significances
of using a system since TTF is an main determinant of
whether systems are important and useful or not. As the
model indicates, all of these related theories tries to predict
usage of systems so that they are not just determinant
(Bravo et al., 2015; Chan, 2010; Goodhue, 2006; Goodhue
and Thompson, 1995; Sundaram et al., 2007). Moreover, in
this context, performance influence on the achievement to a
variety of individual tasks. Higher performance indicates
some mix of higher quality and/or improved effectiveness.
High TTF not only increase the possibility of utilization,
but also it improves the system performance. Besides, it
increases the performance of any system because it meets
the task requirements of the individual (Bravo et al., 2015;
Chan, 2010; Goodhue, 2006; Goodhue and Thompson,
1995). A conceptual technology-to-performance chain
model explains the relationship between individual
performance and IT utilization. This framework was
established on two different study area: the IT use with its
former behavior and attitude, and the ―fit focus‖ evident,
which in study examining the IT user‘s performance.
According to Venkatraman (1989), ―fit‖ evaluation in study
is with six different approach and perspectives such as
moderation, mediation, matching, gestalts, profile deviation
and co variation. 1) Mediation perspective, which is
presence of intervening outcomes between a consequent
variable and its antecedent variable. 2) Moderation
perspective refers to being moderator in an independent
variable on dependent variable. 3) Matching perspective
that matches two related variable together. 4) Profile
deviation; it refers to the degree of loyalty to a certain
profile. 5) Gestalts; it considered as the level of internal
consistency among entire set of theoretical characteristics
to identify several group. 6) Co variation; it is an outline of
internal reliability between a set of related theoretically
variables. Among all above perspectives, the first two are
more frequently utilized than others (Goodhue, 2006;
Goodhue and Thompson, 1995; Hari Suryaningrum, 2012;
McGill and Hobbs, 2006; Teo and Men, 2008). Fit as
moderating variable was proposed by Goodhue and
Thompson (1995), they stated that: ―information system
(systems, policies, staff of IS, etc) have a positive impact
on performance only when there is a correspondence
between their functionality and the task requirements of
users.‖ The findings showed the TTF as a purpose of task,
system characteristic, and performance. Although TTF
shows some supporting evidences, several studies extend
TTF with TAM in some areas such as consumer of
education (Strong et al., 2006), e-Tourism (Usoro et al.,
2010), e-commerce (Klopping and McKinney, 2004),
conceptualization perspective (Dishaw et al., 2002), and
hotel industry (Schrier et al., 2010). These researches
carried out to achieve more complete explanation about
behavior of human through use of IS. The new individual
performance model aims to combine Decomposed Theory
of Planned Behavior (DTPB) with TTF since TAM has a
strong and simple model and DTPB is comprehensive to
show IT usage. The symbolic interactionism and sociology
theory are used to improve the coherence of these two
models. Alongside, TTF is chosen because of its theoretical
assumption that IT has a positive influence on individual
performance and utilized when it is potentials to match the
task (Goodhue, 2006; Goodhue and Thompson, 1995; Hari
Suryaningrum, 2012).
Fig. 1. Task-Technologies Fit Model (Goodhue, 2006; Goodhue and Thompson, 1995; Hari Suryaningrum, 2012)
Fig. 1 shows the Task-Technologies Fit (TTF) model,
TTF model plays an important role in IS theory, which
assumed that IS will be employed when the IT capabilities
match the task, which have a positive effect on an
individual performance (Goodhue and Thompson 1995).
Goodhue and Thompson (1995) suggested the fit between
task features and IS characteristics to create a conceptual
foundation to examine the decision-making attribute.
System information providing information to helps users to
perform their tasks individually. As result, individual
performance and IT has strong relationship (McGill and
Hobbs, 2006; Teo and Men, 2008). On the other hand, the
fit between IT is utilization (Strong et al., 2006) that
provides information for users to carry out the task.
Therefore, TTF theory proposes a better fit between
technology and task to achieve performance. According to

Journal of Soft Computing and Decision Support Systems 3:6 (2016) 1-15
4
JSCDSS
E-ISSN: 2289-8603
Goodhue and Thompson (1995), constructing a laboratory
environment to perceived better performance is very
important in which the propositions and model can be
tested with performance (Goodhue, 2006; Goodhue and
Thompson, 1995; Hari Suryaningrum, 2012). The
connection between performance and IT is topics of many
IS researches. The present study aims to propose and
examine new and comprehensive model for this connection
through two different areas of research such as user
behavior as predictors of applying, task-technology fit as a
predictor of performance. This model named the
Technology to Performance Chain (TPC) that helps IT to
have a positive influence on individual performance
(Goodhue, 1998; Goodhue, 2006; Goodhue and Thompson,
1995; Schrier et al., 2010; Strong et al., 2006).
Goodhue and Thompson (1995) conducted a study to
exploring the relationship between the task requirement, the
system function, the user and system influence on usage.
Performance is when the technology meets the users‘
requirements and builds characteristics that help the
required fit of the task (Goodhue, 1998; Goodhue, 2006;
Goodhue and Thompson, 1995; Hari Suryaningrum, 2012).
The most common complementary research stream is TPC
based on the "utilization focus" stream. TPC utilizes user
beliefs and attitudes to predict the use of IS (Goodhue,
1998; Goodhue, 2006; Goodhue and Thompson, 1995). The
majority of studies worked on the utilization based on
theories of behavior and attitudes. Technology features
such as chargeback policies or high quality systems effects
on the user attitudes about systems, which is useful or user
information satisfaction. Finally, the user attitudes along
with social norms motivate users whether to utilize systems
or not. Therefore, the implication increases utilization that
leads to positive impacts on performance. There are a few
researchers have focused on utilization and proposed that
performance impacts will outcomes of task-technology fit.
It happens while a technology "fit" the need of a task and
offers some characteristics and helps. The "fit" focus is
obvious in study of the effect of tables versus graphs on
individual decision-making performance. The findings of
two studies indicate the impact of data on performance
based on fit with the task through a series of laboratory
experiment. Finding of another study shows the
mismatches between a technology feature and tasks make
decision-making performance slow through demanding
further changes between decision processes or data
representations.
The others study investigate strong relationship between
performance and "cognitive fit" in laboratory tests. This
case is created for a "fit" theory of tasks, systems,
individual characteristics, and performance (Goodhue,
1995). The objective of this research is that IS (policies or
systems) and IS staff has a positive effect on performance
when the task needs of users and functionality is connected
to each other. There is also recommended a linkage
between utilization and fit. Utilization, "fit" and acceptance
has also been linked at the organizational degree (Goodhue,
1998; Goodhue, 2006; Goodhue and Thompson, 1995). A
"system/work fit" is a strong predictor of managerial
electronic workstation, which is used at the individual level
(Dishaw et al., 2002; Goodhue, 1998; Goodhue, 2006;
Goodhue and Thompson, 1995; Usoro et al., 2010). The
TPC model shows that IT has a positive influence on
performance. DeLone and McLean (1992) proposed that
the Technology to Performance Chain model is consistent
in user attitudes and with DeLone and McLean model.
First, it focuses on the significance of task technology fit in
describing how technology results to performance. In many
previous models, task technology fit is a critical construct
that was implicit or missing. Second, the model is explicit
focus on the connections between the constructs, which
offering a greater theoretical foundation for numerous
issues that are affecting IT on performance. These contain:
choosing replacement measures of management
information systems success that change organizational
effectiveness, describe as improved productivity, net utility
of a means of inquiry or higher relative value and utility in
decision making. Additionally, it effects on the
investigating the effect of user performance, and improving
better solution for information system problems (Dishaw et
al., 2002; Goodhue, 1998; Goodhue, 2006; Goodhue and
Thompson, 1995; Usoro et al., 2010).
Usefulness is a concept that means the level of
information system that develops the individual
performance. According to DeLone and McLean (1992),
usefulness is defined as the information quality, which is
comprehensible, relevant, complete and timely and the
information system quality such as flexibility, reliability,
ease of use, and mediated by the use of the user satisfaction
and information system. According to Goodhue and
Thompson (1995), usefulness is the fit and the information
system usage between the task demands and how the
information system encounters them, which is translated
into features such as reliability and ease of use of the
technology and the information is detailed and up-to-date
levels. These models have been used frequently in the
literature and continue to be foundation for ongoing
research (Dishaw et al., 2002; Goodhue, 1998; Goodhue,
2006; Goodhue and Thompson, 1995; Urbach et al., 2009).
Based on the systemic perspective, literature related
combined and the industrial psychology to the influence of
technology to outline the relationships and constructs to
clarify performance.
A systemic perspective emphasizes on the set of
components such as individual, task, technology and their
relationships that influence on performance. Lyytinen and
Newman (2008) proposed that if the components are not
associated together, the outcomes could lead to
deterioration in performance and be less predictable.
Alongside, Alter (1999) reported that an appropriate task
performance is based on the fit of its components. For
example, when an individual knows the activities and when
the technology is suitable for supporting the task, the fit
occurs. The review of related studies on the technology
impact has shown that the ease and the efficacy of the
information system are suitable features for their
technology success models (Bravo et al., 2015; Goodhue,
1998; Goodhue, 2006; Goodhue and Thompson, 1995;

Journal of Soft Computing and Decision Support Systems 3:6 (2016) 1-15
5
JSCDSS
E-ISSN: 2289-8603
Lyytinen and Newman, 2008)). According to Goodhue and
Thompson (1995), performance improvement shows
greater proficiency or individual effectiveness. An
appropriate technology has great influence on performance
same as the eases of information system for individual task.
The technology as a factor of ‗tools‘ can increase or reduce
individual performance for industrial psychology.
According to Blumberg and Pringle (1982), if tools are not
appropriate in an organization may have skilful and
motivated staff, it cause failure or elimination of
production. Seddon (1997) stated that information system is
suitable since help to carry out the same quantity and
quality of work in less time or assisting the user to carry out
better performance at the same time. From the systemic
perspective, the levels of technology provide information
and/or automating activities determine the influence of the
information system on performance. Achieving these roles
can be used as the individual assessment on the
effectiveness of a technology for doing the tasks.
According to Davis (1986, 1989), ease of use technology
leads to perception of usefulness increases and in
consequence improvement in performance. It means that
the worker will be more productive in that quantity of time
if the user will. The review of study shows many researches
that empirically create a relationship between ease of use
and usefulness of information system. Rai et al. (2002)
found a positive connection between these two component
on academic information system (Bravo et al., 2015;
Goodhue, 1998; Goodhue, 2006; Goodhue and Thompson,
1995; Lyytinen and Newman, 2008; Sundaram et al.,
2007). The utilization research stream fails to consider that
technology utilization is not always voluntary.
In many cases, it can be more a function of how a
particular job is designed, rather than on its quality or
usefulness. The more involuntary the usage, the more the
performance impacts will depend on factors relating to fit.
Even when utilization is voluntary, other factors may have
an influence (e.g. social factors, habit, and availability),
which will not necessarily improve performance if the
system is poorly designed. The primary limitation of the fit
focus alone is that it does not sufficiently account that
systems should be used before outcome has influences on
positive performance (Goodhue and Thompson, 1995). The
integrated, proposes a comprehensive picture of new model
on how user tasks, utilization, and technologies cause
changes in performance. The concept of task-technology fit
in this model is ―the degree to which a technology assists
an individual in performing his or her portfolio of tasks‖
(Goodhue and Thompson, 1995). Among individual
abilities, task requirements, and the functionality and
interface of the technology, TTF is another way of putting
task-technology fit. As such, TTF encompasses a three-way
relationship, and could really be conceptualized as task-
individual-technology fit although the author(s) prefer the
simpler label for the construct (Goodhue, 2006). The main
characteristics of the TPC are tasks, utilization,
technologies, individuals, and antecedents of TTF, task
technology fit, and antecedents of utilization. In a
preliminary study of the core model, including a variety of
technologies, Goodhue and Thompson (1995) proposed a
model at a high level of generalization (Bravo et al., 2015;
Goodhue, 1998; Goodhue, 2006; Goodhue and Thompson,
1995; Lyytinen and Newman, 2008; Sundaram et al.,
2007). Mathieson and Keil (1998) carried out the study to
examine the relationship between and the level of
individual perceives a system easy and task-technology fit
to use in a lab study involving undergraduate business
students. The findings showed that perceived ease of use
was a purpose of task-technology fit, and that neither task
alone nor information systems alone, was adequate to
predict performance. Eight dimensions of TTF, the
operational definition of each dimension is as follow: 1.
Quality: the using data is enough for individual
requirements, 2. Authorization: achieving approval to
access data for their job, 3. Locatability: determining what
data is available and where, 4. Compatibility: different
sources data can be compared or consolidated without
inconsistencies, 5. Systems Reliability: consistency and
dependability of uptime and access of systems 6.
Production Timeliness: IS provides pre-defined production
improvement schedules, 7. Relationship with Users: How
does IS understand individual unit's business task and its
association to support purposes, 8. Ease of Use / Training:
simplicity of how employees want to use system software
and hardware for analyzing data, accessing, submitting
(Bravo et al., 2015; Goodhue, 1998; Goodhue, 2006;
Goodhue and Thompson, 1995; Lyytinen and Newman,
2008; Sundaram et al., 2007).
3. Methodology
A quantitative approach is used in this study for data
collection and analysis. This approach allows replicability,
objectivity, and produce outcomes that are more descriptive
and generalizable across setting while allowing the study
carry out on relationships between variables with level of
accuracy needed for creating social trends (Benini et al.,
2000). Therefore, quantitative approach supports the
empirical testing of the hypotheses and the conceptual
model for this study. The purpose of this study is to
investigate the association between the individual
performance and task technology fit. The population was
general managers and assistant general managers of hotels
in Malaysia. The sample was drawn from 95 five-star
hotels located in Malaysia where general managers and
assistant general managers were working, using multi-stage
cluster sampling technique. A self-administered survey was
conducted to reach a widespread sample of respondents to
collect data (Fricker and Schonlau, 2002). It recorded
advantages such as accessing to unique or large
populations, ease of administering, saving in both cost and
time and recording questions and answers and
disadvantages of research such as, determining whether the
respondents are loyal, lack of control on the time and
details information because of no interviewer intervention
available for explanation (Fricker and Schonlau, 2002).
There are several ways of conducting quantitative survey-
based research such as interview-completion, self-

Journal of Soft Computing and Decision Support Systems 3:6 (2016) 1-15
6
JSCDSS
E-ISSN: 2289-8603
administered, and observation (Hair et al., 2003). There are
some types administered surveys such as Internet survey,
mail surveys, and drop-off / pick up. The majority of self-
administered surveys employ a structured questionnaire
that propose a set of questions (Hair et al., 2003) that the
respondent can answer the survey questions and record
them without the presence of an interviewer. In the current
study, the internet and drop-off survey was used. Drop-off
method is the method that the researcher travel to the
respondent‘s location and hand-delivering survey
questionnaires to respondents (Wilkinson and Birmingham,
2003). The representative or the researcher will collect it
when the survey is completed. This method has two
advantages, first, the presents of a person to respond any
questions and second is the ability to create interest in
questionnaire conclusion through informal interaction of
interviewer with the respondents. Nine instruments
measuring such as authorization, ease of use/training,
locatability, quality, compatibility, systems reliability,
production timeliness, and relationship with user and
individual performance are used in this study. Structural
Equation Modelling (SEM) also was used after data
collection. Using SEM method use several indicator
variables per construct concurrently that results to more
valid conclusions (Hair et al., 2010). Confirmatory factor
analysis for each construct was carried out to determine the
discriminant validity and convergent. Finally overall
measurement and structural models were tested, using PLS
software. Population of the current study was all general
managers and assistant general managers working in hotels
in Malaysia. Table 1 shows the list of hotels in each state in
Malaysia in 2014, which are 2,628 hotels in Malaysia.
Table 1
Hotel industry in Malaysia 2014
HOTELS 2014
States Hotels
Perlis 29
Kedah
102
P.pinang 121
Perak 188
Selangor 222
N.sembilan 109
Melaka 207
Johor 233
Pahang 250
Kelantan 126
Terengganu 29
Sabah 386
Sarawak 240
Kuala lumpur 247
Putrajaya 5
Labuan 34
Malaysia
2,628
*Source: World Travel and Tourism Council (WTTC, 2014)
Multi-stage cluster sampling was used for sampling
procedure as the population (assistant general managers
and general managers) was at hotels in Malaysia so that
simple random sampling was difficult to conduct. The
location where general managers and assistant general
managers work that was divided up into five clusters
including one-star to five-star hotels at the first stage. A
sample of five-star hotel was randomly selected as the
survey cluster. After determining the five-star hotels, a
stratified sampling method was adopted to divide the entire
target population (i.e. general managers and assistant
general managers) into two strata, i.e. male and female to
select appropriate numbers of male and female general
managers and assistant general managers working in each
hotel.
The HR department in each hotel handed the researcher
the number of male and female general managers and
assistant general managers. This ensured that the researcher
has adequate amounts of subjects from each stratum in the
final sample. Lastly, subjects were selected as final subjects
proportionally from the one of the two strata, using simple
random sampling method, which assured that each subject
in the population since all has a same chance of being in the
sample. A sample refers to a sub-set of the population
selected for a particular study (Burns and Grove, 1999). In
other words, individuals who take part in the sampling
process to present a certain population that is being
researched are referred to as the sample size. Information
that is obtained from the sample size could be used to
estimate on the outcome of research population that is
being researched.
According to HR of each hotel, there are 500 general
managers and assistant general managers working in these
five star hotels. The TTF (Goodhue and Thompson, 1995)
comprises of 34 items. TTF is also one of the most
important constructs that studied cross culturally and one of
the most frequently studied variables. Task Technology Fit
surveys have eight parts, which are Quality (6 items),
Locatability (4 items), Authorization (2 items),
Compatibility (3 items), Production Timeliness (2 items),
Ease of Use/Training (4 items), Relationship with Users (4
items) and Systems Reliability (3 items). Five-point Likert
scale is used for evaluation these items from Strongly
Disagree (1) to Strongly Agree (5). To measure individual
performance, 6 items were adopted from (Lynch et al.,
1999). Among other scales, researcher identified that
Lynch et al.‘s individual performance measure (1999) was
more suitable for the current study as it included items
measuring in-role and extra role performance. There were
three items are used for assessing in-role and three items
for extra-role performance of employees. Participants were
asked to respond descriptive items base on their experience
through a 5-point Likert-type scale.
The validity of the instrument for quantitative data refers
to which the research variables such as individual
performance and task technology fit are accurate, stable
and whether they measure correctly. Therefore, this study is
considered two different types of validity: construct and
content validity. Inferential and descriptive statistics were

Journal of Soft Computing and Decision Support Systems 3:6 (2016) 1-15
7
JSCDSS
E-ISSN: 2289-8603
used in this current research. PLS and statistical package
for the social sciences (SPSS) is used to analysis the
collected data from the survey. PLS is used to help the
researcher in testing theoretical models (Byrne, 2010).
Descriptive statistics, Confirmatory Factor Analysis (CFA),
and Structural Equation Modelling (SEM) analysis was
used to analysis data. SEM is a more general method for
investigating the relationships among variables. It is an
extension of several multivariate techniques and as a more
advanced data analysis technique (Hair et al., 2010). It is a
powerful statistical tool in mediation studies and also
applied to assess indirect and direct relationships among
variables (Hair et al., 2010; Ho, 2006). Furthermore, a two-
step procedure using confirmatory factor analyses and SEM
was utilized to evaluate the mediating effect of variable
(Anderson and Gerbing, 1988).
4. Results And Discussions
The relationship of the two factors has a profound effect
on the microscopic properties and macroscopic structure of
the gel in toluene. The unit of analysis in the current
research is hotels in Malaysia. The total number of
registered hotels in whole Malaysia is 2,628, as reported by
tourism Malaysia, World Travel and Tourism Council (2014).
To collect maximum required data, the research was
focused on general managers and assistant general
managers in five star hotels. The list of five star hotels,
which are located in ministry of tourism, is extracted from
ministry of tourism Malaysia. The internet and drop-off
survey was used in the sampling technique to collect the
data which are kind of self-administered survey (Wilkinson
and Birmingham, 2003). The respondents of the current
study were general managers and assistant general
managers. In order to get effective data, both online survey
and hard copy questionnaire was prepared. In addition,
several follow-up actions through direct visits, persuasion
over e-mails and phone calls were facilitated to end up with
the achieved rate. A total of 500 questionnaires were
distributed and 183 (36.6%) sample questionnaires were
received from general managers and assistant general
managers of five star hotels. Out of 183 samples, 167
samples were usable for the purpose of analysis. Table 2
shows the respondent rate for the current study.
Table 2
Response Rates
No. of Distributed questionnaires No. of received data No. of usable data Percentage
500 183 167 36.6%
Based on Table 2, the statistical analysis for the current
research is associated with 167 respondents. The sample
size of 167 cases is sufficient for data analysis following
the rules of thumb for defining sample size. In multiple
regression analysis, the sample size can be greater than 30
and less than 500 are for multivariate study. (Roscoe, 1969;
Sekaran and Bougie, 2010). The minimum sample size
needed in multivariate research to perform PLS-SEM
should be 10 times the maximum number of arrows
heading to a point of the endogenous latent variable (Hair
et al., 2013). Table 3 has shown that the most of the
respondents were male. Table 4 also is shown that the
frequency of respondents based on their age, 73
respondents (43.7%) have 36 to 45 years old. Moreover,
Table 5 shows that most of the respondents were married
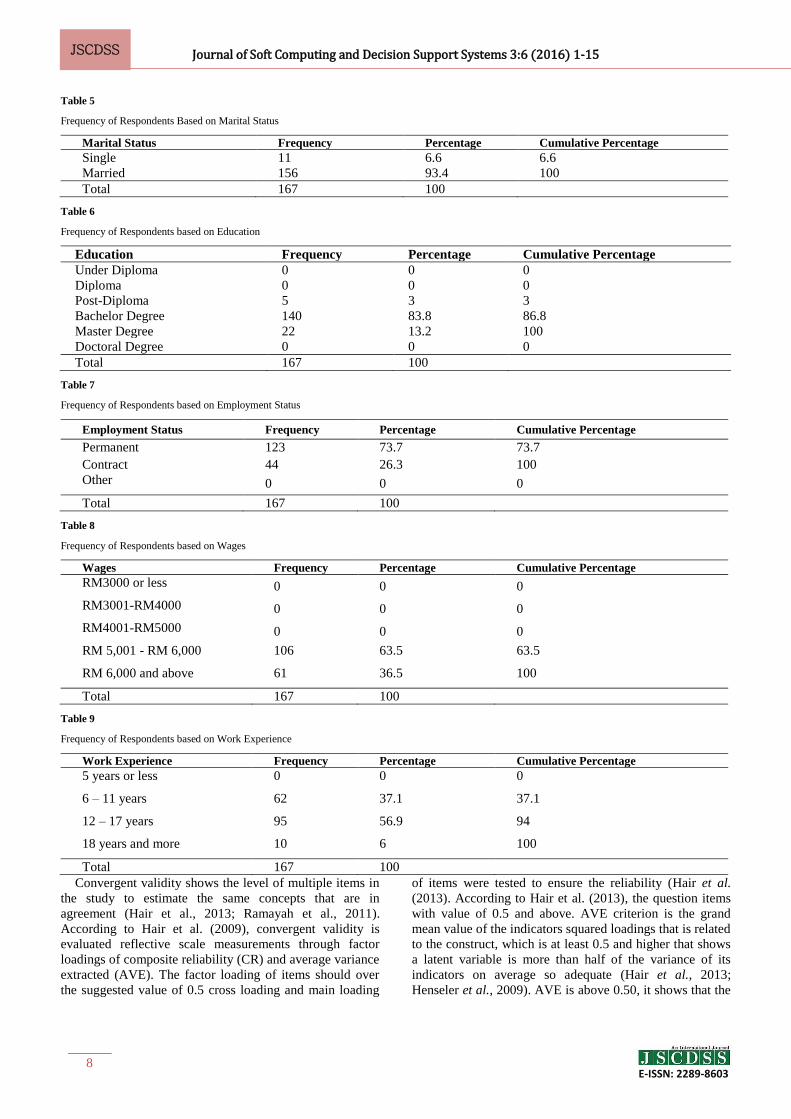
(93.4%). As shown in Table 6, majority of respondents had
bachelor‘s degree (83.8%). Table 7 shows the employment
status of the respondents. The result shows that 73.7% of
respondents were permanent employees. Table 8 shows the
frequency of range of wages among respondents. The result
shows that the wages of 63.5% of respondents is between
RM5,001 to RM6,000. Finally, Table 9 shows the
frequency of respondents based on their work experience.
The result shows that the work experience of 56.9% of
respondents is between 12 – 17 years.
Table 3
Frequency of Respondents Based on Gender
Gender Frequency Percentage Cumulative Percentage
Male 139 83.2 83.2
Female 28 16.8 100
Total 167 100
Table 4
Frequency of Respondents Based on their Age
Age Frequency Percentage Cumulative Percentage
25 or less 0 0 0
26-35 years 22 13.2 13.2
36-45 years 73 43.7 56.9
45 and above 72 43.1 100
Total 167 100
Journal of Soft Computing and Decision Support Systems 3:6 (2016) 1-15
8
JSCDSS
E-ISSN: 2289-8603
Table 5
Frequency of Respondents Based on Marital Status
Marital Status Frequency Percentage Cumulative Percentage
Single 11 6.6 6.6
Married 156 93.4 100
Total 167 100
Table 6
Frequency of Respondents based on Education
Education Frequency Percentage Cumulative Percentage
Under Diploma 0 0 0
Diploma 0 0 0
Post-Diploma 5 3 3
Bachelor Degree 140 83.8 86.8
Master Degree 22 13.2 100
Doctoral Degree 0 0 0
Total 167 100
Table 7
Frequency of Respondents based on Employment Status
Employment Status Frequency Percentage Cumulative Percentage
Permanent 123 73.7 73.7
Contract 44 26.3 100
Other 0 0 0
Total 167 100
Table 8
Frequency of Respondents based on Wages
Wages Frequency Percentage Cumulative Percentage
RM3000 or less 0 0 0
RM3001-RM4000 0 0 0
RM4001-RM5000 0 0 0
RM 5,001 - RM 6,000 106 63.5 63.5
RM 6,000 and above 61 36.5 100
Total 167 100
Table 9
Frequency of Respondents based on Work Experience
Work Experience Frequency Percentage Cumulative Percentage
5 years or less 0 0 0
6 – 11 years 62 37.1 37.1
12 – 17 years 95 56.9 94
18 years and more 10 6 100
Total 167 100
Convergent validity shows the level of multiple items in
the study to estimate the same concepts that are in
agreement (Hair et al., 2013; Ramayah et al., 2011).
According to Hair et al. (2009), convergent validity is
evaluated reflective scale measurements through factor
loadings of composite reliability (CR) and average variance
extracted (AVE). The factor loading of items should over
the suggested value of 0.5 cross loading and main loading
of items were tested to ensure the reliability (Hair et al.
(2013). According to Hair et al. (2013), the question items
with value of 0.5 and above. AVE criterion is the grand
mean value of the indicators squared loadings that is related
to the construct, which is at least 0.5 and higher that shows
a latent variable is more than half of the variance of its
indicators on average so adequate (Hair et al., 2013;
Henseler et al., 2009). AVE is above 0.50, it shows that the

Journal of Soft Computing and Decision Support Systems 3:6 (2016) 1-15
9
JSCDSS
E-ISSN: 2289-8603
variance shared with a construct and is greater than error.
The AVE for each latent variable in the current study was
greater than 0.50 (Ashill et al., 2005). In order to evaluate
the consistency of the measurement items, composite
reliability (CR) is used in the study. CR is a measure of
internal consistency, and shows a block is considered as
homogeneous (Barroso et al., 2010). For PLS-SEM, CR is
more appropriate than Cronbach‘s alpha, that arranges
indicators based their reliability through estimated model
(Hair et al., 2011). The CR value should be higher than 0.7
(Hair et al. (2011). The result of this study also showed that
CR is more than 0.70 for each variable. Therefore, for
reflective scale measurement, the convergent validity is
achieved. Convergent validity for formative scale
measurement is measured by multicollinearity of
indicators, testing the indicators weight and significance of
weight (Hair et al., 2012; Becker et al., 2012; Chin and
Newsted, 1999). The proposed indicator weights is >0.1
(Lohmöller, 1989) or 0.2 (Chin, 1998). Hair et al. (2013)
proposed that an importance level at least 0.05 showed that
an indicator is appropriate for the formative index
construction. To determine the level of multicollinearity,
Variance Inflation Factor (VIF) is used as indicators‘
information that can be redundant because of high level of
multicollinearity (Hair et al., 2011). VIF assessed the
degree of multicollinearity as a formative indicators that
should be below 3.33 (Diamantopoulos and Siguaw, 2006),
above 3.33 shows that multicollinearity exists in the
formative measures. The VIF value should also be lower
than 5 or 10 (Hair et al,. 2013). Table 10 and Table 11
show a summary of criteria that shows the validity and
reliability of reflective and formative measurement,
respectively.
Table 10
Criteria for Reflective and Formative Measurement
Criterion Description
Reflective Measurement
Composite reliability (CR) The CR value must be higher than 0.7.
Indicator reliability Absolute standardized loadings must be greater than 0.7. Loadings between 0.4-0.7
can be retained if composite reliability and validity has reached its recommended
threshold
Average variance extracted (AVE) The AVE must be greater than 0.5
Fornell-Larcker criterion AVE criterion is the grand mean value of the indicators squared loadings that is
related to the construct, which is at least 0.5 and higher that shows a latent variable
is more than half of the variance of its indicators on average so adequate.
Cross-loading Another check for discriminant validity is cross-loading. The factor loading of items
should over the suggested value of 0.5 cross loading and main loading of items were
tested to ensure the reliability.
Formative Measurement
Indicators‘ relative
contribution to the constructs
Report indicators weight
Significance of weights Report t-values
Multicollinearity VIF less than 10. In addition, a bivariate correlation between indicators and
construct should be tested in the event of insignificant indictors weights or VIF
value exceed the cut off value or both *Source: Henseler et al. (2009) and Cenfetelli and Bassellier (2009)
Table 11
The Results of Measurement Model for Reflective Constructs
Variables Type Items Factor Loading AVE CR
Individual Performance Reflective IndPer1 0.745 0.643 0.354
IndPer2 0.772
IndPer3 0.641
IndPer4 0.804
IndPer5 0.690
IndPer6 0.736
*AVE = Average Variance Extracted, CR = Composite reliability
Journal of Soft Computing and Decision Support Systems 3:6 (2016) 1-15
10
JSCDSS
E-ISSN: 2289-8603
Table 12
The Results of Measurement Model for Formative Constructs
Variables Type Items Weights t-value VIF
Quality Formative Qul1 0.105 0.567 2.070
Qul2 0.270 1.577 1.988
Qul3 0.310 1.593 1.503
Qul4 0.148 0.822 2.407
Qul5 0.607 3.55* 2.492
Qul6 0.224 1.263 2.176
Locatability Formative Loc1 0.159 0.411 2.661
Loc2 0.753 1.85* 2.745
Loc3 0.729 1.99* 2.221
Loc4 0.585 1.544 3.573
Authorization Formative Auth1 1.026 14.5* 1.856
Auth2 0.214 0.867 2.032
Compatibility Formative Comp1 -0.850 1.109 2.781
Comp2 0.902 1.245 2.701
Comp3 0.232 0.642 2.036
Production Timeliness Formative ProTi1 0.578 2.36* 5.311
ProTi2 0.762 3.63* 4.135
Systems Reliability Formative SysRel1 0.251 0.958 2.467
SysRel2 1.018 5.54* 2.420
SysRel3 -0.224 0.786 2.557
Ease of Use/Training Formative Eas1 0.166 0.520 2.082
Eas2 0.285 0.854 2.275
Eas3 0.849 3.15* 3.932
Eas4 0.481 1.575 2.499
Relationship With Users Formative Rel1 -0.340 1.311 2.729
Rel2 -0.152 0.516 2.063
Rel3 -0.142 0.541 2.343
Rel4 0.092 0.309 2.780
Rel5 0.528 2.16* 5.689
Rel6 0.248 0.905 4.913
Rel7 0.357 1.403 3.052
Rel8 0.222 0.785 2.477
Rel9 0.226 0.974 2.185
Rel10 0.209 0.945 2.317
VIF = Variance Inflation Factor. **P<0.01, *P<0.05
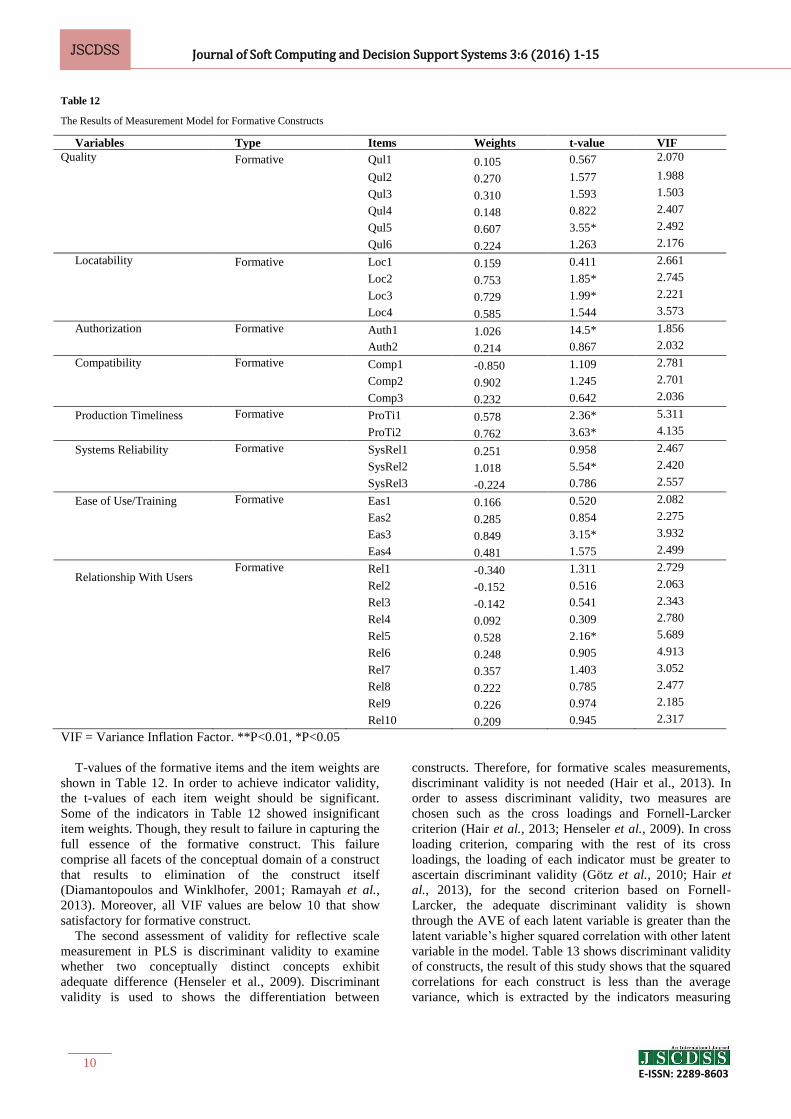
T-values of the formative items and the item weights are
shown in Table 12. In order to achieve indicator validity,
the t-values of each item weight should be significant.
Some of the indicators in Table 12 showed insignificant
item weights. Though, they result to failure in capturing the
full essence of the formative construct. This failure
comprise all facets of the conceptual domain of a construct
that results to elimination of the construct itself
(Diamantopoulos and Winklhofer, 2001; Ramayah et al.,
2013). Moreover, all VIF values are below 10 that show
satisfactory for formative construct.
The second assessment of validity for reflective scale
measurement in PLS is discriminant validity to examine
whether two conceptually distinct concepts exhibit
adequate difference (Henseler et al., 2009). Discriminant
validity is used to shows the differentiation between
constructs. Therefore, for formative scales measurements,
discriminant validity is not needed (Hair et al., 2013). In
order to assess discriminant validity, two measures are
chosen such as the cross loadings and Fornell-Larcker
criterion (Hair et al., 2013; Henseler et al., 2009). In cross
loading criterion, comparing with the rest of its cross
loadings, the loading of each indicator must be greater to
ascertain discriminant validity (Götz et al., 2010; Hair et
al., 2013), for the second criterion based on Fornell-
Larcker, the adequate discriminant validity is shown
through the AVE of each latent variable is greater than the
latent variable‘s higher squared correlation with other latent
variable in the model. Table 13 shows discriminant validity
of constructs, the result of this study shows that the squared
correlations for each construct is less than the average
variance, which is extracted by the indicators measuring

Journal of Soft Computing and Decision Support Systems 3:6 (2016) 1-15
11
JSCDSS
E-ISSN: 2289-8603
that construct indicating adequate discriminant validity.
Thus, the discriminant validity criteria namely similar
latent variables are fully satisfied and were classified with
high loadings. On the other hand, dissimilar variables were
classified with very low loadings. Generally, the model of
measurement proposed sufficient discriminant and
convergent validity.
Table 13
Discriminant Validity of Constructs - Fornell-Larcker Criterion (Latent Variable Correlation)
Auth Comp Eas IndPer Loc ProTi Qul Rel SysRel
Auth F
Comp 0.053 F
Eas 0.100 0.042 F
IndPer 0.299 0.184 0.195 0.733
Loc -0.086 0.011 0.088 0.127 F
ProTi -0.018 0.079 0.045 0.258 0.010 F
Qul 0.226 0.017 0.114 0.399 0.154 0.021 F
Rel 0.056 0.117 0.108 0.264 0.240 0.590 0.067 F
SysRel 0.123 0.158 0.009 0.267 -0.003 0.204 0.173 0.078 F
*Note: Diagonals (in bold) represent the squared root of average variance extracted (AVE) while the other entries represent the
correlations. *F: Formative, Auth= Authorization, Comp= Compatibility, Eas= Ease of Use/Training, IndPer=Individual Performance,
Loc= Locatability, ProTi= Production Timeliness, Qul=Quality, Rel= Relationship With Users, SysRel=Systems Reliability
In this study, descriptive statistics of the latent constructs
refers to values of all the variables to be greater than the
midpoint 2.50. Table 14 shows the descriptive statistics of
167 respondents. Individual performance indicated the
lowest mean value at 3.00 while locatability showed the
highest with a mean value of 4.50. Standard deviation
reported the dispersion values were less than 1 in all the
variables. In the research model, the association between
latent variables that hypothesized is represented by
structural model (Duarte and Raposo, 2010). According to
(Chin, 2010), the structural portion of the model provide
evidence to support the theoretical model is necessary as
demonstrated. Three criteria are required to find out the
relationships between latent variables that were
hypothesized in the study model same as the way of the
evaluation of measurement model (Henseler et al., 2009).
The criterion is founded on, estimates for path coefficients,
R2 of endogenous latent variables, predictive relevance
(Q2). The main evaluation criterion for showing the
appropriateness of structural model is R2 measure. R2 is
the degree of significance of the path coefficients and the
coefficient of determination (Hair et al., 2011; Henseler et
al., 2009). The main target is to have a higher R2 since the
PLS-SEM aims to explain the endogenous latent variance.
According to Cohen (1988), R2 having 0.02 - 0.12 is
considered as weak, 0.13 - 0.25 is moderate and 0.26 and
above is substantial. The decision of what R2 level is high
based on the specific research context (Hair et al., 2011).
The findings of this research study show that R2 value for
individual performance is 0.521.
Table 14
Descriptive Statistics (N=167)
No. of Items Min Max Mean** Std. Dev.
Qul 6 3.33 5.00 4.449 0.318
Loc 4 4.50 5.00 4.756 0.167
Auth 2 4.00 5.00 4.575 0.309
Comp 3 4.00 5.00 4.613 0.336
ProTi 2 3.50 5.00 4.671 0.367
SysRel 3 4.00 5.00 4.585 0.344
Eas 4 3.75 5.00 4.540 0.261
Rel 10 3.60 5.00 4.602 0.289
IndPer 6 3.00 4.67 3.755 0.382
Valid N (listwise): 167 40
**If the mean for each construct is close to the median, it implies that data has tendency to be symmetrical and normally distributed. Since
this research predominantly uses Smart PLS, the issue of normality is not relevant (Hamilton, 2013). Comp= Compatibility, ProTi=
Production Timeliness, Auth= Authorization, IndPer=Individual Performance, Rel= Relationship With Users, Eas= Ease of Use/Training,
Loc= Locatability, Qul=Quality, SysRel=Systems Reliability.

Journal of Soft Computing and Decision Support Systems 3:6 (2016) 1-15
12
JSCDSS
E-ISSN: 2289-8603
Fig. 2. Coefficients between Independent Variable, and Dependent Variable
Auth= Authorization, Comp= Compatibility, Eas= Ease of Use/Training, IndPer=Individual Performance, Loc=
Locatability, ProTi= Production Timeliness, Qul=Quality, Rel= Relationship With Users, SysRel=Systems Reliability
Fig. 2 shows path coefficients relationships between
dependent and independent variable. In the PLS structural
model, the second criteria is the individual path coefficients
that can be considered as standardized beta coefficients of
common minimum square regression (Götz et al., 2010).
Each path coefficient‘s value can be retrieved over a
bootstrapping method where significant paths indicating the
hypothesized direction empirically that support the
recommended fundamental relationship or vice-versa
(Efron, 1979; Hair et al., 2011; Yung and Bentler, 1994).
Bootstrapping in PLS is a nonparametric assessment that
contains continues random sampling by replacement from
the original sample to achieve standard errors for
hypothesis testing and to construct a bootstrap sample (Hair
et al., 2011). According to Chin (2010), bootstrapping with
1000 resamples based on the number of re-sampling, while
later Henseler et al. (2009) proposed 5000 resampling. The
bootstrapping with 5000 re-samples was used to examine
the significance of the path coefficients, which have values
between -1 and +1. It means if the value close to +1 there is
strong positive linear relationship if the value near -1, it
shows negative linear relationship (Hair et al., 2013). The
last criterion is the evaluation of predictive relevance (Q2).
It has identified as the Stone-Geisser‘s Q2 can be used as a
standard to predict relationships likewise considering at the
magnitude of the R2. This technique shows a combination
of cross function and validation with the view of the
potential observable or prediction of observable is more
appropriate than the estimation of artificial constructs
parameters (Geisser, 1975). Henseler et al. (2009)
emphasized to used it for evaluating the capability of
research model for prediction purposes. Adaption of this
approach in PLS leads to a blindfolding procedure that
ignores a part of the data for a specific set of indicators
throughout parameter assessments and attempts to
evaluation the omitted part utilizing the estimated
parameters (Chin, 2010). Q2 assesses the predictive
validity of a model based on the blindfolding procedure
through PLS. Q2 value is larger than zero and indicates the
exogenous constructs that is systematic related to
endogenous construct (Hair et al., 2011).
The Results of Structural Model
Eight direct relationships were hypothesized in the
current study. The finding shows that three of them have
been supported. The results of structural model for direct
relationships are shown in Table 15. The result of each
direct relationship is explained as follow, separately.

Journal of Soft Computing and Decision Support Systems 3:6 (2016) 1-15
13
JSCDSS
E-ISSN: 2289-8603
Table 15
The Results of Structural Model (Direct Relationships)
Hypothesis Relationship Bea SE t-value Decision
Direct relationships
H1 Qul >IndPer 0.233 0.065 3.613** Supported
H2 Loc >IndPer 0.066 0.068 0.970 Not Supported
H3 Auth>IndPer 0.175 0.055 3.184** Supported
H4 Comp>IndPer 0.193 0.145 1.328 Not Supported
H5 ProTi>IndPer 0.145 0.060 2.418** Supported
H6 SysRel>IndPer 0.091 0.059 1.553 Not Supported
H7 Eas -> IndPer 0.042 0.053 0.786 Not Supported
H8 Rel -> IndPer 0.027 0.071 0.383 Not Supported
*Significant at p<0.05, **Significant at p<0.01
Auth= Authorization, Comp= Compatibility, Eas= Ease of Use/Training, IndPer=Individual Performance, Loc=
Locatability, ProTi= Production Timeliness, Qul=Quality, Rel= Relationship With Users, SysRel=Systems Reliability
The results of the structural model in task technology fit
on individual performance are as follow: H1 – there is a
positive relationship between quality and individual
performance (β=0.233, p<0.01). Therefore, quality plays an
important role in increasing individual performance. H2 –
there is not a significant relationship between Locatability
and individual performance (β=0.066). H3 – there is a
positive relationship between authorization and individual
performance (β=0.233, p<0.01). Therefore, authorization
plays an important role in individual performance. H4 –
there is no a significant relationship between compatibility
and individual performance (β=0.193). H5 – there is a
positive relationship between production timeliness and
individual performance (β=0.145, p<0.01). Therefore,
production timeliness plays an important role in increasing
individual performance. H6 – there is no significant
relationship between systems reliability and individual
performance (β=0.091). H7 – there is no significant
relationship between ease of use/training and individual
performance (β=0.042). H8 – there is no significant
relationship between users and individual performance
(β=0.027). Path coefficients between independent and
dependent variables relationships are shown in Fig. 3.
Fig. 3. Path Coefficients
Journal of Soft Computing and Decision Support Systems 3:6 (2016) 1-15
14
JSCDSS
E-ISSN: 2289-8603
5. Conclusions
As a summary for this study, the five star hotels of
Malaysia and representatives‘ profiles of the sample were
presented. Independent two-group t-test indicated that the
effect size was not a threat in this study; the similarities
were established between early and late answers and
between online and hard copy questionnaires. Furthermore,
the result of using the measurement model showed
satisfactory by the evidence of convergent validity,
adequate reliability, and discriminant validity. In addition
the indicators reliability, cross loading and main loading of
items also was tested. In following, the structural model
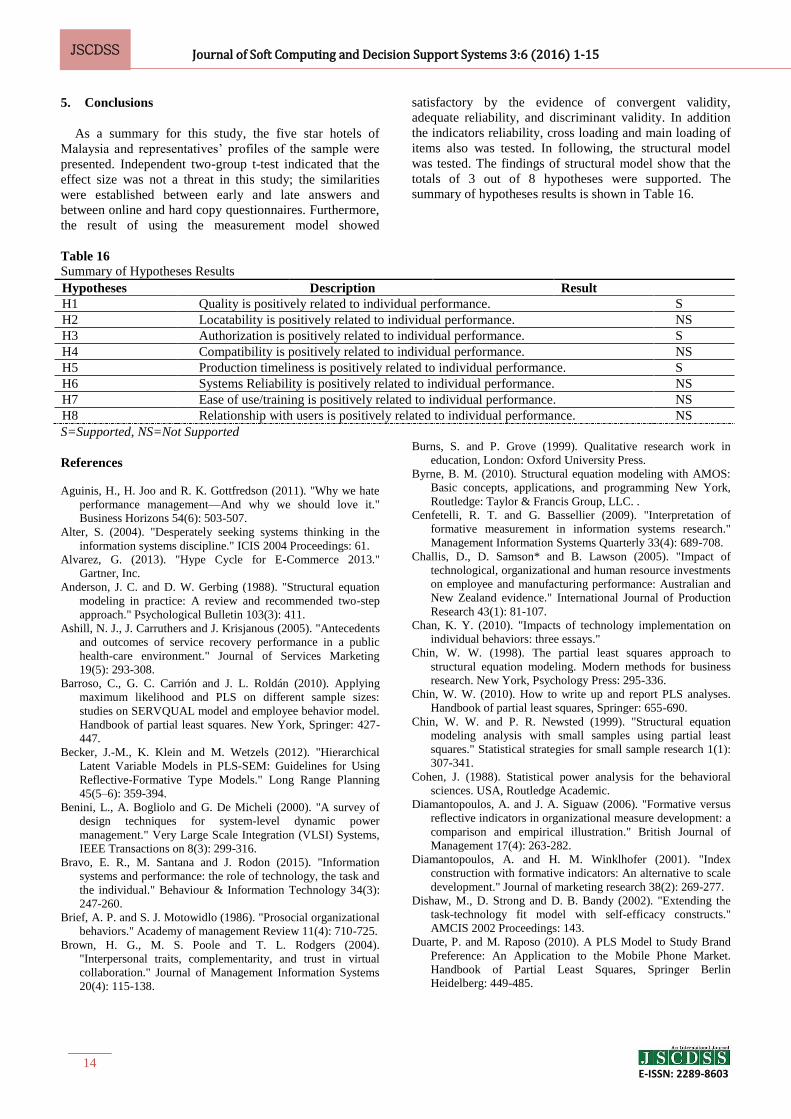
was tested. The findings of structural model show that the
totals of 3 out of 8 hypotheses were supported. The
summary of hypotheses results is shown in Table 16.
Table 16
Summary of Hypotheses Results
Hypotheses Description Result
H1 Quality is positively related to individual performance. S
H2 Locatability is positively related to individual performance. NS
H3 Authorization is positively related to individual performance. S
H4 Compatibility is positively related to individual performance. NS
H5 Production timeliness is positively related to individual performance. S
H6 Systems Reliability is positively related to individual performance. NS
H7 Ease of use/training is positively related to individual performance. NS
H8 Relationship with users is positively related to individual performance. NS
S=Supported, NS=Not Supported
References
Aguinis, H., H. Joo and R. K. Gottfredson (2011). "Why we hate
performance management—And why we should love it."
Business Horizons 54(6): 503-507.
Alter, S. (2004). "Desperately seeking systems thinking in the
information systems discipline." ICIS 2004 Proceedings: 61.
Alvarez, G. (2013). "Hype Cycle for E-Commerce 2013."
Gartner, Inc.
Anderson, J. C. and D. W. Gerbing (1988). "Structural equation
modeling in practice: A review and recommended two-step
approach." Psychological Bulletin 103(3): 411.
Ashill, N. J., J. Carruthers and J. Krisjanous (2005). "Antecedents
and outcomes of service recovery performance in a public
health-care environment." Journal of Services Marketing
19(5): 293-308.
Barroso, C., G. C. Carrión and J. L. Roldán (2010). Applying
maximum likelihood and PLS on different sample sizes:
studies on SERVQUAL model and employee behavior model.
Handbook of partial least squares. New York, Springer: 427-
447.
Becker, J.-M., K. Klein and M. Wetzels (2012). "Hierarchical
Latent Variable Models in PLS-SEM: Guidelines for Using
Reflective-Formative Type Models." Long Range Planning
45(5–6): 359-394.
Benini, L., A. Bogliolo and G. De Micheli (2000). "A survey of
design techniques for system-level dynamic power
management." Very Large Scale Integration (VLSI) Systems,
IEEE Transactions on 8(3): 299-316.
Bravo, E. R., M. Santana and J. Rodon (2015). "Information
systems and performance: the role of technology, the task and
the individual." Behaviour & Information Technology 34(3):
247-260.
Brief, A. P. and S. J. Motowidlo (1986). "Prosocial organizational
behaviors." Academy of management Review 11(4): 710-725.
Brown, H. G., M. S. Poole and T. L. Rodgers (2004).
"Interpersonal traits, complementarity, and trust in virtual
collaboration." Journal of Management Information Systems
20(4): 115-138.
Burns, S. and P. Grove (1999). Qualitative research work in
education, London: Oxford University Press.
Byrne, B. M. (2010). Structural equation modeling with AMOS:
Basic concepts, applications, and programming New York,
Routledge: Taylor & Francis Group, LLC. .
Cenfetelli, R. T. and G. Bassellier (2009). "Interpretation of
formative measurement in information systems research."
Management Information Systems Quarterly 33(4): 689-708.
Challis, D., D. Samson* and B. Lawson (2005). "Impact of
technological, organizational and human resource investments
on employee and manufacturing performance: Australian and
New Zealand evidence." International Journal of Production
Research 43(1): 81-107.
Chan, K. Y. (2010). "Impacts of technology implementation on
individual behaviors: three essays."
Chin, W. W. (1998). The partial least squares approach to
structural equation modeling. Modern methods for business
research. New York, Psychology Press: 295-336.
Chin, W. W. (2010). How to write up and report PLS analyses.
Handbook of partial least squares, Springer: 655-690.
Chin, W. W. and P. R. Newsted (1999). "Structural equation
modeling analysis with small samples using partial least
squares." Statistical strategies for small sample research 1(1):
307-341.
Cohen, J. (1988). Statistical power analysis for the behavioral
sciences. USA, Routledge Academic.
Diamantopoulos, A. and J. A. Siguaw (2006). "Formative versus
reflective indicators in organizational measure development: a
comparison and empirical illustration." British Journal of
Management 17(4): 263-282.
Diamantopoulos, A. and H. M. Winklhofer (2001). "Index
construction with formative indicators: An alternative to scale
development." Journal of marketing research 38(2): 269-277.
Dishaw, M., D. Strong and D. B. Bandy (2002). "Extending the
task-technology fit model with self-efficacy constructs."
AMCIS 2002 Proceedings: 143.
Duarte, P. and M. Raposo (2010). A PLS Model to Study Brand
Preference: An Application to the Mobile Phone Market.
Handbook of Partial Least Squares, Springer Berlin
Heidelberg: 449-485.

Journal of Soft Computing and Decision Support Systems 3:6 (2016) 1-15
15
JSCDSS
E-ISSN: 2289-8603
Efron, B. (1979). "Bootstrap methods: another look at the
jackknife." The annals of Statistics 7(1): 1-26.
Fricker, R. D. and M. Schonlau (2002). "Advantages and
disadvantages of Internet research surveys: Evidence from the
literature." Field Methods 14(4): 347-367.
Gable, G. G., D. Sedera and T. Chan (2008). "Re-conceptualizing
information system success: The IS-impact measurement
model." Journal of the association for information systems
9(7): 18.
Geisser, S. (1975). "The predictive sample reuse method with
applications." Journal of the American Statistical Association
70(350): 320-328.
Goodhue, D. L. (1998). "Development and measurement validity
of a task‐ technology fit instrument for user evaluations of
information system." Decision Sciences 29(1): 105-138.
Goodhue, D. L. (2006). "Task-technology fit." Human-Computer
Interaction and Management Information Systems:
Foundations: 184-204.
Goodhue, D. L. and R. L. Thompson (1995). "Task-technology fit
and individual performance." MIS quarterly: 213-236.
Götz, O., K. Liehr-Gobbers and M. Krafft (2010). Evaluation of
structural equation models using the partial least squares
(PLS) approach. Handbook of partial least squares. New
York, Springer: 691-711.
Hair, J., W. Black and B. Babin (2010). Anderson. RE, 2010.
Multivariate Data Analysis, New Jersey: Pearson Education
Inc.
Hair, J. F., M. W. Celsi, A. H. Money, P. Samouel and M. J. Page
(2003). Essentials of business research methods, ME Sharpe.
Hair, J. F., G. T. M. Hult, C. Ringle and M. Sarstedt (2013). A
primer on partial least squares stratctural equation modeling
(PLS-SEM). United States of America, SAGE Publication,
Inc.
Hair, J. F., C. M. Ringle and M. Sarstedt (2011). "PLS-SEM:
Indeed a silver bullet." The Journal of Marketing Theory and
Practice 19(2): 139-152.
Hair, J. F., M. Sarstedt, C. M. Ringle and J. A. Mena (2012). "An
assessment of the use of partial least squares structural
equation modeling in marketing research." Journal of the
Academy of Marketing Science 40(3): 414-433.
Hamilton, L. C. (2013). Statistics with STATA. USA, Books/Cole
CENGAGE Learning.
Hari Suryaningrum, D. (2012). "ASSESSING INDIVIDUAL
PERFORMANCE ON INFORMATION TECHNOLOGY
ADOPTION: A NEW MODEL." Global Journal of Business
Research (GJBR) 6(4).
Henseler, J., C. Ringle and R. Sinkovics (2009). "The use of
partial least squares path modeling in international
marketing." Advances in International Marketing (AIM) 20:
277-320.
Ho, R. (2006). Handbook of univarite and multivarite data
analysis and interpretattion with SPSS. United States of
America, Taylor & Francis group, LLC.
Honeycutt, E. D., T. Thelen, S. T. Thelen and S. K. Hodge (2005).
"Impediments to sales force automation." Industrial Marketing
Management 34(4): 313-322.
Klopping, I. M. and E. McKinney (2004). "Extending the
technology acceptance model and the task-technology fit
model to consumer e-commerce." Information technology
learning and performance journal 22: 35-48.
Lohmöller, J.-B. (1989). Latent variable path modeling with
partial least squares, Physica-Verlag Heidelberg.
Lynch, P. D., R. Eisenberger and S. Armeli (1999). "Perceived
organizational support: Inferior versus superior performance
by wary employees." Journal of Applied Psychology 84(4):
467.
Lyytinen, K. and M. Newman (2008). "Explaining information
systems change: a punctuated socio-technical change model."
European Journal of Information Systems 17(6): 589-613.
McGill, T. J. and V. J. Hobbs (2006). "E-learning and task-
technology fit: A student and instructor comparison."
Morris, M. G. and V. Venkatesh (2010). "Job characteristics and
job satisfaction: understanding the role of enterprise
resource." Management Information Systems Quarterly 34(1):
9.
Petter, S., W. DeLone and E. McLean (2008). "Measuring
information systems success: models, dimensions, measures,
and interrelationships." European journal of information
systems 17(3): 236-263.
Ramayah, T., J. Lee and J. In (2011). "Network collaboration and
performance in the tourism sector." Service Business 5(4):
411-428.
Ramayah, T., M. Osman, O. Azizah, M. Malliga and Y. A. L.
Jasmine (2013). Green Manufacturing Practices and
Performance among SMEs: Evidence from a Developing
Nation. Green technologies and business practices : an IT
approach. H. A. Probst. USA, Information Science Reference:
208-225.
Rangarajan, D., E. Jones and W. Chin (2005). "Impact of sales
force automation on technology-related stress, effort, and
technology usage among salespeople." Industrial Marketing
Management 34(4): 345-354.
Roscoe, J. T. (1969). Fundamental research statistics for the
behavioral sciences, Holt, Rinehart and Winston New York.
Schrier, T., M. Erdem and P. Brewer (2010). "Merging task-
technology fit and technology acceptance models to assess
guest empowerment technology usage in hotels." Journal of
Hospitality and Tourism Technology 1(3): 201-217.
Sekaran, U. and R. Bougie (2010). Research Methods for
Business: A Skill Building Approach. United Kingdom, John
Wiley and Sons.
Strong, D. M., M. T. Dishaw and D. B. Bandy (2006). "Extending
task technology fit with computer self-efficacy." ACM
SIGMIS Database 37(2-3): 96-107.
Sundaram, S., A. Schwarz, E. Jones and W. W. Chin (2007).
"Technology use on the front line: how information
technology enhances individual performance." Journal of the
Academy of Marketing Science 35(1): 101-112.
Teo, T. S. and B. Men (2008). "Knowledge portals in Chinese
consulting firms: a task–technology fit perspective." European
Journal of Information Systems 17(6): 557-574.
Urbach, D.-W.-I. N., S. Smolnik and G. Riempp (2009). "The
state of research on information systems success." Business &
Information Systems Engineering 1(4): 315-325.
Usoro, A., S. Shoyelu and M. Kuofie (2010). "Task-technology fit
and technology acceptance models applicability to e-tourism."
Journal of Economic Development, Management, IT, Finance
and Marketing 2(1): 1-32.
West, D. M. (2004). "E‐ government and the transformation of
service delivery and citizen attitudes." Public administration
review 64(1): 15-27.
Wilkinson, D. and P. Birmingham (2003). Using research
instruments: A guide for researchers, Psychology Press.
Williams, L. J. and S. E. Anderson (1991). "Job satisfaction and
organizational commitment as predictors of organizational
citizenship and in-role behaviors." Journal of management
17(3): 601-617.
WTTC (2014). "Travel & Tourism Economic Impact 2014
Malaysia." World Travel & Tourism Council.
Yung, Y. F. and P. M. Bentler (1994). "Bootstrap‐ corrected ADF
test statistics in covariance structure analysis." British Journal
of Mathematical and Statistical Psychology 47(1): 63-84.