journal of power sources - university of california, san...
TRANSCRIPT

GD
Ja
b
c
a
ARRAA
KPELGF
1
eFctitahebtg
fitpt
(
0d
Journal of Power Sources 210 (2012) 263– 275
Contents lists available at SciVerse ScienceDirect
Journal of Power Sources
jo ur nal homep age: www.elsev ier .com/ locate / jpowsour
enetic identification and fisher identifiability analysis of theoyle–Fuller–Newman model from experimental cycling of a LiFePO4 cell
oel C. Formana, Scott J. Mourab, Jeffrey L. Steina, Hosam K. Fathyc,∗
The University of Michigan, Ann Arbor, MI 48109, USAUniversity of California San Diego, San Diego, CA 92093, USAThe Pennsylvania State University, University Park, PA 16802, USA
r t i c l e i n f o
rticle history:eceived 23 December 2011eceived in revised form 4 March 2012ccepted 6 March 2012vailable online xxx
eywords:
a b s t r a c t
This article examines the problem of identifying the physical parameters of fundamentalelectrochemistry-based battery models from non-invasive voltage/current cycling tests. The article isparticularly motivated by the problem of fitting the Doyle–Fuller–Newman (DFN) battery model tolithium-ion battery cycling data. Previous research in the literature identifies subsets of the DFN model’sparameter experimentally. In contrast, this article makes the two unique contributions of: (i) identifyingthe full set of DFN model parameters from cycling data using a genetic algorithm (GA), and (ii) assessing
arameter identificationlectrochemical battery modelingi-ion batteriesenetic algorithmsisher information
the accuracy and identifiability of the resulting full parameter set using Fisher information. The specificbattery used within this study has lithium iron phosphate cathode chemistry and is intended for high-power applications such as plug-in hybrid electric vehicles (PHEVs). We use seven experimental cyclingdata sets for model fitting and validation, six of them derived from PHEV drive cycles. This makes theidentified parameter values appropriate for PHEV battery simulation and model-based design and controloptimization.
© 2012 Elsevier B.V. All rights reserved.
. Introduction
This article examines the problem of identifying the param-ters of the electrochemical battery model developed by Doyle,uller, and Newman (DFN) [1,2] using noninvasive voltage–currentycling experiments. The article presents a framework for solvinghis problem, consisting of a genetic algorithm (GA) for parameterdentification combined with Fisher information-based estima-ion of parameter identifiability and identification errors. Wepply this framework to LiFePO4 battery cells intended for plug-inybrid electric vehicles (PHEVs). The ultimate goal is to obtain anxperimentally validated, electrochemistry-based model of theseatteries that can enable the optimization of PHEV design and con-rol for objectives such as reducing PHEV fuel consumption andreenhouse gas emissions [3].
The DFN model is well-suited for this study because it is arst-principles electrochemical model that can capture high-rate
ransient effects. In contrast to equivalent circuit models, first-rinciples models make it easier to relate model parameters backo physical quantities (such as diffusivity and porosity). This is∗ Corresponding author. Tel.: +1 814 867 4442; fax: +1 814 865 7222.E-mail addresses: [email protected] (J.C. Forman), [email protected]
S.J. Moura), [email protected] (J.L. Stein), [email protected] (H.K. Fathy).
378-7753/$ – see front matter © 2012 Elsevier B.V. All rights reserved.oi:10.1016/j.jpowsour.2012.03.009
important because one of our goals is to investigate the accuracywith which one can estimate these physical quantities from non-invasive voltage and current data. The DFN model also captureshigh-rate transient effects typical of PHEV applications. In particu-lar, a recent study by Santhanagopalan et al. shows that the DFNmodel fits battery behavior above 1 C current rates better thana single particle model (SPM) [4]. The DFN model achieves theseadvantages over the SPM in part by modeling spatial distributionsof lithium across the width of the anode, separator, and cathode.These effects are ignored in SPMs.
A significant body of literature already exists on battery parame-ter identification using different models and identification methodsfor different parameter sets. Here we focus exclusively on identi-fication methods that, like our own work, are intended for offlineuse. Santhanagopalan et al., for instance, successfully identify a sub-set of five parameter values under constant charge and dischargeconditions for both the DFN and SPM models [4]. In both cases,the Levenberg–Marquardt optimization algorithm is used to obtainparameters that minimize model error. Speltino et al. success-fully identify the parameters of a single-particle model of batterydynamics using a two-step process: they first identify the cathode
equilibrium potential function from open circuit voltage measure-ments, assuming a known anode equilibrium potential functionfrom the literature. They subsequently perform dynamic tests toestimate the remaining model parameters [5]. Schmidt et al. also
2 ower Sources 210 (2012) 263– 275
seseHctess
Itpwjhsmpbtapoapibmaitttimmuppvvbt
2TtDabDtmdFeda
2
A
64 J.C. Forman et al. / Journal of P
uccessfully identify a single-particle battery model, with severalxtensions that incorporate temperature information and relateolid diffusion to state of charge [6]. The study by Schmidt et al. alsoxamines parameter uncertainty using Fisher information. Finally,u et al. successfully identify the parameters of an equivalent cir-uit battery model using a genetic algorithm [7]. They focus on twoypes of batteries, one of which is the A123 Systems 26650 cellxamined in this article. Their equivalent circuit formulation is aet of n parallel resistor–capacitor pairs connected to each other ineries.
The above literature provides a rich background for this article.n contrast to that background, this work achieves a combina-ion of five important goals never pursued simultaneously in therevious literature – to the best of the authors’ knowledge. First,e focus on identifying parameters of the DFN model: a choice
ustified by this model’s first-principles nature and suitability forigh-rate transient battery operation. Second, we identify the fullet of parameters (88 scalars and function control points) of the DFNodel using a genetic algorithm, as opposed to a subset of these
arameters. Third, we perform this identification using multipleattery cycles derived from vehicle drive cycles. (Note, altogether,hese three choices of battery model, identification parameters,nd cycling data represent an overarching goal of obtaining a DFNarameter set suitable for PHEV simulation and design/controlptimization.) Fourth, we use Fisher information to assess theccuracy of all 88 DFN model parameters, as opposed to com-uting Fisher information for a subset of these parameters. This
s extremely important, because a parameter deemed identifiableased on Fisher information computation for a small parameter setay lose identifiability when one computes Fisher information for
larger parameter set. Finally, we qualitatively correlate the Fishernformation-based identifiability results to physical insights abouthe dominant dynamics in the LiFePO4 battery for the test condi-ions examined herein. These two final contributions distinguishhis article from an earlier paper by the authors that qualitativelynvestigated DFN parameter uncertainty using the identifiability
atrix [8]. Results in this earlier paper suggest that while the DFNodel can fit battery cycling data well, certain parameters remain
nidentifiable. This article enhances these results by quantifyingarameter uncertainty via Fisher information. Fisher informationrovides a minimum variance bound for the estimated parametersia the Cramér-Rao inequality [9–13]. In addition, this article pro-ides original insights about the dominant dynamics in the LiFePO4attery under the tests considered herein, and relates these insightso parameter uncertainties.
The remainder of this article is organized as follows. Section describes the experiments used for identifying the DFN model.his includes a discussion of the experimental setup along withhe various PHEV drive cycle inputs. Section 3 summarizes theFN model. Sections 4 and 5 describe the unknown parameter setnd genetic optimization algorithm, respectively. Section 5 alsoriefly describes model reduction methods used to simulate theFN model, including quasi-linearization and modal decomposi-
ion [14,15]. Section 6 presents validation studies for the identifiedodel. This includes voltage and power trajectories of validation
ata along with probability density plots summarizing the errors.inally, Section 7 presents the Fisher information results on param-ter accuracy analysis along with conjectures about dominantynamics based on parameter uncertainty. Section 8 summarizesnd concludes the paper.
. Experimental setup
The battery cells examined in this article are A123 SystemsNR26650M1 cells with LiFePO4 cathodes. These cells have a
Fig. 1. Photograph of experimental battery tester.
2.3A-h nominal capacity when fresh, a nominal voltage of 3.3 V, anda maximum continuous discharge current of 70 A (30.4 C-rate). Thecells are intended for transient high-power applications includingcommercial PHEVs, PHEV conversion kits, and portable power tools.Experimental cycling data sets have been collected for these cellsusing a custom-built battery tester. This tester is capable of highlytransient current/voltage profiles and can switch quickly betweencharging and discharging. These characteristics make it ideal fortesting batteries under conditions similar to those experienced inPHEV battery packs. Additionally, this setup is capable of battery-in-the-loop studies, which will be advantageous for future batterycontrol and estimation research [16].
The above battery tester combines three major hardware com-ponents: an electric load (Sorenson SLH-60-120-1200), a powersupply (Sorenson DSC20-50E), and a Real-Time (RT) controller andI/O board (dSpace DS1104). Fig. 1 is a photograph of the batterytester, and Fig. 2 is a schematic of the setup where all signal linesare connected to the I/O board. The power supply and electric loadhandle battery charging and discharging, respectively. The RT I/Oboard coordinates the electric load, power supply, and switchingboard. In addition, the RT I/O board records sensor signals includ-ing voltage and current. These signals are exchanged among thesetup’s various components in a variety of formats, including theanalog, digital, PWM, SMBus, RS-232, and TTL formats. The switchboard swaps the setup between charging and discharging by swap-ping the battery’s connection between the power supply and load.The Schottky diode protects the power supply from absorbing bat-tery energy. The battery sensor board measures battery voltagethrough a voltage-isolating differential op-amp, and measures bat-tery current via a bi-directional ±20 A Hall effect sensor (AllegroMicrosystems ACS714). Finally, all the battery interface electronicsare implemented on custom-build Printed Circuit Boards (PCBs) tomaximize overall setup reliability, which is critical for long-termtests.
Seven battery cycling tests have been conducted using thisbattery tester: two for model identification and five for valida-tion. All of these tests initialize the battery SoC to 90% (3.35 Vrelaxed), then subject the battery to a given current profile andmeasure the resulting battery voltage. In the first identificationdata set, the current profile consists of a Chirp sequence of threeCCCV charge/discharge patterns between 2.0 V and 3.6 V, withcharge/discharge rates of 5 C, 2.5 C, and 1 C. In the remaining tests,the current profiles are generated by simulating a PHEV pow-ertrain for a given vehicle drive cycle (i.e., velocity-versus-timeprofile). Two of these vehicle drive cycles correspond to the morn-
ing and evening commutes of a real human driver in a naturalisticdriving study conducted by the University of Michigan Transporta-tion Research Institute (UMTRI) [17]. These drive cycles are exact
J.C. Forman et al. / Journal of Power Sources 210 (2012) 263– 275 265
xperim
rsTrpbwemodtkma2bFt
3
dtitcimaa
taai
The DFN model captures local Li-ion concentrations and poten-tials using coupled partial differential equations (PDEs). ThesePDEs account for the linear diffusion of Li-ions in the electrolyte,
Fig. 2. Schematic of e
ecordings of driver behavior using mid-sized sedans, these twopecific cycles correspond to the same sedan on the same day.hese battery tests are denoted as Naturalistic1 and Naturalistic2,espectively. The four remaining battery tests correspond to multi-le repetitions of standard vehicle certification drive cycles. Theseattery tests are denoted by UDDSx2, US06x3, SC03x4, and LA92x2,here the number in “x#” refers to the number of drive cycle rep-
titions [18]. For each of these drive cycle-based battery tests, aid-size power-split sedan PHEV is simulated with a previously
ptimized power management algorithm [19] to map the vehiclerive cycles to battery current profiles. This PHEV has a 5 kWh bat-ery pack consistent with existing Toyota Prius PHEV conversionits. Due to sensor limitations, drive cycles that produce currentagnitudes greater than 20 A (namely, US06x3, SC03x2, and LA92x2)
re scaled down such that their maximum amplitude over time is0 A [18]. Specifically, this scaling divides the current trajectoryy its maximum current and then multiplies the trajectory by 20.inally, the resulting current profiles are applied to the battery cello obtain data sets for identification and validation.
. The Doyle–Fuller–Newman battery model
The DFN model is an electrochemical battery model thatescribes the dynamics of concentration and potential distribu-ions across the width of the cell as well as concentration profilesn the porous electrodes of the anode and cathode. Spatial distribu-ions across the width of the cell play an important role in high-rateharge and discharge dynamics, typical of PHEV cycles. The models described thoroughly in [1,2,20]. This section summarizes the
odel equations, which constitute a nonlinear partial differentiallgebraic equation system. Appendix contains the model’s bound-ry conditions.
As seen in Fig. 3, a Li-ion battery cell consists of an anode, separa-
or, and cathode sandwiched between current collectors. Both thenode and cathode are made of porous solid material immersed inn electrolyte solution. When the battery is fully charged, lithiumons occupy interstitial sites in the anode-side solid material. As theental battery tester.
battery discharges, the Li-ions leave these interstitial sites, enteringthe electrolyte solution. The Li-ions then migrate through the solu-tion from the anode to the separator, and eventually the cathode.The discharging process concludes with the lithium ions comingto rest at interstitial sites in the cathode-side solid material. Whena Li-ion leaves its interstitial site in the anode an electron is freedto flow through the external circuit, producing useful work. Whenthis electron reaches the cathode it causes a Li-ion to bond with acathode interstitial site. Charging the battery is the same process inreverse, with the external circuit providing rather than consumingenergy.
Fig. 3. Li-ion cell schematic.

266 J.C. Forman et al. / Journal of Power S
Table 1Unknown parameters.
Name Unit Description
Ln m Anode thicknessLs m Separator thicknessLp m Cathode thicknessRn m Anode particle radiusRp m Cathode particle radiust+ – Transference numberb – Brugman numberd2 m2 s−1 Solution diffusivityε2n – Anode solution volume fractionε2s – Separator solution volume fractionε2p – Cathode solution volume fractiond1n m2 s−1 Anode solid diffusivityd1p m2 s−1 Cathode solid diffusivitykn (A m−2) (mol m−3)1+˛ Anode reaction ratekp (A m−2) (mol m−3)1+˛ Cathode reaction rateRSEI � m2 Anode film thicknessc2 mol m−3 Initial solution concentration
unrefi V Anode equilibrium potentialfunction: control point i
uprefi V Cathode equilibrium potentialfunction: control point i
−1 −1
sdbbat
gcs
ε
adbf
waWtm[
tg
J
i
fr
interpolate between these points [30]. The third function is �eff(c ),
�i � m Solution conductivity function:control point i
pherical diffusion of Li-ions in the solid, and the spatiallyistributed electrochemical reactions driving them to transferetween the solution and the solid. The remainder of this sectionriefly outlines these equations. The parameters of these equationsre summarized in Table 1 and all of the boundary conditions forhese equations are summarized in Appendix.
The concentration of Li-ions within the electrolyte c2(x, t) isoverned by Fick’s law of linear diffusion combined with an inter-alation current density term, J, transferring Li-ions between theolution and solid:
2∂c2
∂t(x, t) = ∂
∂x
(deff
2∂c2
∂t(x, t)
)+ 1 − t+
FJ(x, t) (1)
The above intercalation reaction current density, J, also acts asn input to the dynamics of Li-ion diffusion within the solid. Thisiffusion occurs at every point in the anode and cathode and cane modeled using a spherical, radially symmetric diffusion law asollows:
∂c1,j
∂t(r, t) = d1,j
r2
∂
∂r
(r2 ∂c1,j
∂r(r, t)
)(2)
here we note that while radial spherical diffusion is an appropri-te model for the anode, it is only an approximation for the cathode.e refer the interested reader to papers on both understanding
he behavior of the LiFePO4 cathode [21–23] and agglomerate typeodels that capture various aspects of the electrode’s behavior
24–29].The intercalation reaction current density, J, is driven by poten-
ial differences between the solid and electrolyte solution, asoverned by the Butler–Volmer equation:
(x, t) = aji0,j
[exp
(˛a,jF
R̄T�j(x, t)
)− exp
(−˛c,jF
R̄T�j(x, t)
)](3)
0,j = kj(cmax1,j − cS
1,j)˛a,j (cS
1,j)˛c,j (c2)˛a,j , j = n, p (4)
The overpotentials in the above equations, �j, equal the dif-erences between the solid and solution potentials minus theeference potentials for the main intercalation reaction, which in
ources 210 (2012) 263– 275
turn depend on the local states of charge. Mathematically the over-potentials are given by:
�p(x, t) = �1(x, t) − �2(x, t) − upref (x, t) (5)
�n(x, t) = �1(x, t) − �2(x, t) − unref (x, t) − J(x, t)an
RSEI (6)
Since potentials and overpotentials described above havedynamics orders of magnitude faster than the Li-ion concentra-tions, they are assumed to respond instantaneously. The solidpotential is governed by Ohm’s law with a source term governingthe charge transfer due to intercalation:
∂
∂x
(�eff
j
∂�1,j
∂x(x, t)
)− J(x, t) = 0 (7)
Similarly, the solution potential is governed by Ohm’s law, inter-calation current density, and the charge carried by the ions insolution:
∂
∂x
(�eff ∂�2
∂x(x, t)
)+ J(x, t) + ∂
∂x
(�D
∂
∂xln(c2(x, t))
)= 0 (8)
The above system of equations are the DFN model that repre-sent the dynamics of charging and discharging in the Li-ion cell. Theboundary conditions for this model are given in Appendix. Whenthe DFN model is discretized it becomes a system of DifferentialAlgebraic Equations (DAEs), where the differential equations gov-ern the diffusion dynamics and the algebraic equations constrainthe potentials and intercalation current accordingly.
4. Parameter set
This section describes the DFN model parameters identifiedin this paper, and explains some of the constraints placed onthese parameters during identification. The parameters are sum-marized in Table 1. Altogether, 88 parameters are optimized by thegenetic algorithm. Five of these parameters pertain to cell geome-try, namely, the anode thickness Ln, separator thickness Ls, cathodethickness Lp, anode particle radius Rn, and cathode particle radiusRp. One may directly measure these quantities by disassemblingthe cell. However, our aim is to use non-destructive methods foridentifying the parameters. Three parameters characterize ion dif-fusion rates. They include the solid diffusivity d1n in the anode,solid diffusivity d1p in the cathode, and solution diffusivity d2. Oneparameter governs the fraction of the intercalation current carriedby Li-ions, namely, the transference number t+. Two parametersgovern rate kinetics, namely, the k-rates kn in the anode and kp
in the cathode. These multiplicatively affect the current densitiesgenerated by the electrochemical reactions. One parameter scalesthe solution conductivity and diffusivity to their effective values,namely, the Brugman number b. Three parameters summarize thecell’s porosity, namely, the solution volume fractions ε2n for theanode, ε2s for the separator and ε2p for the cathode. One parametercaptures the effective impedance of the anode-side solid electrolyteinterphase layer, namely, RSEI. The last scalar parameter is the initialconcentration of the solution, c2, which we assume to be uniformlyconstant in space. This variable reflects the amount by which thebattery electrolyte is initially lithiated.
In addition to the above 17 scalar parameters, the GA also opti-mizes three parametric functions in the DFN model. Two of thesefunctions are the equilibrium potential functions, unref and upref, ofthe anode and cathode, respectively. We parameterize these func-tions using 33 control points each, and use monotonic splines to
2which determines the effective conductivity of the solution as afunction of solution concentration. We parameterize this func-tion using five control points spaced linearly from 0 mol m−3 to

ower Sources 210 (2012) 263– 275 267
4c
gipopcciDaefpemtwptcccitotF
5
a(piVtv
m
crSbfmtd
cDstaisNpvl
J.C. Forman et al. / Journal of P
000 mol m−3, and interpolate between these control points usingonventional cubic splines with natural end conditions [31].
Several constraints are placed on the above parameters in theenetic algorithm. All of these constraints are related to underlyingdentifiability issues within the model – each of them improvesarameter identifiability by first removing parameters from theptimization problem and then algebraically relating them toarameters remaining within the optimization problem. First, weonstrain the capacity of each electrode to equal exactly 2.7 Ah. Thisonstraint provides two key benefits. It creates two 0.2 A-h buffersn each electrode, which improves the numerical stability of theFN model. These buffers add 0.2 A-h of capacity to the maximumnd minimum values of the electrodes. This allows the GA to tol-rate minor local over and under filling of electrodes as it searchesor the correct parameter values. Finally, it eliminates the inter-lay between changes in electrode charge capacity and changes inquilibrium potential functions versus capacity. The second opti-ization constraint forces the three electrode widths (Ln, Ls, Lp) and
he area of the sheet rolled up inside the battery to collectively fitithin the volume of the battery cell. Constraining the sheet area isarticularly important because it acts as a multiplicative scale fac-or relating applied current to internal current density. The thirdonstraint sets the volume fractions ε1 and ε2 in the anode andathode to sum to exactly one. The final constraint sets the solidonductivities �1n and �1p to equal 100, consistent with [20]. Thiss justified since both conductivities have absolutely zero effect onhe voltage trajectory (so long as they are both positive). Not allf these constraints are fully physically justified: a fact that reflectshe presence of underlying identifiability issues. This motivates theisher information study in Section 7.
. Parameter optimization scheme
To identify the DFN model’s parameters, we first choose: (i)n optimization objective representing the model’s accuracy, andii) experimental data sets for which this metric is optimized. Thearameter identification objective we use in this paper is to min-
mize the L2 error between the experimentally measured voltage(t) and DFN-simulated voltage trajectories V̂(t; �), for a given bat-ery current trajectory, with respect to the DFN model parameterector �, i.e.,
in�
∫ T
0
(V(t) − V̂(t; �))2dt (9)
We optimize the above objective using only two of the sevenycles previously mentioned, Chirp and Naturalistic1, leaving theemaining 5 cycles for model validation. The Chirp cycle makesoC-dependent and rate-dependent parameters easier to identifyy sweeping through the full range of battery states of charge at dif-erent charge/discharge rates. Furthermore, the Naturalistic1 cycle
akes parameters associated with battery transients easier to iden-ify due to rich frequency content resulting from PHEV drive cycleynamics.
The genetic algorithm optimizes the above L2 error over theourse of the Chirp and Naturalistic1 cycles by varying 88 of theFN model’s parameters. Genetic algorithms are well-suited for
uch large-scale optimization, especially when gradient informa-ion is difficult to obtain analytically or numerically. Fig. 4 provides
high-level snapshot of this article’s GA-based DFN parameterdentification scheme. The optimization process starts with theelection of inputs to the DFN model, in this case the Chirp and
aturalistic1 current profiles versus time. We apply these currentrofiles experimentally to the battery, and measure the resultingoltage output. Next, we initialize the GA to a randomized popu-ation, where each population member is a DFN model parameterFig. 4. Optimizing model parameters via a genetic algorithm.
set. The DFN model is simulated for each population member, and acomparison of the resulting simulated voltage versus experimentaldata furnishes a “fitness” value based on the inverse of the L2 volt-age fitting error. Population members are selected for removal atrandom by a fitness-weighted roulette game. This selection processis elitist, in the sense that the fittest population member is excludedfrom removal. Once the fitness-based selection is complete, we usebinary mutation and crossover operators to create new popula-tion members. Parents are chosen randomly for mutation, with aselection probability weighted by their fitness. Mutations occur ina purely random manner, and are not weighted by fitness. The DFNmodel is then used once more to assign fitness values to the newpopulation members, and the process repeats until convergenceto a minimal model fitting error level. The final parameter valuesare obtained from the fittest member of the population. For fur-ther background on GA-based optimization, the reader is referredto [32].
To ensure the convergence of the GA an additional optimizationwas conducted (henceforth we will refer to this as the “tuning” opti-mization and the first optimization as the “base” optimization). Thetuning optimization started with a population centered about thebase optimization’s fittest population member. Additionally onlyparameters that were in the identifiable set were taken as variablesin this optimization. Recall that to determine this set one needs toalready be close to the optimum as the identifiable set is based onlocal identifiability properties (which is why it could not be com-puted a priori for the base optimization). The tuning optimizationconverged and slightly improved on the base optimization’s result.
The base (tuning) optimization process occurs in the R88
(R43) Euclidean space, with each parameter quantized at 16 bits.This is a very large optimization space, comprising 7.083 × 10423
(1.284 × 10207) possible parameter sets. We employ two main toolsto render these optimizations numerically tractable. First, we usemodel reduction to accelerate the speed with which the DFN modelis simulated, with minimal loss of accuracy. Specifically, we use aLegendre modal coordinate expansion similar to [14], together withalgebraic constraint quasi-linearization similar to [8], to improvethe DFN model’s simulation speed. We apply quasi-linearizationdirectly to the Legendre modal coordinates, allowing for efficientsolution of the algebraic constraints imposed by the coupled �1and �2 boundary values problems. This improves computationalspeed to the point where we are able to simulate the DFN modelfor each new set of parameters in up to 63 s of computation time.Second, we parallelize the GA at the level of simulation functioncalls, with one server program coordinating multiple quad-corecomputers, which is a typical Master-Slave arrangement. CustomJava computer code handles Master-Slave information exchange
over a TCP/IP network within a MATLAB implementation of the GAand DFN model. Altogether, this use of model reduction in conjunc-tion with parallel processing makes it possible for five quad-core
268 J.C. Forman et al. / Journal of Power Sources 210 (2012) 263– 275
-0.2 -0.1 0 0.1 0.20
10
20
30
40
50
60
Pro
babi
lity
Den
sity
0 20 40 60 80 10 00
0.02
0.04
0.06
0.08
0.1
0.12
0.14
0.16
Abs
olut
e E
rror
Vol
tage
[V]
ntiles
cm
6
eTwtotgtTcp–c1
ccrc
TP
Error Voltage [V]
Fig. 5. Probability density plot of voltage error and the perce
omputers (Intel Q8200) to complete the optimization in approxi-ately three weeks.
. Validation results
One of the major results of this paper is a set of GA-fitted param-ter values that match all five validation cycles; see Fig. 5 andable 2. These parameters are based on the tuning optimizationhich offers slight improvements over a related set of values iden-
ified previously [8], which have already been used in two studiesf PHEVs: one on power management and one on charge pat-ern optimization [33,34]. The values of the fitted parameters areiven in Tables 3 and 4. Additional parameters necessary to runhe DFN model but not explicitly optimized are listed in Table 5.hese parameters are implicitly related to the optimization pro-ess, in the sense that they are functions of the optimally identifiedarameters; see Section 5 for details. Relative error in voltage and
consequently – power never exceeds 5% for any of the validationycles. As shown in Table 2, the 50th percentile of voltage error is5.8 mV and the 90th percentile of voltage error is still only 50.5 mV.
To examine the accuracy of the optimal parameter fit further,
onsider the results for the Naturalistic2 and LA92x2 validationycles, which are representative of the set of five cycles. Natu-alistic2 is based on recorded data from a real driver’s eveningommute, as opposed to Naturalistic1, which is used for fitting andable 2ercentile errors of voltage [mV].
Drive cycle Percentile of error [mV]
25% 50% 75% 100%
Naturalistic2 9.8 12.5 13.6 118.9LA92x2 11.7 28.0 41.0 150.3US06x3 10.6 23.4 41.5 140.0SC03x4 9.7 21.0 32.7 146.3UDDSx2 12.0 28.3 33.2 140.9All val cycles 10.4 15.8 31.9 150.3
Percentile
of absolute voltage error for all five of the validation cycles.
represents a morning commute. Fig. 6 shows traces of voltage errorand Fig. 7 shows traces of power error for Naturalistic2. The voltageerror never exceeds 118.9 mV and the 50th percentile of voltageerror is 12.5 mV. Fig. 8 presents a probability density plot and apercentile plot of this error.
The results for LA92x2 are similar to those for Naturalistic2.Figs. 9 and 10 give the voltage and power trajectories along withtheir relative and absolute errors. Voltage error never exceeds150.3 mV and the 50th percentile of voltage error is 28.0 mV. Fig. 11presents probability density and percentile plots of this error.
As a final validation check, we examine whether the voltageerrors for the five validation cycles are correlated with either inputcurrent or state of charge (SoC). Such correlation would suggestfailure to accurately represent internal battery resistance or open-circuit potential as a function of SoC, respectively. Table 6 presentsthe R2 correlation values between voltage error on the one handand battery current and SoC on the other hand, for each of the val-idation cycles. None of the validation cycles have voltage errorslinearly correlated with input current, which implies that the iden-tified model captures at least internal battery resistance very well.The upper bound on the correlation between model error and SoCis R2 = 0.433 which is the case for the Naturalistic2 drive cycle. As apoint of comparison the correlation between predicted and mea-sured voltage for Naturalistic2 is R2 of 0.871, implying that theidentified model captures the dependence of battery dynamics onSoC quite well. This SoC is the “system” SoC (as opposed to the“chemical” SoC which would be calculated based on the quantityof Li in the anode) and is calculated for the battery by integratingand scaling current, knowing that each experiment was initializedat 90% SoC, i.e.,
SoCSystem =∫ t
0I()d
Name Plate Capacity+ 0.9 (10)
In summary, this section shows that the DFN model, togetherwith the parameter values identified in this paper, accurately sim-ulates battery cells under the loading characteristics of PHEVs. This

J.C. Forman et al. / Journal of Power Sources 210 (2012) 263– 275 269
Table 3First half of optimized parameters.
Name Value Unit Variance 95% Confidence interval
Min Max Rel%
Ln 2.880E−05 m 1.30E−15 2.87E−05 2.89E−05 0.25%Ls 1.697E−05 m U U U ULp 6.508E−05 m 3.45E−14 6.47E−05 6.54E−05 0.57%Rn 3.600E−06 m 2.98E−18 3.60E−06 3.60E−06 0.10%Rp 1.637E−07 m U U U Ut+ 2.495E−01 – U U U Ub 1.439E+00 – 1.11E−02 1.23E+00 1.65E+00 14.63%d2 6.930E−10 m2 s−1 9.55E−19 −1.26E−09 2.65E−09 281.98%ε2n 6.188E−01 – 2.62E−02 2.95E−01 9.43E−01 52.33%ε2s 3.041E−01 – U U U Uε2p 5.206E−01 – 4.49E−03 3.87E−01 6.55E−01 25.73%d1n 8.275E−14 m2 s−1 1.44E−26 −1.57E−13 3.23E−13 289.99%d1p 1.736E−14 m2 s−1 U U U Ukn 8.692E−07 (A m−2) (mol m−3)1+˛ 6.38E−20 8.69E−07 8.70E−07 0.06%kp 1.127E−07 (A m−2) (mol m−3)1+˛ U U U URSEI 3.697E−03 � m2 6.49E−10 3.65E−03 3.75E−03 1.38%c2 1.040E+03 mol m−3 8.42E+00 1.03E+03 1.05E+03 0.56%
unref1 3.959E+00 V U U U Uunref2 3.400E+00 V U U U Uunref3 1.874E+00 V U U U Uunref4 9.233E−01 V 5.15E−02 4.70E−01 1.38E+00 49.14%unref5 9.074E−01 V 2.54E−05 8.97E−01 9.17E−01 1.11%unref6 6.693E−01 V 3.27E−04 6.33E−01 7.06E−01 5.40%unref7 2.481E−03 V U U U Uunref8 1.050E−03 V U U U Uunref9 1.025E−03 V U U U Uunref10 8.051E−04 V U U U Uunref11 5.813E−04 V U U U Uunref12 2.567E−04 V U U U Uunref13 2.196E−04 V U U U Uunref14 1.104E−04 V U U U Uunref15 3.133E−06 V U U U Uunref16 1.662E−06 V U U U Uunref17 9.867E−07 V U U U Uunref18 3.307E−07 V U U U Uunref19 1.570E−07 V U U U Uunref20 9.715E−08 V U U U Uunref21 5.274E−09 V U U U Uunref22 2.459E−09 V U U U Uunref23 7.563E−11 V U U U Uunref24 2.165E−12 V U U U Uunref25 1.609E−12 V U U U Uunref26 1.594E−12 V U U U Uunref27 1.109E−12 V U U U U
GA optimized parameter values for the DFN model. Variances are computed using Fisher information. U indicates an unidentifiable parameter.
acia
7
tbcmimmtvmia
ccuracy is evident from the small errors in the voltage – andonsequently, power – traces of the DFN model compared to exper-mental data. The parameter values in this paper make it possible toccurately simulate the ANR26650M1A cell for PHEV applications.
. Fisher information and parameter variance
Section 6 of this article assesses the degree to which the iden-ified DFN model is able to replicate input–output voltage/currentattery cycling behavior. The overarching goal of this section, inontrast, is to evaluate the quality of the model parameter esti-ates. Previous work by the authors pursues this goal using the
dentifiability matrix, and shows that while the identified DFNodel fits input–output voltage/current data very well, certainodel parameters are unidentifiable [8]. This article enhances
his analysis by quantifying the parameter estimation variance
ia Fisher information techniques. Fisher information provides theinimum variance for parameter estimation via the Cramér-Raonequality [9,10]. The Cramér-Rao inequality applies to the GAlgorithm used herein since we use this algorithm as a maximum
likelihood estimator (the GA chooses parameters values to mini-mize L2). Thus the inverse of the Fisher information matrix is thecovariance of estimating the model parameters. Since there is onlyone output, Fisher information can be calculated by multiplyingthe identifiability matrix by the voltage sensor’s variance. This vari-ance was computed from the voltage error between simulation andexperiment for the fitting data sets.
The variance of the estimated parameters is presented inTables 3 and 4 along with 95% (two standard deviations) confidencebounds and relative error. For each parameter, this relative error isthe upper 95% confidence bound minus the parameter’s estimatedvalue, divided by this estimated value. Not all of the parame-ters are identifiable, and those that are unidentifiable are markedwith a ‘U’. Unidentifiability was determined using the method in[8] where the minimum condition number for the identifiabilitymatrix was taken as 10−10. Lower condition numbers caused unrea-
sonable numerical errors in the inversion of the Fisher informationmatrix.The process of partitioning a given parameter set into identifi-able versus unidentifiable parameters makes it possible to make
270 J.C. Forman et al. / Journal of Power Sources 210 (2012) 263– 275
Table 4Second half of optimized parameters.
Name Value Unit Variance 95% Confidence interval
Min Max Rel%
unref28 4.499E−13 V U U U Uunref29 2.250E−14 V U U U Uunref30 1.335E−14 V U U U Uunref31 1.019E−14 V U U U Uunref32 2.548E−16 V U U U Uunref33 1.654E−16 V U U U U
upref1 5.502E+00 V U U U Uupref2 4.353E+00 V 1.79E−02 4.09E+00 4.62E+00 6.15%upref3 3.683E+00 V 1.36E−05 3.68E+00 3.69E+00 0.20%upref4 3.554E+00 V 1.64E−06 3.55E+00 3.56E+00 0.07%upref5 3.493E+00 V 9.58E−06 3.49E+00 3.50E+00 0.18%upref6 3.400E+00 V 8.66E−06 3.39E+00 3.41E+00 0.17%upref7 3.377E+00 V 8.03E−06 3.37E+00 3.38E+00 0.17%upref8 3.364E+00 V 8.51E−06 3.36E+00 3.37E+00 0.17%upref9 3.363E+00 V 1.28E−05 3.36E+00 3.37E+00 0.21%upref10 3.326E+00 V 1.09E−05 3.32E+00 3.33E+00 0.20%upref11 3.324E+00 V 1.27E−05 3.32E+00 3.33E+00 0.21%upref12 3.322E+00 V 1.13E−05 3.32E+00 3.33E+00 0.20%upref13 3.321E+00 V 1.57E−05 3.31E+00 3.33E+00 0.24%upref14 3.316E+00 V 1.54E−05 3.31E+00 3.32E+00 0.24%upref15 3.313E+00 V 1.40E−05 3.31E+00 3.32E+00 0.23%upref16 3.304E+00 V 1.64E−05 3.30E+00 3.31E+00 0.25%upref17 3.295E+00 V 1.20E−05 3.29E+00 3.30E+00 0.21%upref18 3.293E+00 V 6.76E−06 3.29E+00 3.30E+00 0.16%upref19 3.290E+00 V 1.11E−05 3.28E+00 3.30E+00 0.20%upref20 3.279E+00 V 1.22E−05 3.27E+00 3.29E+00 0.21%upref21 3.264E+00 V 1.19E−05 3.26E+00 3.27E+00 0.21%upref22 3.261E+00 V 1.04E−05 3.25E+00 3.27E+00 0.20%upref23 3.253E+00 V 6.13E−06 3.25E+00 3.26E+00 0.15%upref24 3.245E+00 V 7.85E−06 3.24E+00 3.25E+00 0.17%upref25 3.238E+00 V 1.59E−05 3.23E+00 3.25E+00 0.25%upref26 3.225E+00 V 1.09E−05 3.22E+00 3.23E+00 0.20%upref27 3.207E+00 V 5.81E−05 3.19E+00 3.22E+00 0.48%upref28 2.937E+00 V 1.64E−04 2.91E+00 2.96E+00 0.87%upref29 2.855E+00 V 1.09E−04 2.83E+00 2.88E+00 0.73%upref30 2.852E+00 V 1.13E−04 2.83E+00 2.87E+00 0.74%upref31 1.026E+00 V U U U Uupref32 −1.120E+00 V U U U Uupref33 −1.742E+00 V U U U U
�1 1.050E−01 �−1 m−1 U U U U�2 1.760E−01 �−1 m−1 U U U U�3 2.190E−01 �−1 m−1 U U U U�4 8.166E−02 �−1 m−1 U U U U
G isher
qUmrl
TP
Nm
�5 3.014E−02 �−1 m−1 U
A optimized parameter values for the DFN model. Variances are computed using F
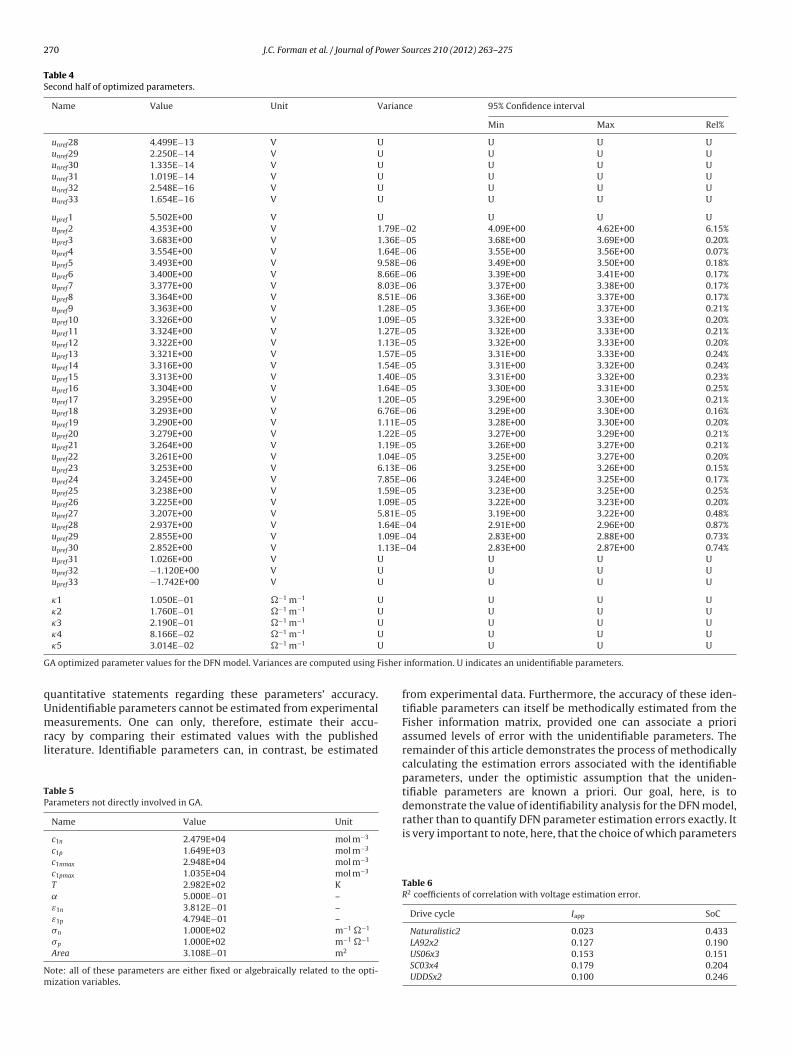
uantitative statements regarding these parameters’ accuracy.nidentifiable parameters cannot be estimated from experimental
easurements. One can only, therefore, estimate their accu-acy by comparing their estimated values with the publishediterature. Identifiable parameters can, in contrast, be estimated
able 5arameters not directly involved in GA.
Name Value Unit
c1n 2.479E+04 mol m−3
c1p 1.649E+03 mol m−3
c1nmax 2.948E+04 mol m−3
c1pmax 1.035E+04 mol m−3
T 2.982E+02 K˛ 5.000E−01 –ε1n 3.812E−01 –ε1p 4.794E−01 –�n 1.000E+02 m−1 �−1
�p 1.000E+02 m−1 �−1
Area 3.108E−01 m2
ote: all of these parameters are either fixed or algebraically related to the opti-ization variables.
U U U
information. U indicates an unidentifiable parameters.
from experimental data. Furthermore, the accuracy of these iden-tifiable parameters can itself be methodically estimated from theFisher information matrix, provided one can associate a prioriassumed levels of error with the unidentifiable parameters. Theremainder of this article demonstrates the process of methodicallycalculating the estimation errors associated with the identifiableparameters, under the optimistic assumption that the uniden-tifiable parameters are known a priori. Our goal, here, is to
demonstrate the value of identifiability analysis for the DFN model,rather than to quantify DFN parameter estimation errors exactly. Itis very important to note, here, that the choice of which parametersTable 6R2 coefficients of correlation with voltage estimation error.
Drive cycle Iapp SoC
Naturalistic2 0.023 0.433LA92x2 0.127 0.190US06x3 0.153 0.151SC03x4 0.179 0.204UDDSx2 0.100 0.246

J.C. Forman et al. / Journal of Power Sources 210 (2012) 263– 275 271
0 500 1000 1500 2000 2500 3000 3500 4000 4500 50003
3.5
Vol
tage
[V]
0 500 1000 1500 2000 2500 3000 3500 4000 4500 5000-0.2
0
0.2E
rror
[V]
0 500 1000 1500 2000 2500 3000 3500 4000 4500 5000-0.05
0
0.05
Rel
ativ
e E
rror
Time [s]
SimulatedExperimental
ponse
aib
wgieLavmfif
Fig. 6. Voltage res
re identifiable versus unidentifiable has a significant impact on thedentification errors computed by this process. One must thereforee very vigilant when making this choice/partitioning.
Of the eleven identifiable scalar parameters six are estimatedith good accuracy (relative error <2%). These are associated with
eometry: Ln the anode width, Lp the cathode width, Rn the spher-cal radius in the anode, kn the k-rate in the anode, RSEI the solidlectrolyte interface resistance, and c2 the initial concentration ofi in solution. The remaining five scalar parameters all have rel-tive errors greater than 25%. It is important to note that theseariances correspond to the case where one attempts to identify all
odel parameters simultaneously, with the unidentifiable valuesxed. If one knows some parameters with certainty and can there-ore estimate a smaller subset of the DFN model parameters, the
0 500 1000 1500 2000 250-50
0
50
Pow
er [W
]
0 500 1000 1500 2000 250-1
0
1
Err
or [W
]
0 500 1000 1500 2000 250-0.05
0
0.05
Rel
ativ
e E
rror
Time
Fig. 7. Power response
for Naturalistic2.
variance in these parameters will be lower (or at least the same).For example, if one is designing a state of health estimator whosesole goal is to estimate RSEI assuming all other DFN model parame-ters to be known, the variance in estimation would be 4.387E−014,and the relative error in estimating RSEI would decrease from 1.38%to 0.0113%. These results are important, because they: (i) quan-tify the errors in the parameters identified herein, (ii) highlight thedifficulties in estimating specific parameters solely through volt-age and current time traces, and (iii) underscore the importance ofexamining the identifiability of all DFN model parameters, not justa subset of those parameters.
To provide further insights into the DFN model’s parameteridentifiability, Figs. 12 and 13 present the estimates of the cathode-and anode-side equilibrium potentials versus SoC, along with their
0 3000 3500 4000 4500 5000
0 3000 3500 4000 4500 5000
0 3000 3500 4000 4500 5000
[s]
SimulatedExperimental
for Naturalistic2.

272 J.C. Forman et al. / Journal of Power Sources 210 (2012) 263– 275
-0.2 -0.1 0 0.1 0.20
20
40
60
80
100
120
140
160
Pro
babi
lity
Den
sity
Error Voltage [V]
0 20 40 60 80 1000
0.02
0.04
0.06
0.08
0.1
0.12
PercentileA
bsol
ute
Err
or V
olta
ge [V
]
the pe
9pttacuostuv
Fig. 8. Probability density plot of voltage error and
5% confidence bounds. For plotting purposes, the unidentifiablearameters have confidence bounds at −∞ and ∞. In the modelhese equilibrium potential functions are represented by mono-onic cubic splines in terms of SoC. Here we plot these functionss piecewise linear since the confidence bounds are only for theontrol points. Between the two equilibrium potential functions,pref has much less variance than unref. Specifically, the estimationf upref exhibits low variance, where the confidence bounds corre-
pond to relative errors less than 1% for 0% SoC to 95% SoC (wherehis SoC does not include the buffers). In contrast, most of unref isnidentifiable, and even the identifiable control points still haveery high variances. The equilibrium potential functions provide0 500 1000 150
3
3.5
Vol
tage
[V]
0 500 1000 150-0.2
0
0.2
Err
or [V
]
0 500 1000 150-0.05
0
0.05
Rel
ativ
e E
rror
Time
Fig. 9. Voltage respo
rcentiles of absolute voltage error for Naturalistic2.
a good example of the effects of assuming that the unidentifiablevalues are correct. Since upref is very dependent on unref, and unref islargely incorrect, upref is mostly identifiable – but to make the uprefvalues accurate one needs to plug in accurate values for the unref
first. The conductivity function �eff2 (c2) is completely unidentifiable
– indicating that the interplay between solution concentration andconductivity could not be determined through these experiments.
Parameter identifiability and variance in estimation are the
function of several important factors. First, they are a func-tion of which parameters are being identified and which arealready assumed known. This leads to cases where parameter0 2000 2500 3000
0 2000 2500 3000
0 2000 2500 3000
[s]
SimulatedExperimental
nse for LA92x2.

J.C. Forman et al. / Journal of Power Sources 210 (2012) 263– 275 273
0 500 1000 1500 2000 2500 3000-100
0
100
Pow
er [W
]
0 500 1000 1500 2000 2500 3000-2
0
2E
rror
[W]
0 500 1000 1500 2000 2500 3000-0.05
0
0.05
Rel
ativ
e E
rror
Time [s]
SimulatedExperimental
respo
enpdfiqsFpi
Fig. 10. Power
stimation errors can be improved dramatically by changing theumber of known parameters versus unknown ones (as shownreviously in the case of RSEI). Parameter identifiability alsoepends on the values of the parameters after they have beent to the data. This is due to Fisher information being a localuantity in the parameter space. In general, this makes it impos-ible to determine which parameters will be identifiable a priori.
inally we note that the experiments themselves can greatly affectarameter identifiability. Both the structure of the battery exper-ment (including placement of sensors and actuators) and the
-0.2 -0.1 0 0.1 0.20
5
10
15
20
25
30
35
40
45
Pro
babi
lity
Den
sity
Error Voltage [V]
Fig. 11. Probability density plot of voltage error and the
nse for LA92x2.
experiment’s trajectory can affect parameter identifiability. As anexample of structure, if our cell had a third electrode then we wouldhave been able to measure two voltages – likely improving ourability to identify unref and upref simultaneously. As an example ofthe experimental trajectory’s impact, the Natuarlistic2 and Chirpcycles are different in terms of the battery dynamics they excite,and therefore different in their impact on parameter identifiability.
All of these factors underscore that matching input–output datais not enough to guarantee that the model parameter values arephysically accurate.0 20 40 60 80 1000
0.02
0.04
0.06
0.08
0.1
0.12
0.14
0.16
Percentile
Abs
olut
e E
rror
Vol
tage
[V]
percentiles of absolute voltage error for LA92x2.

274 J.C. Forman et al. / Journal of Power S
0 0.1 0.2 0.3 0.4 0.5 0.6 0.7 0.8 0.9 10
0.2
0.4
0.6
0.8
1
1.2
1.4
1.6
1.8
2
Electrode SoC
Ano
de E
quili
briu
m P
oten
tial [
V]
Estimated Potetntial95% Confidence Bound
Fig. 12. Estimated anode equilibrium potential unref with 95% confidence bounds.
0 0.1 0.2 0.3 0.4 0.5 0.6 0.7 0.8 0.9 12.8
2.9
3
3.1
3.2
3.3
3.4
3.5
3.6
3.7
Electrode SoC
Cat
hode
Equ
ilibr
ium
Pot
entia
l [V
]
Estimated Potetntial95% Confidence Bound
F
8
Deozappeoti5oj(pssp
For the solution potential �2:
ig. 13. Estimated cathode equilibrium potential upref with 95% confidence bounds.
. Summary and conclusion
This article uses a genetic algorithm to match theoyle–Fuller–Newman battery model’s voltage predictions toxperimental measurements, for given input current profiles. Weptimize 88 parameters of the DFN model, including parameteri-ations of the anode and cathode equilibrium potential functionsnd the solution conductivity function. The end result is a set ofarameter values for the DFN model that predicts cell voltage andower with 5% relative error for all of the validation data setsxamined in this work. All of these validation data sets are basedn simulated plug-in hybrid electric vehicle battery pack currentshat exhibit high charge/discharge rates and are highly transientn nature. For all of the validation cycles aggregated together, the0th percentile of voltage error 15.8 mV, and the 90th percentilef voltage error is still only 50.5 mV. This high level of accuracyustifies the use of the DFN model for the lithium-iron-phosphateLiFePO4) cathode chemistry examined in this work. In fact, thearameter values identified herein have already been used in two
tudies involving PHEVs [33,34]. Additionally, this paper presentsome of the computational logistics involved in using a GA forarameter identification.ources 210 (2012) 263– 275
The identification procedure used herein makes it possible tofind a set of parameter values for the DFN model noninvasively.Unfortunately, this noninvasiveness causes some parameters to beunidentifiable or have a large estimation uncertainty. While thisdoes not affect the accuracy of the model response, it does meanthat one must be careful when using these parameters in othercontexts.
Acknowledgments
This work was supported by the National Science FoundationEFRI-RESIN Grant 0835995, and the Michigan Public Service Com-mission.
Appendix A. Boundary conditions
This appendix summarizes the boundary conditions present inthe DFN model. The effective values of various quantities are relatedto the volume fraction and the Brugman number as follows:
d2eff = d2εb2j ∀j ∈ {n, s, p} (A.1)
�jeff = �ε1j ∀j ∈ {n, p} (A.2)
�eff (c2) = �(c2)εb2j ∀j ∈ {n, s, p} (A.3)
�D(c2) = �eff (c2)
(2RT(1 − t+)
F
)(A.4)
For solid concentration c1:
∂
∂rc1(r) = 0, @r = 0 (A.5)
∂
∂rc1(r) = − Jj(r)
d1jajF, @r = R, ∀j ∈ {n, p} (A.6)
For solution concentration c2:
∂
∂xc2(x) = 0 @x = 0, x = Ln + Ls + Lp (A.7)
d2eff
∣∣anode
∂
∂xc2(x) = d2eff
∣∣separator
∂
∂xc2(x) @x = Ln (A.8)
d2eff
∣∣separator
∂
∂xc2(x) = d2eff
∣∣cathode
∂
∂xc2(x) @x = Ln + Ls (A.9)
In addition c2 is equated at the anode/separator interface and theseparator/cathode interface.
For solid potential �1:
∂
∂x�1(x) = 0 @x = Ln, x = Ln + Ls (A.10)
�1(x) = 0 @x = 0 (A.11)
This places the ground at the negative electrode. At the positiveelectrode one can choose between a current and voltage input. Forthe current input:
∂
∂x�1(x) = iapp
Area × �neff@x = Ln + Ls + Lp (A.12)
where Area converts from current density to absolute current.For the voltage input:
�1(x) = Voltapplied @x = Ln + Ls + Lp (A.13)
∂
∂x�2(x) = 0 @x = 0, x = Ln + Ls + Lp (A.14)

ower S
Is
R
[
[
[
[
[
[
[
[
[
[
[
[
[
[
[
[
[
[
[
[
[
[
[
[
J.C. Forman et al. / Journal of P
�eff (c2)∣∣anode
∂
∂x�2(x) + �D(c2)
∣∣anode
∂
∂xln(c2(x))
= �eff (c2)∣∣separator
∂
∂x�2(x) + �D(c2)
∣∣separator
∂
∂xln(c2(x)) @x = Ln
(A.15)
�eff (c2)∣∣separator
∂
∂x�2(x) + �D(c2)
∣∣separator
∂
∂xln(c2(x))
= �eff (c2)∣∣cathode
∂
∂x�2(x) + �D(c2)
∣∣cathode
∂
∂xln(c2(x)) @x
= Ln + Ls (A.16)
n addition �2 is equated at the anode/separator interface and theeparator/cathode interface.
eferences
[1] M. Doyle, T. Fuller, J. Newman, Modeling of galvanostaic charge and dischargeof the lithium/polymer/insertion cell, Journal of the Electrochemical Society140 (June) (1993) 1526–1533.
[2] T. Fuller, M. Doyle, J. Newman, Simulation and optimization of the dual lithiumion insertion cell, Journal of the Electrochemical Society 141 (January) (1994)1–10.
[3] A. Elgowainy, A. Burnham, M. Wang, J. Molburg, A. Rousseau, Well-to-WheelsEnergy Use and Greenhouse Gas Emissions Analysis of Plug-in Hybrid Elec-tric Vehicles, Center for Transportation Research, Argonne National Laboratory,2009.
[4] S. Santhanagopalan, Q. Guo, R. White, Parameter estimation and model dis-crimination for a lithium-ion cell, Journal of the Electrochemical Society 154(March) (2007) A198–A206.
[5] C. Speltino, D. Domenico, G. Fiengo, A. Stefanopoulou, On the experimentalidentification of an electrochemical model of a lithium-ion battery: part II, in:The European Control Conference, Budapest, 2009.
[6] A. Schmidt, M. Bitzer, A. Imre, L. Guzzella, Experiment-driven electrochemicalmodeling and systematic parameterization for a lithium-ion cell, Journal ofPower Sources 195 (August) (2010) 5071–5080.
[7] Y. Hu, S. Yurkovich, Y. Guezennec, B. Yurkovich, A technique for dynamic bat-tery model identification in automotive applications using linear parametervarying structures, Journal of Control Engineering Practice 17 (October) (2009)1190–1201.
[8] J. Forman, S. Moura, J. Stein, H. Fathy, Genetic parameter identification of theDoyle–Fuller–Newman model from experimental cycling of a LiFePO4 battery,in: American Controls Conference, San Francisco, 2011.
[9] T. Cover, J. Thomas, Elements of Information Theory, John Wiley & Sons, NewYork, NY, 1991 (Chapter 12).
10] T. McWhorter, L.L. Scharf, Cramér-Rao bounds for deterministic modal analysis,IEEE Transactions on Signal Processing 41 (5) (1993) 1847–1866.
11] H. Wynn, N. Parkin, Sensitivity analysis and identifiability for differential equa-
tion models, in: Conference on Decision and Control, Orlando, 2001.12] H. Khalil, Nonlinear Systems, Prentice Hall, Upper Saddle River, NJ, 2002 (Chap-ter 3).
13] J. Jacquez, T. Perry, Parameter estimation: local identifiability of parameters,AJP – Endocrinology and Metabolism 258 (1990) E727–E736.
[
ources 210 (2012) 263– 275 275
14] V.R. Subramanian, V. Boovaragavan, V. Ramadesigan, M. Arabandi, Mathemat-ical model reformulation for lithium-ion battery simulations: galvanostaticboundary conditions, Journal of Electrochemistry 156 (2009) A260–A271.
15] J.C. Forman, S. Bashash, J. Stein, H. Fathy, Reduction of an electrochemistry-based Li-ion battery model via quasi-linearization and Padé approximation,Journal of the Electrochemical Society 158 (2) (2011) A93–A101.
16] H. Fathy, Z. Filipi, J. Hagena, J. Stein, Review of hardware-in-the-loop simulationand its prospects in the automotive area, The International Society for OpticalEngineering 6228 (2006) 1–20.
17] D. LeBlanc, J. Sayer, C. Winkler, R. Ervin, S. Bogard, J. Devonshire, M. Mefford,M. Hagan, Z. Bareket, R. Goodsell, et al., Road Departure Crash Warning Sys-tem Field Operational Test: Methodology and Results, University of MichiganTransportation Research Institute, Tech. Rep. UMTRI-2006-9-1, June 2006.
18] M. Duoba, R. Carlson, F. Jehlik, J. Smart, S. White, Correlating dynamometertesting to in-use fleet results of plug-in hybrid electric vehicles, World ElectricVehicle Journal 3 (1) (2009).
19] S.J. Moura, H.K. Fathy, D.S. Callaway, J.L. Stein, A stochastic optimal controlapproach for power management in plug-in hybrid electric vehicles, IEEETransactions on Control Systems Technology PP (March (99)) (2010) 1–11.
20] P. Ramadass, B. Haran, P. Gomadam, R. White, B. Popov, Development of firstprinciples capacity fade model for Li-ion cells, Journal of Electrochemistry 151(2004) A196–A203.
21] L. Laffont, C. Delacourt, P. Gibot, M. Yue Wu, P. Kooyman, C. Masquelier, J. MarieTarascon, Study of the LiFePO4/FePO4 two-phase system by high-resolutionelectron energy loss spectroscopy, Chemistry of Materials 18 (November (23))(2006) 5520–5529.
22] C. Delmas, M. Maccario, L. Croguennec, F. Le Cras, F. Weill, Lithium deinterca-lation in LiFePO4 nanoparticles via a domino-cascade model, Nature Materials23 (August (8)) (2008) 665–671.
23] G. Brunetti, D. Robert, P. Bayle-Guillemaud, J.L. Rouvière, E.F. Rauch, J.F. Mar-tin, J.F. Colin, F. Bertin, C. Cayron, Confirmation of the domino-cascade modelby LiFePO4/FePO4 precession electron diffraction, Chemistry of Materials 23(October (20)) (2011) 4515–4524.
24] V. Srinivasan, J. Newman, Discharge model for the lithium iron-phosphateelectrode, Journal of the Electrochemical Society 151 (October (10)) (2004)A1517–A1529.
25] V. Srinivasan, J. Newman, Existence of path-dependence in the LiFePO4 elec-trode, Journal of the Electrochemical Society 9 (March (3)) (2006) A110–A114.
26] M. Safari, C. Delacourt, Mathematical modeling of lithium iron phosphate elec-trode: galvanostatic charge/discharge and path dependence, Journal of theElectrochemical Society 158 (February (2)) (2011) A63–A73.
27] M. Safari, C. Delacourt, Modeling of a commercial graphite/LiFePO4 cell, Journalof the Electrochemical Society 158 (May (5)) (2011) A562–A571.
28] F. Liu, N. Siddique, P. Mukherjee, Nonequilibrium phase transformation andparticle shape effect in LiFePO4 material for Li-ion batteries, Electrochemicaland Solid-State Letters 14 (10) (2011) A143–A147.
29] G. Singh, G. Ceder, M. Bazant, Intercalation dynamics in rechargeable batterymaterials: general theory and phase-transformation waves in LiFePO4, Elec-trochimica Acta 53 (November (26)) (2008) 7599–7613.
30] F. Fritsch, R. Carlson, Monotone piecewise cubic interpolation, SIAM Journal ofNumerical Analysis 17 (April) (1980) 238–246.
31] R. Burden, J. Faires, Numerical Analysis, 7th ed., Wadsworth, Pacific Grove, CA,2001, pp. 146–147.
32] E. Cantú, Paz Efficient and Accurate Parallel Genetic Algorithms, Kluwer Aca-demic Publishers, Norwell, MA, 2000 (Chapter 3).
33] S. Bashash, S.J. Moura, J.C. Forman, H.K. Fathy, Plug-in hybrid vehicle chargepattern optimization for energy cost and battery longevity, Journal of Power
Sources 196 (January (1)) (2011) 541–549.34] S.J. Moura, J.L. Stein, H.K. Fathy, Battery health conscious power manage-ment in plug-in hybrid electric vehicles via electrochemical modeling andstochastic control, IEEE Transactions on Control Systems Technology, in press,doi:10.1109/TCST.2012.2189773.