journal of la computation of sensory-affective
TRANSCRIPT
JOURNAL OF LATEX CLASS FILES, VOL. 14, NO. 8, AUGUST 2019 1
Computation of sensory-affective relationshipsdepending on
material categories of pictorial stimuliShogo Okamoto, Member, IEEE, Kohta Wakamatsu, Shigeki Nakauchi, Jinhwan Kwon, Maki Sakamoto
Abstract—Exposure to stimuli gives rise to sensory and affective experiences. Computing the relationships between theseexperiences is instrumental to designing affectively appealing products and understanding human experiences. Hierarchical structuresof sensory and affective responses, which can be built through adjective rating tasks, are regarded as an effective means forexpressing relationships between sensory and affective responses. Naturally, these hierarchical structures depend on the type ofstimulus; however, so far, their dependencies on material categories have yet to be examined. We therefore investigated howhierarchical structures of affective and sensory responses depend on seven material categories: fabric, leather, wood, paper, foliage,stone, and glass. Each material category had 100 visual representations selected from the Flickr Material Database. Thirty-nineparticipants were asked to rate 368 pictures across a set of materials. The questionnaire adjectives included visually- andhaptically-centered items although the stimuli were purely visual. We found that the structures differed substantially among the materialcategories, although there were some commonalities. Particularly, the positions of polysemic or multimodal adjectives such as “light”and “uncomfortable” in the hierarchy were highly dependent on the material category. For example, “light” has both physical(lightweight) and psychological (e.g., non-solemn, cheerful) meanings. For stone and glass (generally considered to be of heavyweight), the psychological meanings were primarily considered. Conversely, the physical meanings were predominant for fabric,leather, wood, paper, and foliage, for which weight is a factor in judging quality. The present study helps interpret affective descriptorswhose meanings vary among types of stimuli.
Index Terms—Structural equation modeling, Flickr material database, Layered structure, Material perception, Affective responses
F
1 INTRODUCTION
Humans experience changes in sensory and affective stateswhen exposed to products or sensory stimuli. The affectiveresponses, despite being linked to the perceived value ofproducts, do not seem to be directly linked with the physicalproperties of stimuli. Therefore, it is challenging to esti-mate how they change along with the physical propertiesof products. Hence, numerous researchers have attemptedto explain or predict affective responses by using sensoryadjectives, which are directly associated with the physicalproperties of the stimuli. To this end, many studies havecreated hierarchical models wherein scores are given tosensory adjectives, which are then linked to scores of af-fective adjectives through unimodal or multimodal sensoryappraisals [1], [2], [3], [4], [5], [6], [7], [8], [9], [10], [11], [12],[13], [14], [15].
These studies used their own methods of hierarchicalmodeling. Most studies sought to establish two-layeredmodels with sensory and affective adjectives at low and
• S. Okamoto is with the Department of Mechanical Systems Engineering,Nagoya University, Japan.
• K. Wakamatsu and S. Nakauchi are with the Department of ComputerScience and Engineering, Toyohashi University of Technology, Toyohashi,Japan.
• J. Kwon is with the Faculty of Education, Kyoto University of Education,Kyoto, Japan.
• M. Sakamoto is with Graduate School of Information Systems, TheUniversity of Electro-Communications, Chofu, Japan.
Manuscript received June 11, 2019.
high layers, respectively [5], [7], [8], [11], [12]. The lowand high layers are typically connected by multivariateregression analyses. Other studies used multi-layered mod-els constructed using tasks other than the adjective ratingtask [3], [14], [15], or had experts in a given field (e.g.,food or clothing industries) determine the structures of thelayers [1], [9], [10]. For example, Ueda [15] determined thehierarchy of 114 adjectives used for evaluating sounds onthe basis of their abstractness, complexity, objectiveness, anddifficulty, judged by 116 experimental participants. In [1],a hierarchical model to represent the sensory and affectiveexperiences while having coffee was made by means ofagreement among baristas. Multi-layered models allow forconnections among the affective variables and can expressmore complex relationships among the affective responses;hence, they represent affective responses more accurately.For example, in [13], the mean correlation coefficient be-tween the observed and modeled ratings of five typesof affective descriptors was 0.67 for a two-layered modelwhereas it was 0.75 in a four-layered model.
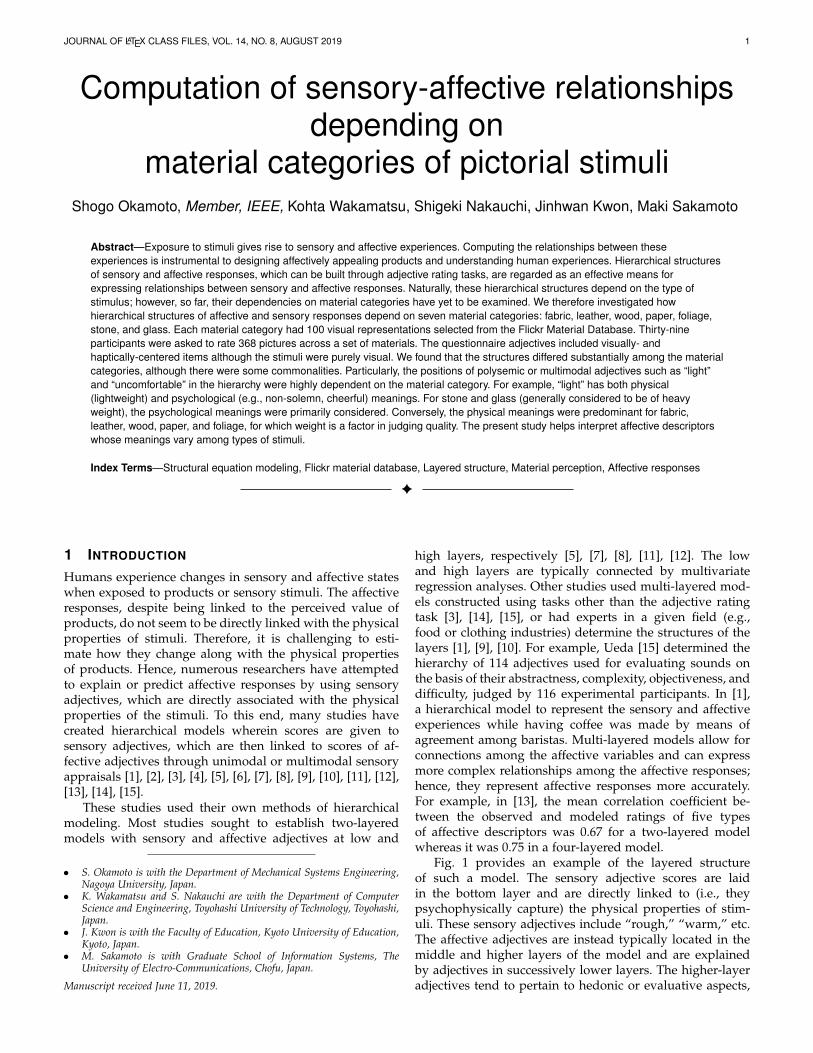
Fig. 1 provides an example of the layered structureof such a model. The sensory adjective scores are laidin the bottom layer and are directly linked to (i.e., theypsychophysically capture) the physical properties of stim-uli. These sensory adjectives include “rough,” “warm,” etc.The affective adjectives are instead typically located in themiddle and higher layers of the model and are explainedby adjectives in successively lower layers. The higher-layeradjectives tend to pertain to hedonic or evaluative aspects,
JOURNAL OF LATEX CLASS FILES, VOL. 14, NO. 8, AUGUST 2019 2
Simple-
complex
Rough-
smooth
Uneven-
flat
Hard-
soft
Sticky-
slippery�
Strange-
usual
General-
special�
Exciting-
boring
Beautiful-
ugly
Comfort.-
uncomfort.� �
Good-
bad
Like-
dislike�
Surface
roughnessElasticity
Coefficient
of friction
Thermal
resistance�
Bending
stiffness
Physical
property
of stimuli
Sensory
adjectives
Affective
adjectives
Fig. 1. Layered structure of sensory and affective adjectives. Sensoryadjectives are directly linked with the physical properties of stimuli.The affective adjectives in the middle to high layers are explained bysuccessively lower layers. Evaluative and hedonic aspects are generallyplaced in the higher layers. This figure is consistent with [6].
whereas the middle-layer adjectives tend to describe theattributes of stimuli [1], [2], [4], [9], [14]. These layeredmodels provide semantic relationships between sensory andaffective responses, which can help in designing the affec-tive values of products and interpreting the meanings ofconceptual values expressed by affective adjectives. Thusfar, these models have been leveraged for various prod-ucts including beverages [1], clothing [10], car seats [8],leather [9], and wood [12].
In the present study, we establish hierarchical structuresof sensory and affective adjectives based on the scores as-signed to these adjectives in a sensory appraisal task involv-ing the presentation of pictures of seven material categoriesincluding fabric, paper, wood, leather, foliage, glass, andstone. We then discuss the similarities and differences inthe sensory-affective relationships between these materialsusing the hierarchical models of adjectives. As describedin the following two paragraphs, thus far, such sensory-affective relationships have not been compared among ma-terial categories.
Thus far, using visual and haptic cues, sensory responsesto material surfaces and material classification have beenextensively studied [16], [17], [18], [19], [20], [21]. Thesestudies showed that sensory responses depend on materialcategories. For example, using computer graphics of severalmaterial categories, Hiramatsu et al. [16] found that theimages of similar material categories formed clusters inthe perceptual space. Baumgartner et al. had similar resultsusing either visual or haptic material perception [19] wherethe perceptual spaces made by the two sensory cues wereclose to each other. However, these studies did not focus onthe associations between perceptual and affective qualities.
In contrast, earlier studies on sensory and affective qual-ities did not focus on the differences between material cate-gories. For example, Drewing et al. investigated the relation-ships between the affective qualities and dimensions of per-ceptual qualities using 47 types of objects to be touched [5].However, they did not analyze their results from the view-
point of material categories, and the model was applied toa set of differing materials. Fujisaki et al. [12] comparedthe relationships between sensory and affective responses tonatural woods according to the sensory cues available (i.e.,when only tactile, visual, or auditory cues were available);they found that the relationships were similar across allthree modalities. They also found different sensory-affectiverelationships between responses to wood and stone. How-ever, to our knowledge, the sensory-affective relationshipshave not been compared among several types of materialcategories. Furthermore, it remains unclear how responsesto affective adjectives that are polysemic and indefinitedepend on the material category. Understanding how theserelationships differ by material category could provide amore concrete scientific basis with regard to the industrialdesign of products.
The potential contribution of the present study to in-dustrial fields is as follows: In manufacturing, the affectiveaspects experienced from materials are valued [22], and,thus far, systematic material-selection methods have beenstudied [23], [24], [25]. For example, Karana et al. proposeda method to help product designers to select materialssuch that the affective attributes of products and materialsmatched [23]. For customer–vendor communication aboutproducts, customers tend to use indefinite affective wordsto convey their demands. In these situations, the designersneed to comprehend the meanings of affective descriptions.The present study provides a computational approach forsuch purposes. Further, for designers of publication andweb pages, in addition to their own professional knowledgeand feelings, they may refer to the hierarchical modelsestablished in this study as an aid with which to selectpictures that suit the contents of their texts. For example, theresults of the present study suggest that the impression ofcomfort for stone is more psychological, and those appear-ing more beautiful are felt to be more comfortable, whereasfor other material categories, comfort is mostly determinedby the predicted mechanical comfort in touch. Althoughthe present study does not address image features, if theyare incorporated into our hierarchical models, the sensoryand affective impressions of pictures, which are not usedfor training in the models, may be estimated. For example,low-level image features can be linked with personal traitsof picture preferences [26] and perceptual qualities of objectsurfaces [16].
2 MATERIALS AND METHODS
The study was approved by the institutional review boardof Toyohashi University of Technology.
2.1 Materials: Pictures of seven material categories
To investigate the relationships among sensory and affectiveresponses, one approach is to use a stimulus set, whereimage features pertaining to one type of sensory qualityis manipulated while controlling for the other parameters.However, there are no general methods to manipulateparameters corresponding to specific perceptual qualitiesfor natural images. Therefore, we used material picturesprovided by the Flickr Material Database (FMD) [27], for
JOURNAL OF LATEX CLASS FILES, VOL. 14, NO. 8, AUGUST 2019 3
Fabric Paper Leather Glass
Foliage Wood Stone
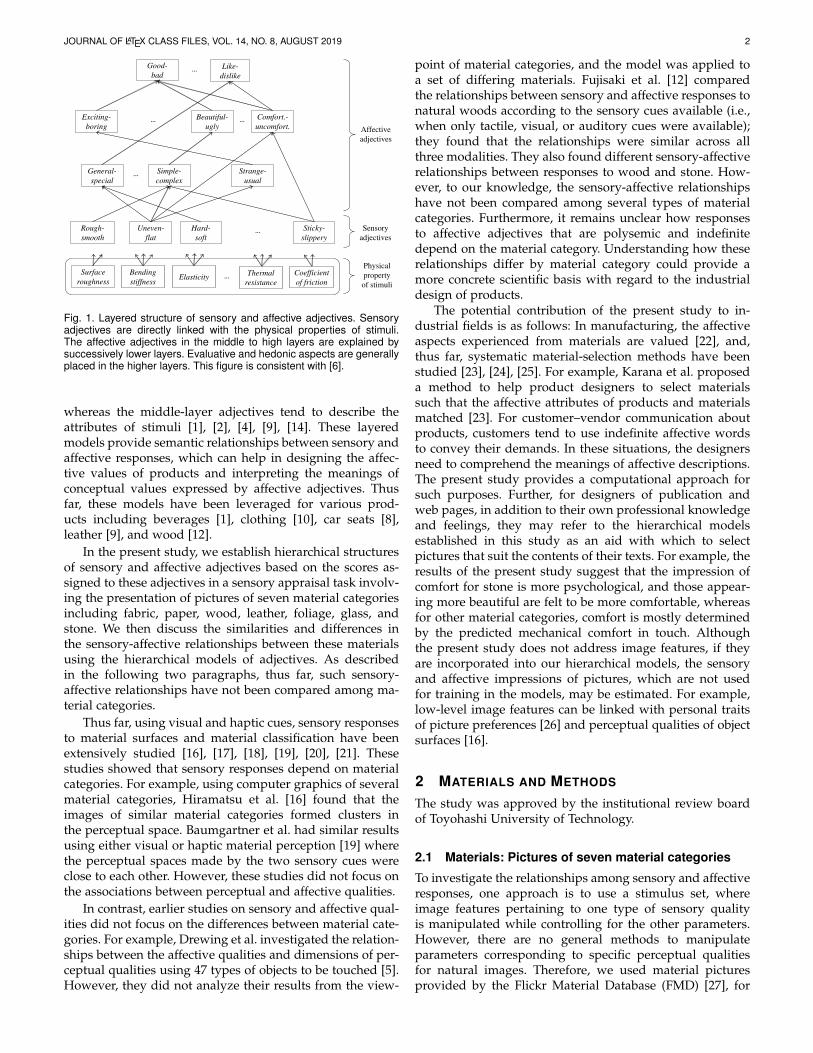
Fig. 2. Exemplar pictures of the seven materials categories. Thoseactually used in the experiments are not shown because of copyrightconcerns, but they can be seen on the Flickr Material Database [27]website.
which multiple perceptual and affective properties varysimultaneously among pictures. Because of the accessibilityof the database, we used image stimuli; nonetheless if thetask is extended to other cues, i.e., haptic sensations, thena certain level of consistency can be expected between theresults from visual and haptic tasks, although they may notfully agree with each other [18], [28]. Especially, perceivedweight [29] may substantially differ among the visual andhaptic cues.
We used only colored pictures because color is part ofthe properties of natural and artificial materials, whereasmonochrome and colored pictures were compared in somestudies [20], [30]. We selected pictures that focused merelyon the materials and that give no indication of the object.For example, some pictures were of glass cups, leatherbags, wooden eating utensils, etc.; we excluded these objectpictures. To retain a sufficient number of pictures (i.e., onehundred for each material category), we selected seven ma-terial categories: fabric, leather, foliage, glass, stone, paper,and wood1. The stone category did not include gems. Thesecategories are typically used in the studies of visual materialperception [16], [17], [18], [20], [21].
The material categories of the FMD pictures analyzedin the present study were easily identified with a successrate of 89% in our follow-up test, which involved sevenparticipants, different from those who participated in themain task2. This value is similar to the rate reported in[30] where 91% of close-up and object images were correctlyclassified.
As shown in supplementary materials (Figs. A–C), therandomness of these pictures is suggested by the histogramsof participants’ subjective answers of perceptual and affec-
1. To establish a database, we also used pictures of water, plastic,and metal. However, in the present study, we excluded these picturesfrom the analysis because the majority of pictures of metal and plasticmaterials contained objects or products such as eating utensils, machinetools, and coins for metal products, and did not focus on the surfaces.Pictures of water are largely snapshots taken during motions such asflowing, falling, and dripping water. To reflect their affective properties,we needed a set of adjectives different from those for other materialcategories.
2. We excluded object images; however, the material classificationrate was high. This is mainly because the tested images did not includeplastic materials which are generally confusing.
Opaque Transparent
…
Matte Glossy
Moist Dry
Modest Vivid
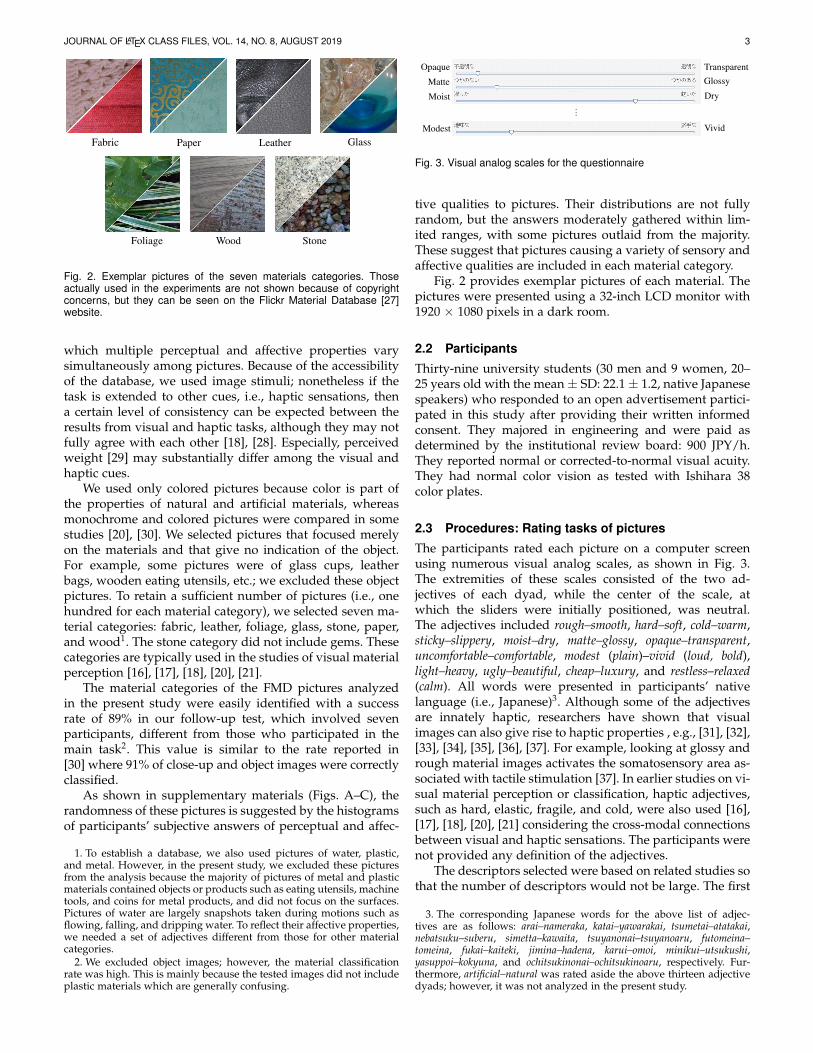
Fig. 3. Visual analog scales for the questionnaire
tive qualities to pictures. Their distributions are not fullyrandom, but the answers moderately gathered within lim-ited ranges, with some pictures outlaid from the majority.These suggest that pictures causing a variety of sensory andaffective qualities are included in each material category.
Fig. 2 provides exemplar pictures of each material. Thepictures were presented using a 32-inch LCD monitor with1920 × 1080 pixels in a dark room.
2.2 Participants
Thirty-nine university students (30 men and 9 women, 20–25 years old with the mean ± SD: 22.1 ± 1.2, native Japanesespeakers) who responded to an open advertisement partici-pated in this study after providing their written informedconsent. They majored in engineering and were paid asdetermined by the institutional review board: 900 JPY/h.They reported normal or corrected-to-normal visual acuity.They had normal color vision as tested with Ishihara 38color plates.
2.3 Procedures: Rating tasks of pictures
The participants rated each picture on a computer screenusing numerous visual analog scales, as shown in Fig. 3.The extremities of these scales consisted of the two ad-jectives of each dyad, while the center of the scale, atwhich the sliders were initially positioned, was neutral.The adjectives included rough–smooth, hard–soft, cold–warm,sticky–slippery, moist–dry, matte–glossy, opaque–transparent,uncomfortable–comfortable, modest (plain)–vivid (loud, bold),light–heavy, ugly–beautiful, cheap–luxury, and restless–relaxed(calm). All words were presented in participants’ nativelanguage (i.e., Japanese)3. Although some of the adjectivesare innately haptic, researchers have shown that visualimages can also give rise to haptic properties , e.g., [31], [32],[33], [34], [35], [36], [37]. For example, looking at glossy andrough material images activates the somatosensory area as-sociated with tactile stimulation [37]. In earlier studies on vi-sual material perception or classification, haptic adjectives,such as hard, elastic, fragile, and cold, were also used [16],[17], [18], [20], [21] considering the cross-modal connectionsbetween visual and haptic sensations. The participants werenot provided any definition of the adjectives.
The descriptors selected were based on related studies sothat the number of descriptors would not be large. The first
3. The corresponding Japanese words for the above list of adjec-tives are as follows: arai–nameraka, katai–yawarakai, tsumetai–atatakai,nebatsuku–suberu, simetta–kawaita, tsuyanonai–tsuyanoaru, futomeina–tomeina, fukai–kaiteki, jimina–hadena, karui–omoi, minikui–utsukushi,yasuppoi–kokyuna, and ochitsukinonai–ochitsukinoaru, respectively. Fur-thermore, artificial–natural was rated aside the above thirteen adjectivedyads; however, it was not analyzed in the present study.

JOURNAL OF LATEX CLASS FILES, VOL. 14, NO. 8, AUGUST 2019 4
seven adjective dyads are frequently used in the study ofmaterial perception by visual cues (e.g. [12], [17], [20]). Thelatter six dyads are used in the study of affective propertiesof materials (e.g. [7], [12], [14]). Nonetheless, the presentstudy does not aim to exhaustively cover various types ofaffective properties. It aims to demonstrate how middle andhigher levels of layered structures may differ among thedifferent types of materials.
For the appraisal of affective states of humans, non-verbal methods such as [38], [39] are also available. How-ever, both affective and sensory aspects are covered in thepresent study. Non-verbal approaches covering these twotypes of aspects do not exist, and we selected the methodbased on descriptors.
Each participant rated 368 randomly selected picturesand different image sets. They included nearly equal num-bers of pictures for each material category. On average,six or seven participants rated one picture. They took abreak between every session containing 46 pictures andcompleted their assignments over 2 to 3 days to preventstrain. Each session required approximately 30 min. In totalthe experiment took approximately 5 hours.
2.4 Data analysis: Computation of hierarchical causalstructure of sensory and affective responses
We used the method in [13] to compute the hierarchi-cal structure of affective and sensory adjective scores.This method is based on structural equation modeling(SEM) [40], [41], which is suitable for analyzing causalityamong multiple variables. As aforementioned in the intro-duction (second paragraph), the structure among the scoresof affective adjectives can be hypothesized and estimatedmore accurately in these models, than in two-layered mod-els. The hypothesized models are statistically validated, aswill be discussed below. Another merit of the method in[13] for the present study is that a multi-layered structureis established solely based on an adjective rating task andmathematical computation whereas other methods makeuse of, or require, experts’ knowledge or another task fordetermining the hierarchy of adjectives (see the secondparagraph in the introduction). In general, multiple modelscan statistically explain one observed dataset; however, themethod in [13] allows us to establish a concise model bysequentially improving on the simplistic two-layered model.That is, layers in the model with the lowest modelingaccuracy are continually developed until the entire structureis statistically acceptable.
The multi-layered modeling method in [13] yields astructure where sensory adjectives are placed at the bottomto explain the affective and evaluational adjectives in themiddle and higher layers as in Fig. 1.
The sensory responses were the following adjectives:rough–smooth, hard–soft, cold–warm, matte–glossy, opaque–transparent, sticky–slippery, and moist–dry. All the adjectivesare directly related to the physical properties of the materialsurfaces and can be largely judged or estimated by theirappearances. In terms of non-visual adjectives i.e. hard-soft,sticky-slippery, and cold-warm, according to [18], the ratingsin two tasks with either only haptic cues or visual cues,were highly correlated, suggesting that these non-visual
x
y z
w
��� ���
���
���
��
��
Correlation
Direct effect
Correlation
Estimation
error
w-z
Variable
Estimation
error
Fig. 4. Graphical expression of structural equation modeling. Unidirec-tional arcs and associated values are direct effects and their magni-tudes, respectively. The effect values can be either positive or negative.Nodes are the observed variables after normalization. e is the modelerror, independent of the other variables and has a mean of zero.
properties are haptic-related visual properties, and can bejudged visually.
The remaining six adjectives (modest–vivid, cheap–luxury,restless–relaxed, ugly–beautiful, uncomfortable–comfortable, andlight–heavy) were placed on the higher layers of the model.Light–heavy is a haptic sensation, and visual judgment of thisquality requires longer response times than does judgmentof other visual qualities, such as glossiness and rough-ness [21]. Further, light–heavy tends not to be included inrating tasks of perceptual qualities for visual images ofmaterials [17], [19], [20] because physical heaviness (i.e.,weight) is not judged solely from images of surface ma-terial. Hence, light–heavy was not included in the sensoryadjectives in the context of our visual task.
The layered structure created via SEM is graphicallyshown by using nodes and directed arcs in Fig. 4. The nodespresent the continuous variables after normalization (in thepresent study, the z-scores of the adjective scores), whilethe directed arcs indicate a direct effect from one variableto another. The strength of influence a is either positiveor negative. For example, the value of x is expressed as alinear summation of the effects of y, z, and model errorex (x = ayxy + azxz + ex). The error follows a randomdistribution and has a mean of zero. The influence values acorrespond to partial regression coefficients of the multivari-ate regression analysis. x is also used to explain a variable inthe higher layer (i.e., w). Bidirectional arcs indicate that twoconnected variables (in the figure, y and z) are significantlycorrelated.
SEM determines the coefficients and statistical signif-icance of the arcs in a layered structure, such that theobserved and estimated covariance matrices of the variablesresemble each other. To judge how accurately the hypoth-esized structure approximates the observed data, multipleindices of model fit are used [42], [43]. We used represen-tative indices of the similarity between the observed andestimated covariance matrices, including the goodness-of-fit index (GFI), comparative fit index (CFI), and χ2. TheGFI and CFI range from 0 to 1; for statistically valid mod-eling, they should be greater than 0.90–0.95 [44], with themaximum value of 1 indicating a complete match betweenthe two matrices. The χ2 value should, on the other hand, be

JOURNAL OF LATEX CLASS FILES, VOL. 14, NO. 8, AUGUST 2019 5
non-significant and small (i.e., the p value should be greaterthan 0.05), indicating that the two covariance matrices arenot statistically different.
As well as the statistical validity, the semantic validityof the established model is also important for SEM, whichwill be discussed in Secs. 4.1 and 4.2. The meanings of themodels are evaluated on the basis of common sense and theliterature available.
For each material category, we processed the adjectivescores as follows. First, we transformed the visual analoguescores for individual participants for each adjective into z-scores for each material category such that their mean andstandard deviation are 0 and 1, respectively. The value foreach adjective dyad was bipolar: for example, if the value forrough–smooth was negative, it meant that the participant hadrated the material picture as smoother than average in thematerial category. The z-scores were then averaged amongthe participants for each picture. We did not conduct anyoutlier tests for this calculation. The covariance matrix of thethirteen adjective dyads was then computed and used in theSEM. Sensory variables in the lower layer of the model wereallowed to correlate with each other due to the specificationsput in place. To conduct the SEM, we used the sem (version3.1) package for R.
3 RESULTS
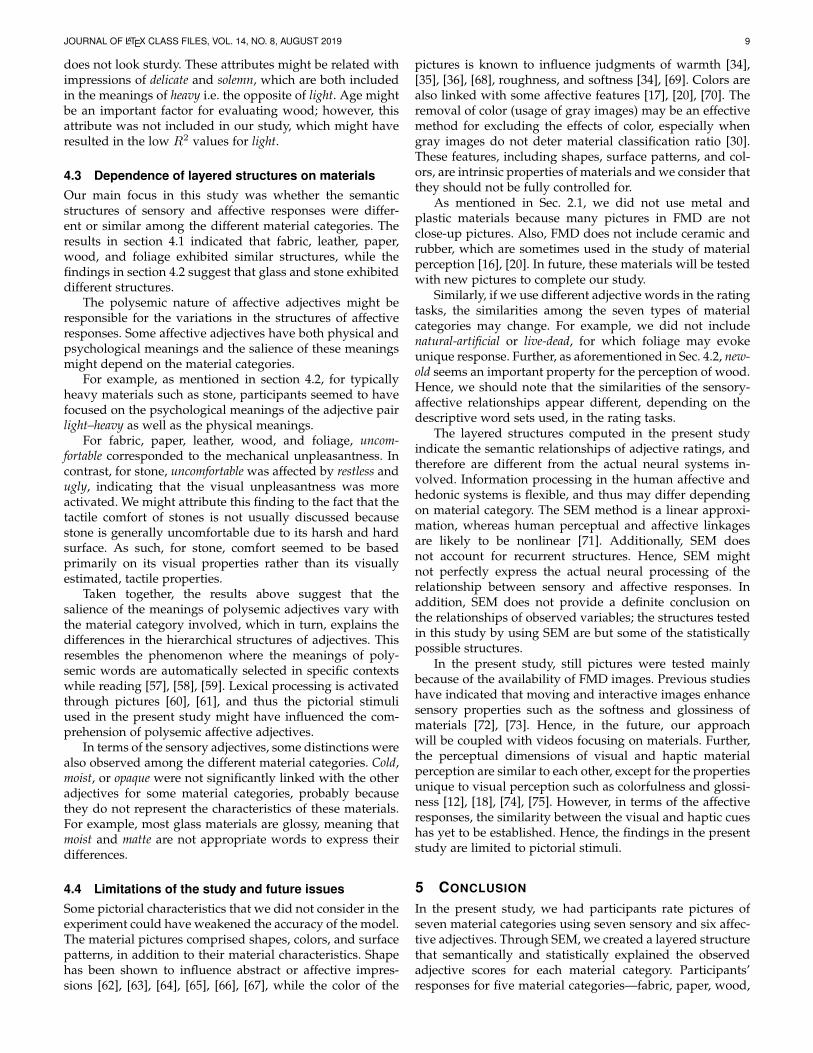
For all material categories, the layered structures were suc-cessfully computed with p values greater than 0.05, and theGFI and CFI values were mostly greater than 0.95. Fig. 5shows the layered structure of each material. All the unidi-rectional arcs are statistically significant (p < .05). For visualclarity, we do not show the correlations among the lower-layer sensory adjectives. Instead, they are summarized inTables 1–7 in the Appendix. The adjectives that are notlinked with the others are also not displayed. Further, wehave omitted the graphical description of the errors. Instead,we note the R2 value to indicate how accurately the value isestimated. R2 represents the square value of the correlationcoefficient between the observed and estimated values. Forthe same reason, each node displays only the adjective withthe positive value.
The materials showed several common features. First,the higher layers tended to include restless, modest, andcheap, while the middle layer contained light, ugly, anduncomfortable. For the majority of materials, hard, matte, andrough influenced light, modest, and ugly, respectively. Despitethese commonalities, the layered structures mostly differedaccording to the material category. For some materials, cold,opaque, and moist had no significant impact on higher-layeradjectives. For glass and stone, light was allocated to thehigher part of the structure, although it was just above thebottom perceptual layers for the other materials.
To investigate the similarities in participants’ responsesamong the materials, we calculated the distances betweeneach of two material categories by using the followingformula:
dab = tr[(Xa −Xb)T(Xa −Xb)] (1)
where Xa,b are the covariance matrices for materials a andb, which were in separate material categories (i.e., one of pa-
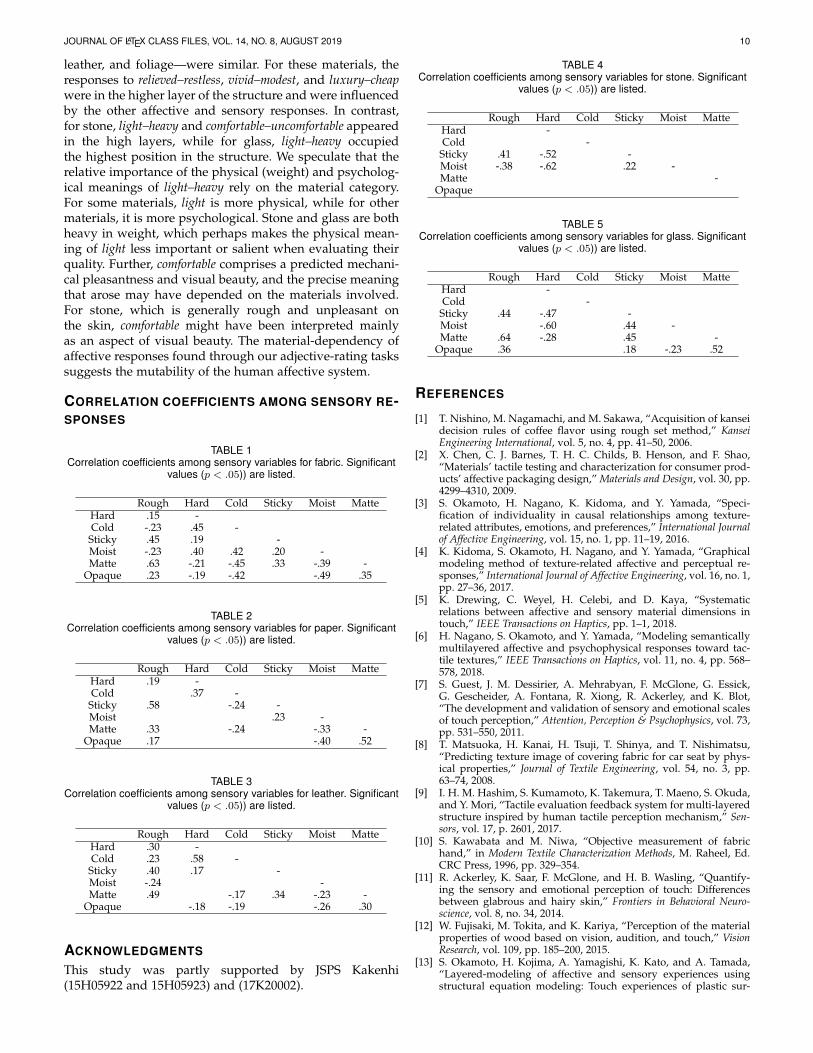
per, fabric, wood, leather, stone, glass, and foliage). This dis-tance corresponds to the dissimilarity between two covari-ance matrices that define the structure among the observedvariables (adjectives). With a greater distance value betweentwo material categories, their variable structures are moredifferent from each other. These distances were then usedto compute the multidimensional scales of the covariancematrices [45], [46]. The covariance matrices of the sevenmaterial categories were arranged on a one-dimensionalscale, with the stress value being 0.015. Their locations areshown in Fig. 6. Five material categories were closely placed,whereas glass and stone were at the two extremities. Thesepatterns indicated that participants’ responses were distinctfor glass and stone, whereas they were similar for the otherfive types of materials.
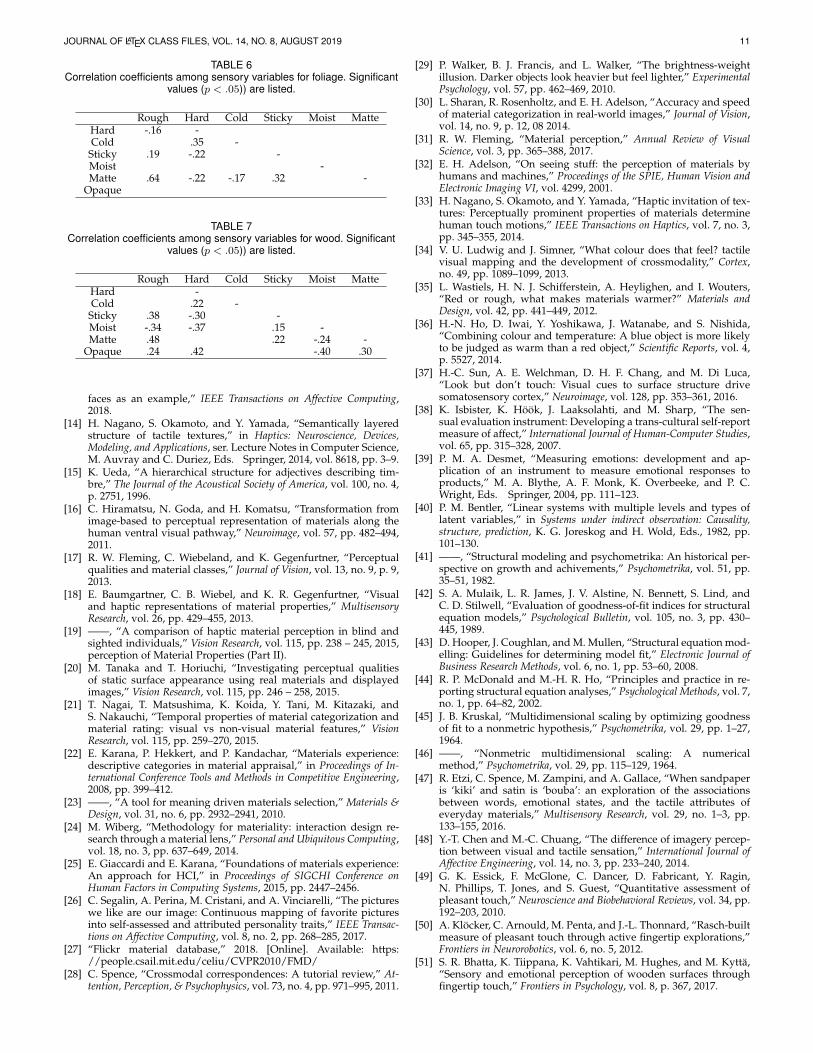
Further, to investigate how sensory and affective re-sponses varied among the material categories and pictures,we conducted a principal component analysis of the re-sponses to pictures of all material categories for each set ofthe sensory and affective adjectives. As shown in Fig. 7 (a),the sensory responses to glass were substantially differentfrom those of the other materials. In contrast, the responsesto paper, fabric, and leather exhibited some similaritiesthat is, they were closely located. The responses to stonetended to be dissimilar to those of the others, but slightlysimilar to the responses to wood. As shown in Fig. 7 (b),these trends were true for the affective responses as well.Thus, the sensory and affective responses depended on thematerial categories, although they naturally varied withineach category because of the variety of pictures.
4 DISCUSSION
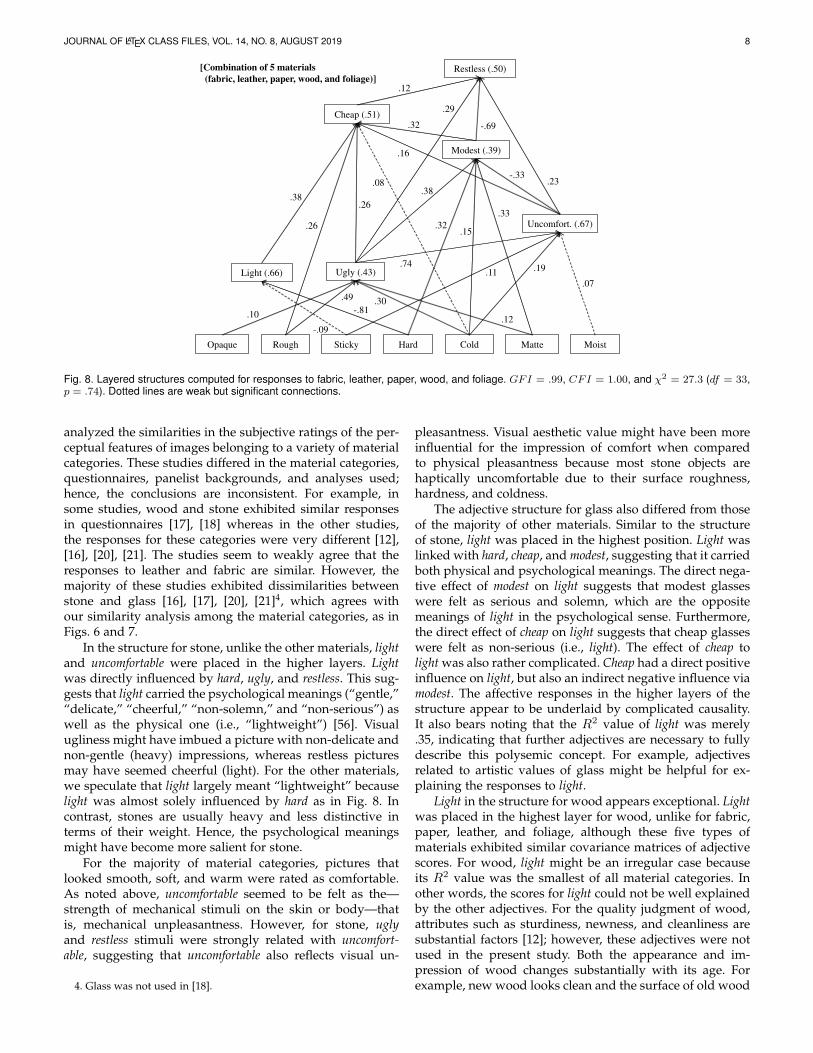
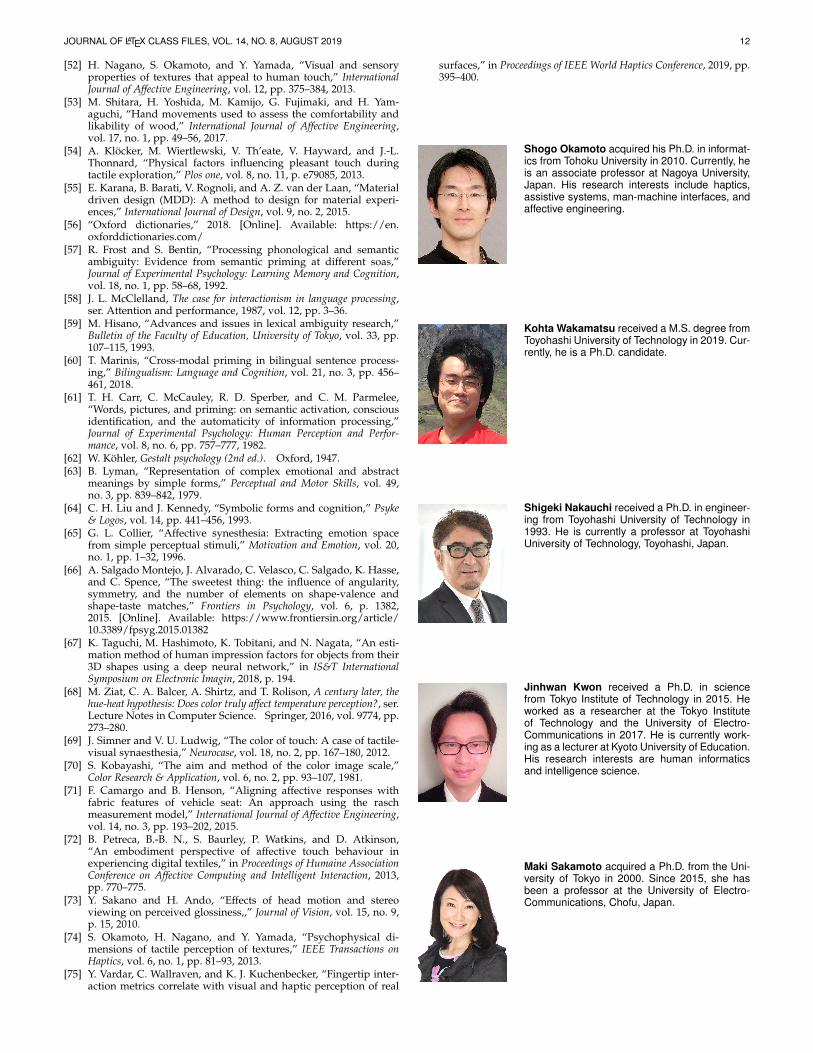
4.1 Commonalities of fabric, leather, paper, wood, andfoliageThe shared link for all types of materials was that betweenhard and light, with the other connections differing amongthe materials. Still, as shown in Fig. 6, we found similarquestionnaire results for fabric, leather, foliage, wood, andpaper, and their layered structures were also rather simi-lar. Note that these five types of material categories weregrouped into one, such that the following discussion is easy,and we do not conclude that they have the same variablestructures. Fig. 8 shows a structure computed based on thequestionnaire responses from these five material categories.This can be constructed as a common structure for thesematerial categories, and we discuss its characteristics andsemantic validity below.
Light and hard were strongly connected in a negativemanner. Light corresponded with weight, and the softer thesurfaces in the pictures appeared, the lighter the pictureswere scored. This is physically reasonable because soft ob-jects tend to be of low density and are expected to be lightin weight, which agrees with [12], [21]. They are, however,judged to be independent, depending on experimental con-texts [5].
Ugly was moderately connected with rough and cold.Rougher surfaces were tended to be judged as uglier, aswere pictures with high cold scores; this suggests that uglyrefers not only to the apparent beauty of an object butalso haptic aspects. Impressions of beauty and thermal cues

JOURNAL OF LATEX CLASS FILES, VOL. 14, NO. 8, AUGUST 2019 6
Rough
Uncomfort. (.70)
Hard Cold
Modest (.71)
Matte
Light (.43) Ugly (.38)
Cheap (.56)Restless (.36)
��� � .96,
�� � 1.00,
�� � 23.9
��� � 24,
� � .47�
Sticky
[Foliage]
.15 .16
-.13
.73
-.33
.48
.47
-.55
-.61.17
-.37.28.58 .22
.16
.17
.29
.42.40
-.20
.55
[Paper]
��� � .95,
�� � 1.00,
�� � 37.5
��� � 38,
� � .49�
Rough
Uncomfort. (.43)
Hard Cold
Modest (.32)
Moist
Light (.42)
Ugly (.56)
Cheap (.42)
Restless (.53)
StickyOpaque
.30.45
.30
.18
.37
.35
-.63
.15
.17
.62.20
.21 .25
.37
.15
-.73
.29
.29
-.14
Rough
Uncomfort. (.43)
[Glass]
HardCold
Modest (.39)
Light (.35)
Ugly (.71)
Cheap (.40)
Restless (.25)
��� � .95,
�� � 1.00,
�� � 34.6
��� � 44, � � .84�
StickyOpaque
.31 .28.30
.25
.24
-.63
-.54
.16
-.16
.84
.63
.14
.48
Rough
Uncomfort. (.65)
[Wood]
Hard Cold Moist
Modest (.36)
Matte
Light (.27)
Ugly (.43)
Cheap (.42)
Restless (.42) ��� � .97,
�� � 1.00��
�� � 24.1
��� � 37, � � .95�
StickyOpaque
.22
.14
.69
.28
.39
.22
-.47
-.19
.50 .18 .35 .19
.37
.17
.31 -.19
.28 -.38
.25
Rough
Uncomfort. (.64)
Hard Moist
Modest (.45)
Matte
Light (.42)
Ugly (.52)
Cheap (.43) Restless (.45)
��� � .95,
�� � 1.00,
�� � 30.0
��� � 28,
� � 0.36�
Sticky
.69
.20
.27
.48 -.36
-.57
-.25
.22
.45.42
.16
.33.18
.29
-.47
-.19
.34
[Stone]
Rough
Uncomfort. (.47)
Hard
.41.20
Moist
.24
Modest (.39)
-.17
Matte
.39Light (.48)
-.69
Ugly (.73)
Cheap (.38)
.62
Restless (.45)
GFI = .94,
CFI = .99,
�� � 35.5
��� � 46�
� � .26�
-.48
.59
.35
.38.60
.50
[Fabric]
Rough
Uncomfort. (.68)
[Leather]
Hard Cold Moist
Modest (.36)
Matte
Light (.45)
Ugly (.45)
Cheap (.55)
Restless (.67)
��� � .96,
�� � 1.00,
�� � 29.5
��� � 33, � � .64�
StickyOpaque
.17.29
.71
.34
-.41
.26
.92
-.87
-.42
.12
.25
-.25
.19.24
.34 .23
.14
.20
-.39
.33
.34
.16
.45
-.13
-.46
Fig. 5. Layered structure of affective and sensory responses to each of the seven types of materials. The adjectives that are not linked with anyothers are not shown. Values associated with the links are the strength of influences. Values in parentheses are R2 values. df means the degreeof freedom of the model.

JOURNAL OF LATEX CLASS FILES, VOL. 14, NO. 8, AUGUST 2019 7
GlassStone
FoliageFabric
PaperLeather
0 .5-.5
0
.5
-.5
Cold
1.0Hard
Rough
Matte
Opaque
Sticky Moist
GlassWood
0 .5-.5
0
-.5
1st principal component (Sensory) [47%] 1st principal component (Sensory) [47%]
3rd
pri
nci
pal
co
mp
on
ent
(Sen
sory
) [1
1%
]
2n
d p
rin
cipal
co
mp
on
ent
(Sen
sory
) [2
7%
]Rough
Matte
MoistSticky
Cold
HardOpaque
Wood
PaperLeather
FabricStone
(a) Sensory responses
Foliage
Glass
Fabric
Foliage
WoodStone
Paper
Leather
0 .5-.5
0
.5
1st principal component (Affective) [43%]
2n
d p
rin
cipal
co
mp
on
ent
(Aff
ecti
ve)
[2
5%
]
Uncomfortable
Modest
Light
UglyCheap
Restless
0 .5-.5
1st principal component (Affective) [43%]
0
.5
3rd
pri
nci
pal
co
mp
on
ent
(Aff
ecti
ve)
[2
0%
]
Glass
LeatherStone
Uncomfortable
Modest
Light
Ugly
-.5
Cheap
Restless
PaperFoliage
(b) Affective responses
FabricWood
Fig. 7. Materials plotted on the reduced principal-component space. Dots and ellipsoids are the centroids and standard deviations among thepictures, respectively. The values in brackets are the contribution ratios of the principal components.
Glass Stone
Fabric
Leather
Paper
Wood
Foliage
0 20-20
Distance between covariance matrices (a.u.)
Fig. 6. Loci of the material categories on a distance scale of theircovariance matrices.
are known to be synesthetic in the haptic perception ofmaterials [47] whereas it is not clear whether this findingfits into the present visual task. Furthermore, a study onvisual impression of furniture reported the relationshipsamong ugly, rough, modest, and uncomfortable [48], which iscomparable with the relationships in Fig. 8.
Uncomfortable was influenced by sticky, cold, and ugly,which in turn were influenced by rough, cold, and matte.These connections suggest that uncomfortable largely corre-sponded to the mechanical unpleasantness of touch [12],[49], [50], [51], [52], [53], [54], and that pictures that appearedto stimulate the skin were judged as unpleasant.
Cheap was directly explained by ugly, uncomfortable, mod-est, light, and rough, which are reasonable features for low-price surfaces. For example, woods that appeared light andmodest were judged to be cheap [12].
Restless is a complex characteristic comprising visualbeauty (ugly) and mechanical comfort (uncomfortable), whichmeans that relaxed (i.e., relieved) experiences are achievedby visually beautiful and mechanically comfortable stimuli.Even when using visual or tactile cues only, feelings of relief(or relaxation) and comfort are strongly correlated [5], [12],[47].
We speculate that modest is conceptually similar to re-lieved (the opposite of restless) because of their strong associ-ation. In other words, modest pictures tend to be perceivedas relieving as well. Modest is directly linked with matte andhard and indirectly with opaque by way of ugly, which isconsistent with [55].
All these connections are reasonable and indicate that theaffective and evaluative relationships of the pictorial stimuliwere reasonably captured.
4.2 Distinctive characteristics of stone and glassAs shown in Fig. 6, the covariance matrices of stone andglass were substantially different from those of the othermaterials used in our study. Thus far, several studies have
JOURNAL OF LATEX CLASS FILES, VOL. 14, NO. 8, AUGUST 2019 8
Rough
Uncomfort. (.67)
[Combination of 5 materials
(fabric, leather, paper, wood, and foliage)]
Hard Cold Moist
Modest (.39)
Matte
Light (.66) Ugly (.43)
Cheap (.51)
Restless (.50)
StickyOpaque
.19.11
.07
.74
.32.15
.33
.38
-.33
-.81
-.09
.49 .30
.12.10
.26
.08
.38
.16
.26
.32
.12
.23
-.69
.29
Fig. 8. Layered structures computed for responses to fabric, leather, paper, wood, and foliage. GFI = .99, CFI = 1.00, and χ2 = 27.3 (df = 33,p = .74). Dotted lines are weak but significant connections.
analyzed the similarities in the subjective ratings of the per-ceptual features of images belonging to a variety of materialcategories. These studies differed in the material categories,questionnaires, panelist backgrounds, and analyses used;hence, the conclusions are inconsistent. For example, insome studies, wood and stone exhibited similar responsesin questionnaires [17], [18] whereas in the other studies,the responses for these categories were very different [12],[16], [20], [21]. The studies seem to weakly agree that theresponses to leather and fabric are similar. However, themajority of these studies exhibited dissimilarities betweenstone and glass [16], [17], [20], [21]4, which agrees withour similarity analysis among the material categories, as inFigs. 6 and 7.
In the structure for stone, unlike the other materials, lightand uncomfortable were placed in the higher layers. Lightwas directly influenced by hard, ugly, and restless. This sug-gests that light carried the psychological meanings (“gentle,”“delicate,” “cheerful,” “non-solemn,” and “non-serious”) aswell as the physical one (i.e., “lightweight”) [56]. Visualugliness might have imbued a picture with non-delicate andnon-gentle (heavy) impressions, whereas restless picturesmay have seemed cheerful (light). For the other materials,we speculate that light largely meant “lightweight” becauselight was almost solely influenced by hard as in Fig. 8. Incontrast, stones are usually heavy and less distinctive interms of their weight. Hence, the psychological meaningsmight have become more salient for stone.
For the majority of material categories, pictures thatlooked smooth, soft, and warm were rated as comfortable.As noted above, uncomfortable seemed to be felt as the—strength of mechanical stimuli on the skin or body—thatis, mechanical unpleasantness. However, for stone, uglyand restless stimuli were strongly related with uncomfort-able, suggesting that uncomfortable also reflects visual un-
4. Glass was not used in [18].
pleasantness. Visual aesthetic value might have been moreinfluential for the impression of comfort when comparedto physical pleasantness because most stone objects arehaptically uncomfortable due to their surface roughness,hardness, and coldness.
The adjective structure for glass also differed from thoseof the majority of other materials. Similar to the structureof stone, light was placed in the highest position. Light waslinked with hard, cheap, and modest, suggesting that it carriedboth physical and psychological meanings. The direct nega-tive effect of modest on light suggests that modest glasseswere felt as serious and solemn, which are the oppositemeanings of light in the psychological sense. Furthermore,the direct effect of cheap on light suggests that cheap glasseswere felt as non-serious (i.e., light). The effect of cheap tolight was also rather complicated. Cheap had a direct positiveinfluence on light, but also an indirect negative influence viamodest. The affective responses in the higher layers of thestructure appear to be underlaid by complicated causality.It also bears noting that the R2 value of light was merely.35, indicating that further adjectives are necessary to fullydescribe this polysemic concept. For example, adjectivesrelated to artistic values of glass might be helpful for ex-plaining the responses to light.
Light in the structure for wood appears exceptional. Lightwas placed in the highest layer for wood, unlike for fabric,paper, leather, and foliage, although these five types ofmaterials exhibited similar covariance matrices of adjectivescores. For wood, light might be an irregular case becauseits R2 value was the smallest of all material categories. Inother words, the scores for light could not be well explainedby the other adjectives. For the quality judgment of wood,attributes such as sturdiness, newness, and cleanliness aresubstantial factors [12]; however, these adjectives were notused in the present study. Both the appearance and im-pression of wood changes substantially with its age. Forexample, new wood looks clean and the surface of old wood
JOURNAL OF LATEX CLASS FILES, VOL. 14, NO. 8, AUGUST 2019 9
does not look sturdy. These attributes might be related withimpressions of delicate and solemn, which are both includedin the meanings of heavy i.e. the opposite of light. Age mightbe an important factor for evaluating wood; however, thisattribute was not included in our study, which might haveresulted in the low R2 values for light.
4.3 Dependence of layered structures on materialsOur main focus in this study was whether the semanticstructures of sensory and affective responses were differ-ent or similar among the different material categories. Theresults in section 4.1 indicated that fabric, leather, paper,wood, and foliage exhibited similar structures, while thefindings in section 4.2 suggest that glass and stone exhibiteddifferent structures.
The polysemic nature of affective adjectives might beresponsible for the variations in the structures of affectiveresponses. Some affective adjectives have both physical andpsychological meanings and the salience of these meaningsmight depend on the material categories.
For example, as mentioned in section 4.2, for typicallyheavy materials such as stone, participants seemed to havefocused on the psychological meanings of the adjective pairlight–heavy as well as the physical meanings.
For fabric, paper, leather, wood, and foliage, uncom-fortable corresponded to the mechanical unpleasantness. Incontrast, for stone, uncomfortable was affected by restless andugly, indicating that the visual unpleasantness was moreactivated. We might attribute this finding to the fact that thetactile comfort of stones is not usually discussed becausestone is generally uncomfortable due to its harsh and hardsurface. As such, for stone, comfort seemed to be basedprimarily on its visual properties rather than its visuallyestimated, tactile properties.
Taken together, the results above suggest that thesalience of the meanings of polysemic adjectives vary withthe material category involved, which in turn, explains thedifferences in the hierarchical structures of adjectives. Thisresembles the phenomenon where the meanings of poly-semic words are automatically selected in specific contextswhile reading [57], [58], [59]. Lexical processing is activatedthrough pictures [60], [61], and thus the pictorial stimuliused in the present study might have influenced the com-prehension of polysemic affective adjectives.
In terms of the sensory adjectives, some distinctions werealso observed among the different material categories. Cold,moist, or opaque were not significantly linked with the otheradjectives for some material categories, probably becausethey do not represent the characteristics of these materials.For example, most glass materials are glossy, meaning thatmoist and matte are not appropriate words to express theirdifferences.
4.4 Limitations of the study and future issuesSome pictorial characteristics that we did not consider in theexperiment could have weakened the accuracy of the model.The material pictures comprised shapes, colors, and surfacepatterns, in addition to their material characteristics. Shapehas been shown to influence abstract or affective impres-sions [62], [63], [64], [65], [66], [67], while the color of the
pictures is known to influence judgments of warmth [34],[35], [36], [68], roughness, and softness [34], [69]. Colors arealso linked with some affective features [17], [20], [70]. Theremoval of color (usage of gray images) may be an effectivemethod for excluding the effects of color, especially whengray images do not deter material classification ratio [30].These features, including shapes, surface patterns, and col-ors, are intrinsic properties of materials and we consider thatthey should not be fully controlled for.
As mentioned in Sec. 2.1, we did not use metal andplastic materials because many pictures in FMD are notclose-up pictures. Also, FMD does not include ceramic andrubber, which are sometimes used in the study of materialperception [16], [20]. In future, these materials will be testedwith new pictures to complete our study.
Similarly, if we use different adjective words in the ratingtasks, the similarities among the seven types of materialcategories may change. For example, we did not includenatural-artificial or live-dead, for which foliage may evokeunique response. Further, as aforementioned in Sec. 4.2, new-old seems an important property for the perception of wood.Hence, we should note that the similarities of the sensory-affective relationships appear different, depending on thedescriptive word sets used, in the rating tasks.
The layered structures computed in the present studyindicate the semantic relationships of adjective ratings, andtherefore are different from the actual neural systems in-volved. Information processing in the human affective andhedonic systems is flexible, and thus may differ dependingon material category. The SEM method is a linear approxi-mation, whereas human perceptual and affective linkagesare likely to be nonlinear [71]. Additionally, SEM doesnot account for recurrent structures. Hence, SEM mightnot perfectly express the actual neural processing of therelationship between sensory and affective responses. Inaddition, SEM does not provide a definite conclusion onthe relationships of observed variables; the structures testedin this study by using SEM are but some of the statisticallypossible structures.
In the present study, still pictures were tested mainlybecause of the availability of FMD images. Previous studieshave indicated that moving and interactive images enhancesensory properties such as the softness and glossiness ofmaterials [72], [73]. Hence, in the future, our approachwill be coupled with videos focusing on materials. Further,the perceptual dimensions of visual and haptic materialperception are similar to each other, except for the propertiesunique to visual perception such as colorfulness and glossi-ness [12], [18], [74], [75]. However, in terms of the affectiveresponses, the similarity between the visual and haptic cueshas yet to be established. Hence, the findings in the presentstudy are limited to pictorial stimuli.
5 CONCLUSION
In the present study, we had participants rate pictures ofseven material categories using seven sensory and six affec-tive adjectives. Through SEM, we created a layered structurethat semantically and statistically explained the observedadjective scores for each material category. Participants’responses for five material categories—fabric, paper, wood,
JOURNAL OF LATEX CLASS FILES, VOL. 14, NO. 8, AUGUST 2019 10
leather, and foliage—were similar. For these materials, theresponses to relieved–restless, vivid–modest, and luxury–cheapwere in the higher layer of the structure and were influencedby the other affective and sensory responses. In contrast,for stone, light–heavy and comfortable–uncomfortable appearedin the high layers, while for glass, light–heavy occupiedthe highest position in the structure. We speculate that therelative importance of the physical (weight) and psycholog-ical meanings of light–heavy rely on the material category.For some materials, light is more physical, while for othermaterials, it is more psychological. Stone and glass are bothheavy in weight, which perhaps makes the physical mean-ing of light less important or salient when evaluating theirquality. Further, comfortable comprises a predicted mechani-cal pleasantness and visual beauty, and the precise meaningthat arose may have depended on the materials involved.For stone, which is generally rough and unpleasant onthe skin, comfortable might have been interpreted mainlyas an aspect of visual beauty. The material-dependency ofaffective responses found through our adjective-rating taskssuggests the mutability of the human affective system.
CORRELATION COEFFICIENTS AMONG SENSORY RE-SPONSES
TABLE 1Correlation coefficients among sensory variables for fabric. Significant
values (p < .05)) are listed.
Rough Hard Cold Sticky Moist MatteHard .15 -Cold -.23 .45 -
Sticky .45 .19 -Moist -.23 .40 .42 .20 -Matte .63 -.21 -.45 .33 -.39 -
Opaque .23 -.19 -.42 -.49 .35
TABLE 2Correlation coefficients among sensory variables for paper. Significant
values (p < .05)) are listed.
Rough Hard Cold Sticky Moist MatteHard .19 -Cold .37 -
Sticky .58 -.24 -Moist .23 -Matte .33 -.24 -.33 -
Opaque .17 -.40 .52
TABLE 3Correlation coefficients among sensory variables for leather. Significant
values (p < .05)) are listed.
Rough Hard Cold Sticky Moist MatteHard .30 -Cold .23 .58 -
Sticky .40 .17 -Moist -.24 -Matte .49 -.17 .34 -.23 -
Opaque -.18 -.19 -.26 .30
ACKNOWLEDGMENTS
This study was partly supported by JSPS Kakenhi(15H05922 and 15H05923) and (17K20002).
TABLE 4Correlation coefficients among sensory variables for stone. Significant
values (p < .05)) are listed.
Rough Hard Cold Sticky Moist MatteHard -Cold -
Sticky .41 -.52 -Moist -.38 -.62 .22 -Matte -
Opaque
TABLE 5Correlation coefficients among sensory variables for glass. Significant
values (p < .05)) are listed.
Rough Hard Cold Sticky Moist MatteHard -Cold -
Sticky .44 -.47 -Moist -.60 .44 -Matte .64 -.28 .45 -
Opaque .36 .18 -.23 .52
REFERENCES
[1] T. Nishino, M. Nagamachi, and M. Sakawa, “Acquisition of kanseidecision rules of coffee flavor using rough set method,” KanseiEngineering International, vol. 5, no. 4, pp. 41–50, 2006.
[2] X. Chen, C. J. Barnes, T. H. C. Childs, B. Henson, and F. Shao,“Materials’ tactile testing and characterization for consumer prod-ucts’ affective packaging design,” Materials and Design, vol. 30, pp.4299–4310, 2009.
[3] S. Okamoto, H. Nagano, K. Kidoma, and Y. Yamada, “Speci-fication of individuality in causal relationships among texture-related attributes, emotions, and preferences,” International Journalof Affective Engineering, vol. 15, no. 1, pp. 11–19, 2016.
[4] K. Kidoma, S. Okamoto, H. Nagano, and Y. Yamada, “Graphicalmodeling method of texture-related affective and perceptual re-sponses,” International Journal of Affective Engineering, vol. 16, no. 1,pp. 27–36, 2017.
[5] K. Drewing, C. Weyel, H. Celebi, and D. Kaya, “Systematicrelations between affective and sensory material dimensions intouch,” IEEE Transactions on Haptics, pp. 1–1, 2018.
[6] H. Nagano, S. Okamoto, and Y. Yamada, “Modeling semanticallymultilayered affective and psychophysical responses toward tac-tile textures,” IEEE Transactions on Haptics, vol. 11, no. 4, pp. 568–578, 2018.
[7] S. Guest, J. M. Dessirier, A. Mehrabyan, F. McGlone, G. Essick,G. Gescheider, A. Fontana, R. Xiong, R. Ackerley, and K. Blot,“The development and validation of sensory and emotional scalesof touch perception,” Attention, Perception & Psychophysics, vol. 73,pp. 531–550, 2011.
[8] T. Matsuoka, H. Kanai, H. Tsuji, T. Shinya, and T. Nishimatsu,“Predicting texture image of covering fabric for car seat by phys-ical properties,” Journal of Textile Engineering, vol. 54, no. 3, pp.63–74, 2008.
[9] I. H. M. Hashim, S. Kumamoto, K. Takemura, T. Maeno, S. Okuda,and Y. Mori, “Tactile evaluation feedback system for multi-layeredstructure inspired by human tactile perception mechanism,” Sen-sors, vol. 17, p. 2601, 2017.
[10] S. Kawabata and M. Niwa, “Objective measurement of fabrichand,” in Modern Textile Characterization Methods, M. Raheel, Ed.CRC Press, 1996, pp. 329–354.
[11] R. Ackerley, K. Saar, F. McGlone, and H. B. Wasling, “Quantify-ing the sensory and emotional perception of touch: Differencesbetween glabrous and hairy skin,” Frontiers in Behavioral Neuro-science, vol. 8, no. 34, 2014.
[12] W. Fujisaki, M. Tokita, and K. Kariya, “Perception of the materialproperties of wood based on vision, audition, and touch,” VisionResearch, vol. 109, pp. 185–200, 2015.
[13] S. Okamoto, H. Kojima, A. Yamagishi, K. Kato, and A. Tamada,“Layered-modeling of affective and sensory experiences usingstructural equation modeling: Touch experiences of plastic sur-
JOURNAL OF LATEX CLASS FILES, VOL. 14, NO. 8, AUGUST 2019 11
TABLE 6Correlation coefficients among sensory variables for foliage. Significant
values (p < .05)) are listed.
Rough Hard Cold Sticky Moist MatteHard -.16 -Cold .35 -
Sticky .19 -.22 -Moist -Matte .64 -.22 -.17 .32 -
Opaque
TABLE 7Correlation coefficients among sensory variables for wood. Significant
values (p < .05)) are listed.
Rough Hard Cold Sticky Moist MatteHard -Cold .22 -
Sticky .38 -.30 -Moist -.34 -.37 .15 -Matte .48 .22 -.24 -
Opaque .24 .42 -.40 .30
faces as an example,” IEEE Transactions on Affective Computing,2018.
[14] H. Nagano, S. Okamoto, and Y. Yamada, “Semantically layeredstructure of tactile textures,” in Haptics: Neuroscience, Devices,Modeling, and Applications, ser. Lecture Notes in Computer Science,M. Auvray and C. Duriez, Eds. Springer, 2014, vol. 8618, pp. 3–9.
[15] K. Ueda, “A hierarchical structure for adjectives describing tim-bre,” The Journal of the Acoustical Society of America, vol. 100, no. 4,p. 2751, 1996.
[16] C. Hiramatsu, N. Goda, and H. Komatsu, “Transformation fromimage-based to perceptual representation of materials along thehuman ventral visual pathway,” Neuroimage, vol. 57, pp. 482–494,2011.
[17] R. W. Fleming, C. Wiebeland, and K. Gegenfurtner, “Perceptualqualities and material classes,” Journal of Vision, vol. 13, no. 9, p. 9,2013.
[18] E. Baumgartner, C. B. Wiebel, and K. R. Gegenfurtner, “Visualand haptic representations of material properties,” MultisensoryResearch, vol. 26, pp. 429–455, 2013.
[19] ——, “A comparison of haptic material perception in blind andsighted individuals,” Vision Research, vol. 115, pp. 238 – 245, 2015,perception of Material Properties (Part II).
[20] M. Tanaka and T. Horiuchi, “Investigating perceptual qualitiesof static surface appearance using real materials and displayedimages,” Vision Research, vol. 115, pp. 246 – 258, 2015.
[21] T. Nagai, T. Matsushima, K. Koida, Y. Tani, M. Kitazaki, andS. Nakauchi, “Temporal properties of material categorization andmaterial rating: visual vs non-visual material features,” VisionResearch, vol. 115, pp. 259–270, 2015.
[22] E. Karana, P. Hekkert, and P. Kandachar, “Materials experience:descriptive categories in material appraisal,” in Proceedings of In-ternational Conference Tools and Methods in Competitive Engineering,2008, pp. 399–412.
[23] ——, “A tool for meaning driven materials selection,” Materials &Design, vol. 31, no. 6, pp. 2932–2941, 2010.
[24] M. Wiberg, “Methodology for materiality: interaction design re-search through a material lens,” Personal and Ubiquitous Computing,vol. 18, no. 3, pp. 637–649, 2014.
[25] E. Giaccardi and E. Karana, “Foundations of materials experience:An approach for HCI,” in Proceedings of SIGCHI Conference onHuman Factors in Computing Systems, 2015, pp. 2447–2456.
[26] C. Segalin, A. Perina, M. Cristani, and A. Vinciarelli, “The pictureswe like are our image: Continuous mapping of favorite picturesinto self-assessed and attributed personality traits,” IEEE Transac-tions on Affective Computing, vol. 8, no. 2, pp. 268–285, 2017.
[27] “Flickr material database,” 2018. [Online]. Available: https://people.csail.mit.edu/celiu/CVPR2010/FMD/
[28] C. Spence, “Crossmodal correspondences: A tutorial review,” At-tention, Perception, & Psychophysics, vol. 73, no. 4, pp. 971–995, 2011.
[29] P. Walker, B. J. Francis, and L. Walker, “The brightness-weightillusion. Darker objects look heavier but feel lighter,” ExperimentalPsychology, vol. 57, pp. 462–469, 2010.
[30] L. Sharan, R. Rosenholtz, and E. H. Adelson, “Accuracy and speedof material categorization in real-world images,” Journal of Vision,vol. 14, no. 9, p. 12, 08 2014.
[31] R. W. Fleming, “Material perception,” Annual Review of VisualScience, vol. 3, pp. 365–388, 2017.
[32] E. H. Adelson, “On seeing stuff: the perception of materials byhumans and machines,” Proceedings of the SPIE, Human Vision andElectronic Imaging VI, vol. 4299, 2001.
[33] H. Nagano, S. Okamoto, and Y. Yamada, “Haptic invitation of tex-tures: Perceptually prominent properties of materials determinehuman touch motions,” IEEE Transactions on Haptics, vol. 7, no. 3,pp. 345–355, 2014.
[34] V. U. Ludwig and J. Simner, “What colour does that feel? tactilevisual mapping and the development of crossmodality,” Cortex,no. 49, pp. 1089–1099, 2013.
[35] L. Wastiels, H. N. J. Schifferstein, A. Heylighen, and I. Wouters,“Red or rough, what makes materials warmer?” Materials andDesign, vol. 42, pp. 441–449, 2012.
[36] H.-N. Ho, D. Iwai, Y. Yoshikawa, J. Watanabe, and S. Nishida,“Combining colour and temperature: A blue object is more likelyto be judged as warm than a red object,” Scientific Reports, vol. 4,p. 5527, 2014.
[37] H.-C. Sun, A. E. Welchman, D. H. F. Chang, and M. Di Luca,“Look but don’t touch: Visual cues to surface structure drivesomatosensory cortex,” Neuroimage, vol. 128, pp. 353–361, 2016.
[38] K. Isbister, K. Hook, J. Laaksolahti, and M. Sharp, “The sen-sual evaluation instrument: Developing a trans-cultural self-reportmeasure of affect,” International Journal of Human-Computer Studies,vol. 65, pp. 315–328, 2007.
[39] P. M. A. Desmet, “Measuring emotions: development and ap-plication of an instrument to measure emotional responses toproducts,” M. A. Blythe, A. F. Monk, K. Overbeeke, and P. C.Wright, Eds. Springer, 2004, pp. 111–123.
[40] P. M. Bentler, “Linear systems with multiple levels and types oflatent variables,” in Systems under indirect observation: Causality,structure, prediction, K. G. Joreskog and H. Wold, Eds., 1982, pp.101–130.
[41] ——, “Structural modeling and psychometrika: An historical per-spective on growth and achivements,” Psychometrika, vol. 51, pp.35–51, 1982.
[42] S. A. Mulaik, L. R. James, J. V. Alstine, N. Bennett, S. Lind, andC. D. Stilwell, “Evaluation of goodness-of-fit indices for structuralequation models,” Psychological Bulletin, vol. 105, no. 3, pp. 430–445, 1989.
[43] D. Hooper, J. Coughlan, and M. Mullen, “Structural equation mod-elling: Guidelines for determining model fit,” Electronic Journal ofBusiness Research Methods, vol. 6, no. 1, pp. 53–60, 2008.
[44] R. P. McDonald and M.-H. R. Ho, “Principles and practice in re-porting structural equation analyses,” Psychological Methods, vol. 7,no. 1, pp. 64–82, 2002.
[45] J. B. Kruskal, “Multidimensional scaling by optimizing goodnessof fit to a nonmetric hypothesis,” Psychometrika, vol. 29, pp. 1–27,1964.
[46] ——, “Nonmetric multidimensional scaling: A numericalmethod,” Psychometrika, vol. 29, pp. 115–129, 1964.
[47] R. Etzi, C. Spence, M. Zampini, and A. Gallace, “When sandpaperis ‘kiki’ and satin is ‘bouba’: an exploration of the associationsbetween words, emotional states, and the tactile attributes ofeveryday materials,” Multisensory Research, vol. 29, no. 1–3, pp.133–155, 2016.
[48] Y.-T. Chen and M.-C. Chuang, “The difference of imagery percep-tion between visual and tactile sensation,” International Journal ofAffective Engineering, vol. 14, no. 3, pp. 233–240, 2014.
[49] G. K. Essick, F. McGlone, C. Dancer, D. Fabricant, Y. Ragin,N. Phillips, T. Jones, and S. Guest, “Quantitative assessment ofpleasant touch,” Neuroscience and Biobehavioral Reviews, vol. 34, pp.192–203, 2010.
[50] A. Klocker, C. Arnould, M. Penta, and J.-L. Thonnard, “Rasch-builtmeasure of pleasant touch through active fingertip explorations,”Frontiers in Neurorobotics, vol. 6, no. 5, 2012.
[51] S. R. Bhatta, K. Tiippana, K. Vahtikari, M. Hughes, and M. Kytta,“Sensory and emotional perception of wooden surfaces throughfingertip touch,” Frontiers in Psychology, vol. 8, p. 367, 2017.
JOURNAL OF LATEX CLASS FILES, VOL. 14, NO. 8, AUGUST 2019 12
[52] H. Nagano, S. Okamoto, and Y. Yamada, “Visual and sensoryproperties of textures that appeal to human touch,” InternationalJournal of Affective Engineering, vol. 12, pp. 375–384, 2013.
[53] M. Shitara, H. Yoshida, M. Kamijo, G. Fujimaki, and H. Yam-aguchi, “Hand movements used to assess the comfortability andlikability of wood,” International Journal of Affective Engineering,vol. 17, no. 1, pp. 49–56, 2017.
[54] A. Klocker, M. Wiertlewski, V. Th’eate, V. Hayward, and J.-L.Thonnard, “Physical factors influencing pleasant touch duringtactile exploration,” Plos one, vol. 8, no. 11, p. e79085, 2013.
[55] E. Karana, B. Barati, V. Rognoli, and A. Z. van der Laan, “Materialdriven design (MDD): A method to design for material experi-ences,” International Journal of Design, vol. 9, no. 2, 2015.
[56] “Oxford dictionaries,” 2018. [Online]. Available: https://en.oxforddictionaries.com/
[57] R. Frost and S. Bentin, “Processing phonological and semanticambiguity: Evidence from semantic priming at different soas,”Journal of Experimental Psychology: Learning Memory and Cognition,vol. 18, no. 1, pp. 58–68, 1992.
[58] J. L. McClelland, The case for interactionism in language processing,ser. Attention and performance, 1987, vol. 12, pp. 3–36.
[59] M. Hisano, “Advances and issues in lexical ambiguity research,”Bulletin of the Faculty of Education, University of Tokyo, vol. 33, pp.107–115, 1993.
[60] T. Marinis, “Cross-modal priming in bilingual sentence process-ing,” Bilingualism: Language and Cognition, vol. 21, no. 3, pp. 456–461, 2018.
[61] T. H. Carr, C. McCauley, R. D. Sperber, and C. M. Parmelee,“Words, pictures, and priming: on semantic activation, consciousidentification, and the automaticity of information processing,”Journal of Experimental Psychology: Human Perception and Perfor-mance, vol. 8, no. 6, pp. 757–777, 1982.
[62] W. Kohler, Gestalt psychology (2nd ed.). Oxford, 1947.[63] B. Lyman, “Representation of complex emotional and abstract
meanings by simple forms,” Perceptual and Motor Skills, vol. 49,no. 3, pp. 839–842, 1979.
[64] C. H. Liu and J. Kennedy, “Symbolic forms and cognition,” Psyke& Logos, vol. 14, pp. 441–456, 1993.
[65] G. L. Collier, “Affective synesthesia: Extracting emotion spacefrom simple perceptual stimuli,” Motivation and Emotion, vol. 20,no. 1, pp. 1–32, 1996.
[66] A. Salgado Montejo, J. Alvarado, C. Velasco, C. Salgado, K. Hasse,and C. Spence, “The sweetest thing: the influence of angularity,symmetry, and the number of elements on shape-valence andshape-taste matches,” Frontiers in Psychology, vol. 6, p. 1382,2015. [Online]. Available: https://www.frontiersin.org/article/10.3389/fpsyg.2015.01382
[67] K. Taguchi, M. Hashimoto, K. Tobitani, and N. Nagata, “An esti-mation method of human impression factors for objects from their3D shapes using a deep neural network,” in IS&T InternationalSymposium on Electronic Imagin, 2018, p. 194.
[68] M. Ziat, C. A. Balcer, A. Shirtz, and T. Rolison, A century later, thehue-heat hypothesis: Does color truly affect temperature perception?, ser.Lecture Notes in Computer Science. Springer, 2016, vol. 9774, pp.273–280.
[69] J. Simner and V. U. Ludwig, “The color of touch: A case of tactile-visual synaesthesia,” Neurocase, vol. 18, no. 2, pp. 167–180, 2012.
[70] S. Kobayashi, “The aim and method of the color image scale,”Color Research & Application, vol. 6, no. 2, pp. 93–107, 1981.
[71] F. Camargo and B. Henson, “Aligning affective responses withfabric features of vehicle seat: An approach using the raschmeasurement model,” International Journal of Affective Engineering,vol. 14, no. 3, pp. 193–202, 2015.
[72] B. Petreca, B.-B. N., S. Baurley, P. Watkins, and D. Atkinson,“An embodiment perspective of affective touch behaviour inexperiencing digital textiles,” in Proceedings of Humaine AssociationConference on Affective Computing and Intelligent Interaction, 2013,pp. 770–775.
[73] Y. Sakano and H. Ando, “Effects of head motion and stereoviewing on perceived glossiness,,” Journal of Vision, vol. 15, no. 9,p. 15, 2010.
[74] S. Okamoto, H. Nagano, and Y. Yamada, “Psychophysical di-mensions of tactile perception of textures,” IEEE Transactions onHaptics, vol. 6, no. 1, pp. 81–93, 2013.
[75] Y. Vardar, C. Wallraven, and K. J. Kuchenbecker, “Fingertip inter-action metrics correlate with visual and haptic perception of real
surfaces,” in Proceedings of IEEE World Haptics Conference, 2019, pp.395–400.
Shogo Okamoto acquired his Ph.D. in informat-ics from Tohoku University in 2010. Currently, heis an associate professor at Nagoya University,Japan. His research interests include haptics,assistive systems, man-machine interfaces, andaffective engineering.
Kohta Wakamatsu received a M.S. degree fromToyohashi University of Technology in 2019. Cur-rently, he is a Ph.D. candidate.
Shigeki Nakauchi received a Ph.D. in engineer-ing from Toyohashi University of Technology in1993. He is currently a professor at ToyohashiUniversity of Technology, Toyohashi, Japan.
Jinhwan Kwon received a Ph.D. in sciencefrom Tokyo Institute of Technology in 2015. Heworked as a researcher at the Tokyo Instituteof Technology and the University of Electro-Communications in 2017. He is currently work-ing as a lecturer at Kyoto University of Education.His research interests are human informaticsand intelligence science.
Maki Sakamoto acquired a Ph.D. from the Uni-versity of Tokyo in 2000. Since 2015, she hasbeen a professor at the University of Electro-Communications, Chofu, Japan.